Article

Seasonal Changes in Phosphorus in Soils and Vegetation of Vegetated Filter Strips in Cold Climate Agricultural Systems

1
Natural Resources and Environmental Studies Program, University of Northern British Columbia, Prince George, BC V2N 4Z9, Canada
2
Department of Geography, Earth and Environmental Sciences, University of Northern British Columbia, Prince George, BC V2N 4Z9, Canada
3
Department of Soil Science, University of Manitoba, Winnipeg, MB R3T 2N2, Canada
4
Agriculture and Agri-Food Canada, Morden, MB R6M 1Y5, Canada
*
Author to whom correspondence should be addressed.
Agriculture 2022, 12(2), 233; https://doi.org/10.3390/agriculture12020233
Submission received: 13 December 2021 / Revised: 26 January 2022 / Accepted: 4 February 2022 / Published: 6 February 2022
(This article belongs to the Special Issue Optimizing Nutrient Management in Cold Climate Agroecosystems)

Abstract

:
Vegetated filter strips (VFS) are a best management practice, designed to reduce sediment and nutrient runoff to surface waters in agricultural landscapes. In cold climates, phosphorus (P) can be released from VFS vegetation when it undergoes freeze–thaw cycles, making their utility in these regions an area needing further study. Research in Manitoba, Canada, investigated temporal changes in soil P concentrations and potential P loss from VFS from 2015 to 2017. Soil, harvestable vegetation, and residue samples were collected within VFS and control strips, and soils were analysed for Olsen P and Total P (TP). Harvestable vegetation and residue samples were analysed for TP. Results showed increases in Olsen P each spring and reductions each fall in soils at all sites. There was substantial loss of TP from the harvestable vegetation samples at all sites from November 2016 to May 2017, but residues in the VFS and control sites had a lower loss of TP over the same period. Vegetation was shown to release P over the winter into surface soils, and harvestable vegetation released significantly more P than residue, potentially leading to P loss from soils through surface runoff or leaching. Thus, harvesting vegetation may be a suitable VFS management strategy in cold climates.

1. Introduction

In landscapes dominated by agriculture, the application of phosphorus (P) fertilizers is common. While P is necessary for plant growth and health, if applied in excess of what can be taken up by vegetation, it will accumulate in soils and can be transported to surface waters (e.g., rivers and lakes), in both particulate and dissolved forms, through erosion, leaching, and runoff [1]. In regions where the sorption capacity of soils is low, or in fine-textured soils with macropores, P stored in the soil can also be transported to the subsurface and potentially reach groundwaters [2,3]. This transport of excess P from soil to water is problematic, because orthophosphate, when used by plants and microbes, can cause eutrophication of freshwater ecosystems, and, in some cases, cause toxic algal blooms. Thus, reducing P transport from fields to both groundwaters and surface waters is an area of significant research, much of which focuses on the use of agricultural best management practices such as conservation tillage [4,5], constructed wetlands [6,7], and, the focus of this research, vegetated filter strips (VFS) [8,9].
While numerous studies have shown that VFS are generally effective at reducing P transport to surface waters in temperate climates [10,11], a review of the research on both managed (i.e., harvesting and removing vegetation, mowing vegetation, grazing) and unmanaged VFS in cold climates found that the results are more mixed when determining their effectiveness at reducing P and, more specifically, dissolved P [12]. This is because in cold climates (i.e., regions with extended periods below 0 °C) the vegetation is covered by ice and snow for long portions of the year and is dormant during the spring snowmelt (Supplementary Figure S1), which in many cold climates is the period during which most runoff occurs [13,14]. For example, in the Canadian Prairies, Habibiandehkordi et al. [15] found that VFS were ineffective in reducing P in surface runoff during the snowmelt period, which the authors attributed to concentrated surface flows that did not allow the VFS to function as they are designed (i.e., trapping, uptake by vegetation). Additionally, work undertaken concurrently to the work described below found that during the spring, the VFS had minimal effect on Total P (TP) concentrations measured in the surface water in downstream channels [16]. Furthermore, vegetation and soils in filter strips that have undergone freezing and thawing can become a source of P under certain conditions [17].
Ice crystal formation can occur in vegetation when it freezes, causing cells in the shoots to lyse and to draw water from nearby cells [18,19]. When this happens, the water movement between cells can release P from biomass and into runoff [20]. Previous laboratory experiments exposing various species of vegetation and residues common in the Canadian Prairies to freezing and thawing showed that the potential for P loss from vegetation sources is substantial, though concentrations across species and environmental conditions vary significantly [17,20]. The P that is released from vegetation and residues is in a bioavailable form, (i.e., orthophosphate), and though soil has a high capacity for sorbing phosphate ions and removing them from solution, much of this P would likely be contained within the soluble pool or in the reactive pool. This is particularly true in areas where soils are not P depleted based on soil P tests. As noted by Kleinman et al. [21], while soil can act as a sink for P, it is not an infinite sink, and as P accumulates, the concentration of P in solution increases. This is of particular concern during major runoff events, when P is mobilized through erosion to surface waters and, along with previously unavailable forms of P (i.e., organic, particulate P), are transformed into orthophosphate.
Additionally, there is a strong relationship between soils that are high in organic matter and microbial biomass P [22], which can have an impact on soluble P loss potential. While other soil and environmental conditions influence the microbial turnover of P, previous work has shown that the buildup of organic matter and microbial P turnover in riparian buffer strips could lead to increases of inorganic P solubility [23]. Therefore, one aim of this study was to further investigate the potential for P release into surface soils, from both whole vegetation and residues in commonly grown VFS species and crops in a field setting, under natural conditions. As noted by Haygarth et al. [24], there can be a disconnect across disciplines studying issues associated with P transport, and, thus, by combining the analysis from the soil P data and vegetation P data, we aimed to provide a better and more holistic understanding of the P dynamics in VFS in cold climate agricultural systems.
The issues associated with P release from vegetation to soils and surface waters can be exacerbated in regions such as the Canadian Prairies and the USA that undergo prolonged periods of freezing temperatures, but this problem has the potential to be addressed if VFS are strategically managed, such as by harvesting and removing vegetation. Thus, the primary objective of this research was to determine the impact of harvesting VFS biomass in cold climates by measuring P concentrations in soil and vegetation over a multi-year period. More specifically, we (i) compared soil P concentrations seasonally at VFS sites that were managed through harvesting with soil P concentrations in control (cropped) strips, and (ii) compared TP concentrations in VFS and control strip vegetation in fall and spring to determine potential P loss from whole vegetation and crop residues.

2. Materials and Methods
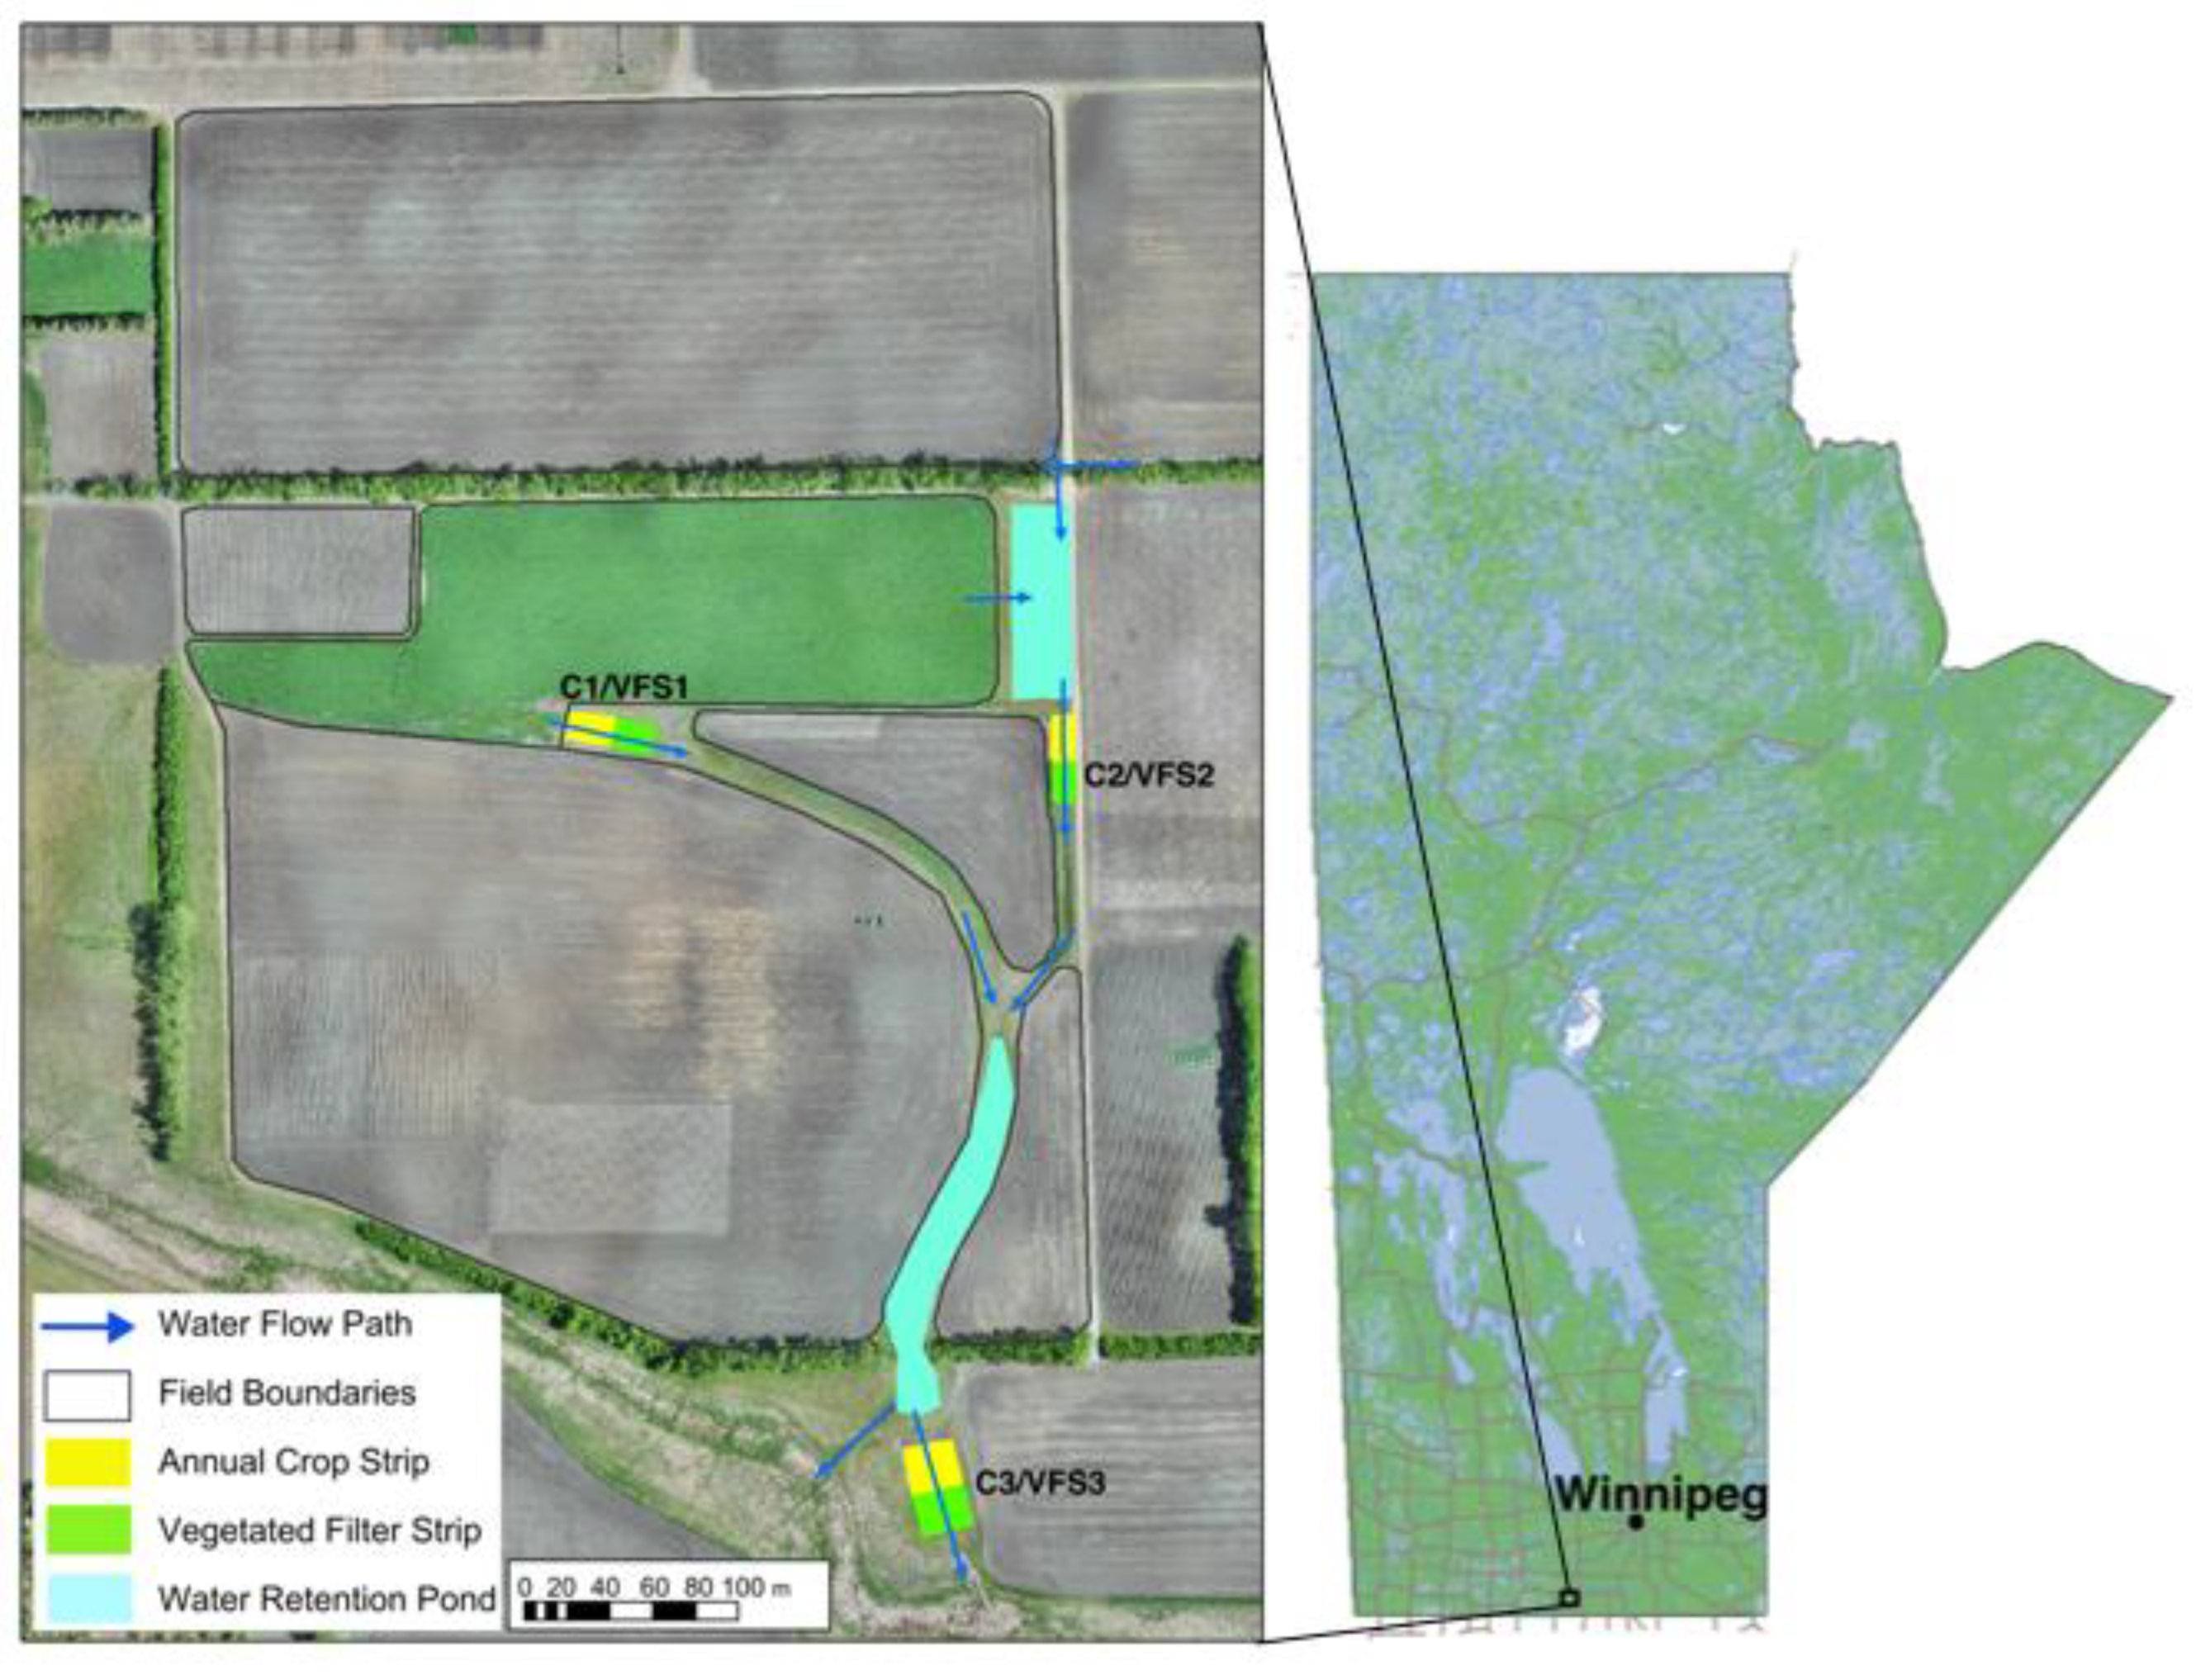
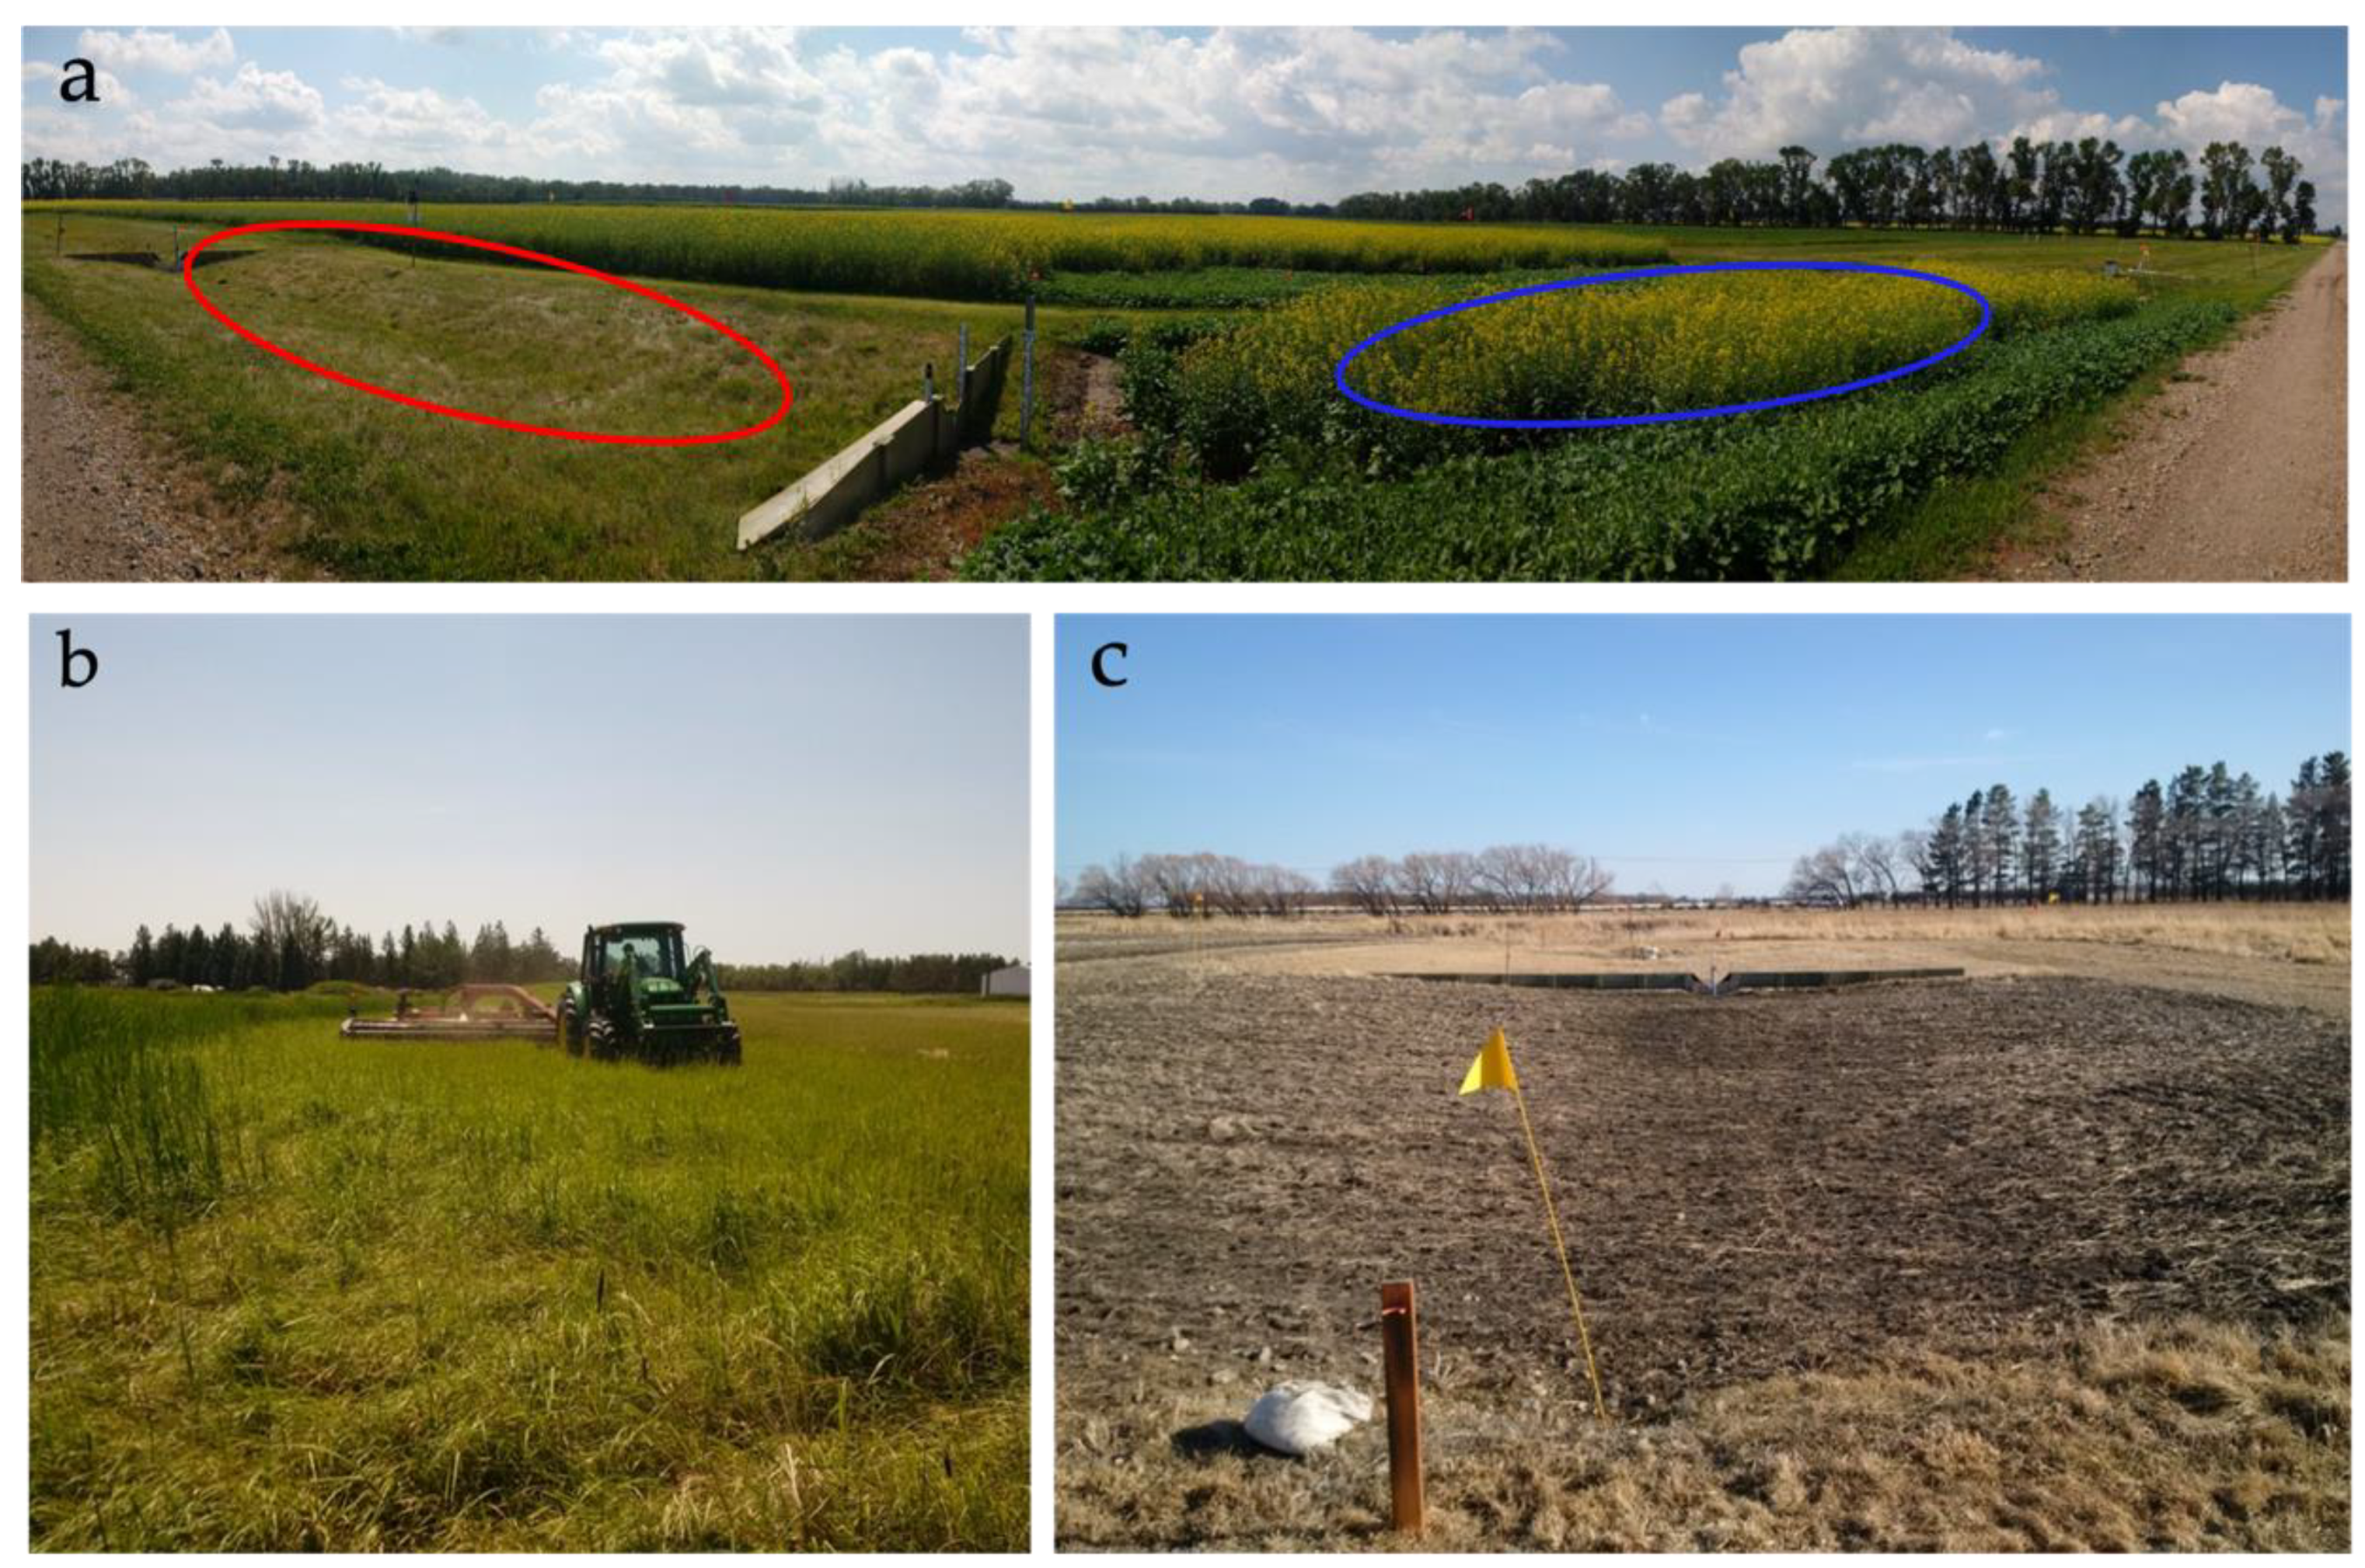
2.1. Study Location

This study was undertaken in a 20-ha research plot within the 260-ha Agriculture and Agri-Food Canada (AAFC) Cereal Research Centre in Morden, Manitoba, which is part of the Red River Basin, approximately 95 km southwest of Winnipeg, Manitoba (Figure 1). This is an area of low relief, where land use is dominated by an annual crop production that is mainly cereals, but also includes oilseed and pulses [16], and that does not contain subsurface tile drainage. Soils within the research area vary from silty loam to fine sand, and in the top 15 cm of soil, mean pH was 7.8 ± 0.34 and mean organic matter content was 3.5 ± 0.65%. The VFS sites were primarily characterized as moderately coarse fluvial and lacustrine soils, from the Hochfeld, Chortiz, Graysville, and Neuenberg soil series [25].
In May 2015, the three research sites, which consisted of newly planted VFS and control strips, were established and had ample vegetation growth by July 2015. Two of the sites were located downstream from seasonal retention ponds, and the third site was located at the edge of a field, where natural field drainage began. Seasonal retention ponds were constructed concurrently with the planting of the VFS to assist with control of the timing and quantity of surface runoff delivered to the VFS and control strips, particularly given previous drought conditions. In other words, the ponds helped to ensure that these two sites received runoff during surface water field experiments, the results of which can be found in Vanrobaeys et al. [16].
Both the VFS and control strips were approximately 15 m wide and 20 m long, parallel to the direction of flow. All of the VFS sites were planted with a mix of forbs and tall and short grass species in spring 2015 and were not reseeded throughout the duration of the study. In the mid-slope section of the VFS, the dominant species were foxtail barley (Hordeum jubatum L.), alkali grass (Puccinellia spp.), and sheep fescue (Festuca ovina L.). In the lower zone of the VFS, the dominant species were meadow foxtail (Alopecurus pratensis L.), reed canary grass (Phalaris arundinacea L.), and cattails (Typha spp.). Control strips were located directly upstream from the VFS and in 2016, C1 and C2 were seeded with canola (Brassica napus L.), while C3 was seeded with soybeans (Glycine max (L.) Merr.). In 2017, all of the control strips were seeded with spring wheat (Triticum aestivum L.). The catchment area for VFS1/C1 was 3 ha, for VFS2/C2 9 ha, and for VFS3/C3 20 ha. Adjacent to the paired VFS and control strips were cropped fields that were managed identically to the control strips. Thus, the control strips were tilled, treated with fertilizer, managed for pests, and harvested, leaving 5 cm of stubble, in the same way as the adjacent field crops. In the fall, fertilizer was broadcast and incorporated in the field crops and control strips, and in the spring the fields were harrowed once the conditions were dry, typically in early May. Fertilizer was applied at a rate of 25 lb. P2O5 ac−1 in 2015, 10 lb. P2O5 ac−1 in 2016, and 20 lb. P2O5 ac−1 in 2017. This followed recommendations by Flaten and Grant [26] for short term sufficiency in growing spring wheat, canola, and soybeans, the crops that were planted throughout the duration of this study, and were based on soil test Olsen P concentrations. The VFS were unmanaged after their establishment, except for the fall harvest, which occurred in September 2015 and September 2016. The timing and methods used for harvesting the VFS and control strips are described in more detail in Section 2.4 and Table 1. For more information on this study area, including site conditions, site layout, and vegetation management, see Vanrobaeys et al. [16].

2.2. Climate Conditions

The average annual temperature at the Morden Research Centre is 4 °C, and average annual precipitation is a mix of rain (426.5 mm) and snow (115.6 cm). Accumulation of snow typically begins in November and ends in March or April [27]. The timing of vegetation sampling was based on the occurrence of the first killing freeze of the season, defined in this study as the date when temperatures were below −2.3 °C (28 °F). In 2015, a temperature of −5.2 °C was recorded on October 17, and in 2016, a temperature of −2.7 °C was recorded on October 12. The average temperature in 2015 (5.65 °C) was above average, though rainfall (347.7 mm) and snowfall (63.5 cm) were below average. In 2016, average temperature was 5.9 °C, snowfall was 108.7 cm, and rainfall was 540.9 mm [27]. From fall 2015 to fall 2016, there was a total of eight events where runoff occurred through all of the VFS and control strips, and four where water being held in the retention ponds was released, which would impact sites VFS2/C2 and VFS3/C3. No data were collected on runoff events after the 2017 snowmelt.

2.3. Soil Sampling

Soil samples (n = 120) were collected in the spring and fall each year from May 2015 to May 2017 to capture seasonal and annual changes in VFS and control strip soils. In May 2015, a randomized grid of the entire 20 ha field site was sampled (n = 45), and these samples were collected at the same time as the initial establishment of the VFS sites and control (crop) strips. Since the May 2015 samples were collected without established VFS, all sites from this sampling period are considered control sites for statistical analysis. All sampling after May 2015 (i.e., October 2015 to May 2017) was undertaken more intensively within the newly created VFS sites and their respective control strips, in order to gain a more detailed understanding of P concentrations within the VFS and control strip sites, rather than the entire 20 ha field site. Samples consisted of a composite of five sub-samples at three locations (upper, middle, and lower) along the hydraulic gradient of both the VFS and control strips and were collected using a JMC Backsaver Hand Soil Sampler (Clements Associates Inc., Newton, IA, USA). Samples were collected to a depth of 0–15 cm and were well mixed and stored at 4 °C before being delivered to the laboratory for analysis within one week of collection.

2.4. Vegetation Sampling

In September 2015 and March 2016, whole vegetation samples, consisting of all the aboveground biomass above 15 cm, were collected from the VFS sites, and in September 2016 both the control sites and VFS were sampled (n = 47). This portion of biomass (i.e., above 15 cm) was chosen because it equates to what would be harvested with commercial farm equipment. All samples were harvested by hand clipping vegetation with grass shears, and, thus, we subsequently refer to this as the ‘harvestable vegetation’. The rest of the harvestable vegetation (i.e., the vegetation that was not analyzed) was removed using commercial farm equipment (Figure 2b) at the same time as the sampling was undertaken and was immediately removed from the landscape in both 2015 and 2016. In November 2016 and May 2017, sampling consisted of collecting the vegetative residue (Figure 2a) that remained after harvest in both the VFS sites and the control strips (n = 36). Soil was removed from the residue manually, in order to avoid contamination of the vegetation samples. There was some vegetative regrowth at the VFS sites in May 2017, which was included in the samples at those sites, and the implications of this are discussed later. Residue samples were collected by clipping all remaining aboveground plant material down to the soil surface. The sampling sites were different between sampling seasons (i.e., not returning to the same quadrats in spring that were sampled in the fall).
All samples (i.e., aboveground harvestable vegetation and residue) were collected within a 0.50 m by 0.50 m quadrat (0.25 m2), at locations selected at random within the VFS and control strips, in order to quantify biomass and TP by area (Supplementary Figure S2). For all sites, samples of harvestable vegetation and residue were collected in triplicate (i.e., three quadrats), and the materials collected from each quadrat were placed into a large plastic bin and homogenized by thoroughly mixing the fresh vegetation, after which their fresh weight was recorded on the day of collection. Due to inadvertent harvesting of the VFS sites in October 2015 by AAFC staff, triplicate samples could not be collected within the VFS sites due to a lack of remaining material and therefore, only one sample of harvestable vegetation was collected at VFS1 and VFS2 in March 2016. There was not enough vegetation left in VFS3 for a sample to be collected in March 2016. Table 1 describes when, and how many, samples of soils and vegetation were collected for the duration of the study.

2.5. Soil Analysis

Prior to analysis, soil samples were dried at 40 °C, ground with a Dynocrush DC-5 hammer mill (Custom Laboratory Equipment Inc, Holden, MO, USA), and then sieved through 2-mm mesh. All samples were analysed for Olsen P by mixing 50 mL of 0.5 M NaHCO3 into 2.5 g of soil. This solution was shaken for 30 min at room temperature, filtered using Whatman #40 filter papers, and, after a reduction by ascorbic acid and complexation with ammonium molybdate, measured by automated colorimetry. Olsen P (mg kg−1) was measured by automated segmented flow colorimetry using a SAN ++ system (Skalar, Breda, The Netherlands). TP was measured by digesting 1 g of dried, ground soil with microwave assistance in 10 mL of concentrated nitric acid. The digested material was diluted with ultrapure water and was analyzed using ICP-OES (Thermo Electron iCAP 6300, Cambridge, UK). Soil organic matter content (% OM) was determined by ashing dried samples for 2 h at 375 °C, and pH was determined by an electrode after adding 25 g of soil sample to 50 mL of deionized water and shaking for 30 min at room temperature.

2.6. Vegetation Analysis

Fresh vegetation samples (both harvestable vegetation and residues) were placed in a drying oven at 40 °C for 48 h and their dry weight was recorded before being sent to Farmers Edge Laboratories (Winnipeg, MB, Canada) for analysis of TP. The dried samples were ground and 1 g of sample was digested in 10 mL of concentrated nitric acid by microwave digestion. Following digestion, samples were diluted with ultrapure water before analysis by ICP-OES (Thermo Electron iCAP 6300, Cambridge, UK). Results from the TP analysis are reported on a dry weight basis.

2.7. Statistical Analysis

All statistical analyses were undertaken using R v. 3.4.3 [28] through R Studio [29], and figures were created using the R package ggplot2 [30]. Concentrations of Olsen P and TP in soils and TP in vegetation from the three filter strips and three control strips were checked for normality using the Shapiro–Wilk test. The assumption of normality was not met, and thus, the Kruskal–Wallis H test was used to determine the differences between individual VFS and control sites, the differences between sampling dates, and their potential interaction (p < 0.05). When there were significant differences between explanatory variables, the Dunn post hoc test was conducted to determine the significant differences between sites over time. In order to account for sampling at the same locations over multiple time periods with non-parametric data, the Friedman test was used, which was followed by a pairwise Wilcoxon rank test. The Wilcoxon rank test is used when there is one explanatory variable and two nominal variables and as a post hoc test for the Friedman test. Thus, it was used in this work when comparing concentrations in paired control and VFS sites (i.e., C1 vs. VFS1), across multiple dates.

3. Results

3.1. Soil Phosphorus

3.1.1. Soluble Phosphorus in Soils

There were significant differences (p < 0.05) in P concentrations when comparing within group sites (i.e., VFS1 vs. VFS2, C1 vs. C2 etc.) and therefore, samples across the control and VFS strips were not combined for Olsen P and TP analysis. As shown in Figure 3, Olsen P concentrations at C1 and VFS1 were significantly higher (p < 0.05) than concentrations at all other sites across the entire study period but were not significantly different from each other across dates (p > 0.05). The optimum range for Olsen P in the Northern Great Plains for crop yield and for maintaining P fertility through fertilization and crop removal is 10–20 mg kg−1 [26], and the only site that had mean Olsen P concentrations within this range for all sampling periods was C2 (10.8 ± 4.6 mg kg−1), while VFS1 (37.0 ± 7.9 mg kg−1) and C1 (34.4 ± 13.2 mg kg−1) were above this threshold. Mean concentrations of Olsen P at VFS2 (6.48 ± 3.34 mg kg−1), VFS3 (7.5 ± 2.3 mg kg−1), and C3 (8.0 ± 6.4 mg kg−1) were all below the optimum threshold (Figure 3).
The general pattern when comparing paired sites (i.e., VFS1 vs. C1, etc.) was that the control strips had higher Olsen P concentrations, but the only time this difference was statistically significant was at C2:VFS2 in May 2017. There was also a seasonal pattern that became evident as concentrations in the fall were lower than concentrations from the following spring (p = 0.0163). At C1, C2, and C3, concentrations from October 2015 to May 2016 increased by 129%, 15%, and 27%, respectively, and from October 2016 to May 2017 by 40%, 72%, and 20%, respectively. Increases were more consistent at the filter strip sites than control sites during both time periods. From October 2015 to May 2016, concentrations increased by 42%, 34%, and 34% at VFS1, VFS2, and VFS3, respectively; and from October 2016 to May 2017, concentrations increased by 24%, 28%, and 44%, respectively. These seasonal changes in concentrations were only significant at sites C1, VFS1, and VFS3.

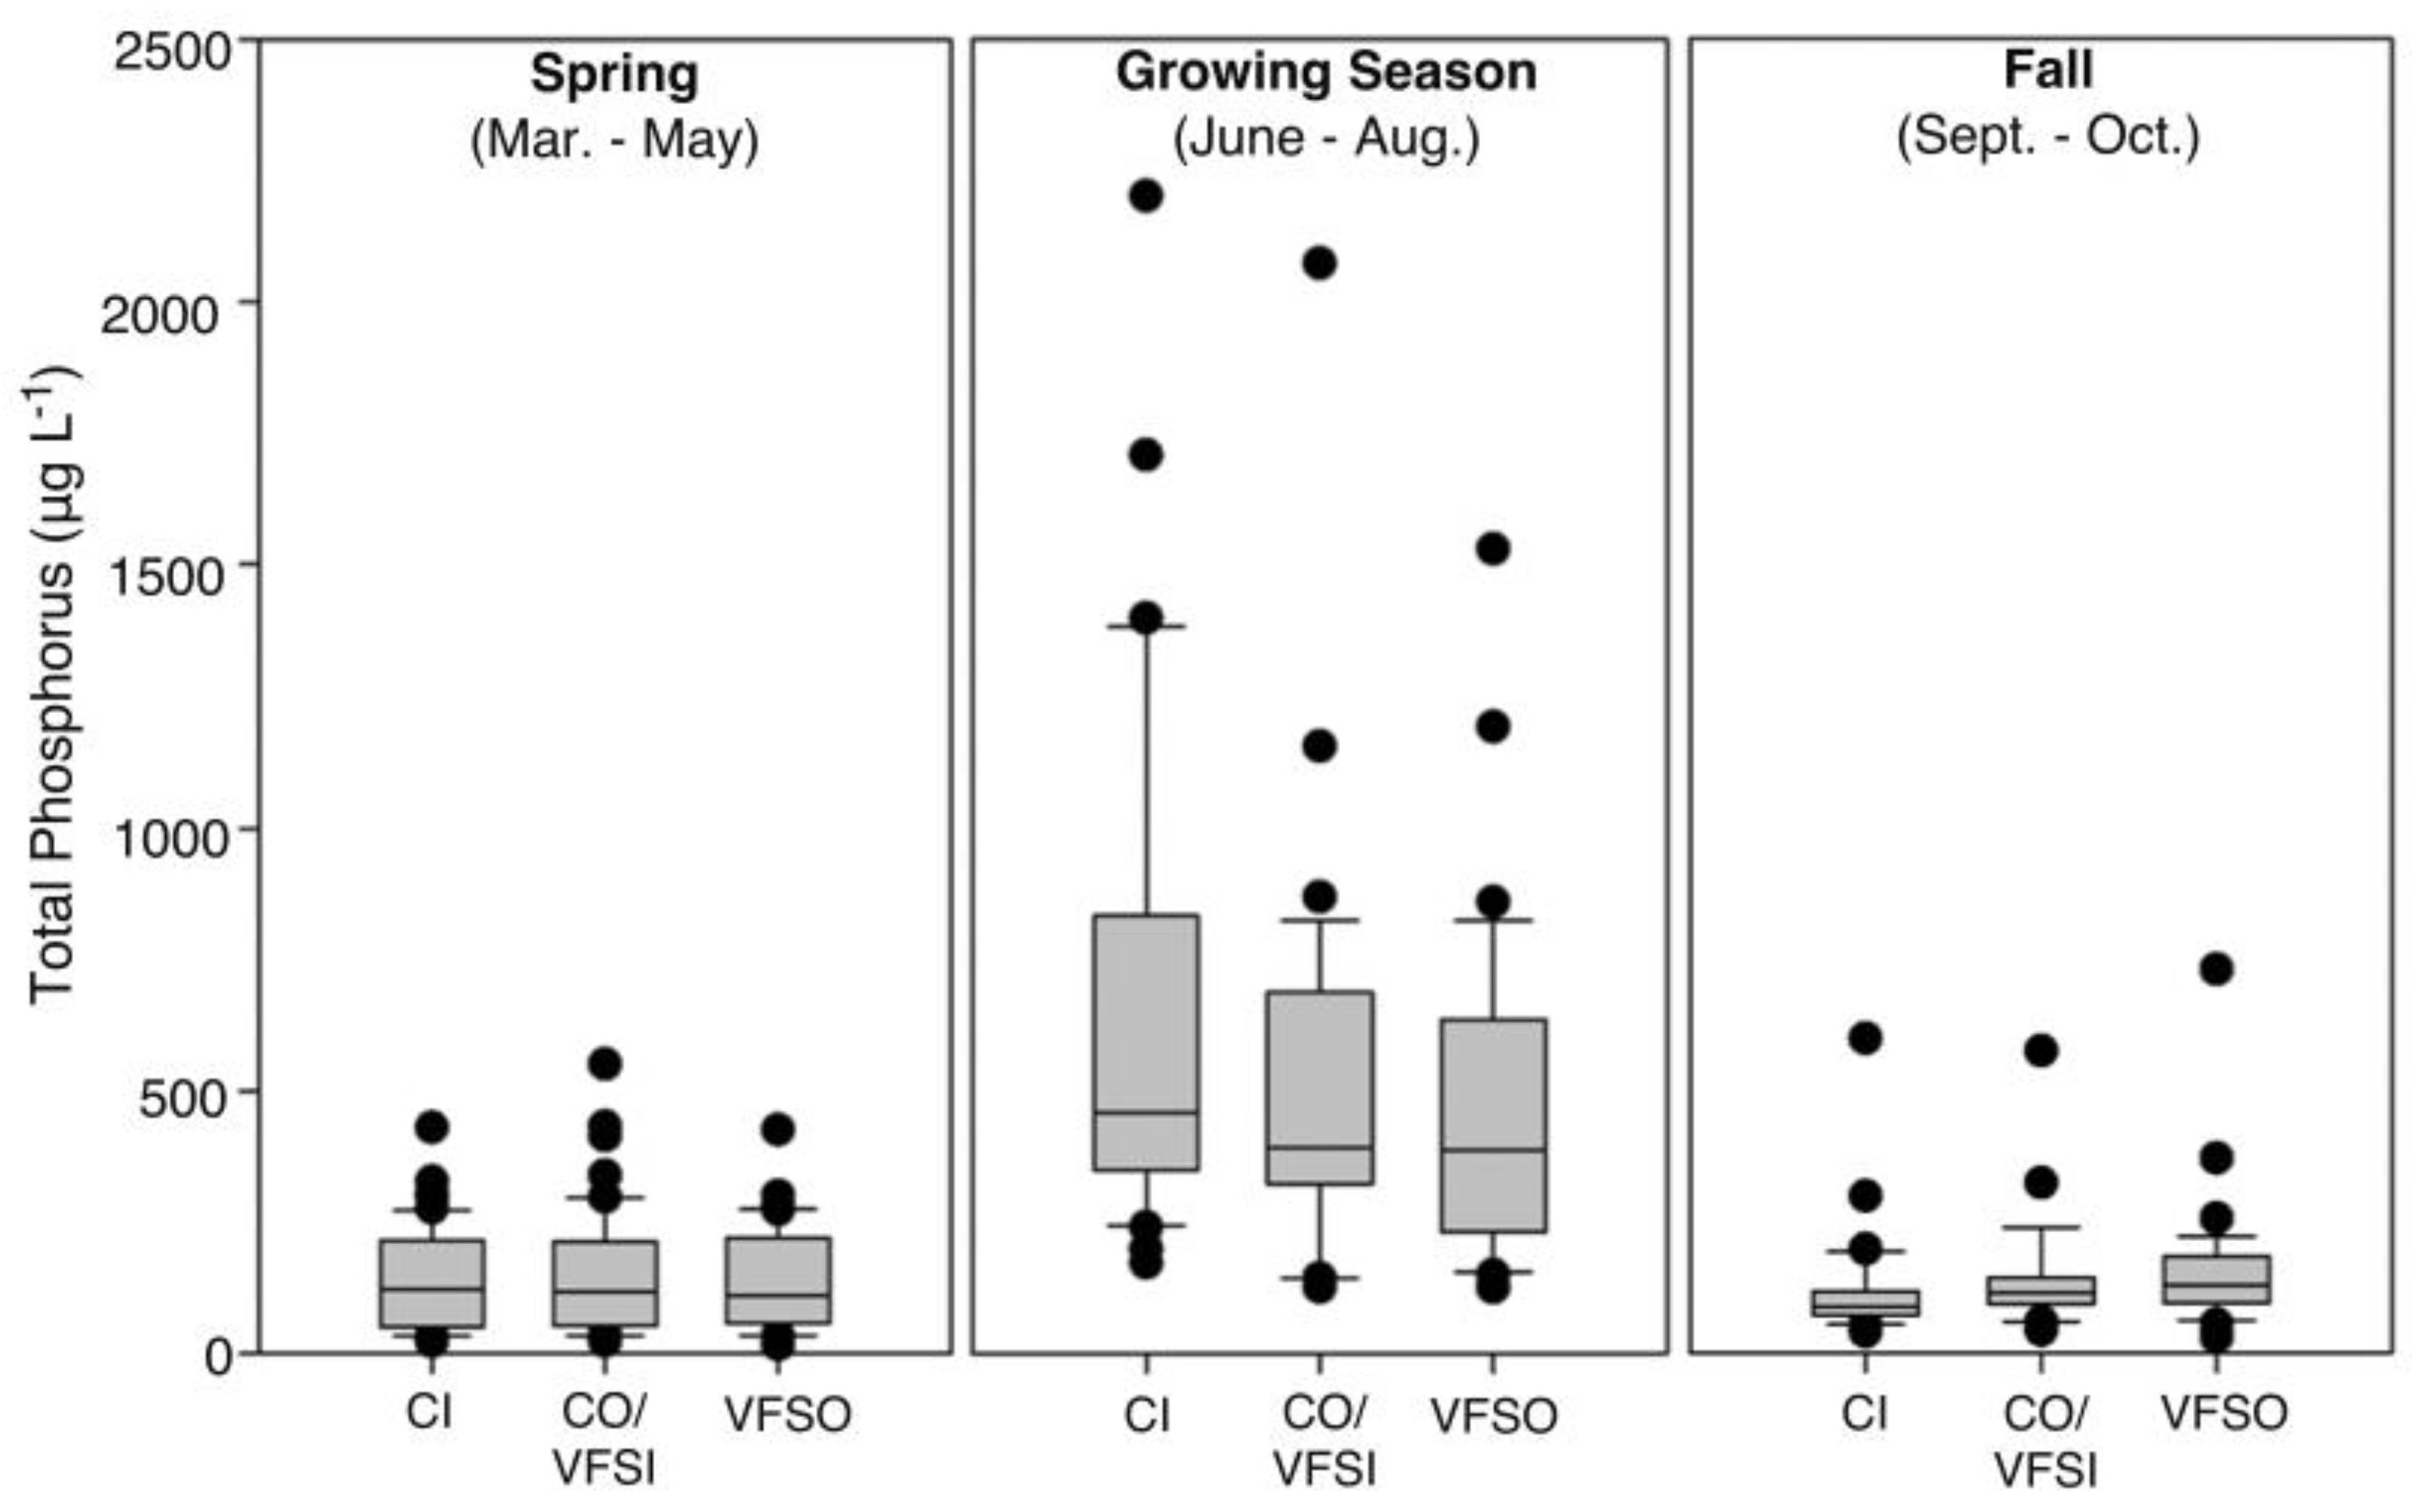
3.1.2. Total Phosphorus in Soils

Mean concentrations of TP were highest in the C1 and VFS1 sites across all sampling dates. Mean concentrations at C3 and VFS3 were the next highest and C2 and VFS2 were lowest throughout the duration of the study (Figure 3). This difference was significant across most date and site comparisons (i.e., VFS1 vs. VFS2, C2, etc.), with the exception of October 2015 and comparing C1 to C3 in May 2017. In order to determine if there were differences in TP concentrations within each pair of sites (i.e., VFS1 vs. C1, VFS2 vs. C2, etc.), a pairwise comparison was undertaken, and results showed that there were no statistically significant differences between VFS and control strips at any of the three pairs of sites. Thus, another pairwise comparison was undertaken to compare TP concentrations in the three pairs of sites. This analysis showed that, except for Pair 2 (C2 + VFS2) vs. Pair 3 (C3 + VFS3) in October 2015, there were significant differences between all pairs at all dates (p < 0.05).
Unlike Olsen P, there were not generalizable patterns across all sites or when grouping control and VFS sites with respect to seasonality. While mean concentrations in Olsen P were lower in the fall compared to spring across all years, TP concentrations were higher in the fall than spring across all years at VFS1 and VFS2, but not at VFS3. At the control sites, mean TP concentrations showed no discernible temporal pattern at any of the sites.

3.2. Vegetation Phosphorus

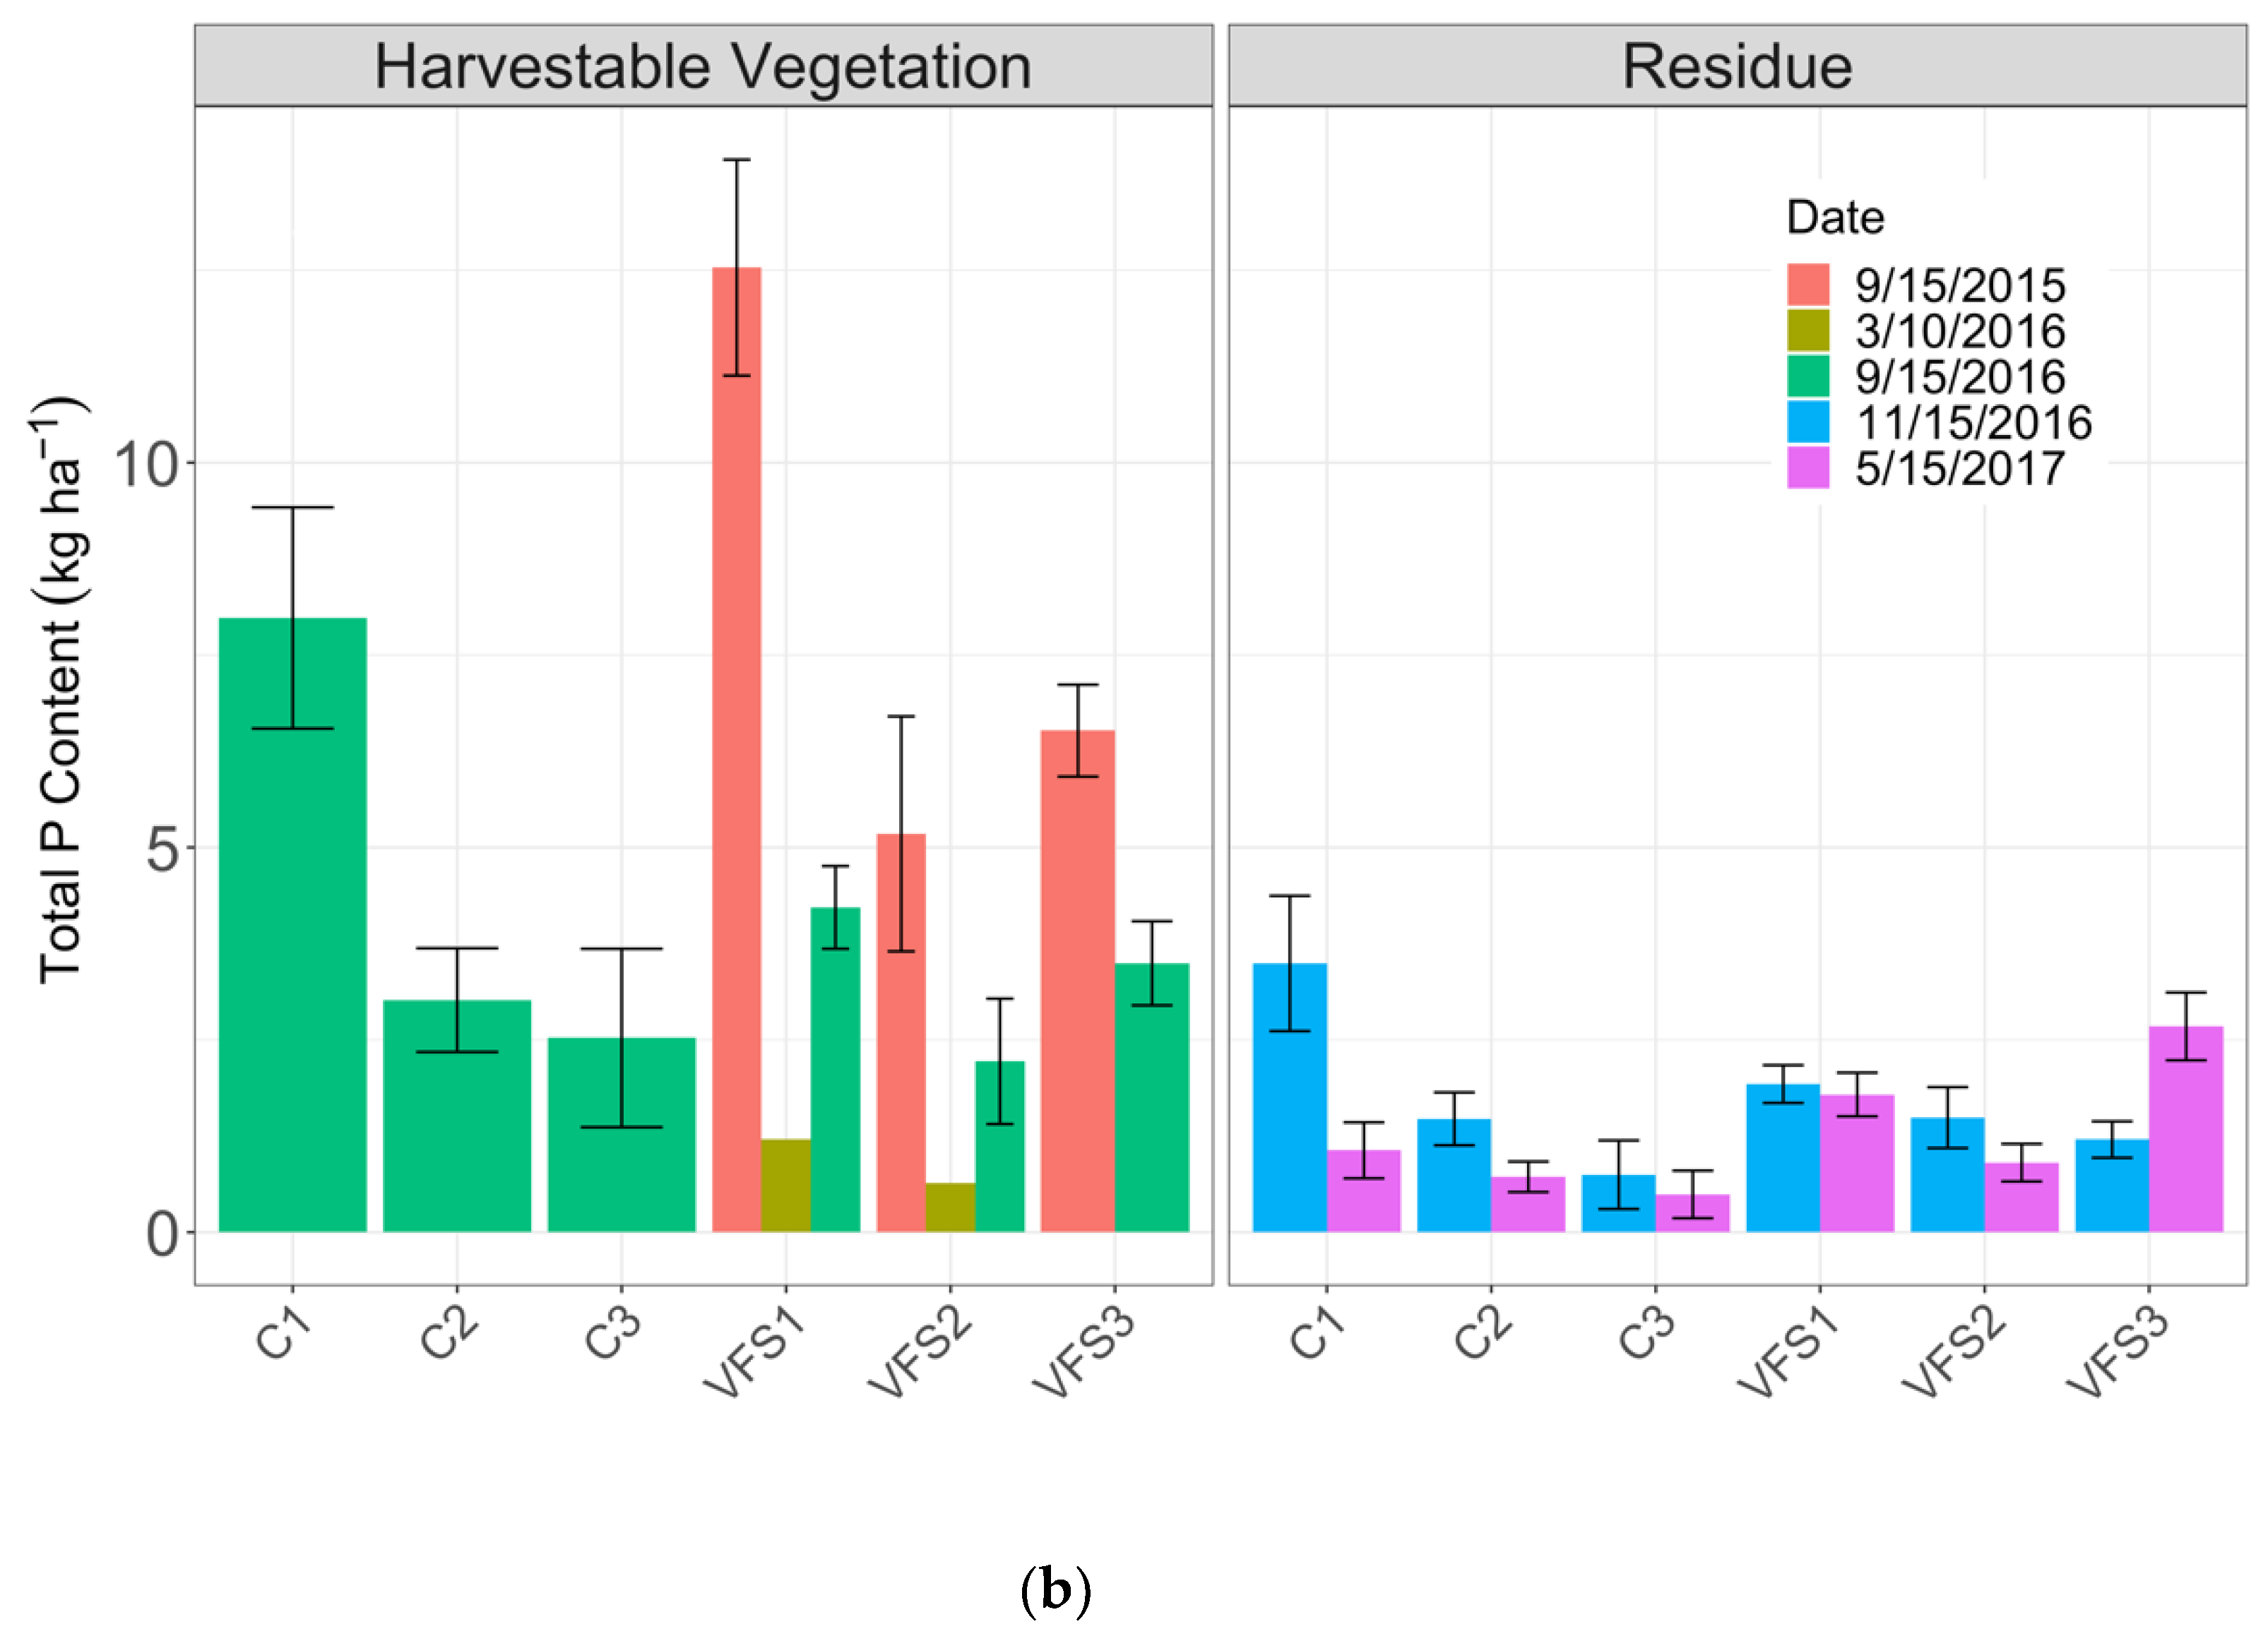
3.2.1. Total Phosphorus Content in Vegetation and Residue

Results from harvestable vegetation and residue samples showed that across all sites, harvestable vegetation samples taken in September 2016 had the highest mean concentrations of TP, while residue samples from November 2016 had the next highest mean concentrations at most sites, except for C3 and VFS3 (Figure 4). In a comparison of each individual site, the results of the Kruskal–Wallis rank test showed that there was a significant decrease (p < 0.05) in TP between September 2016 (harvestable vegetation) and November 2016 (residue) at most sites, with the exception of C1 and C3; although these decreases may have been influenced by the type of vegetation sampled, as residue would likely have lower P concentrations than the harvestable vegetation, which would include leaves. In order to determine if there was a significant loss of P over the winter and spring runoff period, a comparison of fall concentrations to spring concentrations was also undertaken. Results from residue samples taken in November 2016 and May 2017 show that there was a loss of P at most sites, except for C3 and VFS3, but this loss was not significant (p > 0.05). However, the results from residue samples collected in only the VFS sites in May 2017 were influenced by some regrowth of vegetation at the time of sample collection, which would have reduced the potential for P leaching in soils and increased P content in the vegetation samples.
Harvestable vegetation was collected in the VFS sites in 2015 and 2016, and concentrations in 2015 were similar to concentrations in the harvestable vegetation samples from 2016 and higher than the 2016 residue samples. While there was a significant decrease in TP concentrations from September 2015 to March 2016, due to the accidental harvesting of VFS strips in fall 2015, only a small number of samples could be collected in March 2016, making this analysis not statistically powerful. A comparison of TP concentrations in the VFS and control strips in fall (September and November) 2016 and May 2017 found that when results were pooled based on site location and compared at each date (i.e., C1 vs. VFS1, C2 vs. VFS2, etc.), there was no significant difference in TP concentrations (p > 0.05), except for C2 and VFS2 in harvestable vegetation samples from September 2016 (Figure 4).

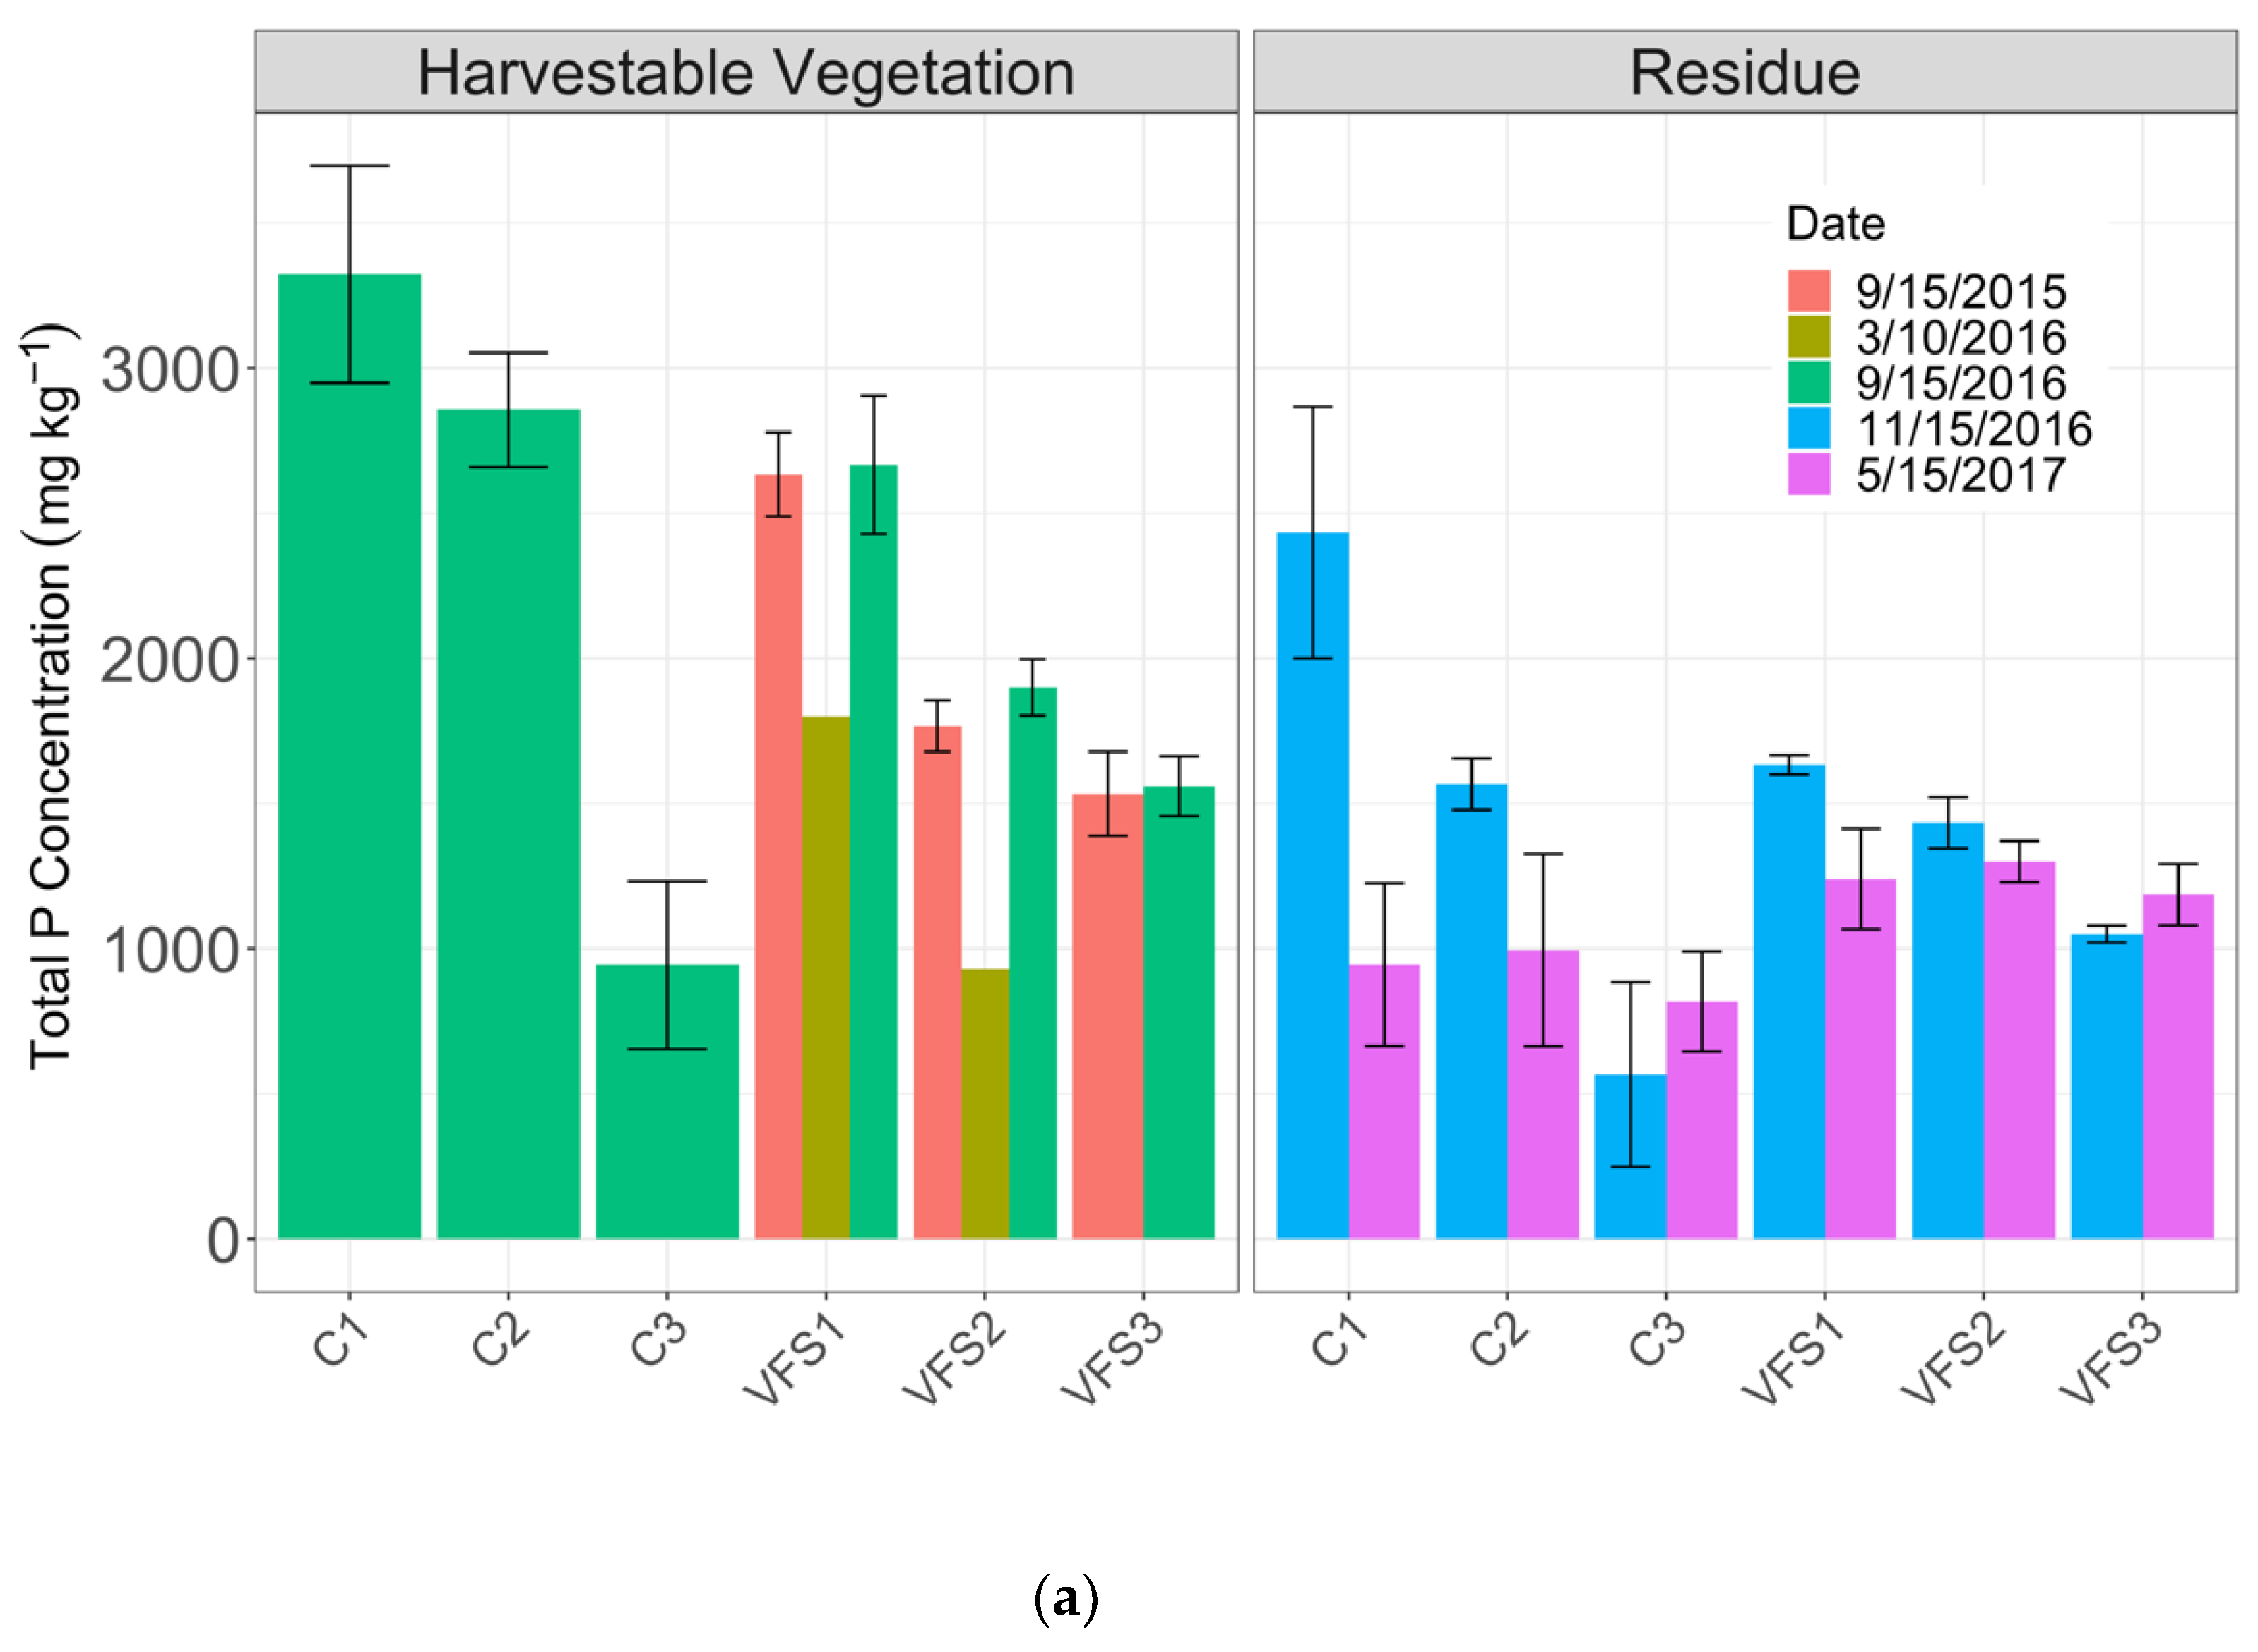
3.2.2. Total Phosphorus Concentrations by Area

Using dry mass of harvestable vegetation and residue samples combined with TP concentration, a measure of the amount of P per hectare (kg ha−1) was calculated for each site at each date. The primary pattern across sites was higher values in the fall with reduced values in the spring, both in the 2015–2016 and 2016–2017 seasons. Harvestable vegetation samples were only collected in September 2015 and March 2016 in the VFS strips, and September 2015 mean TP kg ha−1 was the highest across all three sites for the duration of the study. There was a significant decrease in mean TP in March 2016, but due to the low number of March 2016 samples, these findings are not statistically powerful.
Harvestable vegetation samples collected in September 2016 were higher in TP than residue samples collected in November 2016 at most sites with the exception of VFS2. A determination of TP loss from November 2016 to May 2017 was undertaken across the sites, to provide an indication of the potential for P to be released from vegetation into soils over winter and throughout the freshet. Results showed that the decrease was most pronounced at C1 and C2, but not at C3, which could be explained by the fact that C3 was planted with soybeans, whereas C1 and C2 were planted with canola. While regrowth at the VFS sites in spring 2017 could have influenced these results, the results of the Kruskal–Wallis rank test found that none of these decreases were significant (p > 0.05).

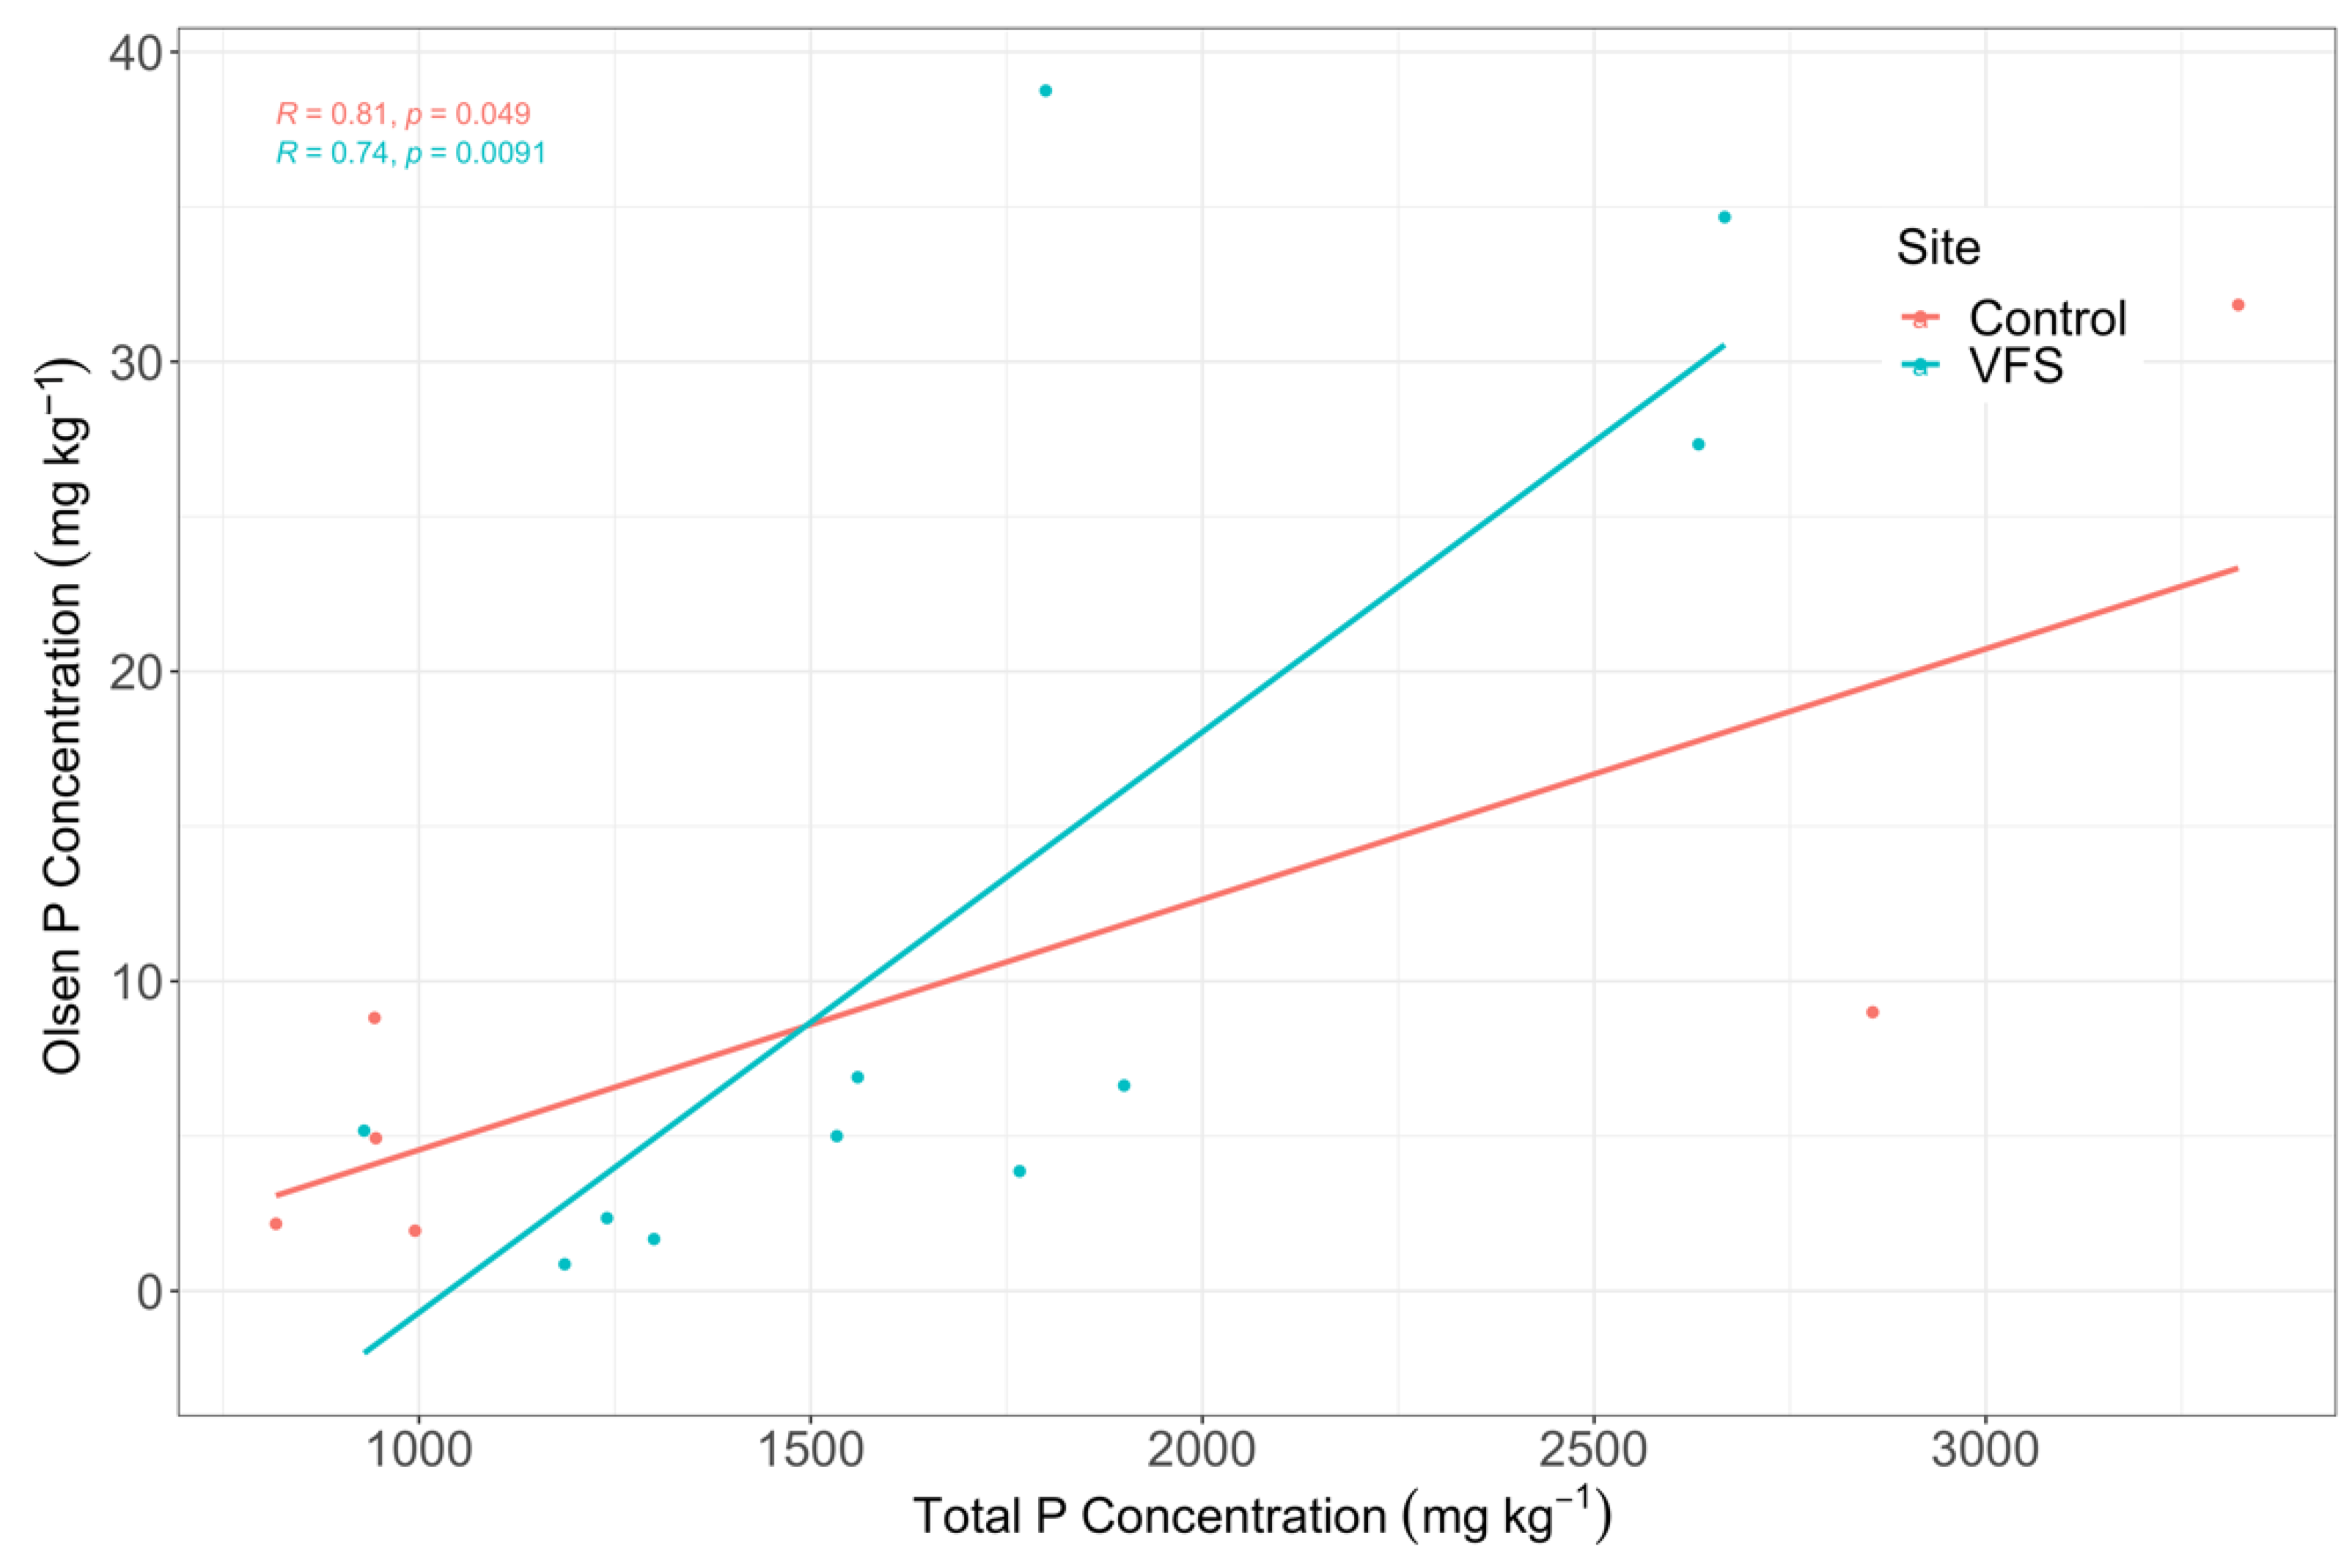
3.2.3. Correlations between Plant and Soil Phosphorus

Correlations between soil Olsen P and plant TP were evaluated, with Olsen P being chosen over soil TP because it is a better measure of the P that is available for plant uptake. When all samples across dates were combined, there was a positive correlation between Olsen P and plant TP, and this correlation was significant (p = 0.0019). To determine the site-specific nature of this correlation, the VFS and control strips were combined, and another Pearson correlation was run. The results from the Pearson correlation showed that both VFS (R = 0.74, p = 0.0091) and control strips (R = 0.81, p = 0.049) had significantly positive correlations between Olsen P and plant TP (Figure 5).

4. Discussion

This research aimed to determine the impact of the implementation and management of VFS on soil P concentrations over a multi-year period, focusing on changes in P concentrations over winter in soils and vegetation. There is considerable potential for soils within VFS to accumulate P from adjacent cropland by trapping sediments, slowing surface runoff, and accumulating the P that is transferred from frozen and thawed vegetation. However, while soils are an important sink for P, a number of studies have pointed to various pathways by which P can be mobilized in the soil and subsequently transported via vertical and lateral preferential flow to receiving waters [31]. Therefore, quantifying the storage and transfer of P from cropland to VFS and then to adjacent waterbodies is important for P transport modeling, much of which depends on determining the impacts of a cold climate on soil properties (i.e., snow and ice cover, frozen soils) [32].
Figure 6 illustrates the potential P dynamics in soils and vegetation that would occur in a cold climate VFS that was either harvested in the fall or was left unmanaged (final panel). Vegetation takes up soil P throughout the growing season and into the late summer, (i.e., before harvest), but will begin to translocate P from its shoots to its roots after the first hard freeze, likely occurring in late fall, when temperatures drop below 0 °C. Root material was not collected consistently enough throughout the duration of this study to enable an assessment of this mechanism, but there is some evidence that translocation may have occurred, as plant TP concentrations decreased at VFS1, VFS2, VFS3, and C2, in the only year (2016) when samples were collected before and after multiple freezes [33]. Harvesting the VFS in the fall, before the translocation of P to the roots occurs, could potentially reduce the amount of P that is available to be released from vegetation and lost via soils through surface runoff or leaching during the subsequent spring snowmelt period. Release of P from vegetative residues would still occur and some of this P would be retained in the soil, but it is likely that the unmanaged VFS would release even greater P to soils and surface runoff, because there is more available biomass left on the field (Figure 6).
The processes occurring within the managed or unmanaged buffer differ from those in a cropped area primarily because, even when harvested, the VFS maintain a complex root structure that encourages early season emergence, which was evidenced in this study in May 2017. Mean concentrations of Olsen P in soils were elevated each spring compared to fall and showed a general pattern of increasing mean concentrations in both the VFS and the control strips throughout the study. Whereas the seasonal pattern is very clear in VFS1 and C1, it is less so at the rest of the sites, likely due to the fact that these two sites were never P-limited, because their concentrations were always within or above the suggested maintenance threshold (10–20 mg kg−1), as delineated by Flaten and Grant [26]. The other sites had mean Olsen P concentrations that, with the exception of C2 during May 2017, were well below this maintenance threshold and may have been P-limited, causing Olsen P values to stagnate during the growing season. Interestingly, TP concentrations were significantly different between sites when they were paired by location rather than vegetative cover, which may be related to previous land management practices or to changes made to the site in constructing the ponds and ditches for this research. It is also worth noting that because vegetation was sampled before the first hard frost of the fall, mean concentrations of soil P in the fall would not have been biased by the translocation of P from shoots to the roots and potentially to the soil.
The higher concentrations of Olsen P in the spring in each year of the study were also likely due to P contributions from vegetation that underwent multiple freeze–thaw cycles throughout the preceding winter and early spring, which can damage cell membranes and allow P to be released from the vegetation [34]. There has been a significant amount of research undertaken to determine how various factors can impact P release potential, including freeze–thaw cycle duration, intensity and extraction methods [35,36,37], vegetation portion (i.e., residue or whole plant), species [36,37,38,39], and harvesting strategy [40]. The common finding across studies was that once vegetation had undergone freeze–thaw cycles, it released P, though concentrations differed significantly, particularly between lab and field studies. Øgaard [39] and Räty et al. [41] both undertook freeze–thaw cycle experiments under natural field conditions and found that the concentrations of P released were not as high as those from laboratory experiments. Field based studies, such as the one detailed here, are important because vegetation is slowly exposed to decreasing temperatures, which can reduce its P contribution potential as it slowly acclimates to the cold [34]. However, whereas much of the research to date has investigated the potential for this P to be lost during runoff, the elevated concentrations of Olsen P in the soils in this study indicate that significant amounts of P released from vegetation are likely retained in the soil. This finding matches the results of research undertaken simultaneously, which found that the VFS plots did not promote significant reductions in total dissolved P (TDP) or TP concentrations in surface waters during the spring snowmelt period [16]. Vanrobaeys et al. [16] also found that the VFS performed better during the growing season in reducing TP concentrations in surface water (8.7% reduction), which is also when soil P levels in the present study decreased, likely due to uptake by vegetation (Figure 7).
Results showing that there was no significant difference in Olsen P concentrations between the control strips and the VFS sites, when they were grouped together, was unexpected because the control strips received fertilizer each spring, whereas the VFS strips did not. This may be due to the short time frame in which this study was undertaken, and the limited time the VFS were established, but it is also possible that the control strips, which were planted with annual crops such as wheat and soybeans, had greater P uptake throughout the growing season [42]. Thus, even while being fertilized, their rate of P uptake was such that fertilization did not create a substantial pool of excess P in the soil. Another explanation is that outside of C1 and VFS1, concentrations of Olsen P were considered low for optimal vegetative growth, leaving a small pool in the soil that was indistinguishable between the VFS and control strips. Alternatively, this lack of significant difference in mean Olsen P concentrations between VFS and control sites could have been due to the vegetation and management of the VFS and control strips. While Liu et al. [37] found that P loss in runoff from perennial forage residue was greater than that of annual crops, Cade-Menum et al. [43] found that annual crops released more dissolved reactive P than perennials. In this study, analysis of the vegetative residue showed that in the fall, the % TP in the control strips (0.17%) and VFS sites (0.13%) were nearly the same, so it is not likely that this made a substantial difference and, therefore, this is an area where more research is needed.
Management of VFS by farmers varies based on a number of factors (i.e., cost, time, weather conditions), so harvesting the vegetation from a VFS is not always completed in the fall and, when implemented through certain funding programs, can only be done on a limited basis. However, because of the potential for P release from frozen vegetation, harvesting may be a useful management strategy to reduce P loading during the spring snowmelt. In this study, as expected, TP loss from whole plant samples was significantly greater than from residues over winter, and though the P loss from crop residue was substantial (1.17 kg ha−1), it was less than half of the P loss from the harvestable vegetation (3.3 kg ha−1). It is not uncommon to leave VFS unmanaged over numerous years and as this study has shown, this can lead to a significant P loss over winter to soils and surface runoff. If the P reduction potential of VFS in agricultural regions is to be reached, it is important to consider the hydrology of the area, the prior nutrient management strategies that have been utilized [44], and how the VFS will be managed, including harvesting the vegetation and removing it completely from the landscape (i.e., not just moving it to another part of the field).
In May 2017, samples were taken once the fields became accessible, but by this time, the vegetation in the VFS sites had already begun to regrow. This was unintended when the study was planned but was noteworthy because the early spring regrowth demonstrates the core reasons for the implementation of VFS: their ability to take up P over a longer duration than annual crops, and to reduce sediment transport during spring rainfall events. Additionally, while there are often freeze–thaw cycles after the re-emergence of vegetation in the spring, the most commonly planted species in VFS are cold-climate adapted and thus, would not likely lose P in the same way during this period as they would in the fall.
As research on the effectiveness of VFS in cold climates moves forward, future studies should continue to investigate the contributions of P from soil and vegetation to surface waters. Additionally, building on the work presented here, field-based studies to determine the leaching capacity of soils after numerous freeze–thaw cycles and under different management strategies should be undertaken. For example, beyond nutrient management, vegetation and residue also are important for trapping snow and reducing sublimation among other benefits [45]. Thus, similar to cropped land, the species grown, harvesting height, and tillage operations (where applicable) in VFS are management decisions that need to be investigated more thoroughly. Finally, it would be useful for future studies to determine the capacity of VFS to release P during late fall rain on frozen vegetation scenarios, which may become more likely as climate change alters temperature and precipitation patterns.

5. Conclusions

The main objective of this study was to gain more knowledge of cold climate P dynamics in managed VFS and to measure the potential contribution of P released from vegetation to soils. Thus, while this research did not provide a specific answer to whether or not VFS are effective from a soils perspective, the results do indicate that vegetation will release P over the winter, and that whole plant material releases significantly more P than residues. The release of P from vegetation was also corroborated by the increase in Olsen P concentrations in the soils of the VFS sites and control strips in the spring.
There is also evidence that the antecedent soil P conditions at VFS sites are important in determining the capacity for P uptake by vegetation and subsequent P retention or loss via surface runoff or leaching in soil in the spring. However, it is important to note that this study also showed that P released from vegetation may not all be lost to surface waters, as significant amounts of P may be retained in the soil. As research undertaken in parallel to this work demonstrated, the VFS did not have any significant impact on TP concentrations in surface waters during the spring snowmelt period, and thus, more work should be undertaken to better understand the delivery of nutrients from VFS to surface waters. Ultimately this study has shown that soil and vegetation management strategies are necessary when VFS are implemented because soil P can also be mobilized by surface erosion and by subsurface flow, particularly when the soil is saturated with P. Keeping excess P out of surface water is essential for protecting freshwater sources, particularly as water security concerns grow as climate change accelerates.

Supplementary Materials

The following are available online at https://www.mdpi.com/article/10.3390/agriculture12020233/s1, Figure S1: Snow and ice covered VFS, Figure S2: Vegetation quadrat sampling.

Author Contributions

Conceptualization, P.N.O., D.A.L., J.A.V., and K.A.K.; Writing–original draft, K.A.K.; Writing–review and editing, P.N.O., J.A.V., D.A.L. All authors have read and agreed to the published version of the manuscript.

Funding

This research was funded in part by Environment and Climate Change Canada–Lake Winnipeg Basin Stewardship Fund and the Natural Sciences (LWBSF – EC 1300329) and Engineering Research Council (NSERC) of Canada (NSERC – RGPIN-2018-06360.

Data Availability Statement

The data that informed the findings of this research are available from the corresponding author upon request.

Acknowledgments

The authors would like to thank the staff at AAFC in Morden for their logistical support and the reviewers and guest editors for their constructive feedback on this manuscript.

Conflicts of Interest

The authors declare no conflict of interest.

References

  1. Frossard, E.; Condron, L.M.; Oberson, A. Processes governing phosphorus availability in temperate soils. J. Environ. Qual. 2000, 29, 15–23. [Google Scholar] [CrossRef] [Green Version]
  2. Hansen, N.C.; Daniel, T.C.; Sharpley, A.N.; Lemunyon, J.L. The fate and transport of phosphorus in agricultural systems. J. Soil Water Conserv. 2000, 57, 408–417. [Google Scholar]
  3. Holman, I.P.; Whelan, M.J.; Howden, N.J.K.; Bellamy, P.H.; Willby, N.J.; Rivas-Casado, M.; McConvey, P. Phosphorus in groundwater—An overlooked contributor to eutrophication? Hydrol. Process. 2008, 22, 5127. [Google Scholar] [CrossRef]
  4. Sharpley, A.N.; Robinson, J.S.; Smith, S.J. Assessing environmental sustainability of agricultural systems by simulation of nitrogen and phosphorus loss in runoff. Eur. J. Agron. 1995, 4, 453–464. [Google Scholar] [CrossRef]
  5. Hansen, N.C.; Gupta, S.C.; Moncrief, J.F. Snowmelt runoff, sediment, and phosphorus losses under three different tillage systems. Soil Till. Res. 2000, 57, 93–100. [Google Scholar] [CrossRef]
  6. Woltemade, C.J. Ability of restored wetlands to reduce nitrogen and phosphorus concentrations in agricultural drainage water. J. Soil Water Conserv. 2000, 55, 303–309. [Google Scholar]
  7. Braskerud, B.C. Factors affecting phosphorus retention in small constructed wetlands treating agricultural non-point source pollution. Ecol. Eng. 2002, 19, 41–61. [Google Scholar] [CrossRef]
  8. Sheppard, S.C.; Sheppard, M.I.; Long, J.; Sanipelli, B.; Tait, J. Runoff phosphorus retention in vegetated field margins on flat landscapes. Can. J. Soil Sci. 2006, 86, 871–884. [Google Scholar] [CrossRef] [Green Version]
  9. Uusi-Kämppä, J.; Jauhiainen, L. Long-term monitoring of buffer zone efficiency under different cultivation techniques in boreal conditions. Agric. Ecosyst. Environ. 2010, 137, 75–85. [Google Scholar] [CrossRef]
  10. Clausen, J.C.; Guillard, K.; Sigmund, C.M.; Martin Dors, K. Water quality changes from riparian buffer restoration in Connecticut. J. Environ. Qual. 2000, 29, 1751–1761. [Google Scholar] [CrossRef] [Green Version]
  11. Al-wadaey, A.; Wortmann, C.S.; Franti, T.G.; Shapiro, C.A.; Eisenhauer, D.E. Effectiveness of grass filters in reducing phosphorus and sediment runoff. Water Air Soil Poll. 2012, 223, 5865–5875. [Google Scholar] [CrossRef] [Green Version]
  12. Kieta, K.A.; Owens, P.N.; Lobb, D.A.; Vanrobaeys, J.A.; Flaten, D.N. Phosphorus dynamics in vegetated buffer strips in cold climates: A review. Environ. Rev. 2018, 26, 255–272. [Google Scholar] [CrossRef]
  13. Glozier, N.E.; Elliott, J.A.; Holliday, B.; Yarotski, J.; Harker, B. Water Quality Characteristics and Trends in a Small Agricultural Watershed: South Tobacco Creek, Manitoba; Environment Canada: Saskatoon, SK, Canada, 2006; p. 86. [Google Scholar]
  14. Little, J.L.; Nolan, S.C.; Casson, J.P.; Olson, B.M. Relationships between soil and runoff phosphorus in small Alberta watersheds. J. Environ. Qual. 2007, 36, 1289–1300. [Google Scholar] [CrossRef] [Green Version]
  15. Habibiandehkordi, R.; Lobb, D.A.; Sheppard, S.C.; Flaten, D.N.; Owens, P.N. Uncertainties in vegetated buffer strip function in controlling phosphorus export from agricultural land in the Canadian Prairies. Environ. Sci. Pollut. Res. 2017, 24, 18372–18382. [Google Scholar] [CrossRef] [PubMed]
  16. Vanrobaeys, J.A.; Owens, P.N.; Lobb, D.A.; Kieta, K.A.; Campbell, J.M. Seasonal efficacy of vegetated filter strips for phosphorus reduction in surface runoff. J. Environ. Qual. 2019, 48, 880–888. [Google Scholar] [CrossRef] [Green Version]
  17. Bechmann, M.E.; Kleinman, P.; Sharpley, A.N.; Saporito, L.S. Freeze–thaw effects on phosphorus loss in runoff from manured and catch-cropped soils. J. Environ. Qual. 2005, 34, 2301–2309. [Google Scholar] [CrossRef] [Green Version]
  18. Levitt, J. Responses of Plants to Environmental Stresses; Academic Press: New York, NY, USA, 1980; 709p. [Google Scholar]
  19. Webb, M.S.; Uemura, M.; Steponkus, P.L. A comparison of freezing injury in oat and rye: Two cereals at the extremes of freezing tolerance. Plant Physiol. 1994, 104, 467–478. [Google Scholar] [CrossRef] [PubMed] [Green Version]
  20. Liu, J.; Khalaf, R.; Ulén, B.; Bergkvist, G. Potential phosphorus release from catch crop shoots and roots after freezing-thawing. Plant Soil 2013, 371, 543–557. [Google Scholar] [CrossRef] [Green Version]
  21. Kleinman, P.; Bryant, R.B.; Reid, W.S.; Sharpley, A.N.; Pimentel, D. Using soil phosphorus behavior to identify environmental thresholds. Soil Sci. 2000, 165, 943–950. [Google Scholar] [CrossRef]
  22. Joergensen, R.G.; Kübler, H.; Meyer, B.; Wolters, V. Microbial biomass phosphorus in soils of beech forests. Biol. Fertil. Soils 1995, 19, 215–219. [Google Scholar] [CrossRef]
  23. Roberts, W.M.; Matthews, R.A.; Blackwell, M.S.A.; Peukert, S.; Collins, A.L.; Stutter, M.I.; Haygarth, P.M. Microbial biomass phosphorus contributions to phosphorus solubility in riparian vegetated buffer strip soils. Biol. Fertil. Soils 2013, 49, 1237–1241. [Google Scholar] [CrossRef]
  24. Haygarth, P.M.; Condrom, L.M.; Heathwaite, A.L.; Turner, B.L.; Harris, G.P. The phosphorus transfer continuum: Linking source to impact with an interdisciplinary and multi-scaled approach. Sci. Total Environ. 2005, 344, 5–14. [Google Scholar] [CrossRef]
  25. Smith, R.E.; Michalyna, W.; Wilson, G. Soils of the Morden-Winkler Area. Report No.18 Canada-Manitoba Soil Survey; Manitoba Department of Agricutlure: Winnipeg, MB, Canada, 1973. [Google Scholar]
  26. Flaten, D.N.; Grant, C. Review of 4R Fertilizer Management in the Northern Great Plains. In Proceedings of the AGVISE Soil Fertility Seminar, Portage la Prairie, MB, Canada, 12 March 2019. [Google Scholar]
  27. Environment Canada. Morden CDA CS, Manitoba Station Data: Canada’s National Climate Archive. Available online: http://climate.weather.gc.ca/ (accessed on 11 October 2019).
  28. R Core Team. R: A Language and Environment for Statistical Computing [Internet]; R Foundation for Statistical Computing: Vienna, Austria, 2017; Available online: http://www.R-project.org/ (accessed on 20 December 2021).
  29. RStudio Team. RStudio: Integrated Development for R; RStudio, Inc.: Boston, MA, USA, 2015; Available online: http://www.rstudio.com/ (accessed on 20 December 2021).
  30. Wickham, H. ggplot2: Elegant Graphics for Data Analysis; Springer: New York, NY, USA, 2016. [Google Scholar]
  31. Simard, R.R.; Beauchemin, S.; Haygarth, P.M. Potential for preferential pathways of phosphorus transport. J. Environ. Qual. 2000, 29, 97–105. [Google Scholar] [CrossRef]
  32. Young, E.O.; Ross, D.S.; Jaisi, D.P.; Vidon, P.G. Phosphorus transport along the cropland–riparian–stream continuum in cold climate agroecosystems: A review. Soil Syst. 2021, 5, 15. [Google Scholar] [CrossRef]
  33. Kieta, K.A. An Assessment of Vegetation Characteristics and Hydrologic Flow Pathways on the Effectiveness of Vegetated Buffer Strips for Phosphorus Reduction in an Agricultural Watershed. Mater’s Thesis, University of Northern British Columbia, Prince George, BC, Canada, 2017. [Google Scholar]
  34. Thomashow, M.F. Role of cold-responsive genes in plant freezing tolerance. Plant Physiol. 1998, 118, 1–8. [Google Scholar] [CrossRef] [Green Version]
  35. Miller, M.H.; Beauchamp, E.G.; Lauzon, J.D. Leaching of nitrogen and phosphorus from the biomass of three cover crop species. J. Environ. Qual. 1994, 23, 267–272. [Google Scholar] [CrossRef]
  36. Roberson, T.; Bundy, L.G.; Andraski, T.W. Freezing and drying effects on potential plant contributions to phosphorus in runoff. J. Environ. Qual. 2007, 36, 532–539. [Google Scholar] [CrossRef]
  37. Liu, K.; Elliott, J.A.; Lobb, D.A.; Flaten, D.N.; Yarotski, J. Nutrient and sediment losses in snowmelt runoff from perennial forage and annual cropland in the Canadian Prairies. J. Environ. Qual. 2014, 43, 1644–1655. [Google Scholar] [CrossRef] [PubMed]
  38. Elliott, J.A. Evaluating the potential contribution of vegetation as a nutrient source in snowmelt runoff. Can. J. Soil Sci. 2013, 93, 435–443. [Google Scholar] [CrossRef]
  39. Øgaard, A.F. Freezing and thawing effects on phosphorus release from grass and cover crop species. Acta. Agric. Scand. 2015, 65, 529–536. [Google Scholar] [CrossRef]
  40. Kieta, K.A.; Owens, P.N. Phosphorus release from shoots of Phleum pretense L. after repeated freeze-thaw cycles and harvests. Ecol. Eng. 2019, 127, 204–211. [Google Scholar] [CrossRef]
  41. Räty, M.; Uusi-Kämppä, J.; Yli-Halla, M.; Rasa, K.; Pietola, L. Phosphorus and nitrogen cycles in the vegetation of differently managed buffer zones. Nutr. Cycl. Agroecosyst. 2010, 86, 121–132. [Google Scholar] [CrossRef]
  42. Propheter, J.L.; Staggenborg, S. Performance of annual and perennial biofuel crops: Nutrient removal during the first two years. Agron. J. 2010, 102, 798–805. [Google Scholar] [CrossRef]
  43. Cade-Menun, B.J.; Bell, G.; Baker-Ismail, S.; Fouli, Y.; Hodder, K.; McMartin, D.W.; Perez-Valdivia, C.; Wu, K. Nutrient loss from Saskatchewan cropland and pasture in spring snowmelt runoff. Can. J. Soil Sci. 2013, 93, 445–458. [Google Scholar] [CrossRef]
  44. Baulch, H.M.; Elliott, J.A.; Cordeiro, M.R.C.; Flaten, D.N.; Wilson, H.F. Soil and water management: Opportunities to mitigate nutrient losses to surface waters in the Northern Great Plains. Environ. Rev. 2019, 27, 447–477. [Google Scholar] [CrossRef]
  45. Liu, J.; Lobb, D.A. An overview of crop residue management impacts on crop water use and runoff in the Canadian Prairies. Water 2021, 13, 2929. [Google Scholar] [CrossRef]
Figure 1. Map of the cropped (control) strips and vegetated filter strips within the 20-ha study area at the Agriculture and Agri-Food Cereal Research Centre in Morden, Manitoba, Canada.
Agriculture 12 00233 g001
Figure 2. (a) Panoramic image that shows residue at VFS2 after it has been harvested (red) and C2 with harvestable vegetation intact (blue); (b) image depicting both harvestable vegetation and residue at VFS2 and the equipment used to remove vegetation; and (c) image depicting what was sampled as spring residue at VFS3 (foreground) and at C3 (behind weir).
Agriculture 12 00233 g002
Figure 3. Concentrations of (a) Olsen P and (b) TP in soils from October 2015 through May 2017 in control (C) and vegetated filter strips (VFS). Solid lines indicate the median, error bars represent standard error, and dots represent outliers. The dashed purple lines denote the range of optimum Olsen P values for this region.
Agriculture 12 00233 g003
Figure 4. (a) Mean concentrations of TP (mg kg−1) and (b) TP (kg ha−1) in harvestable vegetation and residue samples. Error bars signify standard error.
Agriculture 12 00233 g004aAgriculture 12 00233 g004b
Figure 5. Results of a Pearson correlation plot showing the relationship between Olsen P concentrations in soils and TP concentrations in vegetation. The data were divided by site type, either control strips (red) or VFS (blue).
Agriculture 12 00233 g005
Figure 6. A diagram showing phosphorus (P) dynamics in a managed or unmanaged (farthest right panel) vegetated filter strip (VFS). Throughout the growing season, vegetation in the VFS is taking up soil P, but after the first hard freeze, usually in late fall, vegetation will begin to translocate P from the shoots to the roots. Harvesting vegetation in the fall is beneficial because it removes P from the VFS and reduces its P release capacity, though release from residue will occur. In completely unmanaged buffers (final panel), the capacity for P release is applied to the whole plant and may become a significant source of P to soils and eventually to runoff. Thicker arrows denote processes that were the focus of this study.
Agriculture 12 00233 g006
Figure 7. Total P concentrations in surface water by season from data collected from 2015 to 2017 at the same field sites as described in this research (modified from Vanrobaeys et al. [16]). CI represents P concentrations in water samples collected at the inflow to the control sites, CO/VFSI represents P concentrations in samples collected leaving the control sites and entering the VFS sites, and VFSO represents P concentrations in water samples collected at the outflow of the VFS.
Agriculture 12 00233 g007
Table 1. A description of soil and vegetation samples collected throughout the duration of the study. In soils, S denotes presence of a sample being taken. In harvestable vegetation and residue, V denotes a sample taken from VFS and C denotes a sample taken from control strips, and the number in parenthesis denotes the number of samples collected on that sampling date.
Fall 2015Spring 2016Fall 2016Spring 2017
Sept 2015Oct 2015March 2016May 2016Sept/Oct 2016Nov 2016May
2017
Soils S(24) S(24)S(36) S(36)
Harvestable VegetationV(9) V(2) V,C(36)
Residue V,C(18)V,C(18)
Publisher’s Note: MDPI stays neutral with regard to jurisdictional claims in published maps and institutional affiliations.

