
Automatic Scoring System for Monitoring Foot Pad Dermatitis in Broilers

 , ,
, ,  , ,
, ,
Abstract
:1. Introduction
2. Animals, Materials, and Methods
2.1. Animals and Materials
2.2. Inter-Observer Reliability Test
2.3. Visual Assessment
2.3.1. Phase 1: Calibration
2.3.2. Phase 2: Validation
2.4. Assessment by the Camera System
2.4.1. Phase 1: Calibration
2.4.2. Phase 2: Validation
2.5. Statistical Methods
3. Results and Discussion
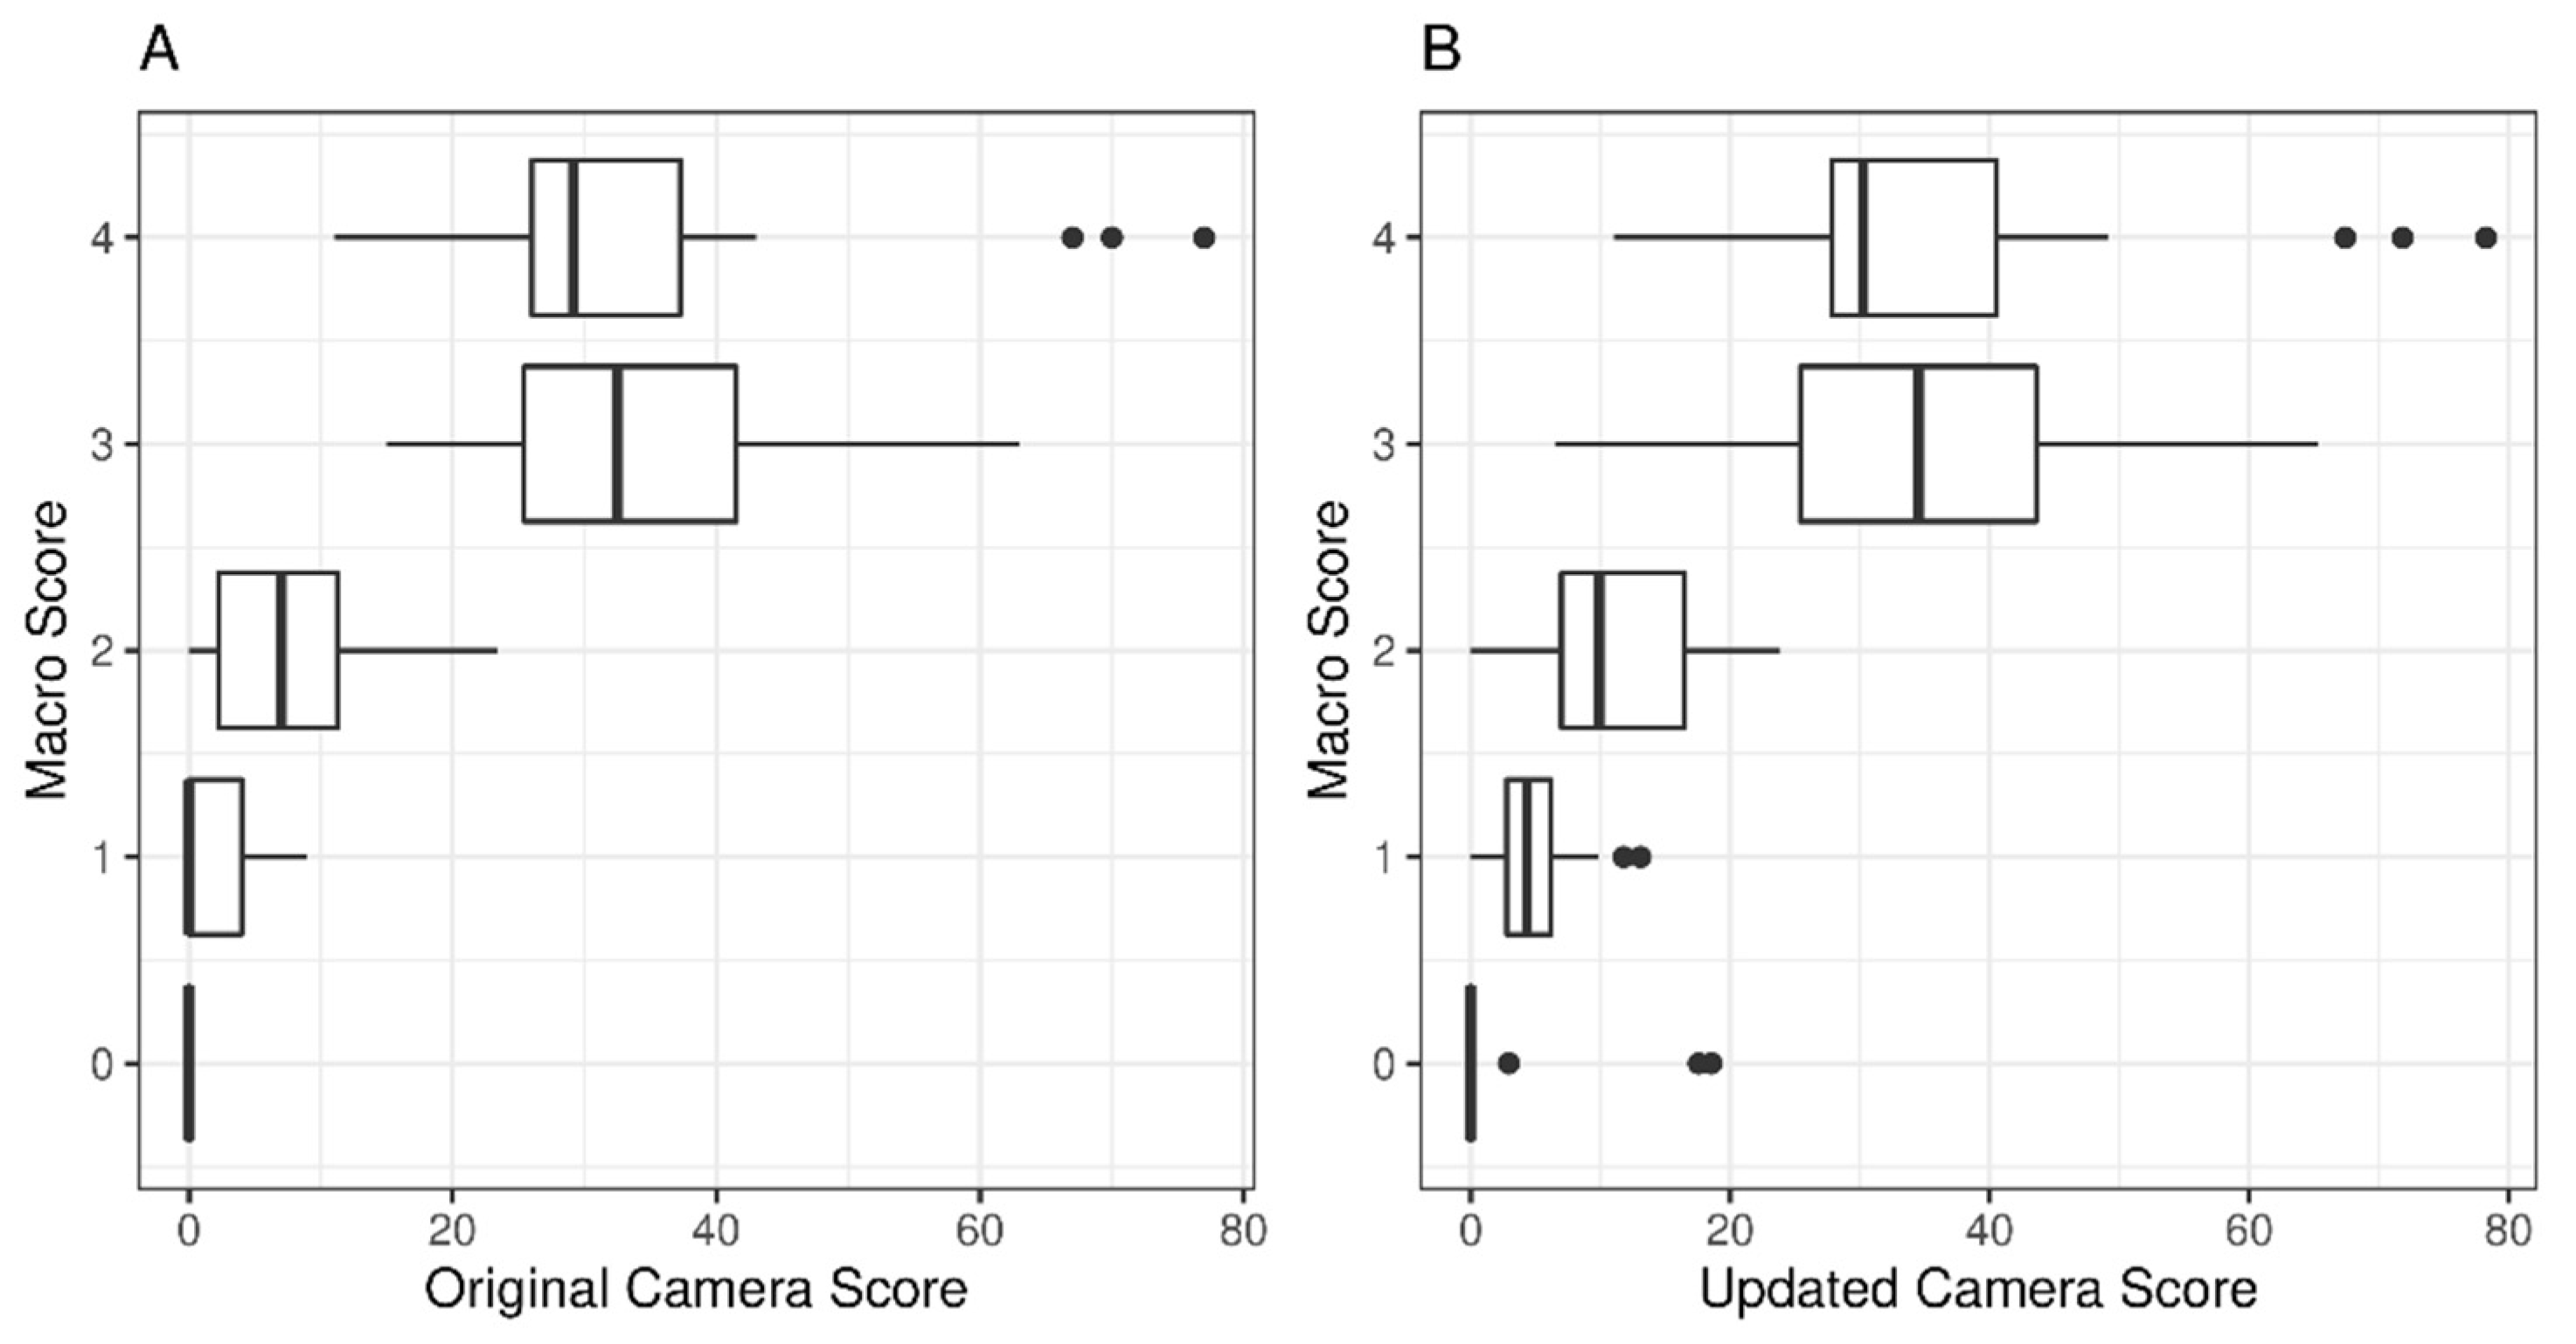
3.1. Calibration of the Camera Scores, Threshold Values
3.2. Validation of Threshold Values
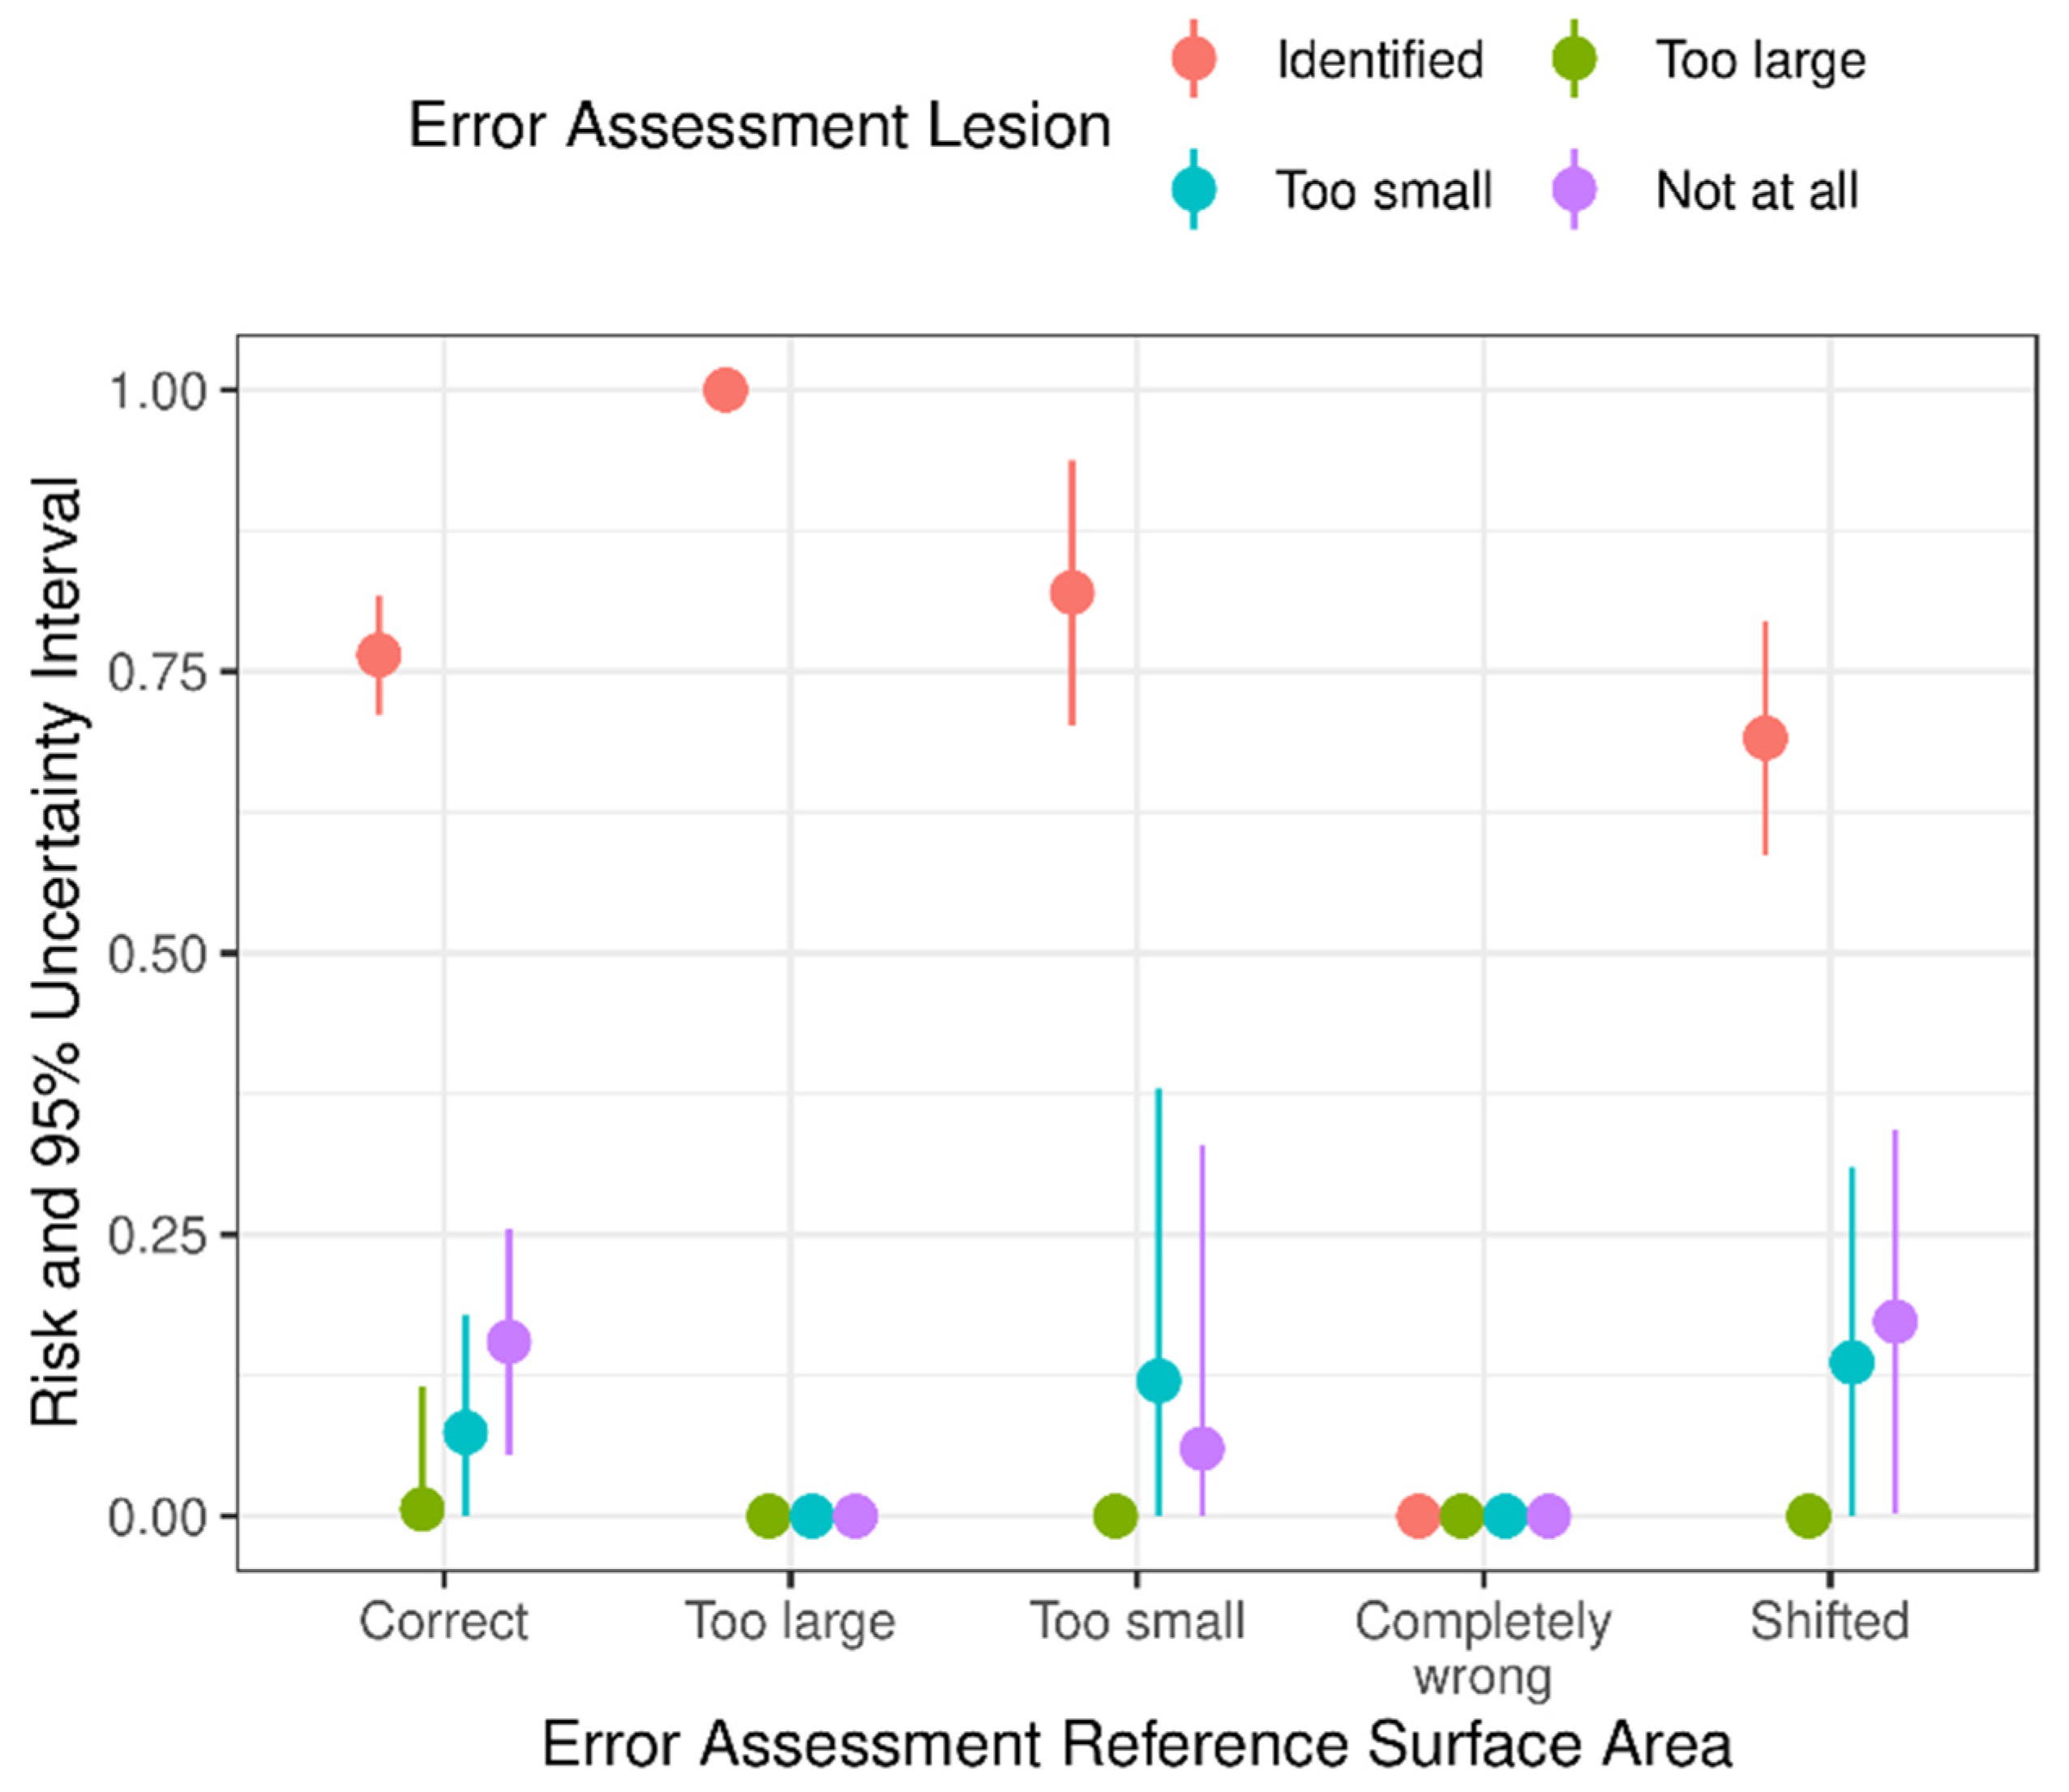
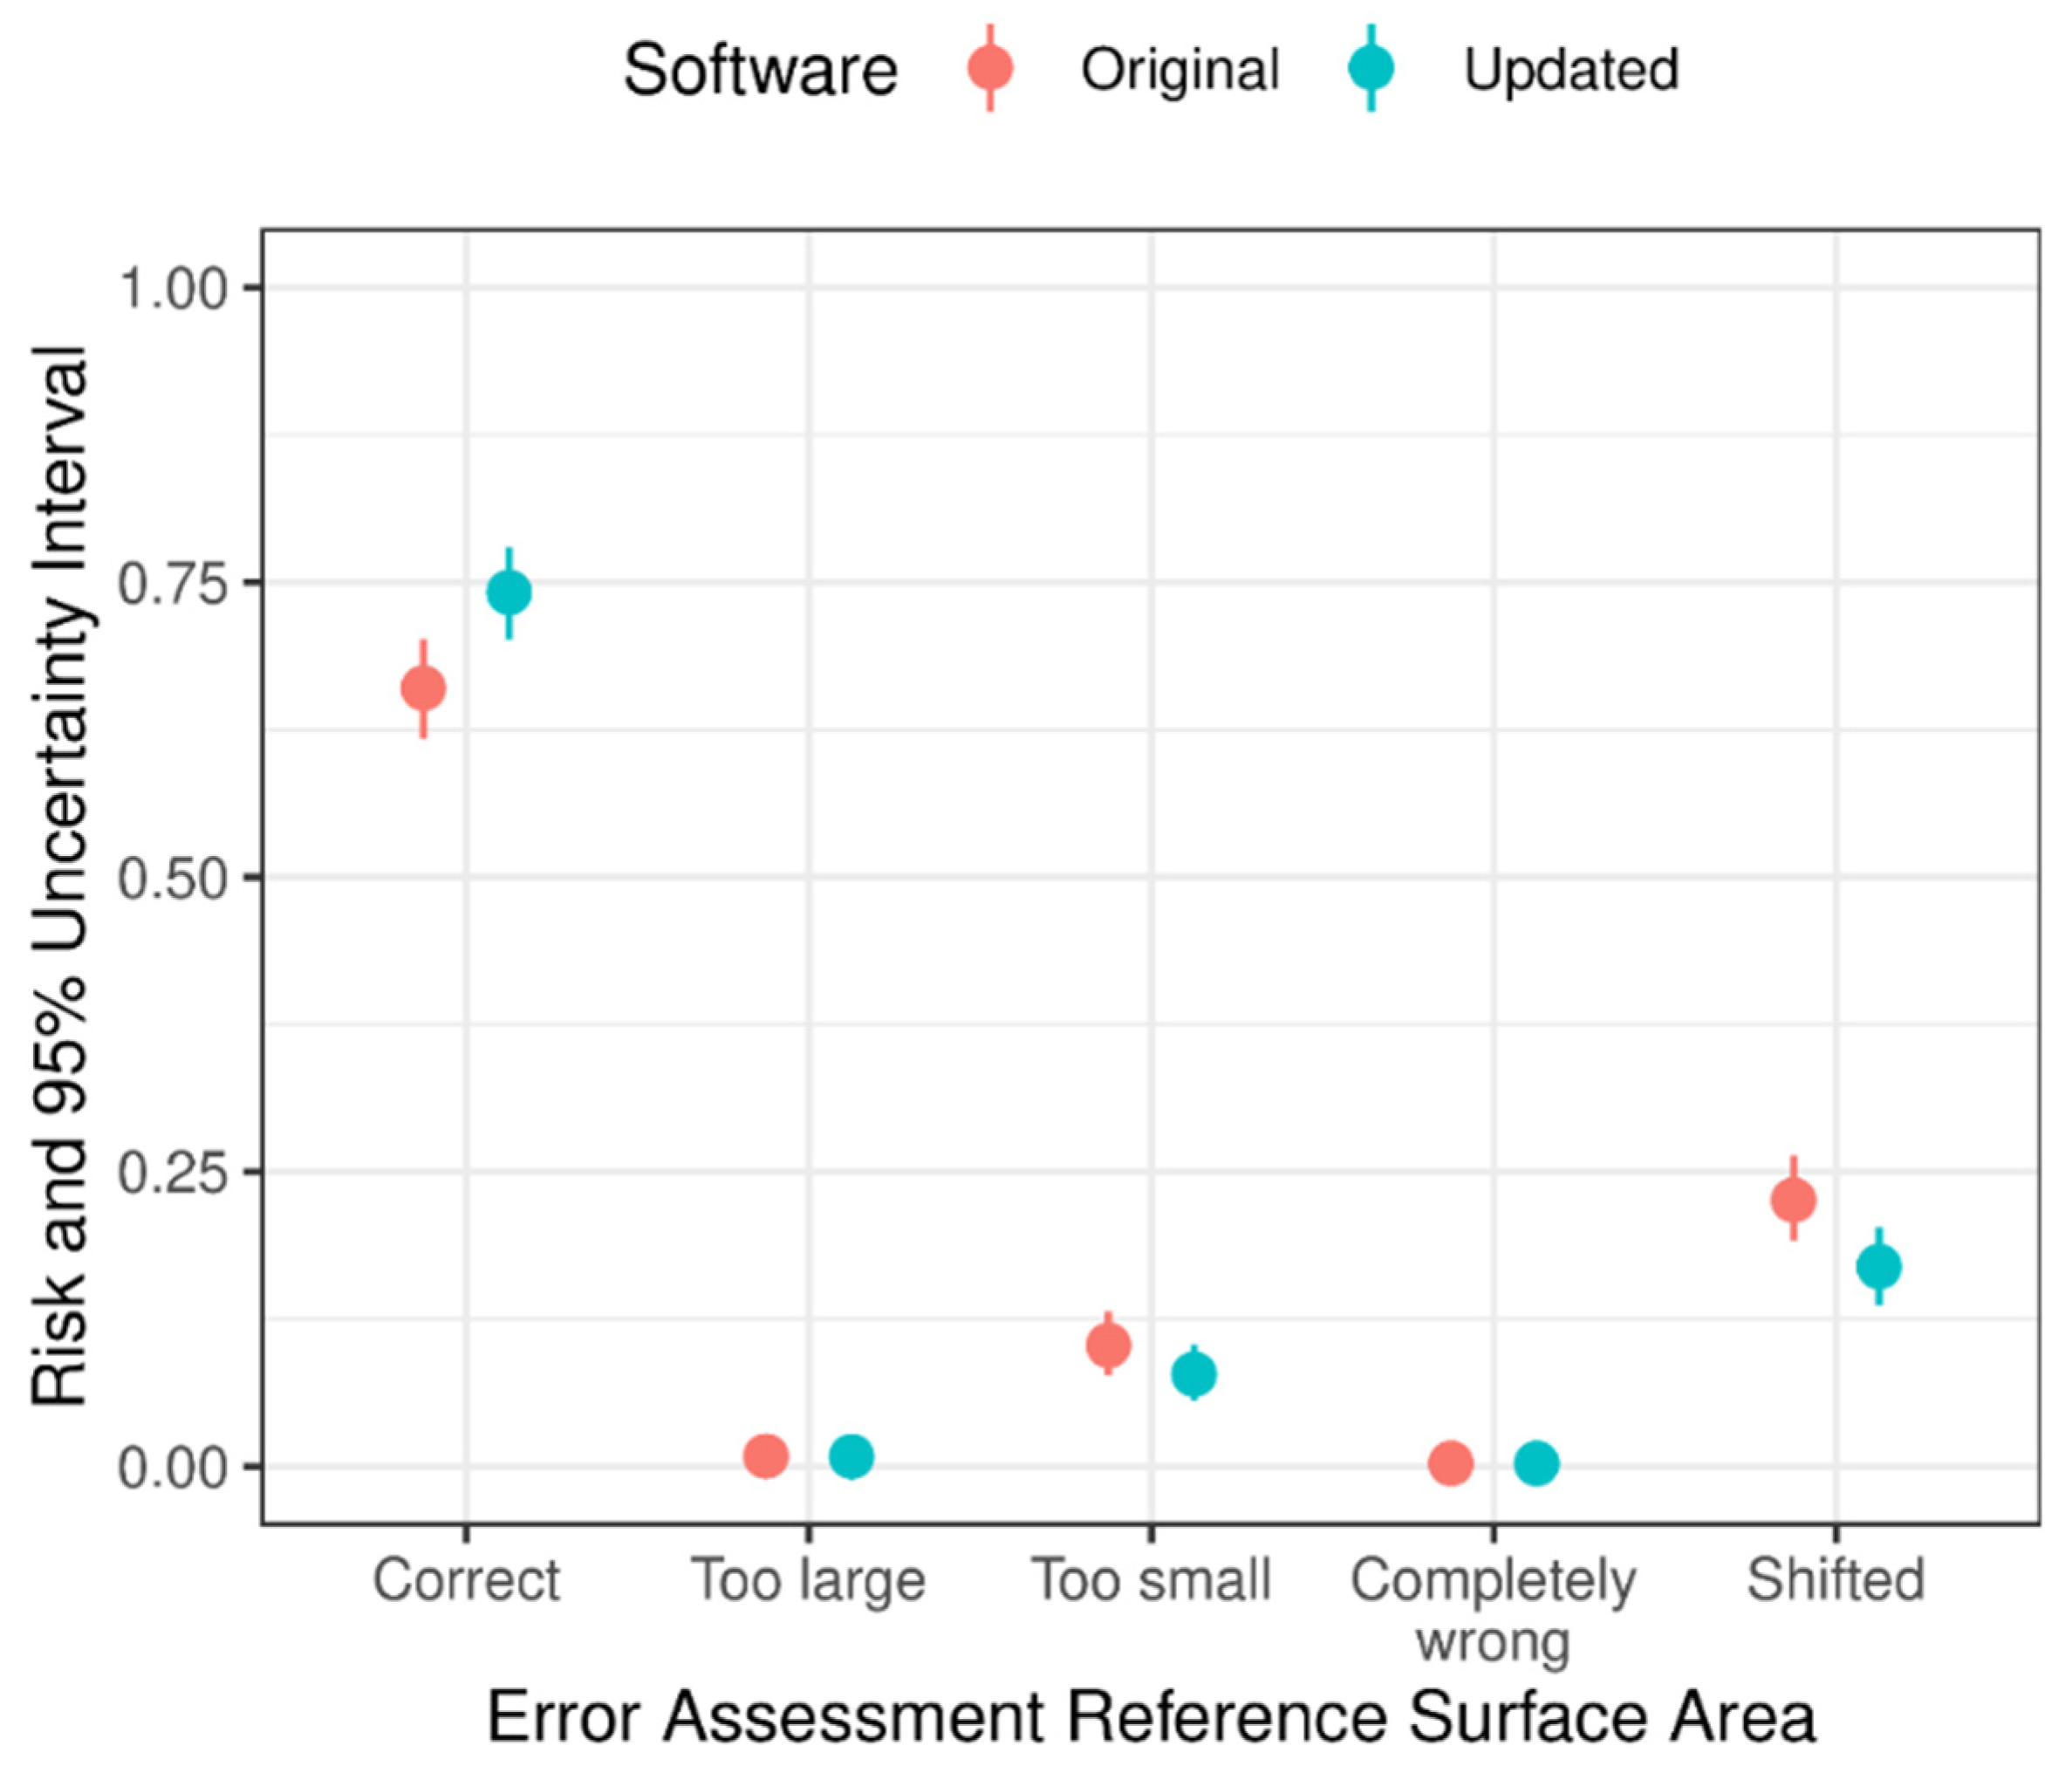
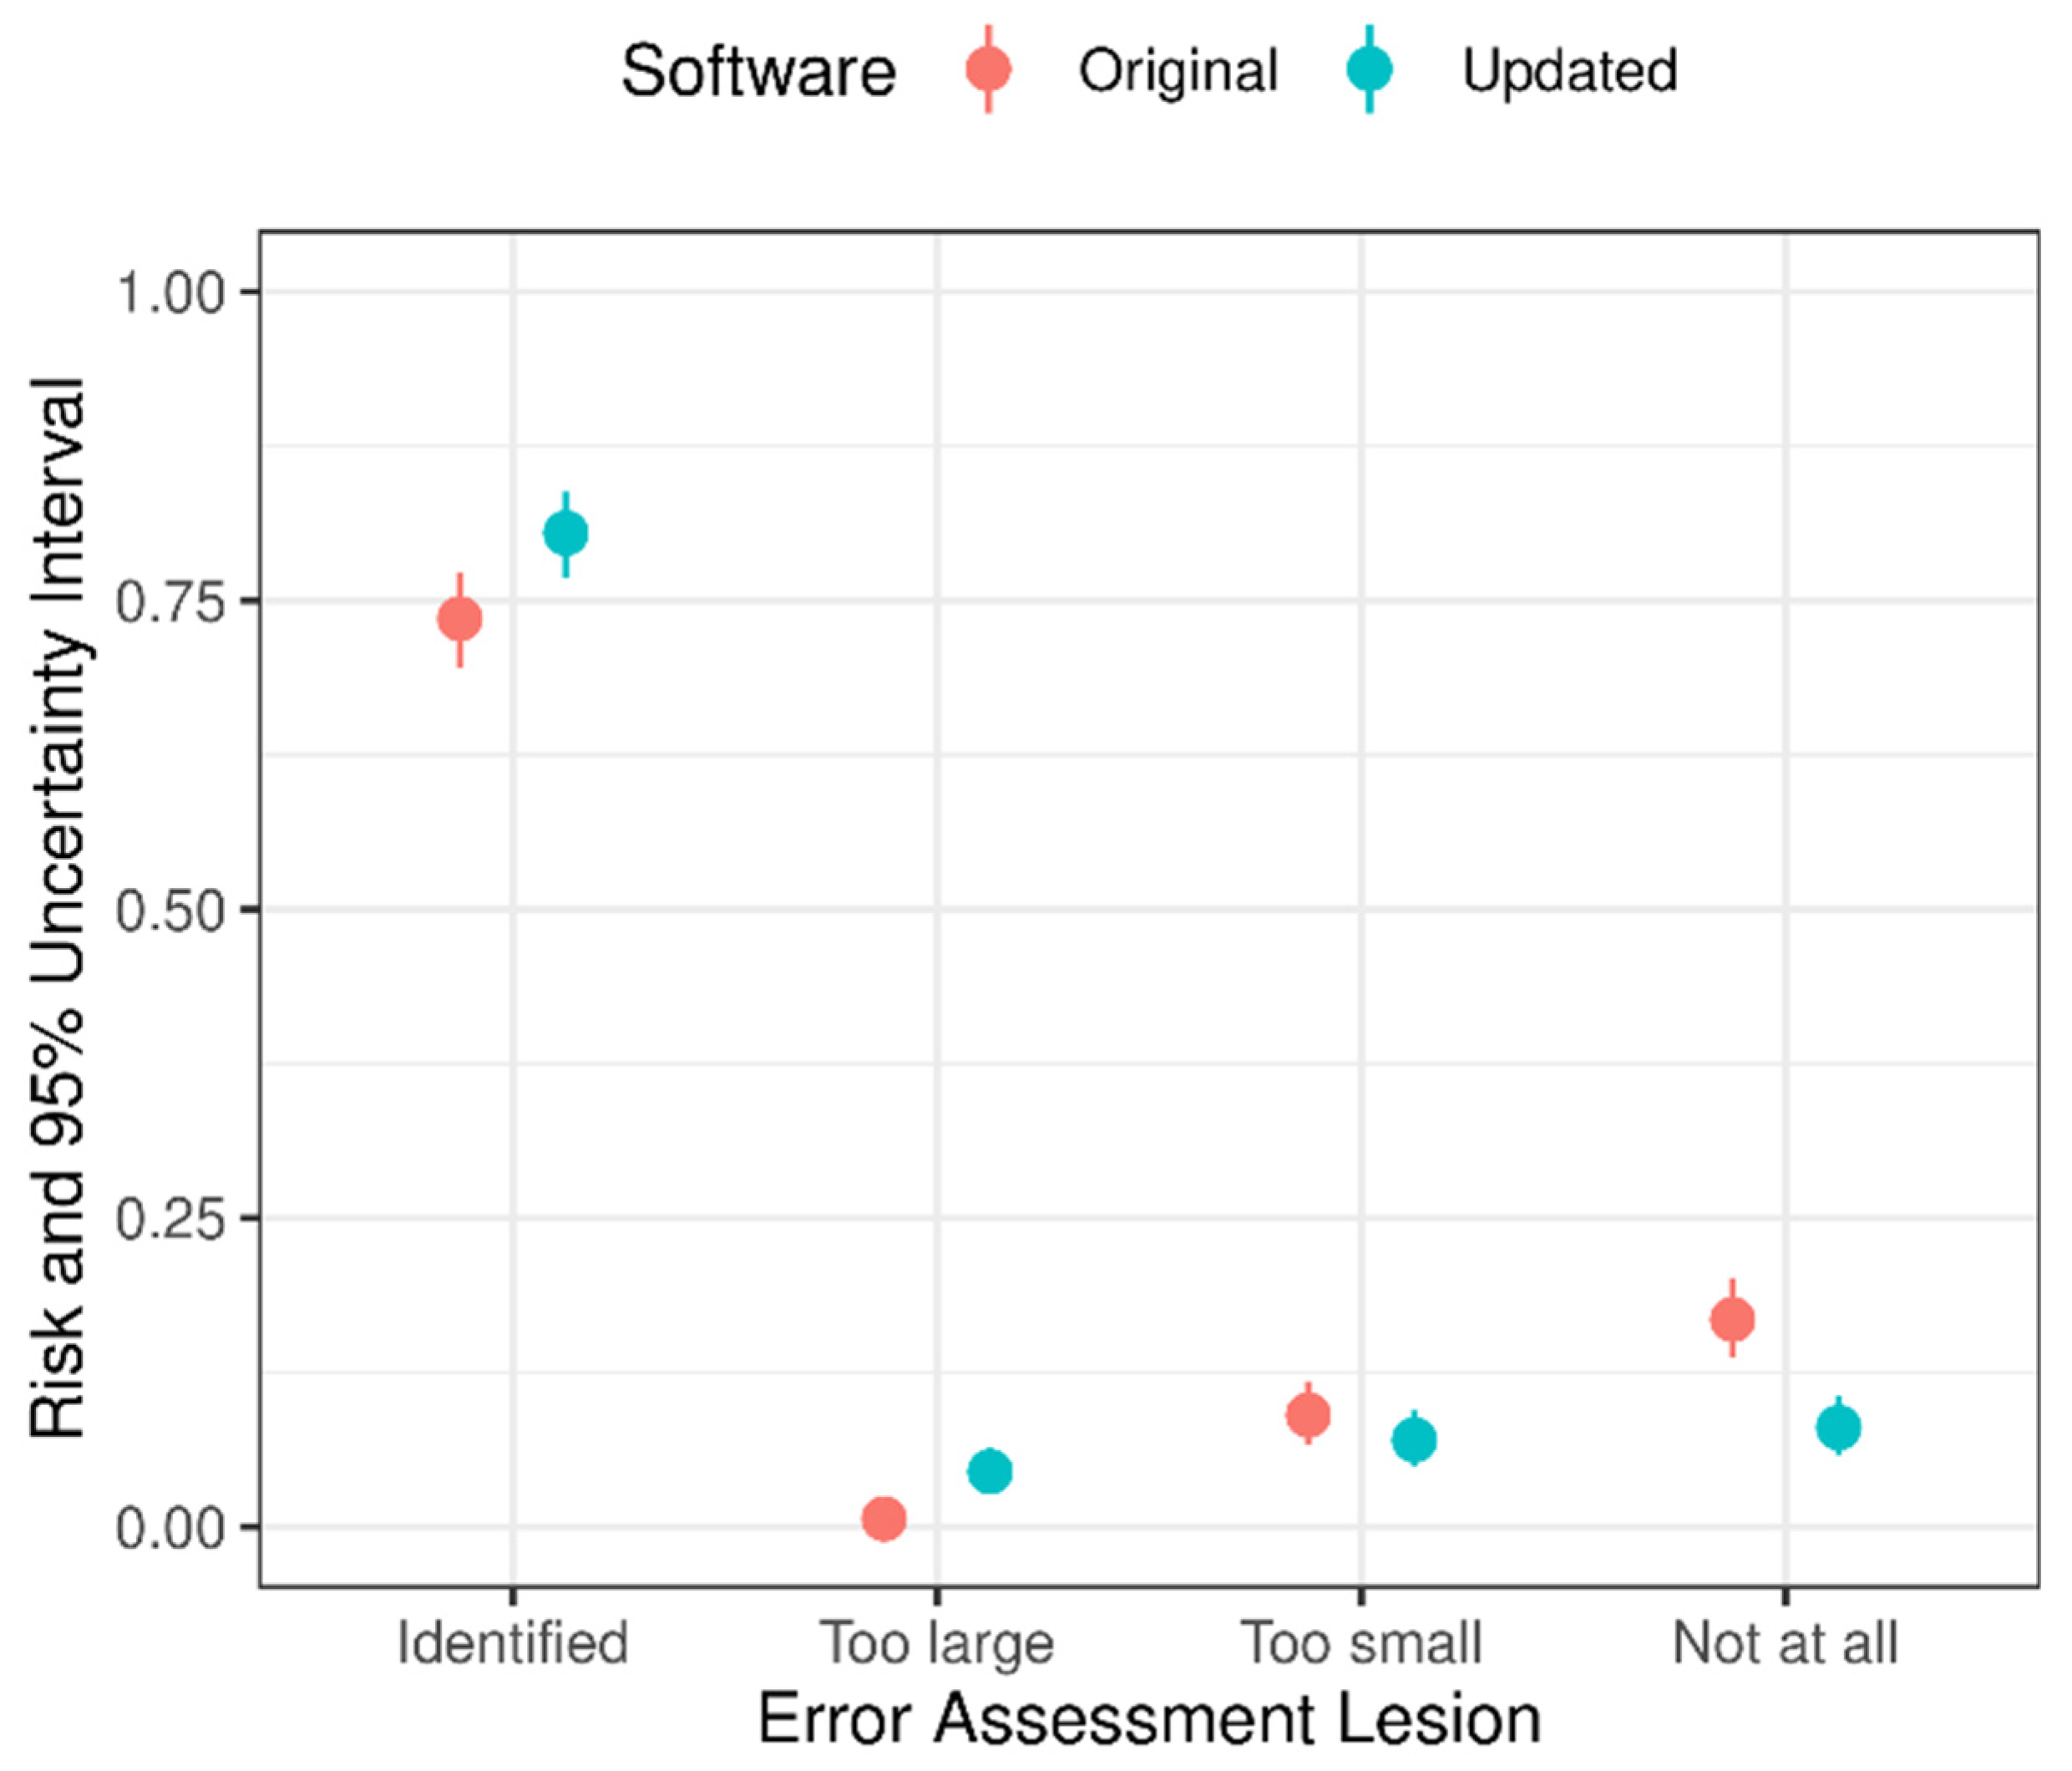
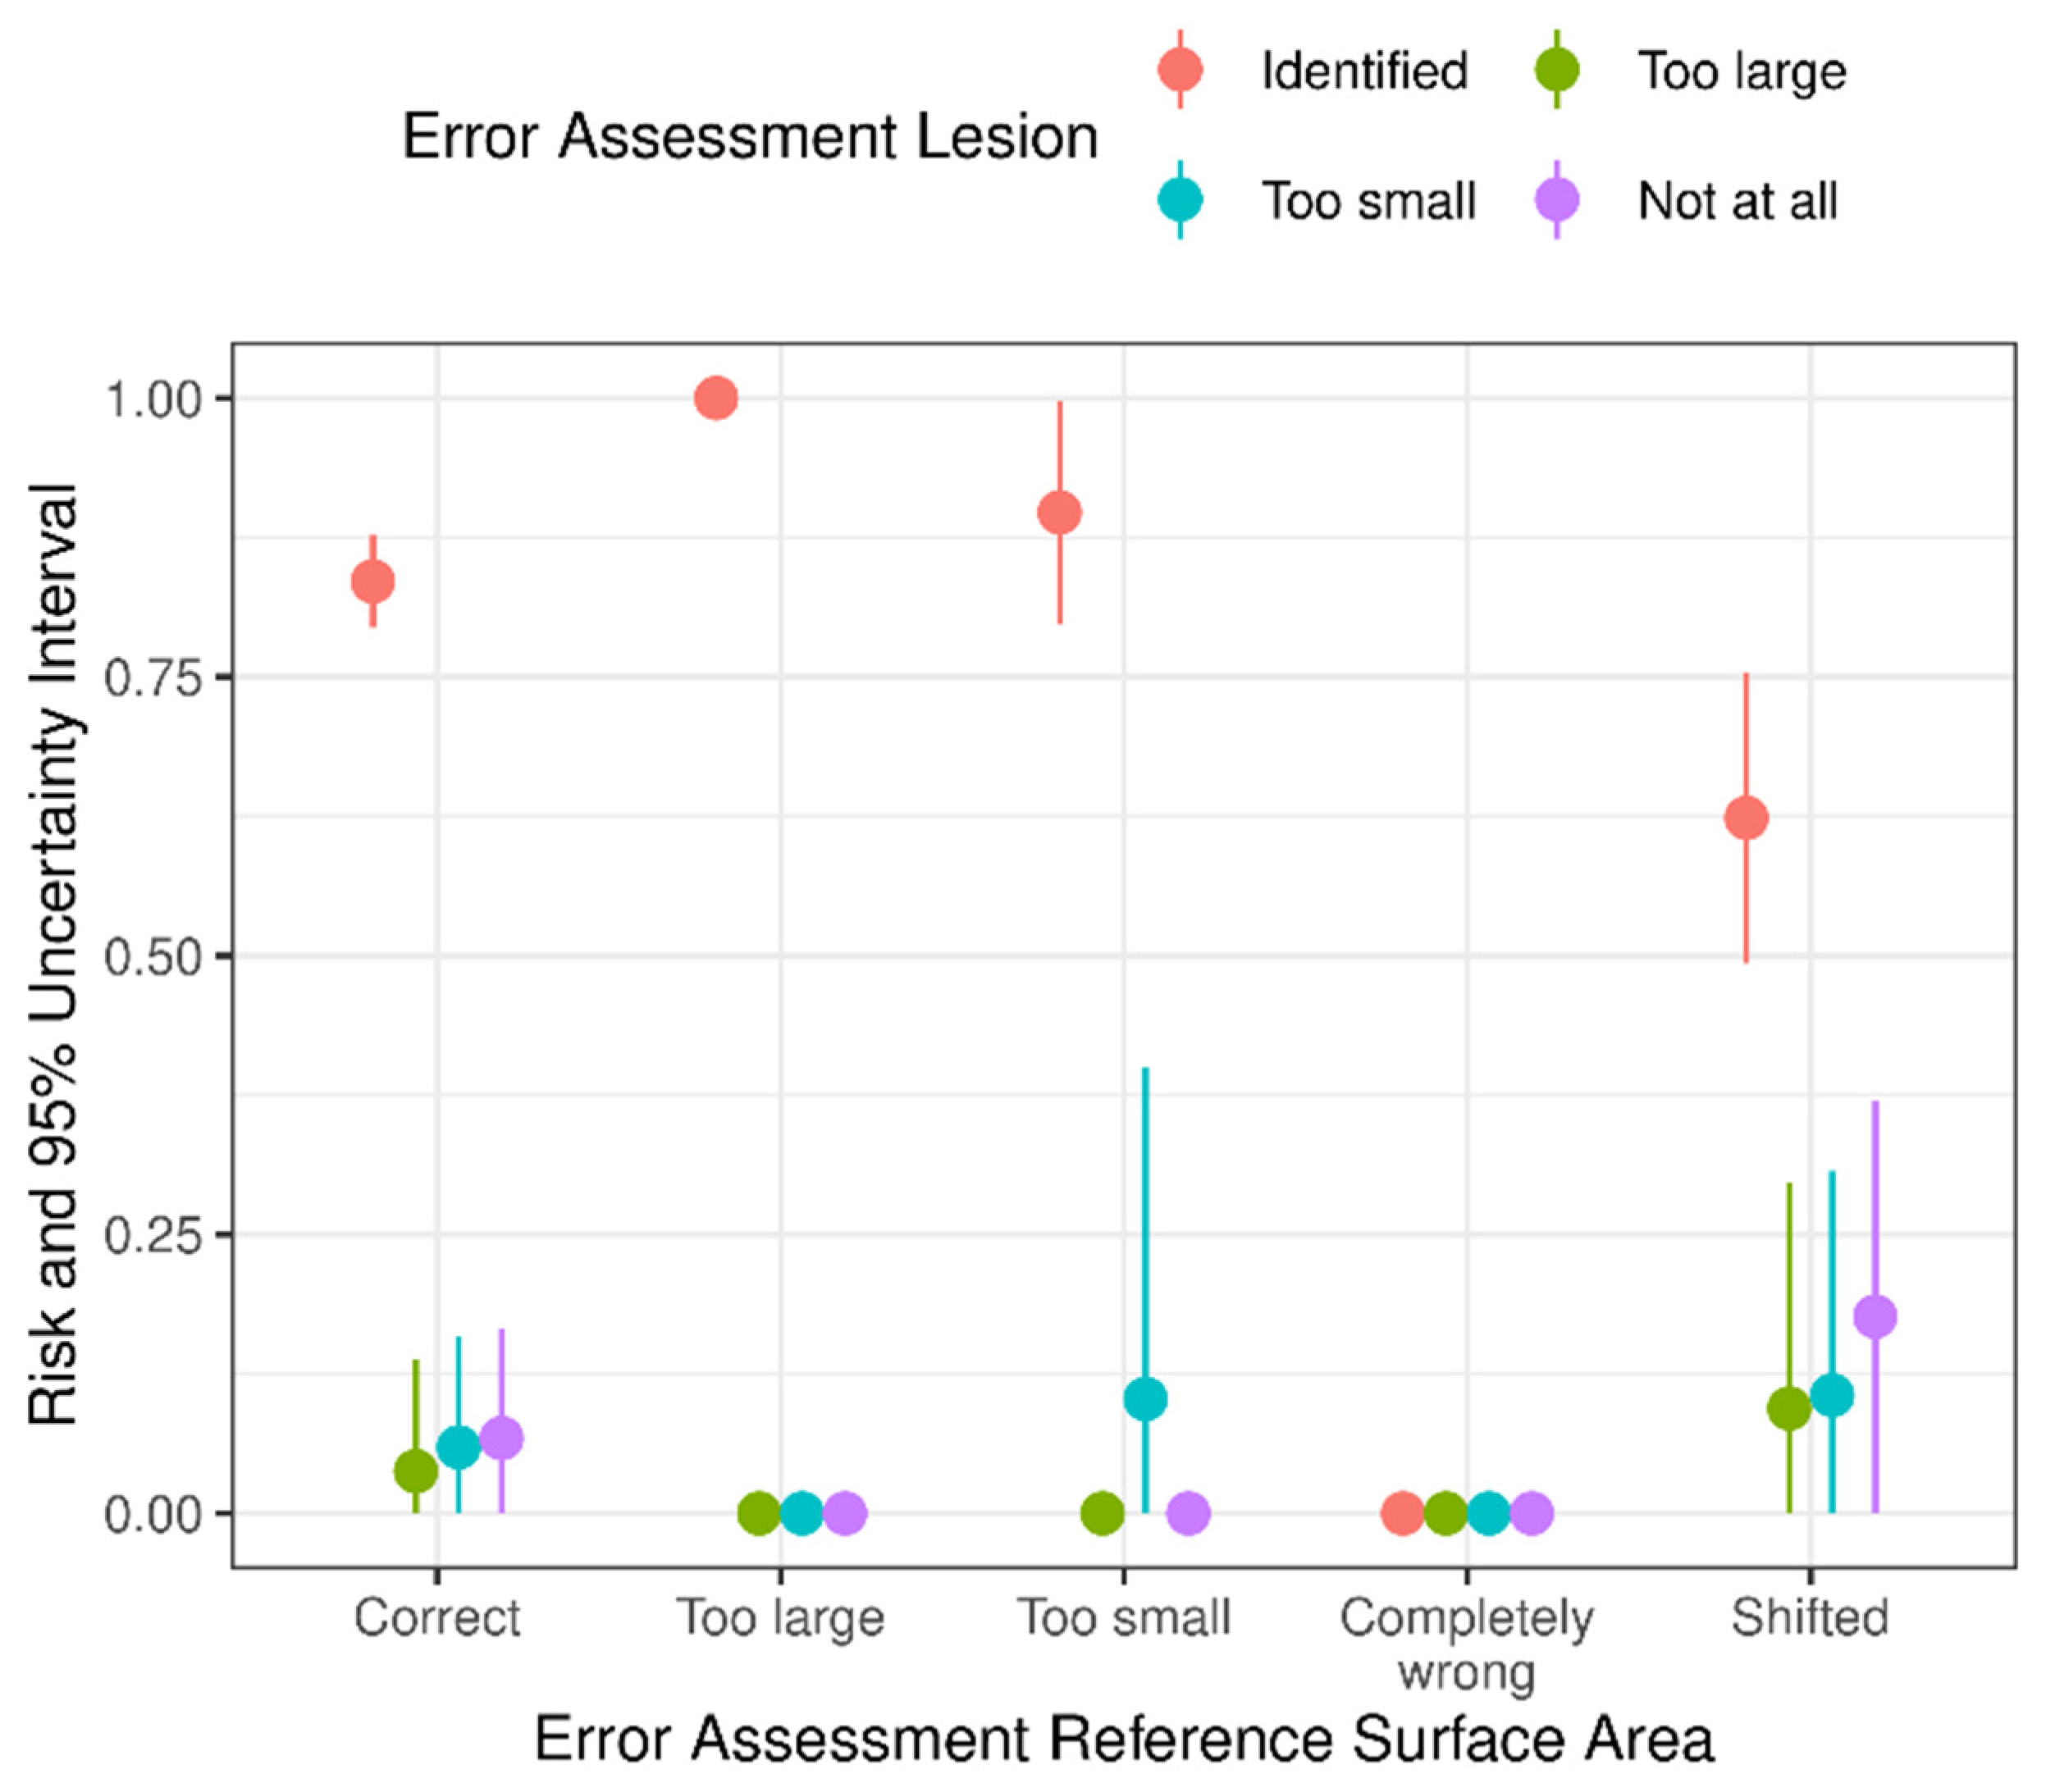
3.3. Errors in Assessments of Reference Surface Area of Foot Pads and Lesions
3.4. Effects of Temperature, Humidity, and Light Intensity on Errors
4. Conclusions
Supplementary Materials
Author Contributions
Funding
Institutional Review Board Statement
Informed Consent Statement
Data Availability Statement
Acknowledgments
Conflicts of Interest
References
- Saraiva, S.; Saraiva, C.; Stilwell, G. Feather conditions and clinical scores as indicators of broilers welfare at the slaughterhouse. Res. Vet. Sci. 2016, 107, 75–79. [Google Scholar] [CrossRef] [PubMed]
- Shepherd, E.M.; Fairchild, B.D. Footpad dermatitis in poultry. Poult. Sci. 2010, 89, 2043–2051. [Google Scholar] [CrossRef] [PubMed]
- Algers, B.; Berg, C. Monitoring animal welfare on commercial broiler farms in Sweden. Acta Agric. Scand. A Anim. Sci. 2001, 51, 88–92. [Google Scholar] [CrossRef]
- Martland, M.F. Ulcerative dermatitis in broiler chickens: The effects of wet litter. Avian Pathol. 1985, 14, 353–364. [Google Scholar] [CrossRef]
- Kyvsgaard, N.C.; Jensen, H.B.; Ambrosen, T.; Toft, N. Temporal changes and risk factors for foot-pad dermatitis in Danish broilers. Poult. Sci. 2013, 92, 26–32. [Google Scholar] [CrossRef]
- Berk, J. Fußballendermatitis bei männlichen Broilern in Abhähgigkeit von unterschiedlichen Einstreuarten. Landbauforsch. Völkenrode 2007, 57, 171–178. [Google Scholar]
- Bilgili, S.F.; Hess, J.B.; Blake, J.P.; Macklin, K.S.; Saenmahayak, B.; Sibley, J.L. Influence of bedding material on footpad dermatitis in broiler chickens. J. Appl. Poult. Res. 2009, 18, 583–589. [Google Scholar] [CrossRef]
- McKeegan, D. Foot Pad Dermatitis and Hock Burn in Broilers: Risk Factors, Aetiology and Welfare Consequences; Research Project Final Report; Faculty of Veterinary Medicine, University of Glasgow: Scotland, UK, 2010. [Google Scholar]
- De Jong, I.C.; Gunnink, H.; van Harn, J. Wet litter not only induces footpad dermatitis but also reduces overall welfare, technical performance, and carcass yield in broiler chickens. J. Appl. Poult. Res. 2014, 23, 51–58. [Google Scholar] [CrossRef]
- Welfare Quality®. Welfare Quality® Assessment Protocol for Poultry (Broilers, Laying Hens); Welfare Quality® Consortium: Lelystad, The Netherlands, 2009. [Google Scholar]
- Ekstrand, C.; Carpenter, T.E.; Andersson, I.; Algers, B. Prevalence and control of foot-pad dermatitis in broilers in Sweden. Br. Poult. Sci. 1998, 39, 318–324. [Google Scholar] [CrossRef]
- Lund, V.P.; Nielsen, L.R.; Oliveira, A.R.S.; Christensen, J.P. Evaluation of the Danish footpad lesion surveillance in conventional and organic broilers: Misclassification of scoring. Poult. Sci. 2017, 96, 2018–2028. [Google Scholar] [CrossRef]
- Heitmann, S.; Stracke, J.; Petersen, H.; Spindler, B.; Kemper, N. First approach validating a scoring system for foot-pad dermatitis in broiler chickens developed for application in practice. Prev. Vet. Med. 2018, 154, 63–70. [Google Scholar] [CrossRef] [PubMed]
- Riber, A.B.; Rangstrup-Christensen, L.; Hansen, M.S.; Hinrichsen, L.K.; Herskin, M.S. Characterisation of footpad lesions in organic and conventional broilers. Animal 2020, 14, 119–128. [Google Scholar] [CrossRef] [PubMed]
- Louton, H.; Erhard, M.; Wirsch, K.; Bergmann, S.; Piller, A.; Schmidt, P.; Rauch, E. Comparison of four assessment methods of foot pad dermatitis and hock burn of broilers. Berl. Münch. Tierärztl. Wochenschr. 2020, 133, 1–11. [Google Scholar] [CrossRef]
- Piller, A.; Bergmann, S.; Schwarzer, A.; Erhard, M.; Stracke, J.; Spindler, B.; Kemper, N.; Schmidt, P.; Bachmeier, J.; Schade, B.; et al. Validation of histological and visual scoring systems for foot-pad dermatitis in broiler chickens. Anim. Welf. 2020, 29, 185–196. [Google Scholar] [CrossRef]
- Michel, V.; Prampart, E.; Mirabito, L.; Allain, V.; Arnould, C.; Huonnic, D.; Le Bouquin, S.; Albaric, C. Histologically-validated footpad dermatitis scoring system for use in chicken processing plants. Br. Poult. Sci. 2012, 53, 275–281. [Google Scholar] [CrossRef] [PubMed]
- German Order on the Protection of Animals and the Keeping of Production Animals; Amended and Promulgated on 22 August 2006, Last Changed on 5 February 2014; Bundesministerium der Justiz: Berlin, Germany, 2014.
- Implementary Rules of the Lower Saxonian Ministry of Nutrition. Agriculture and consumer protection for §20 (4; 5). Latest Edition: 31 July 2015, from the German Order on the Protection of Animals and the Keeping of Production Animals (2006). Available online: https://www.voris.niedersachsen.de/jportal/?quelle=jlink&psml=bsvorisprod.psml&feed=bsvoris-vv&docid=VVND-VVND000041583#ivz5 (accessed on 16 October 2021).
- Bessei, W. Welfare of broilers: A review. World Poult. Sci. 2006, 62, 455–466. [Google Scholar] [CrossRef]
- Allain, V.; Mirabito, L.; Arnould, C.; Colas, M.; Le Bouquin, S.; Lupo, C.; Michel, V. Skin lesions in broiler chickens measured at the slaughterhouse: Relationships between lesions and between their prevalence and rearing factors. Br. Poult. Sci. 2009, 50, 407–417. [Google Scholar] [CrossRef]
- Louton, H.; Erhard, M.; Wöhr, A.C. Acquisition of animal based welfare measures at slaughter of poultry. Fleischwirtschaft 2018, 11, 94–98. [Google Scholar]
- Leitfaden. Befunddaten in der Geflügelschlachtung. Version 01.01.2022; QS Fachgesellschaft Geflügel GmbH: Bonn, Germany, 2022. [Google Scholar]
- De Jong, I.; Reimert, H.; Vanderhasselt, R.; Gerritzen, M.; Gunnink, H.; Hindle, V.; Lourens, S. Development of Methods to Monitor Foot Pad Lesions in Broiler Chickens; Wageningen UR Livestock Research: Lelystad, The Netherlands, 2011. [Google Scholar]
- De Jong, I.C.; van Harn, J.; Gunnink, H.; Lourens, A.; van Riel, J.W. Measuring foot-pad lesions in commercial broiler houses. Some aspects of methodology. Anim. Welf. 2012, 21, 325–330. [Google Scholar] [CrossRef]
- European Commission Directorate-General for Health and Food Safety. Use of Slaughterhouse Data to Monitor Welfare of Broilers on Farm; Luxembourg Publications Office of the European Union: Luxembourg, 2016. [Google Scholar]
- Ben Sassi, N.; Averós, X.; Estevez, I. Technology and poultry welfare. Animals 2016, 6, 62. [Google Scholar] [CrossRef] [Green Version]
- Byrt, T.; Bishop, J.; Carlin, J.B. Bias, prevalence and kappa. J. Clin. Epidemiol. 1993, 46, 423–429. [Google Scholar] [CrossRef]
- R Core Team. R: A Language and Environment for Statistical Computing; R Foundation for Statistical Computing: Vienna, Austria, 2021; Available online: https://www.R-project.org (accessed on 5 January 2022).
- Louton, H.; Piller, A.; Bergmann, S.; Erhard, M.; Stracke, J.; Spindler, B.; Kemper, N.; Schmidt, P.; Schade, B.; Boehm, B.; et al. Histologically validated scoring system for the assessment of hock burn in broilers. Avian Pathol. 2020, 49, 230–242. [Google Scholar] [CrossRef] [PubMed]
- Landis, R.J.; Koch, G.G. The M measurement of observer agreement for categorical data. Biometrics 1977, 33, 159–174. [Google Scholar] [CrossRef] [PubMed] [Green Version]
- Dawkins, M.S.; Roberts, S.J.; Cain, R.J.; Nickson, T.; Donnelly, C.A. Early warning of footpad dermatitis and hockburn in broiler chicken flocks using optical flow, bodyweight and water consumption. Vet. Rec. 2017, 180, 499. [Google Scholar] [CrossRef] [PubMed] [Green Version]
- Hoffmann, G.; Ammon, C.; Volkamer, L.; Sürie, C.; Radko, D. Sensor-based monitoring of the prevalence and severity of foot pad dermatitis in broiler chickens. Br. Poult. Sci. 2013, 54, 553–561. [Google Scholar] [CrossRef] [PubMed]
- Jung, L.; Nasirahmadi, A.; Schulte-Landwehr, J.; Knierim, U. Automatic assessment of keel bone damage in laying hens at the slaughter line. Animals 2021, 11, 163. [Google Scholar] [CrossRef]
- De Jong, I.C.; Gerritzen, M.; Reimert, H.; Fritsma, E.; Pieterse, C. Automated measurement of foot pad lesions in broiler chickens. In Proceedings of the 4th International Workshop on the Assessment of Animal Welfare at Farm & Group Level, Ghent, Belgium, 10–13 September 2008; p. 32. [Google Scholar]
- Vanderhasselt, R.F.; Sprenger, M.; Duchateau, L.; Tuyttens, F.A.M. Automated assessment of footpad dermatitis in broiler chickens at the slaughter-line: Evaluation and correspondence with human expert scores. Poult. Sci. 2013, 92, 12–18. [Google Scholar] [CrossRef]
- Oliveira, A.R.S.; Lund, V.P.; Christensen, J.P.; Nielsen, L.R. Inter-rater agreement in visual assessment of footpad dermatitis in Danish broiler chickens. Br. Poult. Sci. 2017, 58, 224–229. [Google Scholar] [CrossRef]


| Macro Score | Visual Picture | Original Camera Score | Original Camera Picture | Updated Camera Score | Updated Camera Picture |
|---|---|---|---|---|---|
| 0 |  | 0 |  | 0 |  |
| 1 |  | 4.17 | 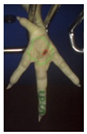 | 5.30 |  |
| 1 | 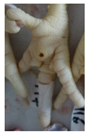 | 3.98 | 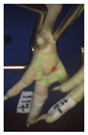 | 5.44 | 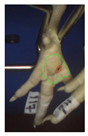 |
| 2 | 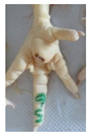 | 7.96 | 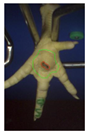 | 10.20 | 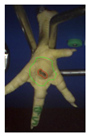 |
| 3 | 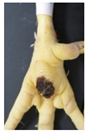 | 29.67 |  | 29.01 | 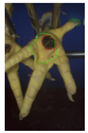 |
| 4 |  | 26.43 |  | 30.22 |  |
| 4 | 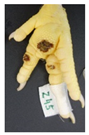 | 23.63 | 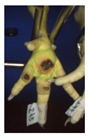 | 24.48 |  |
| Macro Score | Minimum | Maximum |
|---|---|---|
| Original Camera Score | ||
| 0 | 0.00 | 0.00 |
| 1 | 0.01 | 1.44 |
| 2 | 1.45 | 12.65 |
| 3 | 12.66 | Infinite |
| Updated Camera Score | ||
| 0 | 0.00 | 0.35 |
| 1 | 0.36 | 4.00 |
| 2 | 4.01 | 16.67 |
| 3 | 16.68 | Infinite |
| Prediction (n = 200 feet) | Performance | |||||||
|---|---|---|---|---|---|---|---|---|
| Original Camera Score | ||||||||
| <0.01 | 0.01 to 1.44 | 1.45 to 12.65 | ≥12.66 | Accuracy = 0.70 | ||||
| Macro Score | 0 | 1 | 2 | 3 | Sens | Spec | PPV | NPV |
| 0 | 40 | 0 | 0 | 0 | 1.00 | 0.80 | 0.56 | 1.00 |
| 1 | 22 | 0 | 18 | 0 | 0.00 | 1.00 | - | 0.80 |
| 2 | 10 | 0 | 21 | 9 | 0.52 | 0.88 | 0.52 | 0.88 |
| 3 | 0 | 0 | 1 | 79 | 0.99 | 0.92 | 0.90 | 0.99 |
| <1.45 | 1.45 to 12.65 | ≥12.66 | Accuracy = 0.81 | |||||
| Macro Score | 0 + 1 | 2 | 3 | Sens | Spec | PPV | NPV | |
| 0 + 1 | 62 | 18 | 0 | 0.78 | 0.92 | 0.86 | 0.86 | |
| 2 | 10 | 21 | 9 | 0.52 | 0.88 | 0.52 | 0.88 | |
| 3 | 0 | 1 | 79 | 0.99 | 0.92 | 0.90 | 0.99 | |
| Updated Camera Score | ||||||||
| <0.36 | 0.36 to 4.00 | 4.01 to 16.67 | ≥16.68 | Accuracy = 0.76 | ||||
| Macro Score | 0 | 1 | 2 | 3 | Sens | Spec | PPV | NPV |
| 0 | 37 | 1 | 0 | 2 | 0.92 | 0.94 | 0.79 | 0.98 |
| 1 | 9 | 9 | 22 | 0 | 0.22 | 0.98 | 0.75 | 0.84 |
| 2 | 1 | 2 | 28 | 9 | 0.70 | 0.84 | 0.53 | 0.92 |
| 3 | 0 | 0 | 3 | 77 | 0.96 | 0.91 | 0.88 | 0.97 |
| Prediction (n = 500 feet) | Performance | |||||||
|---|---|---|---|---|---|---|---|---|
| Original Camera Score | ||||||||
| <0.01 | 0.01 to 1.44 | 1.45 to 12.65 | ≥12.66 | Accuracy = 0.70 | ||||
| Macro Score | 0 | 1 | 2 | 3 | Sens | Spec | PPV | NPV |
| 0 | 82 | 0 | 3 | 0 | 0.96 | 0.81 | 0.51 | 0.99 |
| 1 | 43 | 0 | 40 | 3 | 0.00 | 1.00 | - | 0.83 |
| 2 | 18 | 0 | 77 | 64 | 0.48 | 0.83 | 0.57 | 0.78 |
| 3 | 17 | 0 | 14 | 139 | 0.82 | 0.80 | 0.67 | 0.89 |
| Updated Camera Score | ||||||||
| <0.36 | 0.36 to 4.00 | 4.01 to 16.67 | ≥16.68 | Accuracy = 0.76 | ||||
| Macro Score | 0 | 1 | 2 | 3 | Sens | Spec | PPV | NPV |
| 0 | 74 | 4 | 7 | 0 | 0.87 | 0.93 | 0.73 | 0.97 |
| 1 | 19 | 16 | 50 | 1 | 0.19 | 0.98 | 0.70 | 0.85 |
| 2 | 3 | 1 | 114 | 41 | 0.72 | 0.76 | 0.58 | 0.85 |
| 3 | 5 | 2 | 25 | 138 | 0.81 | 0.87 | 0.77 | 0.90 |
Publisher’s Note: MDPI stays neutral with regard to jurisdictional claims in published maps and institutional affiliations. |
© 2022 by the authors. Licensee MDPI, Basel, Switzerland. This article is an open access article distributed under the terms and conditions of the Creative Commons Attribution (CC BY) license (https://creativecommons.org/licenses/by/4.0/).
Share and Cite
Louton, H.; Bergmann, S.; Piller, A.; Erhard, M.; Stracke, J.; Spindler, B.; Schmidt, P.; Schulte-Landwehr, J.; Schwarzer, A. Automatic Scoring System for Monitoring Foot Pad Dermatitis in Broilers. Agriculture 2022, 12, 221. https://doi.org/10.3390/agriculture12020221
Louton H, Bergmann S, Piller A, Erhard M, Stracke J, Spindler B, Schmidt P, Schulte-Landwehr J, Schwarzer A. Automatic Scoring System for Monitoring Foot Pad Dermatitis in Broilers. Agriculture. 2022; 12(2):221. https://doi.org/10.3390/agriculture12020221
Chicago/Turabian StyleLouton, Helen, Shana Bergmann, Andre Piller, Michael Erhard, Jenny Stracke, Birgit Spindler, Paul Schmidt, Jan Schulte-Landwehr, and Angela Schwarzer. 2022. "Automatic Scoring System for Monitoring Foot Pad Dermatitis in Broilers" Agriculture 12, no. 2: 221. https://doi.org/10.3390/agriculture12020221
APA StyleLouton, H., Bergmann, S., Piller, A., Erhard, M., Stracke, J., Spindler, B., Schmidt, P., Schulte-Landwehr, J., & Schwarzer, A. (2022). Automatic Scoring System for Monitoring Foot Pad Dermatitis in Broilers. Agriculture, 12(2), 221. https://doi.org/10.3390/agriculture12020221