Abstract
Soybean is a legume that is grown worldwide for its edible bean. Intra-row weeds greatly hinder the normal growth of soybeans. The continuous emergence of herbicide-resistant weeds and the increasing labor costs of weed control are affecting the profitability of growers. The existing cultivation technology cannot control the weeds in the crop row which are highly competitive with the soybean in early growth stages. There is an urgent need to develop an automated weeding technology for intra-row weed control. The prerequisite for performing weeding operations is to accurately determine the plant location in the field. The purpose of this study is to develop a plant localization technique based on systemic crop signalling to automatically detect the appearance of soybean. Rhodamine B (Rh-B) is a signalling compound with a unique fluorescent appearance. Different concentrations of Rh-B were applied to soybean based on seed treatment for various durations prior to planting. The potential impact of Rh-B on seedling growth in the outdoor environment was evaluated. Both 60 and 120 ppm of Rh-B were safe for soybean plants. Higher doses of Rh-B resulted in greater absorption. A three-dimensional plant localization algorithm was developed by analyzing the fluorescence images of multiple views of plants. The soybean location was successfully determined with the accuracy of 97%. The Rh-B in soybean plants successfully created a machine-sensible signal that can be used to enhance weed/crop differentiation, which is helpful for performing automatic weeding tasks in weeders.
1. Introduction
As an important source of high-quality protein, dietary fiber, polyunsaturated fats and minerals, soybean is widely grown worldwide [1]. Weed damage is one of the main biological disasters that affect soybean yield, while the intra-row weeds are more harmful to the crop [2]. There are many types of common weeds in soybean fields, including gramineous weeds (e.g., crabgrass, goose grass, barnyard grass) and broadleaf weeds (e.g., purslane, cocklebur, dayflower, iron amaranth, quinoa) [3,4,5]. High-density weeds growing together are difficult to distinguish. These weeds that grow synchronously with soybeans compete with them for resources such as sunlight, nutrients and water, making them vulnerable to pests and diseases [6]. The number of weeds in the field accounts for about 95.00% of the total within 3 weeks of soybean sowing [7].
Current weeding techniques cannot reliably remove the weeds in crops. Overuse of chemical herbicides degrades the quality of water, soil, and air [8] and makes weeds resistant to them [9,10]. As a costly and low-efficiency method, manual weeding is not suitable for large-scale weeding operations [11]. Traditional mechanical cultivation can remove weeds between crop rows, but it cannot eliminate the intra-row weeds [12]. The prerequisite for automatic removal of intra-row weeds is to accurately identify the position of the crop plant and to distinguish it from the weeds [13]. Thus, there is an urgent need to establish an automatic localization technique for rapid differentiation of soybean plants.
Computer vision can perceive the differences in the biological morphology, the leaf vein characteristics and the texture of weeds and crops, and then achieve plant recognition based on image processing algorithms [14,15,16]. However, current weeding equipment usually uses two-dimensional (2D) imaging that cannot reliably distinguish high-density weeds. The structured-light based three-dimensional (3D) reconstruction system can obtain more feature information than 2D images by extracting the 3D information of the entire plant [17]. However, this system has high computational complexity and low processing speed, which is not suitable for real-time detections [18]. Machine learning algorithms combined with imaging or spectroscopy techniques have successfully achieved the identification of different agri-food materials [19,20,21,22,23,24,25,26]. As an advanced machine learning algorithm, deep learning algorithms have been widely used for crop recognition and classification in recent years [27,28,29,30]. For instance, Bah et al. [31] proposed a new fully automated learning method based on convolutional neural network (CNN) and unsupervised training datasets to detect weeds in spinach and soybean, yielding high accuracies. However, a large and representative data set is needed to train the network, and the multi-seasonal stability of the training data has not been verified. The morphology of weeds and crops changes as they grow, which makes it more difficult to extract plant features [32].
Unlike using color models, such as RGB, L*a*b*, and HSV for image analysis [33,34], crop plant signaling is a new technology that creates a machine-readable crop plant using fluorescent compounds applied to them to distinguish the crops from weeds [35]. Fluorescent markers have unique properties that are different from plant autofluorescence [36]. The fluorophore molecule of a signaling compound can emit light of longer wavelength under the excitation light [37]. Currently, three types of fluorescence markers including biological markers (fluorescent proteins), physical markers (plant labels), and chemical markers (systemic compounds and topical markers) have been used to label crops in fields [35]. Rhodamine B (Rh-B) is a chemical marker with unique optical properties [38]. It allows systemic behavior in plants following the seed pathway, which is a promising for real-time weed control. Under irradiation of ultraviolet (UV) or visible light, the systemic Rh-B (molecular weight: 479, log Kow = 1.5, λex/λem = 555/582 nm) molecules will be completely degraded due to the disappearance of organic carbon in the molecular structure, and the final product is carbon dioxide and water (Wilhelm and Stephan, 2007). According to the U.S. Environmental Protection Agency (EPA), seeds treated with low concentrations of Rh-B will not affect crop yield and post-harvest quality, and will not have a negative impact on the environment or public health [39]. Therefore, a certain dose of the signaling compound is safe for seed treatment. Studies have found that that the seed coats of snap bean and soybean have a strong permeability on Rh-B, and this signaling compound can be absorbed by these seeds [40,41]. In addition, the seed coats of most plant seeds (including celery, lettuce, tomato, onion, cucumber, pepper, castor and grass) have no permeability to Rh-B. Su et al. [42] applied Rh-B tracer to snap beans and successfully created machine-readable signals in the cotyledons and the main stems of bean seedlings. However, such signals are readily occluded by growing leaves, making the markers undetectable from the top view. In the study of Raja, et al. [43], fluorescent straws fixed next to the seedlings or topical markers sprayed on the stems and leaves of the seedlings were used to label lettuce and tomato plants. Computer vision algorithms based on a top view and six side views were established to identify the straws, which indirectly realized the positioning of the plants. However, in their studies, each lettuce or tomato plant needs to be labeled in advance, which is a time-consuming and inefficient process. In addition, it is difficult to prevent the markers from being removed by unfavorable weather conditions such as wind and rain.
The novelty of this research is to develop a new computer vision algorithm based on systemic crop signaling to detect and locate soybean plants in real time. The main goal of this research is to develop a reliable computer vision algorithm based on effective doses of systematic markers. Specific objectives are (1) to develop a method of applying systemic Rh–B to soybean, (2) to evaluate the dose effects on plant growth, and (3) to establish a reliable algorithm to identify the localization of soybean plants. To the best of our knowledge, this plant localization method was the first technology used to reliably locate soybean plants.
2. Materials and Methods
2.1. Fluorescent Labeling of Crop Plants
The soybean plants were marked with Rh-B compound by a seed soaking method. In this method, soybean seeds are soaked in a specific concentration of Rh-B dye for a certain period. In this study, two varieties of seeds including large soybean and emerald soybean were soaked in deionized (DI) water or Rh-B solution (60 or 120 mg L−1) for 48 h, respectively. Then, the seeds of the treatment group and the control group were transferred to an environmental chamber for germination. After about 2 days, the germinated seeds (three repetitions for each sample) were planted in plastic seedling pots filled with moist soil (potting mix) and they were watered evenly once a day.
2.2. Fluorescence Imaging System
A fluorescence imaging system was designed to capture soybean images under the illumination of light-emitting diode (LED) lights. The system (Figure 1) mainly consisted of an enclosed chamber (about 0.71 m by 0.63 m by 1.71 m high) with opaque black vinyl walls. The imaging system was controlled by a computer using the astronomy common object model (ASCOM) software. A cooled monochrome complementary metal–oxide–semiconductor (CMOS) camera (ASI1600GT, ZWO Inc., Suzhou, China) was placed on the top middle of the chamber. The camera (Panasonic MN34230 sensor, 4656 × 3520 resolution, 3.8 μm pixel size) included a lens (Nikkor 50 mm f/1.8D, Nikon, Tokyo, Japan), an internal 5-position ultra-quiet electronic filter wheel and 12V power distribution. A long-pass ultraviolet (UV) filter (Model Zeta L41, Kenko Co., Ltd., Toyko, Japan) was fixed in front of the camera lens to absorb the irradiation up to 410 nm. With regulated two-stage thermoelectric cooler (TEC) cooling, the temperature of sensor was cooled up to 40 C below ambient to maintain noise low. The filter wheel accepts a 31 mm single-band bandpass filter centered at 575 nm, driven by a whisper quiet high grade stepper motor. Six green (523 nm) LED lights (Model LZ4-40G108-0000, LED Engin Inc., San Jose, CA, USA) were placed in the appropriate positions at the middle bottom of the chamber to provide uniform illumination in the plant area. The brightness of the LEDs was controlled by an adjustable power supply. Six short-pass filters (FES0550, Thorlabs Inc., Newton, NJ, USA) were placed in front of six green LEDs mentioned above to prevent any light exceeding 550 nm from reaching the plants. Two sets of mirrors were placed at the bottom of both sides of the traveling direction of the imaging system, each of which had three mirrors. This design provided six different side and top views of the plant at the same time, which can reduce the possibility of tomato stems being occluded in collected images. The camera was placed on the vertical center line among the mirrors to capture 7 different views of the crop plants, simultaneously. The size of the mirror is 200 × 150 mm. The two mirrors in the center were placed parallel to the direction of travel, and the remaining mirrors were placed at a fixed angle to the center mirror. The mirrors were positioned to ensure that plants labeled with signaling compounds were visible in the images. The camera exposure time is set appropriately to capture an image with sufficient signal intensity from the green LEDs.
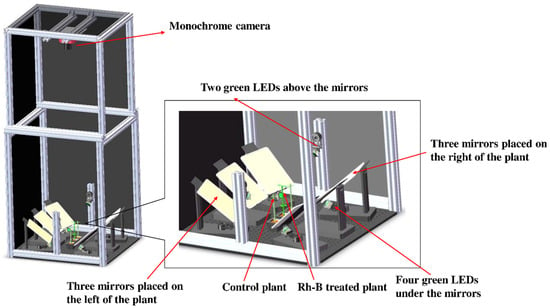
Figure 1.
Schematic diagram of the fluorescence imaging system.
2.3. Image Acquisition
The images of the control and treatment plants were captured using the fluorescence imaging system. The images are in grayscale form. The monochrome images of plants were obtained by using the system with the following camera settings: exposure time = 0.31 s, and CCD temperature = −15.0 °C. Each image includes the top view of the soybean plant and the side views of the six mirrors. Plants with the Rh-B signal were classified as crops, otherwise they were classified as weeds. The height and fresh weight of the above-ground part of the plants were determined after harvesting. The house written scripts for plant recognition were executed in Matlab software (The Mathworks Inc., Natick, MA, USA).
2.4. Image Pre-Processing
Image pre-processing is an operation at the lowest level of abstraction on an image with the aim of improving the image data by suppressing undesired distortions or enhancing some image features that are critical for further processing and analysis. In this study, the image pre-processing methods including median filter, image sharpening and morphological operations (e.g., erosion, opening, and closing) were applied to the captured images.
2.5. Pseudo-Color Image Generation
Pseudo-color image was generated using an open-source software (Fiji ImageJ, National Institutes of Health, Bethesda, MD, USA) to visualize the intensity of the plant fluorescence signal. The image visualization tasks were as follows: (1) smoothing the image to remove the noise; (2) using a global threshold to remove background pixels; and (3) generating the pseudo-color image using Image -> Lookup Tables -> Cyan.
2.6. Statistical Analysis
The statistical analyses involved in this study were performed using IBM SPSS Statistics version 24.0 (SPSS Inc., Chicago, IL, USA). Statistical differences were evaluated by analysis of variance (ANOVA) and mean separation was performed using Tukey’s Honestly Significant Difference (HSD) test. Each measurement was compared to that of the corresponding control group. Thresholds for significant differences were based on p-values below 0.05.
3. Results
3.1. Visibility of Rh-B Fluorescence in Soybean
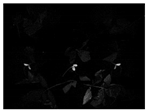
The fluorescence imaging system was used to assess the visibility of Rh-B in soybean under sunlight. The statistics of average fluorescence of two varieties of soybean exposed to sunlight for 0, 6, or 12 days is shown in Table 1. There were significant differences in fluorescence intensity between Rh–B treated soybean and control plants. Compared with the control plant, the fluorescence of soybean treated with Rh-B was mainly detected in the plant cotyledon (Figure 2). This result is consistent with the results of a previous study, in which Su, Fennimore and Slaughter [42] found that the fluorescent signal of snap bean cotyledon was stronger than that of other regions (such as hypocotyl). As the first leaf of soybean, the cotyledon can be unearthed to a certain height under the support of the hypocotyl. The Rh-B fluorescence of plant was detectable under green light, but the trend of decay of the fluorescence signal in plants was observed. The fluorescence intensity of Rh–B at day 14 was still stronger than that of the control group, which means that the fluorescence signal can remain for over 2 weeks in soybean under sunlight. Soybean plants treated with 120 ppm Rh-B showed stronger fluorescence signals at the beginning of germination than samples with lower doses, but the difference in signal intensity between samples decreased over time. It was concluded that the Rh-B treated soybean presented acceptable visibility, which is effective for the identification of soybean plants.

Table 1.
The statistics of average fluorescence intensity of soybean exposed to sunlight for 0, 6, or 12 days.
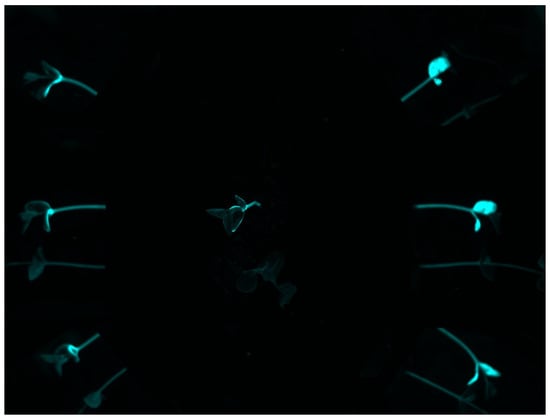
Figure 2.
Pseudo-color image of an Rh-B treated soybean plant with a control plant at day 14 taken under green light.
3.2. Effect of Rh–B on Soybean Growth
In order to investigate the potential risk of Rh-B on soybean growth, the effect of Rh–B on soybean vigor was evaluated by measuring the height and weight of the plants. The soybeans were soaked in distilled water or Rh–B solutions for 48 h before sowing. Soybean plants were grown outdoors for 20 or 30 days, then harvested and weighed. As shown in Table 2 and Table 3, it can be found that there is no significant difference in soybean foliage biomass and height between control and Rh–B treated groups after the plants growing outdoors in full sunlight for 30 days, regardless of the soybean variety. Although there were differences in the soybean seedling height after growing for 20 days, no significant difference was observed after growing for 30 days, which demonstrated that Rh–B has no significant impact on the plant height of after a certain period of growth. Overall, the application of both dosages of Rh-B to soybean seeds did not inhibit plant growth.

Table 2.
Statistical values of above ground biomass of soybean plants treated with different doses of Rh-B.

Table 3.
Statistical values of the height of soybean plants treated with different doses of Rh-B.
3.3. Single-View Recognition Result
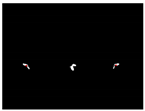
The experiment of the single-view algorithm was conducted using two sets of plants, including 105 Rh-B treated soybeans and 132 control plants considered to be weeds. The dataset used in this algorithm involves the single-view images. The main steps of the detection algorithm involved image preprocessing, region of interest (ROI) extraction, crop plant recognition. The diagram representation of the single-view algorithm for plant detection is shown in Figure 3. The fluorescence signal of ROI was isolated by removing the background information, as seen in Figure 4a. The values in each 3 × 3 matrix of the local area of the image are traversed in turn to choose the middle gray value as the pixel value of the center point. A high threshold of 130 was set to extract the binary image of the plant according to the difference of gray value. A low threshold of 15 was set to extract the binary image of the soybean seedlings and weeds. The images were processed by using the compound morphological operation combined with erosion operation and dilation operation as shown in Figure 4b,c. Then, each connected area of the image matrix was assigned a specific value to form label matrices (Figure 5a). The connected areas of the binary image were traversed. As shown in Figure 5b, if the label value of a pixel is not 0, the position of the pixel is recorded, and all the connected areas containing the point in the binary image were removed. This operation is repeated until the entire image is traversed. The weeds and target crops are then subtracted from the binary image. The centroid of each connected area in the binary image was calculated to determine the location of target plants as shown in Figure 4d,e. Figure 6 shows the execution steps of the single-view detection algorithm. Among the 105 soybean plants, 93.33% of the plants were successfully classified. The soybean plants that were undetectable were caused by the occlusion of the ROI images by plant leaves. Of the 132 weeds in the study, 90.15% were correctly classified. The undetected weeds were due to overlapping boundaries or very close to the crops.
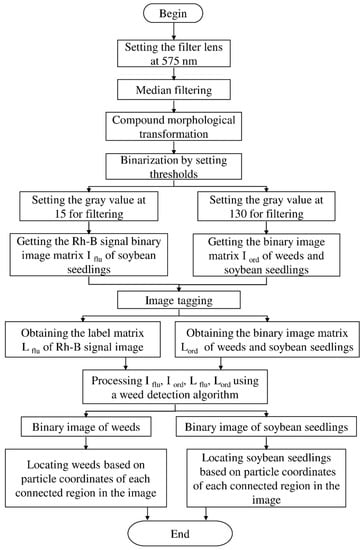
Figure 3.
Diagram representation of the single-view algorithm for plant detection.
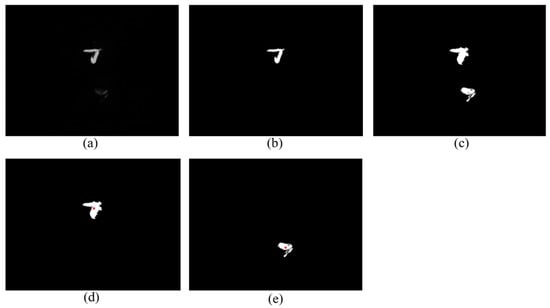
Figure 4.
Intermediate process image for top-view algorithm. (a) Image captured by gray camera; (b) the fluorescence binary image with a threshold of 130 after compound morphological operation; (c) the binary image of weeds and soybean seedlings with a threshold of 15 after compound morphological operation; (d) the identification result of soybean seedlings; and (e) the identification result of weed.
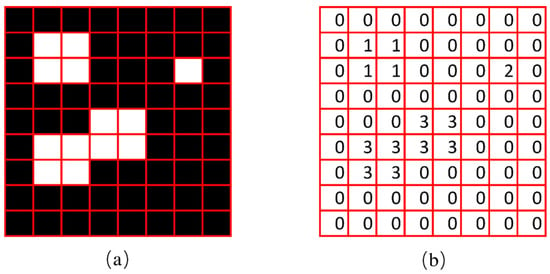
Figure 5.
The diagrams of image label matrix in Matlab. (a) Original binary image; (b) labeling results.
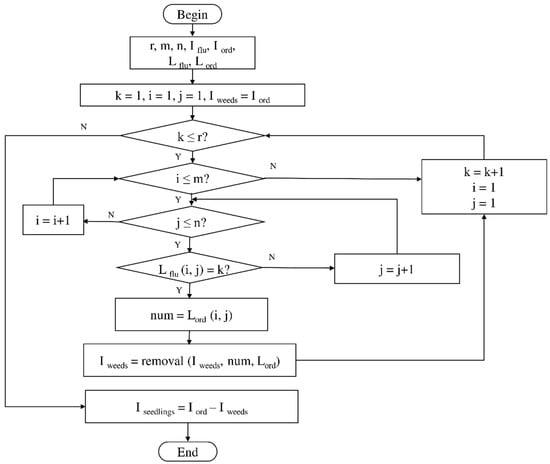
Figure 6.
The execution steps of the single-view detection algorithm.
3.4. Multi-View Recognition Result
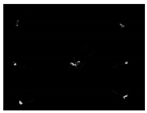
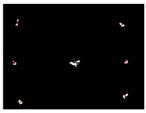
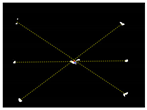
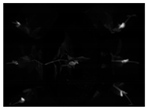
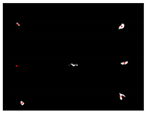
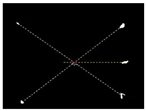
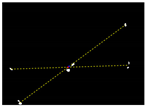
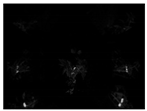
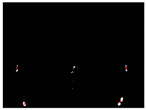
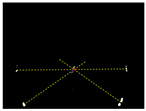
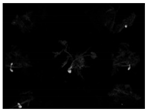
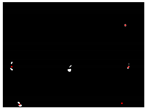
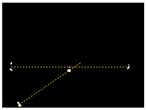
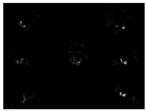
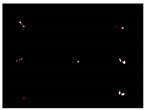
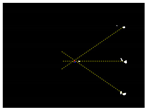
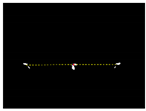
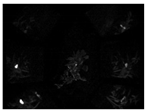
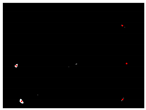
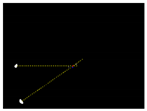
Due to the large weed density and the plant architecture, the degree of visual occlusion of the branches and leaves could be severe, which meant it would be difficult to accurately detect the crop signal based on one single top plan view. The bright spots represented the ROI of crop images that were isolated from the image background. The position of the soybean plant was estimated based on the crop signal detected using six side-view images and one top-view image. In this method, the ROI from each view image was extracted based on the threshold value of 130 Figure 7a. The area of ROI of each of six binary images was calculated. A rule was proposed to evaluate the effectiveness of each ROI of the six mirror images. In this rule, if the normalized values of a pair of symmetrical images were both less than 0.3, then the area was regarded as an object of no interest, which should be discarded. If the ratio of a smaller area to a larger area in a pair of symmetrical images was less than 0.7, the smaller area was considered as an invalid region. Based on the obtained effective ROI images, the location of the crop plant can be readily determined based on the cross-checking between the six side views (Figure 7b). If any ROI images were occluded by plant leaves or weeds, the number of identified images in mirrors will be less than six. This may result in the location of plants not being correctly recognized. For such cases, the algorithm based on the principle of plane mirror imaging was proposed to detect the signal location or plant location, as shown in Figure 8. The position of the object is symmetrical to its mirror image on a straight line perpendicular to the line of intersection of the mirror and the ground. According to the rule, the plant location can be readily calculated, then compared with its actual position. The above rules should be executed based on the sequence of 6 points, 5 points, 4 points, 3 points, 2 points, and then only 1 detected point in the mirror images to achieve the best recognition accuracy. As listed in Table 4, there are nine cases for mirror images with less than six side signals. The corresponding detection results are shown in Table 5. A total of 200 Rh-B treated soybean seedlings were processed and analyzed in the multi-view recognition experiment. The maximum error was 1.18 cm and the minimum error was 0.03 cm. The mean error was 0.60 cm and standard deviation was 0.27 cm. The soybean plants were detected with 97% accuracy. The accuracy was calculated based on the ratio of the total number of plants detected to the total number of crop plants.
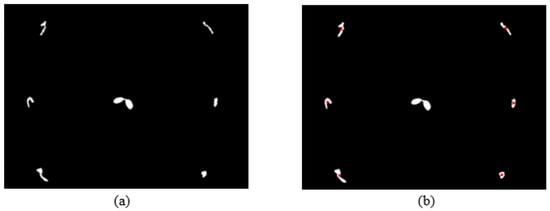
Figure 7.
(a) The fluorescence binary image of soybean seedlings; (b) determination of plant location (in red circles) in mirror images.
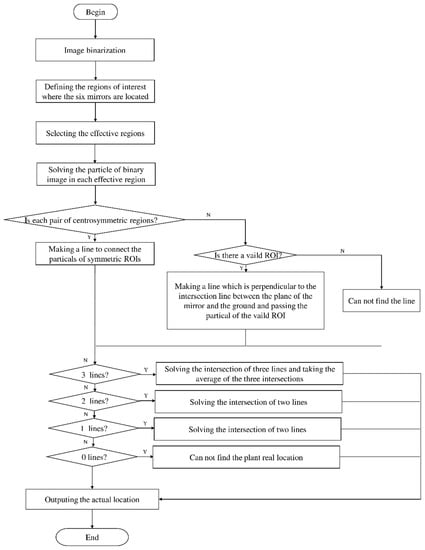
Figure 8.
Diagram representation of the crop signal detection algorithm for estimating the actual plant location.

Table 4.
Characterization of visual occlusions of plant signals in six side mirrors.

Table 5.
Connecting the ROIs in pairs using dashed lines to get an intersecting point for determination of the plant location.
4. Discussion
An automatic plant localization method was established in this study to identify soybean crops from weeds, which provided a basis for on-line intra-row weed management. This crop signaling technology has met the following relevant technical standards: (1) the fluorescent compound has a unique fluorescent signal that can be recognized in soybean seedlings, (2) the signal can be detected by an imaging system with specific excitation lights and band-pass filters, (3) a small amount of marker has a strong fluorescent effect, (4) this fluorescent substance is safe for soybeans, and (5) the application of the technology is cost-effective.
The recognizable plant signature used was generated based on soaking the soybean seeds in Rh-B solutions prior to sowing. High concentrations of fluorescent dyes can degrade the health and vitality of plants. Su, Slaughter and Fennimore [39] demonstrated the dose effect of Rh-B in celery plants was a function of its dosage. Then, Rh-B solutions at concentrations of 1, 10, 100, 1000, or 5000 ppm were applied to snap bean seeds [42]. The results demonstrated that the fluorescence intensity increased to a maximum at 100 ppm. Thus, two concentrations of Rh-B (60 and 120 ppm) near to 100 ppm were considered in this study for differentiation of soybean from weeds. It was found that the two dosages of Rh-B applied to soybean seeds did not inhibit plant growth, which suggests that higher dosages of Rh-B should be used to investigate whether these applications will reduce the biomass and the height of plants. In further research, more different varieties of soybeans treated with different Rh-B doses should be used to fully assess the plant nutrient loss caused by Rh-B exposure.
The Rh-B uptake was not only found in soybean, but also in snap bean plants. It has been confirmed that the strong fluorescence signal intensity of Rh-B was successfully detected in snap bean cotyledons [42]. Although the Rh-B signal was mainly concentrated in the cotyledons, the algorithm based on the characteristic signal appeared good in recognition of soybean seedlings. Since the preliminary study on soybean identification was carried out indoors, it is not known how accurate it will be under different species of dense weeds in the field. In our next research, relevant environmental factors, such as different densities of weeds, will be taken into consideration. Further research will focus on other crops and new signaling compounds and will evaluate the efficacy of the developed technology in outdoor fields. In addition, more research should be conducted to assess whether the quality of postharvest soybeans is affected. This is a preliminary study where the main aim is to develop a plant localization technique for automatic differentiation of the plants. The imaging system developed in this study will be placed behind a tractor in the future to work in the soybean field, which will be cost-effective as the fluorescence imaging system is inexpensive. Nevertheless, the cost of applying the technology will be compared with the cost of manual weeding to assess the ultimate cost-effectiveness. Although this research focuses on establishing a crop detection technology and evaluating the effectiveness of the technology, the ultimate goal of future research is to build a robot that can accurately identify and remove weeds in crop rows in real time.
5. Conclusions
An automatic identification system based on chemical compounds successfully determined the location of soybean plant. The system was equipped with a high-resolution monochrome camera with a 575 nm bandpass filter, a custom-designed green illumination source and multi-view visualization components. The crop signal was created by seed treatment using the machine-readable Rh-B marker before soybean sowing. The seed treatment method used in this study was safe for the soybean growth. The systemic marker has unique optical characteristics, which can significantly simplify and realize the successful differentiation of soybean plants. The three-dimensional imaging system was designed to significantly improve the performance of the detection algorithm to detect crop signals. The multi-view algorithm performed better than the single-view algorithm in solving the extreme cases of occlusion, reaching an average detection accuracy of 97% in identifying the early growth stage of soybean plants. The system is planned to be equipped with specially designed rotating knives to remove weeds near crops in real time.
Author Contributions
Conceptualization, W.-H.S.; methodology, W.-H.S., J.S. and Q.-Y.H.; software, J.S.; validation, Q.-Y.H. and J.S.; formal analysis, W.-H.S.; investigation, W.-H.S. and J.S.; resources, W.-H.S.; data curation, Q.-Y.H. and J.S.; writing—original draft preparation, W.-H.S., J.S. and Q.-Y.H.; writing—review and editing, W.-H.S.; visualization, W.-H.S. and J.S.; supervision, W.-H.S.; project administration, W.-H.S.; funding acquisition, W.-H.S. All authors have read and agreed to the published version of the manuscript.
Funding
This research was funded by Graduate Independent Innovation Research Fund Project of China Agricultural University (grant number 00110112), Double First-Class Scientific Research Project of Ministry of Education of China (grant number 2021AC012), National Natural Science Foundation of China (grant number 32101610).
Acknowledgments
The authors would like to acknowledge Zhou-Yang Chen in College of Engineering, China Agricultural University for his technical assistance in the completion of this research.
Conflicts of Interest
The authors declare no conflict of interest.
References
- Liu, K. Chemistry and nutritional value of soybean components. In Soybeans; Springer: Boston, MA, USA, 1997; pp. 25–113. [Google Scholar]
- Wilkerson, G.; Modena, S.; Coble, H. HERB: Decision model for postemergence weed control in soybean. Agron. J. 1991, 83, 413–417. [Google Scholar] [CrossRef]
- Culpepper, A.S.; Gimenez, A.E.; York, A.C.; Batts, R.B.; Wilcut, J.W. Morningglory (Ipomoea spp.) and large crabgrass (Digitaria sanguinalis) control with glyphosate and 2,4-DB mixtures in glyphosate-resistant soybean (Glycine max). Weed Technol. 2001, 15, 56–61. [Google Scholar] [CrossRef]
- Shurtleff, J.L.; Coble, H.D. Interference of certain broadleaf weed species in soybeans (Glycine max). Weed Sci. 1985, 33, 654–657. [Google Scholar] [CrossRef]
- Hashimoto, Y.; Ishihara, K.; Soeda, Y. Fate of alloxydim-sodium on or in soybean plants. Pestic. Sci. 1979, 4, 299–304. [Google Scholar] [CrossRef][Green Version]
- Liu, B.; Bruch, R. Weed detection for selective spraying: A review. Curr. Robot. Rep. 2020, 1, 19–26. [Google Scholar] [CrossRef]
- Li, B.-H.; Wang, G.-Q.; Fan, C.-Q.; Su, L.-J.; Xu, X. Effects of different tillage methods on weed emergence in summer soybean field. J. Hebei Agric. Sci. 2009, 3, 28–30. [Google Scholar]
- Dai, X.; Xu, Y.; Zheng, J.; Song, H. Analysis of the variability of pesticide concentration downstream of inline mixers for direct nozzle injection systems. Biosyst. Eng. 2019, 180, 59–69. [Google Scholar] [CrossRef]
- Perotti, V.E.; Larran, A.S.; Palmieri, V.E.; Martinatto, A.K.; Permingeat, H.R. Herbicide resistant weeds: A call to integrate conventional agricultural practices, molecular biology knowledge and new technologies. Plant Sci. 2020, 290, 110255. [Google Scholar] [CrossRef]
- Song, J.-S.; Chung, J.-H.; Lee, K.J.; Kwon, J.; Kim, J.-W.; Im, J.-H.; Kim, D.-S. Herbicide-based weed management for soybean production in the Far Eastern region of Russia. Agronomy 2020, 10, 1823. [Google Scholar] [CrossRef]
- Melander, B.; Rasmussen, G. Effects of cultural methods and physical weed control on intrarow weed numbers, manual weeding and marketable yield in direct-sown leek and bulb onion. Weed Res. 2001, 41, 491–508. [Google Scholar] [CrossRef]
- Fennimore, S.A.; Boyd, N.S. Sustainable Weed Control in Strawberry. In Weed Control: Sustainability, Hazards, and Risks in Cropping Systems Worldwide; Korres, N.E., Burgos, N.R., Duke, S.O., Eds.; CRC Press: Boca Raton, FL, USA, 2018; p. 383. [Google Scholar]
- Fennimore, S.A.; Slaughter, D.C.; Siemens, M.C.; Leon, R.G.; Saber, M.N. Technology for automation of weed control in specialty crops. Weed Technol. 2016, 30, 823–837. [Google Scholar] [CrossRef]
- Burgos-Artizzu, X.P.; Ribeiro, A.; Guijarro, M.; Pajares, G. Real-time image processing for crop/weed discrimination in maize fields. Comput. Electron. Agric. 2011, 75, 337–346. [Google Scholar] [CrossRef]
- Gée, C.; Bossu, J.; Jones, G.; Truchetet, F. Crop/weed discrimination in perspective agronomic images. Comput. Electron. Agric. 2008, 60, 49–59. [Google Scholar] [CrossRef]
- Montalvo, M.; Pajares, G.; Guerrero, J.M.; Romeo, J.; Guijarro, M.; Ribeiro, A.; Ruz, J.J.; Cruz, J. Automatic detection of crop rows in maize fields with high weeds pressure. Expert Syst. Appl. 2012, 39, 11889–11897. [Google Scholar] [CrossRef]
- Rosell-Polo, J.R.; Cheein, F.A.; Gregorio, E.; Andújar, D.; Puigdomènech, L.; Masip, J.; Escolà, A. Advances in structured light sensors applications in precision agriculture and livestock farming. Adv. Agron. 2015, 133, 71–112. [Google Scholar]
- Andújar, D.; Calle, M.; Fernández-Quintanilla, C.; Ribeiro, Á.; Dorado, J. Three-dimensional modeling of weed plants using low-cost photogrammetry. Sensors 2018, 18, 1077. [Google Scholar] [CrossRef]
- Su, W.-H.; Yang, C.; Dong, Y.; Johnson, R.; Page, R.; Szinyei, T.; Hirsch, C.D.; Steffenson, B.J. Hyperspectral imaging and improved feature variable selection for automated determination of deoxynivalenol in various genetic lines of barley kernels for resistance screening. Food Chem. 2021, 343, 128507. [Google Scholar] [CrossRef] [PubMed]
- Su, W.-H.; Bakalis, S.; Sun, D.-W. Fingerprinting study of tuber ultimate compressive strength at different microwave drying times using mid-infrared imaging spectroscopy. Dry. Technol. 2019, 37, 1113–1130. [Google Scholar] [CrossRef]
- Su, W.-H.; Bakalis, S.; Sun, D.-W. Chemometric determination of time series moisture in both potato and sweet potato tubers during hot air and microwave drying using near/mid-infrared (NIR/MIR) hyperspectral techniques. Dry. Technol. 2020, 38, 806–823. [Google Scholar] [CrossRef]
- Su, W.-H.; He, H.-J.; Sun, D.-W. Non-destructive and rapid evaluation of staple foods quality by using spectroscopic techniques: A review. Crit. Rev. Food Sci. Nutr. 2017, 57, 1039–1051. [Google Scholar] [CrossRef] [PubMed]
- Su, W.H.; Sun, D.-W. Fourier transform infrared and Raman and hyperspectral imaging techniques for quality determinations of powdery foods: A review. Compr. Rev. Food Sci. Food Saf. 2018, 17, 104–122. [Google Scholar] [CrossRef] [PubMed]
- Su, W.H.; Sun, D.-W. Multispectral imaging for plant food quality analysis and visualization. Compr. Rev. Food Sci. Food Saf. 2018, 17, 220–239. [Google Scholar] [CrossRef] [PubMed]
- Su, W.-H.; Sun, D.-W. Mid-infrared (MIR) Spectroscopy for Quality Analysis of Liquid Foods. Food Eng. Rev. 2019, 11, 142–158. [Google Scholar] [CrossRef]
- Su, W.-H.; Sun, D.-W. Advanced analysis of roots and tubers by hyperspectral techniques. In Advances in Food and Nutrition Research; Fidel, T., Ed.; Elsevier: Amsterdam, The Netherlands, 2019; Volume 87, pp. 255–303. [Google Scholar]
- Su, W.-H. Advanced Machine Learning in Point Spectroscopy, RGB-and hyperspectral-imaging for automatic discriminations of crops and weeds: A review. Smart Cities 2020, 3, 39. [Google Scholar] [CrossRef]
- Chang, C.-L.; Xie, B.-X.; Chung, S.-C. Mechanical Control with a Deep Learning Method for Precise Weeding on a Farm. Agriculture 2021, 11, 1049. [Google Scholar] [CrossRef]
- Su, W.-H.; Zhang, J.; Yang, C.; Page, R.; Szinyei, T.; Hirsch, C.D.; Steffenson, B.J. Automatic evaluation of wheat resistance to fusarium head blight using dual mask-RCNN deep learning frameworks in computer vision. Remote Sens. 2021, 13, 26. [Google Scholar] [CrossRef]
- Su, W.-H.; Zhang, J.; Yang, C.; Page, R.; Szinyei, T.; Hirsch, C.D.; Steffenson, B.J. Evaluation of Mask RCNN for Learning to Detect Fusarium Head Blight in Wheat Images. In Proceedings of the 2020 ASABE Annual International Virtual Meeting, Virtual, 13–15 July 2020; American Society of Agricultural and Biological Engineers: St. Joseph, MI, USA, 2020; p. 1. [Google Scholar]
- Bah, M.D.; Hafiane, A.; Canals, R. Deep learning with unsupervised data labeling for weed detection in line crops in UAV images. Remote Sens. 2018, 10, 1690. [Google Scholar] [CrossRef]
- Shaner, D.L.; Beckie, H.J. The future for weed control and technology. Pest Manag. Sci. 2014, 70, 1329–1339. [Google Scholar] [CrossRef]
- García-Mateos, G.; Hernández-Hernández, J.; Escarabajal-Henarejos, D.; Jaén-Terrones, S.; Molina-Martínez, J. Study and comparison of color models for automatic image analysis in irrigation management applications. Agric. Water Manag. 2015, 151, 158–166. [Google Scholar] [CrossRef]
- Hernández-Hernández, J.L.; García-Mateos, G.; González-Esquiva, J.; Escarabajal-Henarejos, D.; Ruiz-Canales, A.; Molina-Martínez, J.M. Optimal color space selection method for plant/soil segmentation in agriculture. Comput. Electron. Agric. 2016, 122, 124–132. [Google Scholar] [CrossRef]
- Su, W.-H. Crop plant signaling for real-time plant identification in smart farm: A systematic review and new concept in artificial intelligence for automated weed control. Artif. Intell. Agric. 2020, 4, 262–271. [Google Scholar] [CrossRef]
- Su, W.-H.; Fennimore, S.A.; Slaughter, D.C. Evaluation of Photostability of Rhodamine B for Automatic Recognition of Tomato Plants. In Proceedings of the 2020 ASABE Annual International Virtual Meeting, Virtual, 13–15 July 2020; American Society of Agricultural and Biological Engineers: St. Joseph, MI, USA, 2020; pp. 1–2. [Google Scholar]
- Su, W.-H.; Fennimore, S.A.; Slaughter, D.C. Development of a systemic crop signalling system for automated real-time plant care in vegetable crops. Biosyst. Eng. 2020, 193, 62–74. [Google Scholar] [CrossRef]
- Su, W.-H.; Fennimore, S.A.; Slaughter, D.C. Computer Vision Technology for Identification of Snap Bean Crops using Systemic Rhodamine B. In Proceedings of the 2019 ASABE Annual International Virtual Meeting, Virtual, 7–10 July 2019; American Society of Agricultural and Biological Engineers: St. Joseph, MI, USA, 2019; p. 1. [Google Scholar]
- Su, W.-H.; Slaughter, D.C.; Fennimore, S.A. Non-destructive evaluation of photostability of crop signaling compounds and dose effects on celery vigor for precision plant identification using computer vision. Comput. Electron. Agric. 2020, 168, 105155. [Google Scholar] [CrossRef]
- Taylor, A.; Salanenka, Y. Seed treatments: Phytotoxicity amelioration and tracer uptake. Seed Sci. Res. 2012, 22 (Suppl. S1), S86–S90. [Google Scholar] [CrossRef]
- Salanenka, Y.A.; Taylor, A.G. Seedcoat permeability: Uptake and post-germination transport of applied model tracer compounds. HortScience 2011, 46, 622–626. [Google Scholar] [CrossRef]
- Su, W.-H.; Fennimore, S.A.; Slaughter, D.C. Fluorescence imaging for rapid monitoring of translocation behaviour of systemic markers in snap beans for automated crop/weed discrimination. Biosyst. Eng. 2019, 186, 156–167. [Google Scholar] [CrossRef]
- Raja, R.; Slaughter, D.C.; Fennimore, S.A.; Nguyen, T.T.; Vuong, V.L.; Sinha, N.; Tourte, L.; Smith, R.F.; Siemens, M.C. Crop signalling: A novel crop recognition technique for robotic weed control. Biosyst. Eng. 2019, 187, 278–291. [Google Scholar] [CrossRef]
Publisher’s Note: MDPI stays neutral with regard to jurisdictional claims in published maps and institutional affiliations. |
© 2022 by the authors. Licensee MDPI, Basel, Switzerland. This article is an open access article distributed under the terms and conditions of the Creative Commons Attribution (CC BY) license (https://creativecommons.org/licenses/by/4.0/).
