Article

Optimization of Material for Key Components and Parameters of Peanut Sheller Based on Hertz Theory and Box–Behnken Design

1
College of Engineering, Nanjing Agricultural University, Nanjing 210000, China
2
Nanjing Institute of Agricultural Mechanization, Ministry of Agriculture and Rural Affairs, Nanjing 210014, China
*
Authors to whom correspondence should be addressed.
Agriculture 2022, 12(2), 146; https://doi.org/10.3390/agriculture12020146
Submission received: 12 November 2021 / Revised: 10 January 2022 / Accepted: 18 January 2022 / Published: 21 January 2022
(This article belongs to the Section Agricultural Technology)

Abstract

:
Poor shelling quality degrades the performance and profit of the peanut industry. The Hertz theory and the wear resistance experimental method were applied to identify a highly wear-resistant material guaranteeing a low mechanical damage rate (MDR) of peanut kernels. The Box–Behnken design method was applied in the experiment to illustrate the influence of the material’s elastic modulus (X1), radius of curvature of the key parts (X2), rotating speed of the shelling drum (X3), and clearance between the shelling drum and concave screen (X4) on MDR and shelling efficiency (SE). Depending on the analysis of variance, the weights of the influential factors were observed as X1 > X3 > X4 > X2. The mathematical models of MDR and SE were derived from the least squares’ method, and four-dimensional slice diagrams of the three most significant factors were used to illustrate the trends of MDR and SE. A multi-objective analysis provided the optimal combination of parameters as: X1 = 10 MPa, X2 = 12.77 mm, X3 = 277.48 r/min, and X4 = 24.24 mm, yielding MDR = 4.89% and SE = 97.91%. The results were further verified by a production trial test, proving that the proposed solution with the selected material, machine design, and working parameters were effective in improving peanut shelling quality.

1. Introduction

Peanut (Arachis hypogaea Linn), also known as groundnut, from the family of legumes, is an important oil crop and an excellent protein resource [1]. It is rich in functional proteins, amino acids, monounsaturated fatty acids, resveratrol, phytosterols, folic acid, and vitamin E, which play an important role in improving body functions and preventing heart diseases [2,3]. Peanuts are mainly cultivated in the tropical, subtropical, and warm zones of the earth, and many countries in Asia, Africa, and the United States grow peanuts [4,5,6]. India, China, Nigeria, Sudan, and Myanmar are the top five countries in terms of the planting area, whereas China, India, Nigeria, the United States, and Myanmar are the top five countries in terms of peanut yield [7,8,9]. A statistical report from the Food and Agricultural Organization of the United Nations in 2019 indicated that the cultivated peanut acreage in China alone was 4,508,393 ha, yielding 17,519,600 tons of peanut pods annually and contributing to 40% of the global production [10].
Nowadays, peanut consumption is in the form of peanut oil, peanut butter, peanut protein powder, baked peanuts, peanut kernels, and peanut drinks [11,12,13]. Regardless of how peanuts are consumed, peanut shelling is an important step for obtaining the peanut kernels. Peanut shelling machinery has been widely used in the shelling process, but the high mechanical damage rate (MDR) caused by shelling has been a problem in China [14]. The damaged kernels can easily be affected by aflatoxin and other pollutants, resulting in not only degradation of quality and food safety but also price reduction, which is detrimental to the peanut industry [15]. High quality and efficiency of peanut shelling are crucial for food safety and development of the peanut food processing industry worldwide.
Numerous studies have been conducted to realize high quality of the shelling process. Helmy et al. studied the modification and evaluated the performance of a reciprocating peanut sheller, and they improved the shelling quality by supplying the sheller with a feeding mechanism, increasing the friction area of the shelling box, and using rubber for enhancing the shelling process [16]. To address the problems of low shelling efficiency (SE) and the high MDR of peanut shelling, Gao et al. developed small-scale shelling equipment with three-level rotary and single-row parallel shelling based on the physical and mechanical properties of typical peanut shellers, and achieved the best combination of the parameters of the sheller [17]. Butts et al. evaluated a three-stage peanut sheller and tested its throughput and aspiration system. They obtained the maximum shelling rate at a certain operating speed (252 rpm) in the first stage of shelling and effective removal of peanut hulls with mixed steam [18]. Atiku et al. studied the performance of a peanut sheller by using Bambara groundnut and achieved the maximum shelling and winnowing efficiencies of 80% and 79.5%, respectively; however, no optimization was attempted in their research [19]. Moreover, Yi et al. [20] and Hou et al. [21] studied the effect of moisture content on the mechanical properties of peanuts and revealed different deformations and rupture forces under various moisture contents of the peanut kernels and shells to reduce the MDR during the shelling process. They further indicated that a higher moisture content increased the rupture force of the peanut kernels, which significantly reduced the MDR, but it was unfavorable to the shelling rate. Lan used the rotation speed of the shelling drum and clearance between the concave screen and the shelling drum as key parameters, demonstrating that the MDR can be reduced by controlling these two key parameters [22].
Despite these observations of optimized MDR and SE from proper selection on the parameters of the shelling bin, we assume that the mechanical aspect of interactions between the key components of peanut shelling and peanut kernels may also play a role in affecting the shelling performance. Previous upgrading, as in Helmy et al., Gao et al., Butts et al., and Atiku et al.’s studies, has been made through proper design of shelling machines for optimized mechanical interactions between the sheller and the peanut. However, the mechanisms underlying these mechanical interactions were poorly explained. Furthermore, the opportunity of applying flexible materials on the key parts of the sheller for improved shelling quality has been ignored. Reported optimizations of the shelling quality were limited to the shelling parts made of Q235 steel, lacking considerations on alternative materials, e.g., plastic, wood, rubber, etc. However, introducing different materials to the sheller parts leads to increased complexity of experimental investigation. The experimental complexity not only requires a theoretical basis but also implies tedious laboratory works, high cost, and long duration. Different materials investigated, varied design parameters of the sheller, controlled working parameters (rotating speed, clearance, etc.), and geometry and physical properties of the peanut sample will make it unfeasible to perform a thorough experimental investigation on all the combinations. In addition, coupling effects may occur among these factors of influence. As explained by Yi et al. and Hou et al., the rupture force of peanut kernels and shells changed in the same trend with moisture content. Although a higher moisture content resulted in a low MDR, a decreased SER at the higher water level was also unavoidable [20,21].
In addressing these difficulties, we assume that the Hertz theory can be applied to illustrate the mechanisms of sheller and peanut interactions, which will help to identify primary influential factors for the experiment. We also assume that applying the Box–Behnken design (BBD) method will aid us to simplify the experimental complexity, allowing us to perform system optimization with affordable laboratory works. Furthermore, the response surface methodology (RSM) and multi-objective optimization will be used for acquired data illustration, which will aid us to quickly identify the optimized results, as has been shown in related food processing studies [23,24].
In dealing with new materials, we hypothesize that a soft material could be of benefit for a low MDR and increased wear resistance, which will be predictively explained by the Hertz theory and approved with a laboratory wear test. Therefore, a thorough consideration on the material selection, machine design parameters, and shelling parameters for multi-objective optimization of the peanut shelling system will be carried out, with an aim of establishing the optimization models of MDR and SE.

2. Materials and Methods

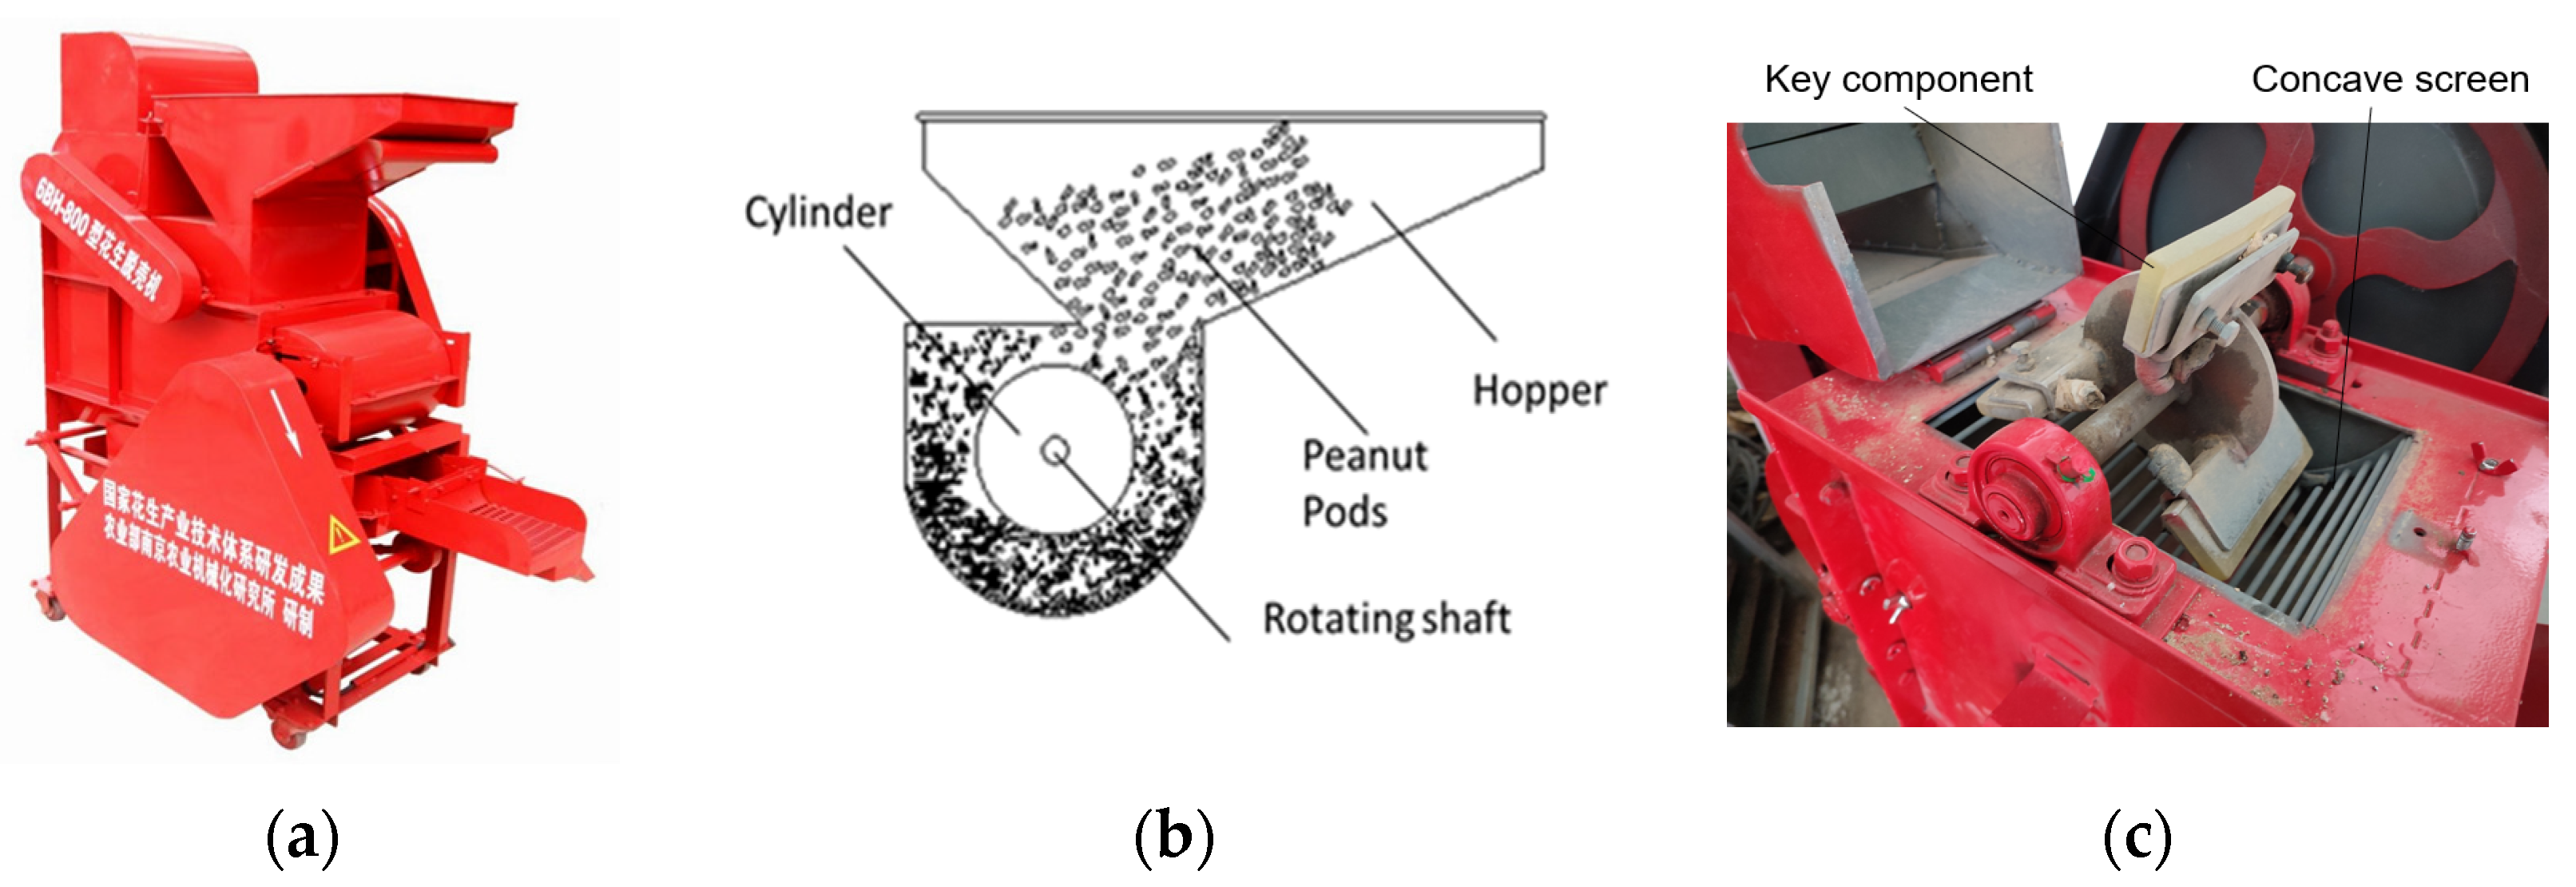
2.1. Peanut Shelling Device

The peanut shelling device (Figure 1) mainly comprises a shelling bin, cleaning fan, and oscillating screen. The shelling bin is the most important part of the sheller because it determines the quality of the shelling process. Figure 1a shows the shelling machine used in the experiment, Figure 1b shows the schematic diagram of the shelling bin for the shelling machine in Figure 1a, and Figure 1c presents the physical drawing of the shelling bin, including the concave screen and key component.
During the operation, the peanut pods were fed into the shelling bin through the feed hopper. Under the effect of the shelling drum, the mutual kneading between the pods, and the kneading between the pods and the concave screen, the peanut pod shell is broken, and the seed kernel is detached. The mixture of the detached seed kernels and shells is discharged from the shelling bin through the concave screen, which completes the shelling process. Therefore, the analysis of the mechanical characteristics of the interaction between the peanut and shelling components is very important for improving the quality of peanut shelling.
Figure 2 shows the schematic diagram of the mechanical relationship between the key components of peanut shelling and the peanut during peanut shelling. Where, Vz1 and Vz2 are normal velocities of the shelling part and the peanut respectively before collision, and Vx1, Vx2 are the tangential velocities of the shelling part and the peanut respectively before collision. ωy1 and ωy2 are angular velocities of the shelling part and the peanut. V is the relative velocity of the shelling part and the peanut, Vz is relative normal velocity of the shelling part and the peanut, and Vx is relative tangential velocity of the shelling part and the peanut. β is the angle of incidence before contact of key components with peanut. C1 and C2 represent centroid of the shelling part and the peanut respectively. P means the normal force, and δ is the amount of the normal compression of the shelling part and the peanut. R1, R2 are equivalent radius of the shelling part and the peanut respectively.
Figure 3 shows the key components with different radii of curvature designed for the peanut shelling test in this study.

2.2. Mechanical Analysis of Peanut Shelling

The local collision and contact mechanics between the peanut and shelling parts in the shelling bin is illustrated in Figure 2. According to the Hertz theory and the assumptions in [25,26], the equivalent contact radius, C, of the contact surface between the objects in contact with each other is:
C = a × b 1 2 = 3 P × R e 4 E * 1 3 × F 1 e
where a and b are the lengths of the major and minor axes of the contact area, respectively, P is the total pressure, R e = R R 1 2 is the equivalent relative radius of curvature, R   and   R are the relative equivalent radii, and 1 R = 1 R 1 + 1 R 2 ,   1 R = 1 R 1 + 1 R 2 ,   R 1 ,   R 1 ,   R 2 ,   R 2 , respectively, refer to the maximum and minimum radii of curvature of the key shelling components and peanut in any normal plane in the contact area. 1 E * = 1 μ 1 2 E 1 + 1 μ 2 2 E 2 ,   E 1 ,   and   μ 1 are the elastic modulus and Poisson’s ratio of the key shelling components, and E 2   and   μ 2 are the elastic modulus and Poisson’s ratio of the peanuts, respectively. F 1 e   is the correction factor. E * is comprehensive elastic modulus.
The amount of compression when the peanuts and the shelled parts are in contact is:
δ = 9 P 2 16 E * 2 × R e 1 3 × F 2 e
where δ is the amount of compression (m), and F 2 e is the correction coefficient, which is determined as R R 1 2 .
The maximum compressive strength of peanuts in contact with the shelling parts is:
P 0 = 3 P S = 3 P 2 π × a × b = 6 P × E * 2 π 3 × R e 2 1 3 × F 2 e 2 3
where P 0 is the maximum compressive strength (Pa) and S is the effective contact area (m2).
When the peanut is in contact with the shelling part, the relative speed in the elastic deformation stage is:
v z 2 v z 1 = d δ z d t
where v z 2 and v z 1 are the relative speed of shelling part and peanut respectively.At the moment of impact, the impact strength between the shelling parts and peanuts is:
P t = m 1 d v z 1 d t = m 2 × d v z 2 d t
where m 1 is the mass of the shelling parts (kg) and m 2 is the mass of peanuts (kg).
To further simplify the derivation process, 1 m = 1 m 1 + 1 m 2 is defined, and Equation (5) can be expressed as:
1 m × P t = m 1 + m 2 m 1 × m 2 P t = d d t ν z 1 v z 2 = d 2 δ z d t 2
Equation (2) can be expressed as:
P t = 4 3 F 2 e 3 2 × R e 1 2 × E * × δ z 3 2
By combining Equations (6) and (7), we obtain:
m d 2 δ z d t 2 = 4 3 F 2 e 3 2 × R e 1 2 × E * × δ z 3 2
Integrating Equation (8) yields:
1 2 v z 2 d δ z d t 2 = 8 15 m F 2 e 3 2 × R e 1 2 × E * × δ z 5 2
where v z = v z 2 v z 1 t = 0 is the speed at which the shelling part is in contact with the peanut. From the impact caused by the contact between the peanut and shelling parts, it can be seen that when the compression in the contact area is the maximum, i.e., d δ z d t = 0 , the maximum compression can be obtained from Equation (9), as follows:
δ * = 15 m × v 0 2 × F 2 e 3 2 16 R e 1 2 × E * 2 5
where δ * is the maximum normal deformation (m). The maximum compressive force during contact between the peanut and shelling parts can be obtained using Equation (7), as follows:
P * = 4 3 R e 1 2 × E × F 2 e 3 2 × δ * 3 2
where P * is the maximum normal force (N). According to the above derivation and [26], when the contact force between the peanut and key components P 0 reaches the yield stress limit K of the peanut under uniaxial compression, cracks or breakages occur due to mechanical stress. Therefore, the critical state of the peanuts without plastic deformation is   P 0 = K . At this time,   t = t * ,   δ = δ * , and P = P * . From Equations (1) and (3),
  P 0 = 3 P S = 3 P 2 π × a × b = 3 P 2 π 3 P × R e 4 E * 2 3 × F 1 e 2
where P 0 * is the maximum normal contact pressure (Pa). Therefore, the maximum contact force between the peanut and shelling parts can be obtained as follows:
P 0 * = 3 P * 2 π 3 P × R e 4 E * 2 3 × F 1 e 2
According to Equations (10), (11) and (13) and the relevant critical conditions, the relative critical speed of mechanical damage caused by the collision between the peanut and shelling parts is:
v 0 = 33 π 5 × K 5 × F 1 e 10 × F 2 e × R e 3 1000 E * 4 × m
It can be seen from Equation (14) that the relative critical speed, v 0 , is related to the mass of the peanut, m 2 , elastic modulus of the peanut, E 2 , triaxial size of the peanut seed, yield limit K, elastic modulus E 1 of the shelling parts, and the maximum and minimum radii of the contact area between the shelling parts and peanut, R 1 , R 1 ,   R 2 ,   R 2 . Therefore, the analysis of the contact mechanics between the peanut kernel and key components during shelling can provide a reference basis for material selection, structural parameter design, and optimization of key components.

2.3. Peanut Sample Preparation

The peanut used in this experiment was Huayu 33, a peanut variety widely cultivated in the main peanut cultivating areas of China. To ensure the accuracy of the test results and to reduce the errors caused by possible mechanical damage during the peanut harvesting process, the peanuts were harvested manually, and the peanut pods were graded before shelling. The larger and smaller pods were removed to reduce the fragmentation caused by size differences. The initial moisture content of the peanut pods was determined to be 7.55% according to the ASABE standard [27]. One hundred peanut pods and seed kernels were randomly selected, and their dimensions were measured along three axes and averaged three times in each direction. The average length, width, and thickness of the pods were 28.9, 15.38, and 14.96 mm, respectively, whereas those of the seed kernels were 21.25, 11.08, and 8.49 mm, respectively.

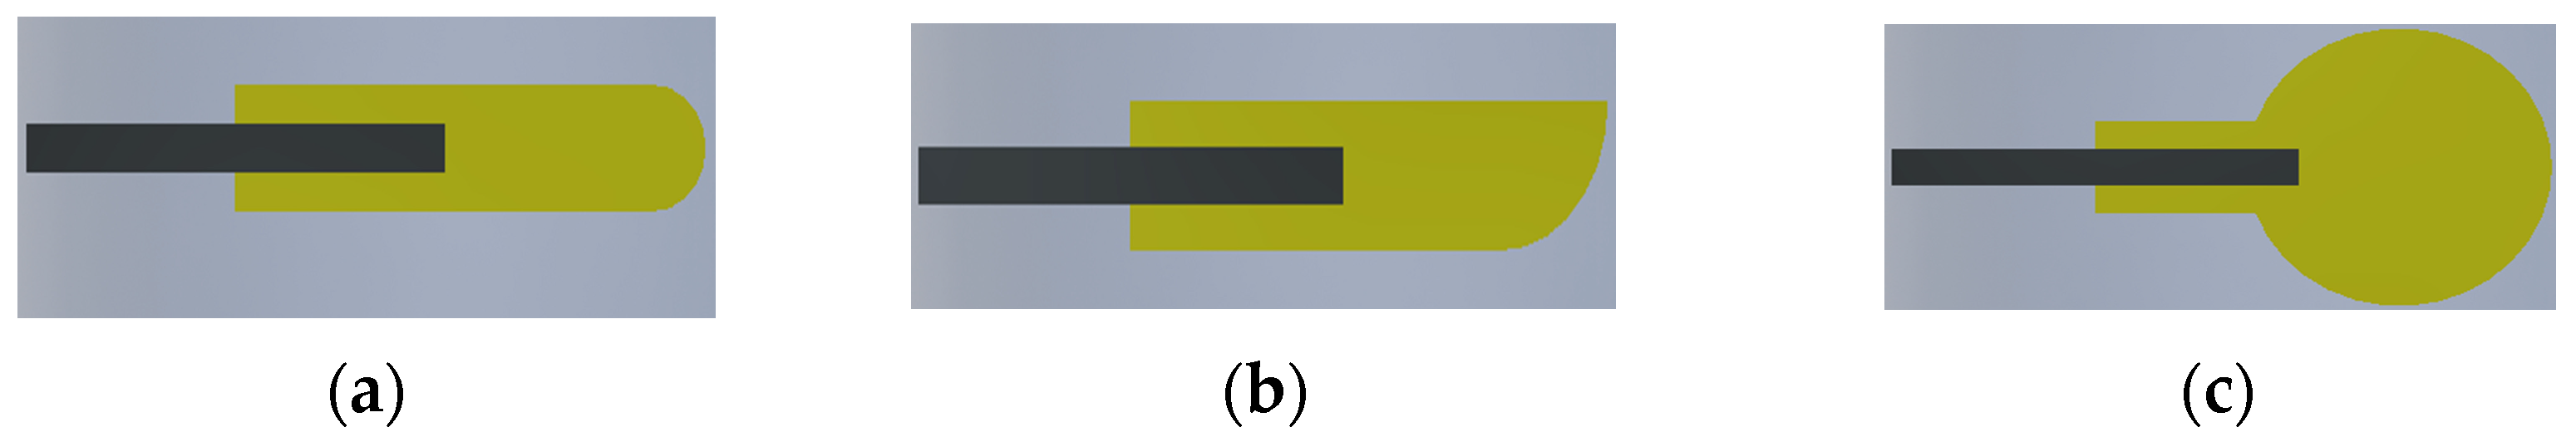
2.4. Material Selection and Wear Tests of the Key Component

From the analysis in Section 2.2, it can be seen that the damage of the shell or the kernel in the shelling process was mainly affected by the elastic modulus and radius of curvature of the key components. Therefore, materials with different elastic moduli were selected and used for the key components in the experiment. Based on [28,29] and the materials used for manufacturing the key components of agricultural primary processing equipment, rubber, polyurethane, nylon, wood (cypress), and Q235 steel were selected for the key shelling component. Table 1 shows the elastic modulus of the selected materials.
In addition to the shelling quality of different materials, wear resistance is a criterion for evaluating the long-term suitability of the material for manufacturing the key component. Therefore, the wear resistances of the selected materials should be examined. Q235 steel is known for its superior wear resistance. This study tested only the wear resistance of the other selected material. Before the wear test, each selected material was mounted and secured to the peanut shelling equipment, and the shelling operation was performed for 3 h, after which the key components were removed, and the work surface was measured for wear using a laser confocal microscope (OLS-4100, Olympus Company, Tokyo, Japan). The magnification of the measurements was 20× and the measurements were in microns. Samples weighing not less than 200 g were taken three times in the three-hour shelling process for each test of the selected material, and the MDR and SE were evaluated.

2.5. Performance Evaluation

MDR and SE are the key evaluation indices of the peanut shelling quality. MDR is the proportion of the total mass of damaged (W1) and coat-torn peanuts (W2) in the total weight of damaged, coat-torn, and intact peanuts. SE is the proportion of the total mass of damaged peanuts (W1), coat-torn peanuts (W2), and intact peanuts (W3) in the total weight of peanuts fed for shelling. The MDR and SE were calculated using the following equations according to the operation quality for peanut machines, Ministry of Agriculture of the People’s Republic of China, 2006:
MDR = W 1 + W 2 W 1 + W 2 + W 3 ,
SE = W 1 + W 2 + W 3 W 1 + W 2 + W 3 + W 4 ,
where the MDR and SE are expressed as percentages and W4 is the mass of unshelled peanut kernels (kg).

2.6. Single-Factor Tests

Single-factor experiments were conducted using the equipment shown in Figure 1. The influence of the elastic modulus and radius of curvature on the quality of the shelling operation was studied by using key components made of different materials with different radii of curvature. In this experiment, the rotational speed of the key components of the peanut sheller was adjusted using frequency conversion adjustment technology, and the gap between the drum and the concave screen was adjusted according to the mounting size of the key components. Single-factor experiments were conducted with different operating parameters. Each single-factor test was carried out 5 times for the selected parameter, and the average values of the results were recorded.

2.7. Box–Behnken Design for Laboratory Testing

The BBD of the experimental scheme was applied to simplify the test, reduce the test duration, and improve the test efficiency [30,31], and it was further used for multi-objective optimization. The valid range of each factor of the BBD test can be obtained according to the single-factor test results. The results of the above-mentioned studies were extensively referenced for single-factor experiments to identify the effective range of influence of the factors. The acquired workable range of each influential factor was further normalized to −1, 0, and 1, which correspond to the lower limit, center point, and upper limit of the workable ranges, respectively. The results of the BBD experimental scheme, based on Table 2, were obtained using Design-Expert 12 (version 12.0.3.0; Stat-Ease, Inc., Minneapolis, MN, USA), as shown in Table 3. With this simplification, the total experimental work was reduced to 29 runs [32].

2.8. Construction of System Optimization Models

Based on the results of the single-factor tests, BBD was used to design the experimental scheme for modeling the shelling performance. Then, the acquired SE and MDR models were evaluated and refined by using significance tests. Multi-objective optimization and boundary conditions were defined for the shelling quality. Design-Expert 12.0.3.0 (version 12.0.3.0; Stat-Ease, Inc., Minneapolis, MN, USA) was used to calculate the optimal solution.

2.9. Model Evaluation and Verification Tests

The optimization results were verified and evaluated using production trial tests conducted at a smallholder peanut farm. Depending on the optimized results, the optimal moisture content of the peanut was adjusted, and the sheller was set to the required speed. The peanuts were then dried in hot air according to the optimal parameters. Samples were taken every 10 min while the sheller was in a steady state, and 0.5 kg of the sample was collected for each trial for the determination of MDR and SE.

3. Results

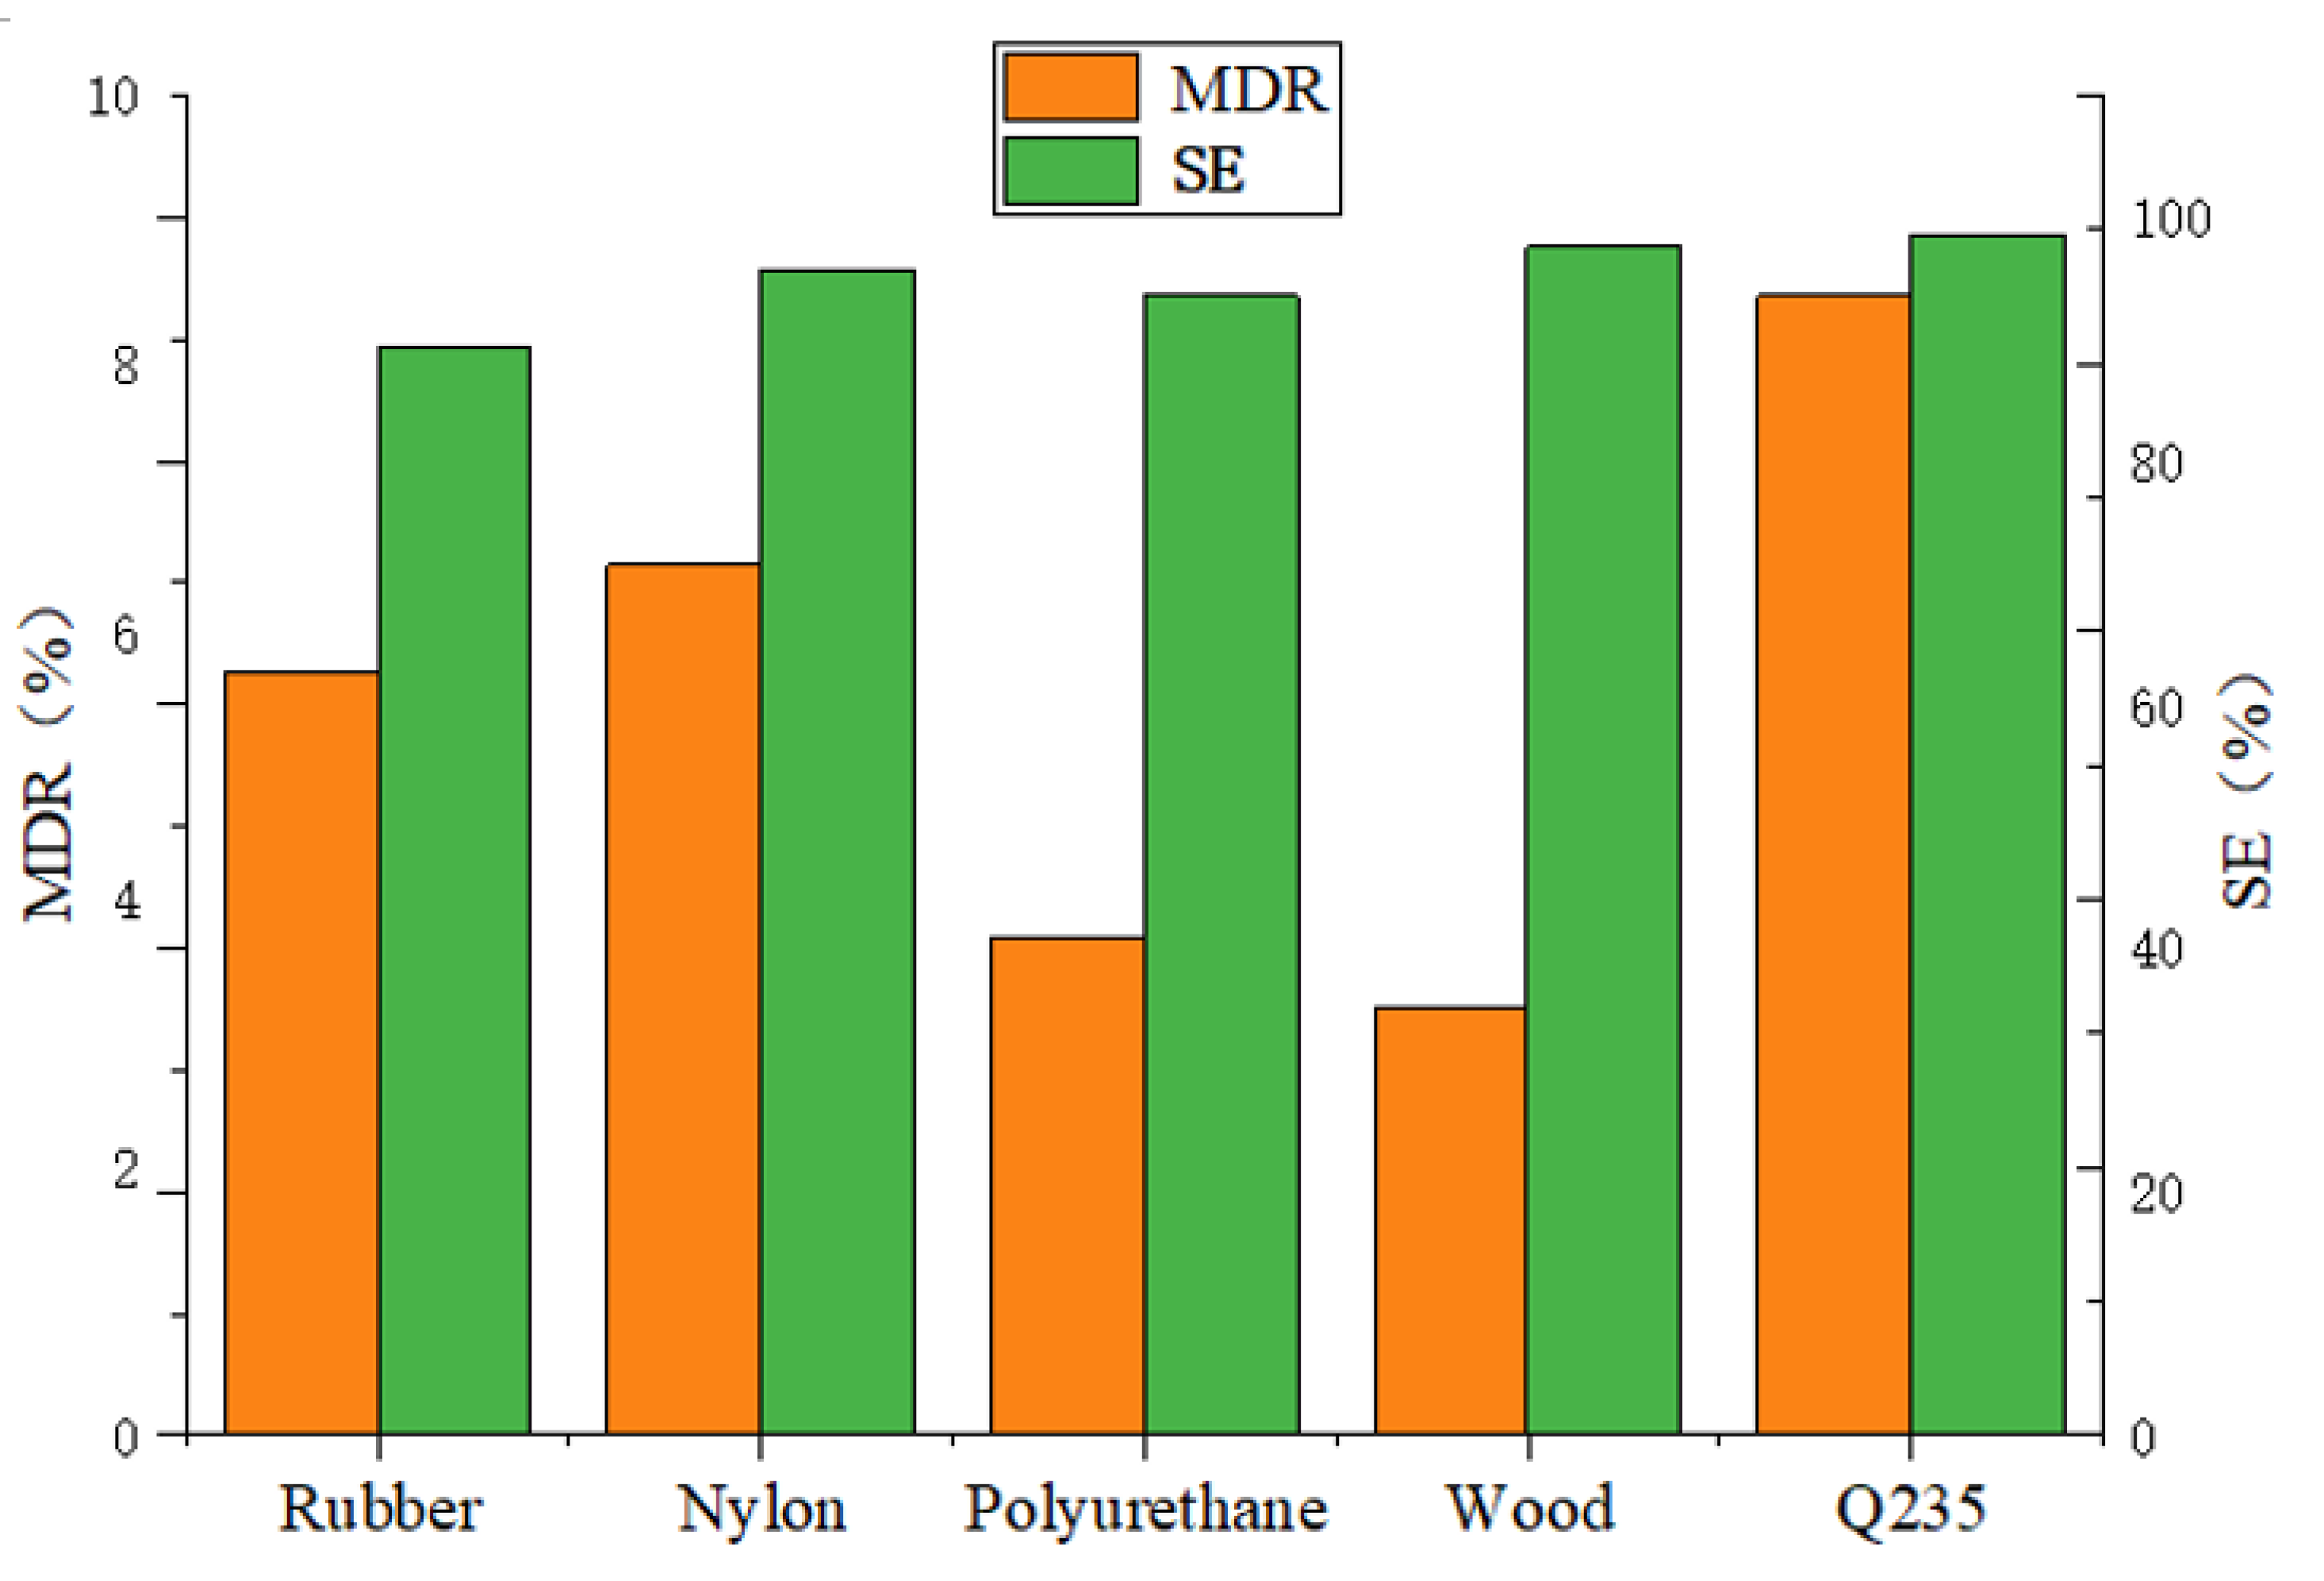
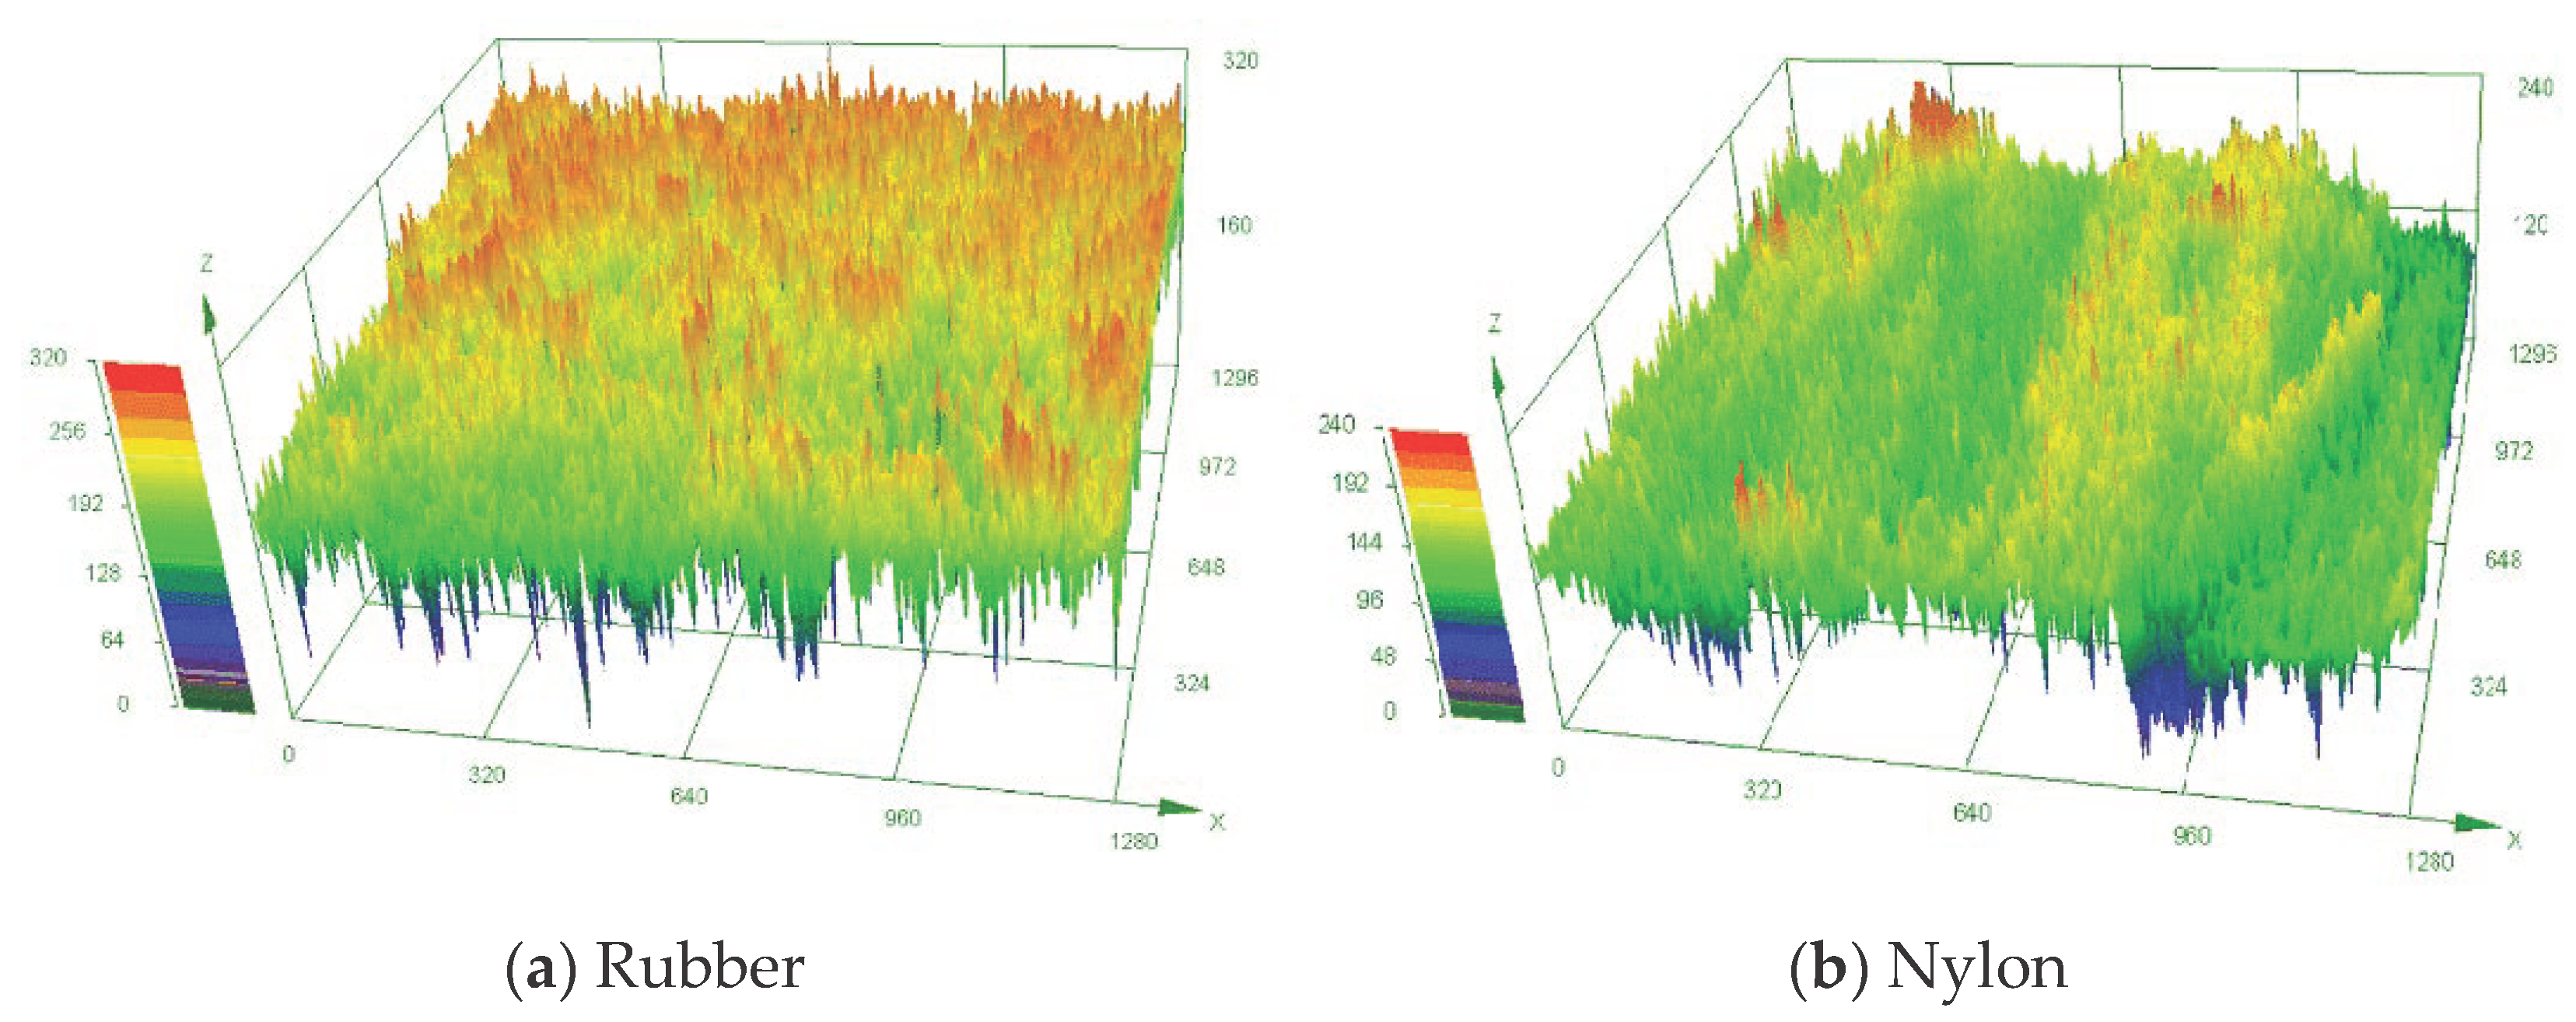
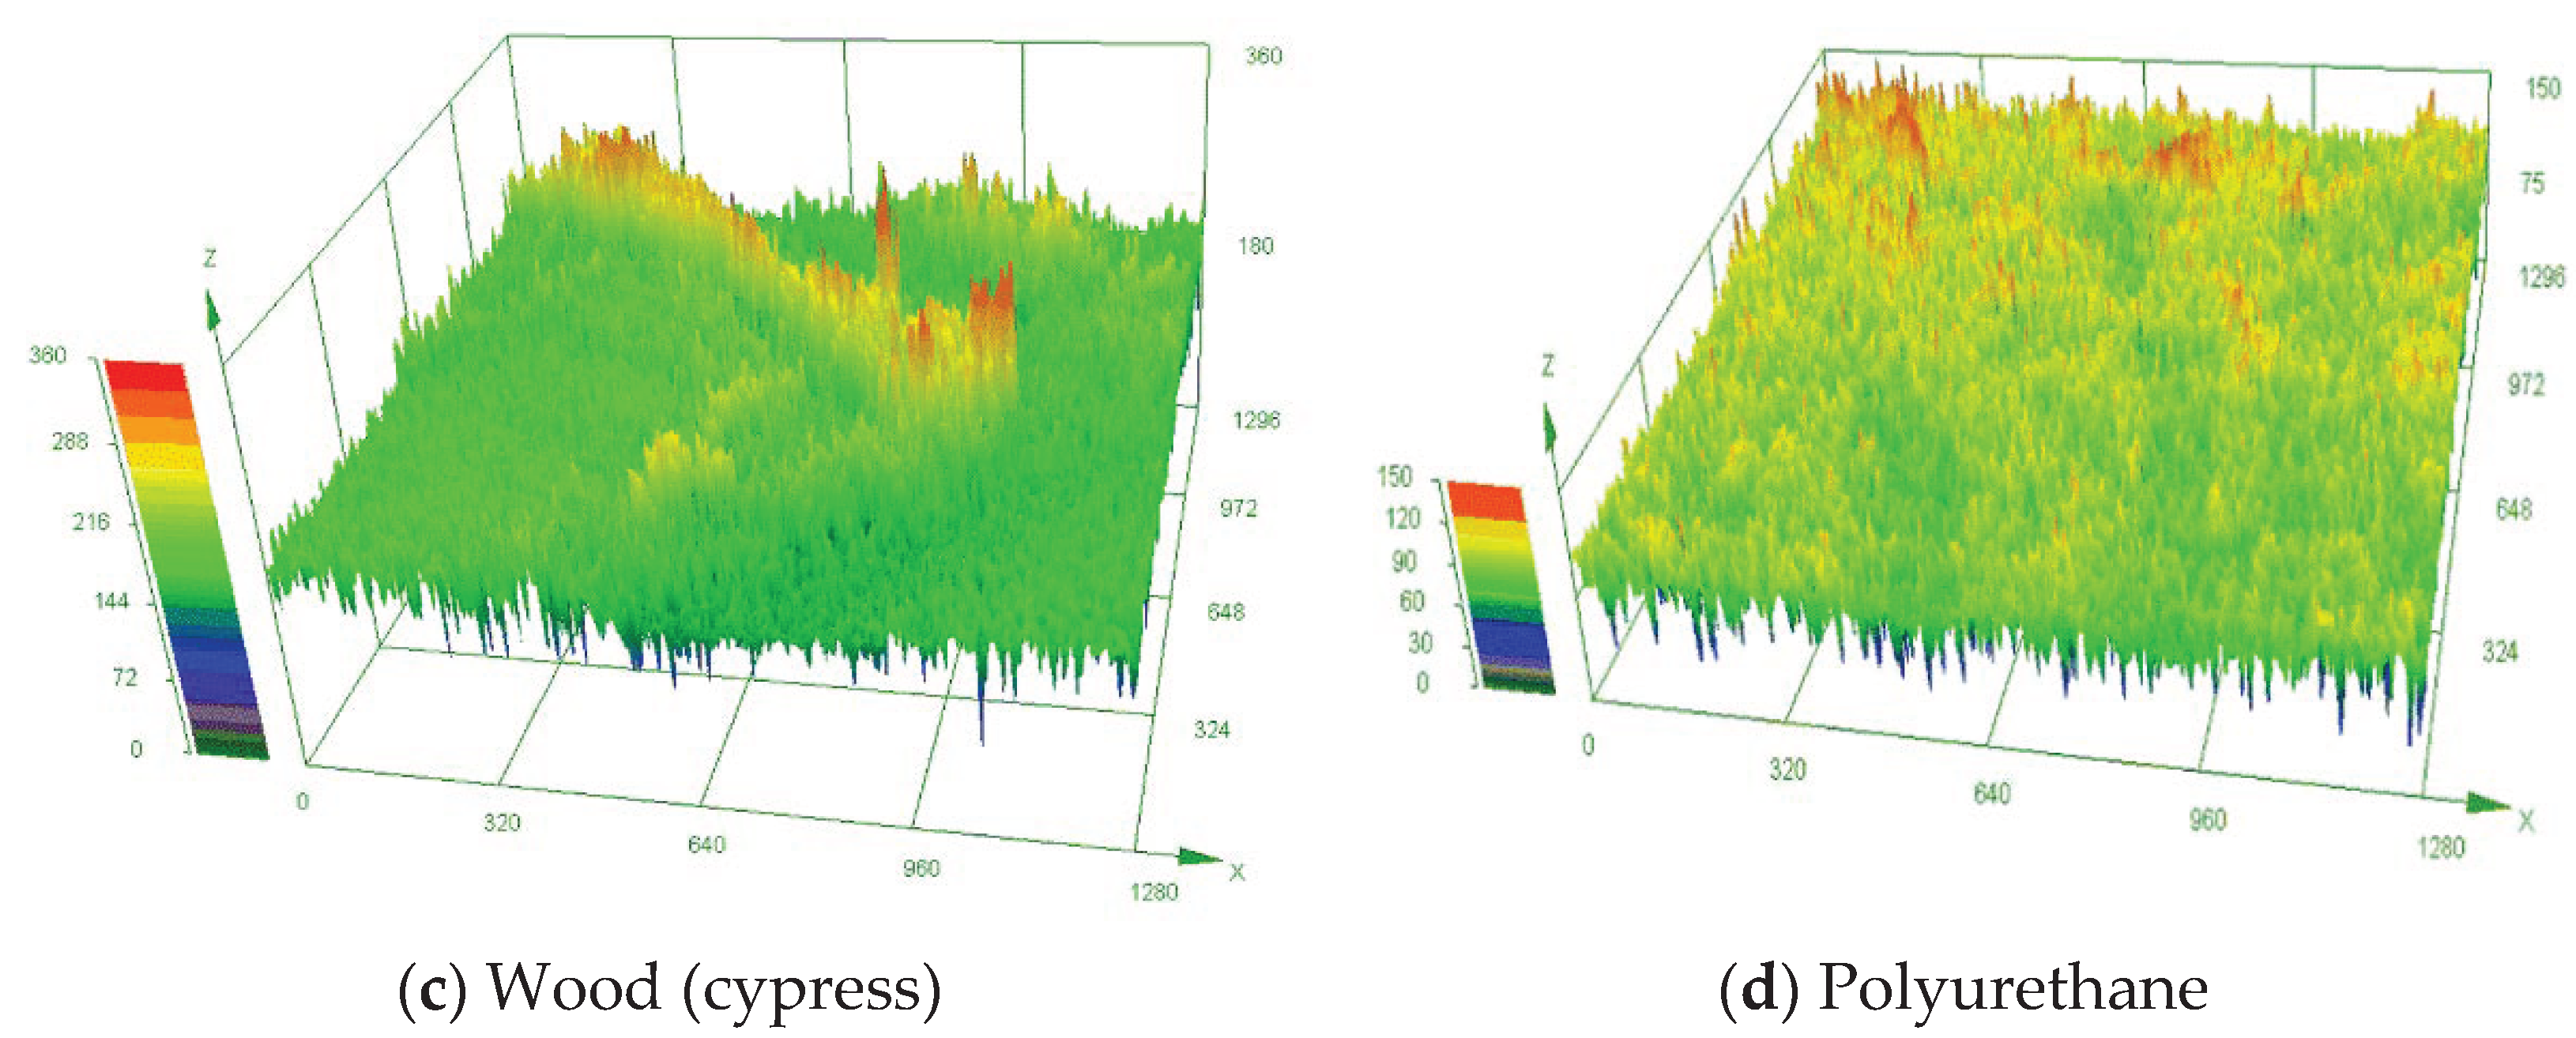
3.1. Shelling Quality and Wear of Key Components Made of Different Materials

The relationship between the material and shelling quality when different materials were used for the key components is shown in Figure 4. It can be seen from the figure that the SE changed slightly when compared with the traditional Q235 steel, regardless of the material selected. However, the MDR decreased significantly when wood and polyurethane were used as the material of the key components, which was beneficial in improving the shelling quality.
The wear test results are shown in Figure 5. According to the cloud chart, the key components made of rubber have obvious wear and scratches on the entire surface, whereas the key components made of wood and nylon have slight wear but uneven scratches, and some areas are seriously worn. The key components made of polyurethane have the least wear and no visible scratches; moreover, the wear is relatively uniform.
Based on the above-mentioned analysis and comparison of the shelling quality and wear, polyurethane has superior shelling quality among the selected flexible materials and is relatively the most wear resistant. In addition, the elastic modulus of polyurethane ranges from 5 to 600 MPa [33], which made it possible to carry out the test under the condition of the required elastic modulus; therefore, it was used as the material for the key components in the subsequent experiments.

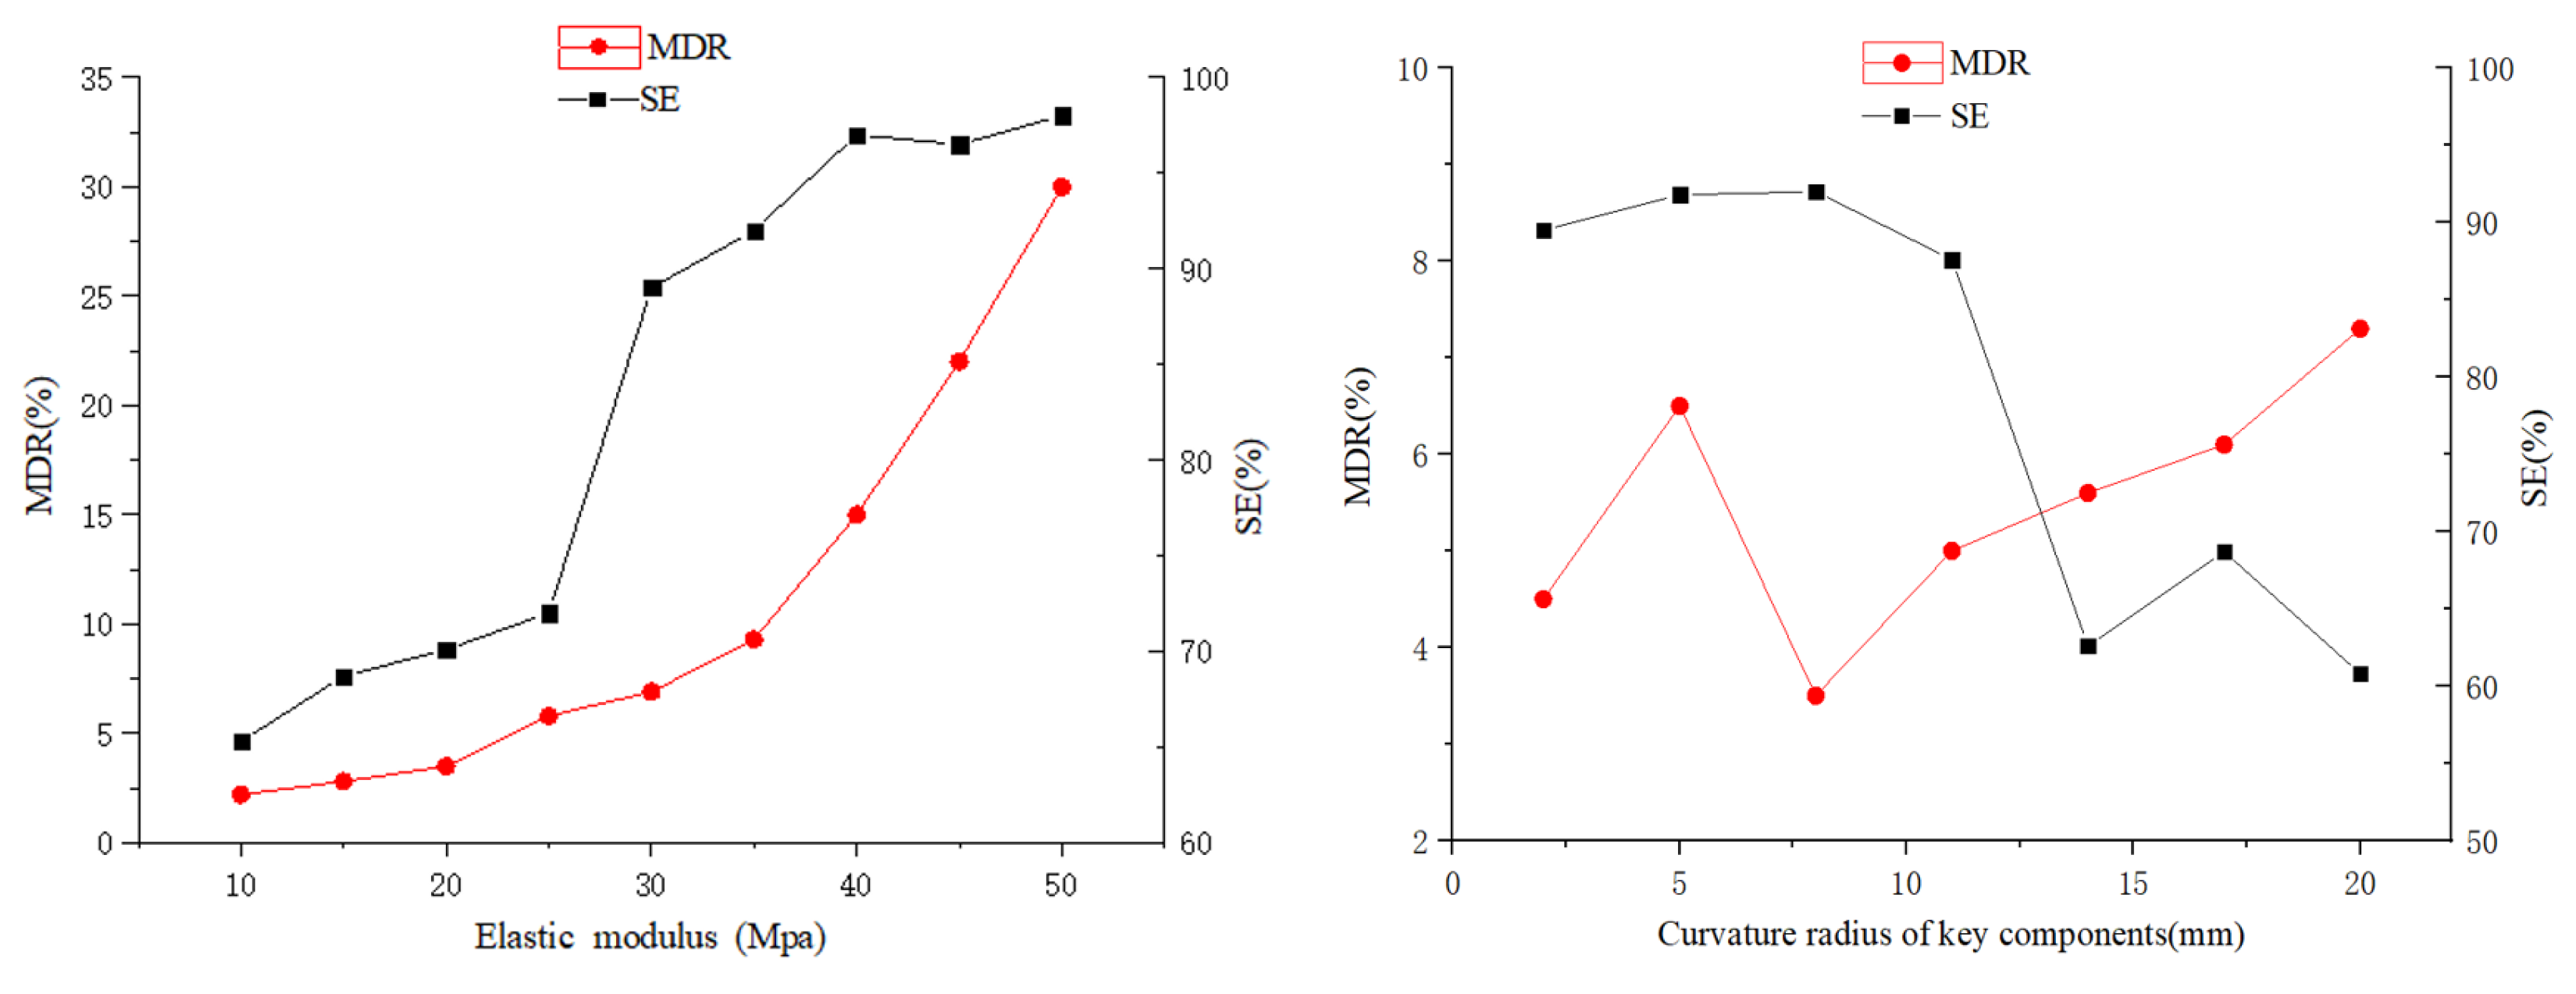
3.2. Single-Factor Effects on Shelling Performance

The test results for the influence of each factor on the quality of the shelling operation are shown in Figure 6. In general, both MDR and SE exhibited similar trends as the elastic modulus, rotating speed of the shelling drum, and clearance between the shelling drum and concave screen, whereas the radius of curvature showed a different trend. The interaction between the influential factors and the coupling effects among them could not be derived from these single-factor plots. Instead, the data from the single-factor plots were used in the BBD to devise a minimized experimental scheme aimed at illustrating these interactive and coupling effects. Single-factor experiments were also used to determine the workable ranges and center point values of the individual independent variables, which were 10–45 and 27.5 MPa, 5–20 and 12.5 mm, 260–280 and 270 rpm, and 20–30 and 25 mm for the elastic modulus, radius of curvature of the key components, rotating speed of the shelling drum, and clearance between the shelling drum and concave screen, respectively, as shown in Table 2.

3.3. BBD Experiments and Theoretical Model of MDR and SE

The experiment was based on a quadratic orthogonal rotation combination test design. The experiment was designed and conducted by using Design-Expert software and the BBD method. A total of 29 tests were devised, with 10 replicates per test. The average value of the 10 test results is shown in Table 3. Design-Expert was used to perform multiple regression fitting on the test results in Table 3 to obtain the regression models of MDR (Y1) and SE (Y2).
The analysis of variance (ANOVA) was used to judge the significance of MDR (Y1), SE (Y2), and each variable, as shown in Table 4. It can be seen that the regression models of MDR (Y1) and SE (Y2) were extremely significant (p < 0.01), and the lack of fit of MDR (Y1) and SE (Y2) was not significant (p > 0.05), which means that the degree of fit of the regression model was good, and the prediction model can be used to predict the MDR and SE.
From the p-value of the ANOVA of the MDR, it can be judged that X 1 ,   X 3 ,   X 4 , X 1 X 3 , X 1 X 4 , X 2 X 4 , X 3 X 4 , X 1 2 ,   X 2 2 , X 3 2 ,   and   X 4 2 have a significant effect on the MDR (p < 0.01), whereas other regression terms have no significant effect (p > 0.05). The influence of each variable on the MDR can be quantitatively determined by the F value of each influencing factor. The primary and secondary order of influence on the MDR was as follows: X 1 , X 3 , X 4 , X 1 X 3 ,   X 1 2 , X 2 2 , X 1 X 4 , X 3 X 4 ,   X 3 2 , X 4 2 , and X 2 X 4 . Similarly, the results of the ANOVA of the SE were obtained as follows: X 1 ,   X 3 , X 4 , X 1 X 3 , X 1 X 4 , X 3 X 4 , and X 1 2 have a significant effect on the SE, whereas other regression terms have no significant effect on it. The primary and secondary order of influence on the SE was as follows: X 1 , X 3 , X 3 X 4 , X 1 X 4 , X 1 X 3 , X 4 , X 3 2 , X 1 2 ,   and   X 2 2 .
Based on the ANOVA, the regression equations of MDR and SE were obtained by excluding the insignificant items as follows:
Y 1 = 6.08 + 4.55 X 1 + 3.62 X 3 2.23 X 4 + 2.63 X 1 X 3 + 1.25 X 1 X 4 0.40 X 2 X 4 + X 3 X 4 + 1.87 X 1 2 + 1.10 X 2 2 + 0.6 X 3 2 + 0.32 X 4 2 ,
Y 2 = 91.24 3.62 X 1 + 2.97 X 3 1.07 X 4 2.17 X 1 X 3 + 2.78 X 1 X 4 2.86 X 3 X 4 1.19 X 1 2 0.92 X 2 2 1.27 X 3 2 .

3.4. Analysis of Variables Related to Shelling Quality

According to the predicted model and ANOVA results obtained above, three factors that had the most significant influence on the MDR and SE were selected to predict the impact laws for the MDR and SE, and the four-dimensional slice diagrams of the influence of the extremely significant factors were drawn using MATLAB software to analyze the variation in the MDR and SE with the extremely significant factors. According to the previous analysis, X1, X3, and X4 were the most significant factors for both MDR and SE. The four-dimensional slice diagrams of the MDR and SE are shown in Figure 7.
Figure 7a depicts a four-dimensional slice diagram of the three most significant factors affecting the MDR. It can be seen that the MDR increased gradually with the increase in the rotating speed of the shelling drum, the decrease in the clearance between the shelling drum and concave screen, and the increase in the elastic modulus. This may be because the increase in the rotating speed of the shelling drum increases the linear speed and striking force of the key shelling component on the peanut, leading to an increase in the MDR. With the decrease in clearance between the shelling drum and concave screen, the probability of direct collision between the peanut pods, seed kernels, and concave screen increased, and the probability of extrusion between the peanut pods decreased; consequently, the number of rigid strikes increased and flexible kneading among the peanut pods decreased during the shelling process, thus increasing the MDR. Due to the increase in the elastic modulus of the key shelling components, the deformation of the key components was less under the same stress during the collision between the shelling component and peanuts, which led to the deformation and breakage of the peanut kernel, increasing the MDR. Therefore, the MDR showed an increasing trend with the increase in the rotating speed of the shelling drum and elastic modulus of the key components, and the decrease in clearance between the shelling drum and concave screen.
Figure 7b shows a four-dimensional slice diagram of the three most significant factors on SE. As can be seen in the figure, the SE increased gradually with the increase in the rotating speed of the shelling drum and the decrease of clearance between the shelling drum and concave screen. Moreover, the rate of increase of SE was significantly higher at lower values of the elastic modulus than that at higher values. The reason may be that the strike force of the key components on the peanut shell was determined by the speed of the shelling drum. With the increase in the speed of the shelling drum, the strike force increased, resulting in easy cracking of the peanut shell at a higher striking force, which led to a higher SE. As the clearance between the shelling drum and concave screen became smaller, the thickness of the peanut between the shelling drum and concave screen reduced, and the possibility of the peanut pods being squeezed directly by the shelling drum and concave screen became greater; thus, the peanut shell was easier to crack and the kernel was obtained, resulting in a higher SE. It can also be seen from Figure 7b that the maximum SE might be achieved with a high rotating speed of the shelling drum, low clearance between the shelling drum and concave screen, and low elastic modulus.

3.5. Parameter Optimization

From the above analysis, the MDR and SE are often mutually restrictive optimization indices. In other words, reducing the MDR will inevitably lead to a lower SE, which is disadvantageous in shelling operations. Therefore, it is necessary to optimize the key parameters of peanut shelling to find the optimal solution to minimize the MDR and improve the SE to the greatest extent, and thus obtain the best shelling quality. The mathematical model of the double objective function of MDR (Y1) and SE (Y2) was constructed and solved by using Design-Expert software to predict the optimal parameters. The objective function and constraint conditions are as follows:
Y 1 m i n = Y 1 X 1 , X 2 , X 3 , X 4 Y 2 m a x = Y 2 X 1 , X 2 , X 3 , X 4 c o n s t r a i n t   c o n d i t i o n 10 X 1 45 5 X 2 20 260 X 3 280 20 X 4 30
According to the above constraint conditions, the optimal solution can be obtained when the MDR reaches the minimum value and SE is the maximum: X 1 = 10 MPa, X 2 = 12.77 mm, X 3 = 277.48 r/min, X 4 = 24.24 mm, Y 1 m i n = 4.89 % , and Y 2 m a x = 97.91 % .

3.6. Verification Test

To verify the accuracy of the prediction model, the peanut shelling equipment was controlled to operate according to the above parameters. A comparison between the optimized value and results of the verification test is presented in Table 5.
As can be seen from Table 5, the average relative errors of MDR and SE according to the optimal parameters were 5.3% and 2%, respectively, which meant that the optimal solutions obtained by the predicted model and verification test were very close to each other. It was also proven that the optimization was accurate and effective, indicating that the predicted model was feasible for optimizing the shelling quality.

4. Discussion

In this study, the contact mechanics between the key components and peanuts during the peanut shelling process was analyzed based on Hertz’s theory, seldom seen in the recent literature [17,18,19,20,21]. According to the analysis results, the strategy of reducing the MDR and improving the SE by improving the elastic modulus of the key components and optimizing their curvature radii was effective. This strategy has seldom been adopted in the literature on improving the quality of the shelling operation of peanuts, but there have been reports on improving the materials used for the key components of the shelling operation to improve the maize threshing quality by using rubber for key components [34].
Based on the shelling test and research on the wear characteristics of four common materials, a wear-resistant polyurethane material with a wide range of elastic modulus was selected. Key components made of this material were designed with different radii of curvature and tested. The key parameters affecting the quality of peanut shelling were selected for the single-factor test, from which the best parameter interval was selected. Subsequently, the BBD test method was used to design a response surface test, which not only simplified the test times but also improved the test efficiency as compared with works by Gao et al., Yi et al., and Hou et al. [18,21,22]. Through the ANOVA of the test results, the primary and secondary factors affecting the MDR and SE were determined, and their mathematical models were established. Based on the ANOVA, three factors that had the most significant effect on the work quality, namely, the elastic modulus, the rotating speed of the shelling drum, and the clearance between the shelling drum and the concave screen, were selected to draw a four-dimensional slice diagram to analyze the trend and regularity of the MDR and SE. The MDR gradually increased with the increase in the rotating speed and clearance of the shelling drum, and the increase in the elastic modulus, while the SE increased with the increase in the rotating speed and the decrease in the clearance of the shelling drum. Moreover, the growth rate was significantly higher when the elastic modulus was lower. Finally, the multi-objective optimization method was used to optimize the shelling quality, and the values of the variables were obtained when the MDR and SE reached the optimum at the same time. The accuracy of the prediction mathematical model was verified through tests, which not only proved the correctness of the analysis based on the Hertz theory but also further explained the feasibility of the BBD test in optimizing the peanut shelling quality. The selected test materials and key parameters can be applied to the optimization of the peanut shelling quality and improvement of the shelling equipment, and can provide a reference for the improvement of the shelling quality of other nuts.
In this study, the quality of peanut shelling was optimized by combining mechanical analysis, material optimization of key components, BBD test design, multi-objective optimization, and verification through the production test. However, the range of flexible materials selected in the test was relatively small. In future research, a high-quality shelling material with better wear resistance and higher shelling quality can be obtained by expanding the screening range of the test materials.

5. Conclusions

Small peanut shellers are widely used in major peanut-producing countries in the world where smallholders dominate. Peanut supply from these countries accounts for 70% of the world’s peanut market [10]. Improved peanut shelling quality for smallholding peanut producers bears great significance to reduce shelling loss, improve smallholders’ income, and upgrade processed peanut quality.
The mechanical interactions between the shelling parts of the machine and the peanut were analyzed with Hertz theory, providing a theoretical basis for material and parameter optimization of key components. The flexible polyurethane material with good wear resistance was selected and made into shelling key components with different radii of curvature, proving its suitability for the peanut shelling industry. BBD was used for the experimental design and proved its power for the large number of influential factors involved and the demand for multi-objective experimental optimization. Considerations on the material’s elastic modulus, curvature radius, screen clearance, and drum speed of key components with polyurethane allowed us to conduct a thorough search within all the possible combinations of the factors and hence achieve the optimum shelling quality. Despite this, the selection of flexible materials for the experiment was still narrow in scope. There is a need to investigate more materials for the peanut shelling industry.
The single-factor test and BBD test on the elastic modulus showed that the radius of curvature of the key components, rotating speed of the shelling drum, and clearance between the shelling drum and concave screen affected the shelling operation quality. The ANOVA, mathematical modeling, and multi-objective optimization of the BBD test results were used to rate the factors affecting the MDR and SE, and obtain the most influential parameters of the shelling quality, as follows: elastic modulus (X1) > rotating speed of the shelling drum (X3) > clearance between the shelling drum and concave screen (X4) > radius of curvature of key components (X2). The rated interactive effects among the independent variables were as follows: elastic modulus and rotating speed of the shelling drum (X1 × X3) > elastic modulus and clearance between the shelling drum and concave screen (X1 × X4) > rotating speed of the shelling drum and clearance between the shelling drum and concave screen (X3 × X4) for MDR, and rotating speed of the shelling drum and clearance between the shelling drum and concave screen (X3 × X4) > elastic modulus and clearance between the shelling drum and concave screen (X1 × X4) > elastic modulus and rotating speed of the shelling drum (X1 × X3) for SE. Moreover, the results from the multi-objective optimization were as follows: elastic modulus X1 = 10 MPa, rotating speed of the shelling drum X3 = 277.48 r/min, and clearance between the shelling drum and concave screen X4 = 24.24 mm, which yielded MDR = 4.89 % and SE = 97.91 % . The optimal results were verified through experiments, and the relative error between the verification test and optimization results was small, which further proved the feasibility and effectiveness of improving the shelling quality through the material optimization experiment design and multi-objective optimization. This study also provides a reference scheme for improving the shelling quality of other nuts.

Author Contributions

Conceptualization, J.W. and M.L.; methodology, J.W. and B.P.; software, H.X. and J.P.; validation, J.P., Z.H. and Q.D.; formal analysis, C.M.; investigation, J.W.; resources, H.X.; data curation, J.W.; writing—original draft preparation, J.W.; writing—review and editing, Q.D.; visualization, Q.D.; supervision, Q.D.; project administration, J.W.; funding acquisition, H.X. All authors have read and agreed to the published version of the manuscript.

Funding

This research was funded by the National Peanut Industry Technology System (grant number CARS-13).

Institutional Review Board Statement

Not applicable.

Informed Consent Statement

Not applicable.

Data Availability Statement

The datasets used and/or analyzed during the current study are available from the corresponding author upon reasonable request.

Acknowledgments

The authors would like to thank the teacher and supervisor for their advice and help during the experiments. We also appreciate the editor and anonymous reviewers for their valuable suggestions for improving this paper.

Conflicts of Interest

The authors declare no conflict of interest.

References

  1. Hosseinzadeh, A.R.; Esfahani, M.; Asghari, J.; Safarzadeh, M.N.; Rabiei, B. Effect of sulfur fertilizer on growth and yield of peanut (Arachis hypogaea L.). J. Sci. Technol. Agric. Nat. Resour. 2009, 48, 27–38. [Google Scholar]
  2. Oduma, O.V.; Inyang, U.E.; Okongoh, O.N. Impact of partial replacement of peanut paste with sesame seed paste on the nutritional and anti-nutritional components of butter made from the blends. Eur. J. Nutr. Food Saf. 2020, 12, 53–66. [Google Scholar] [CrossRef]
  3. Altberg, A.; Ran, H.; Chapnik, N.; Madar, Z. Effect of dietary oils from various sources on carbohydrate and fat metabolism in mice. Food Nutr. Res. 2020, 64, 1–12. [Google Scholar] [CrossRef]
  4. Moctezuma, E. Changes in auxin patterns in developing gynophores of the peanut plant (arachis hypogaeal.). Ann. Bot. 1999, 83, 235–242. [Google Scholar] [CrossRef] [Green Version]
  5. Racette, K.; Zurweller, B.; Tillman, B.; Rowland, D. Transgenerational stress memory of water deficit in peanut production. Field Crops Res. 2020, 248, 107712. [Google Scholar] [CrossRef]
  6. Hammons, R.O.; Herman, D.; Stalker, H.T. Peanuts; AOCS Press: Urbana, IL, USA, 2016; pp. 1–26. [Google Scholar]
  7. Hamza, M.; Abbas, M.; Abd Elrahman, A.; Helal, M.; Shahba, M. Conventional versus nano calcium forms on peanut production under sandy soil conditions. Agriculture 2021, 11, 767. [Google Scholar] [CrossRef]
  8. Musdalifah, A.P.; Kandari, A.M.; Hasid, R.; Bahrun, A.; Mamma, S.; Madiki, A. Effect of cow manure on growth and production of peanut plants in sub-optimal land. Asian J. Agric. Hortic. Res. 2021, 8, 38–47. [Google Scholar] [CrossRef]
  9. Stanley, M.F.; Shi, Z. An Overview of World Peanut Markets. In Peanuts; Stalker, T.H., Wilson, R.F., Eds.; AOCS Press: Columbus, NC, USA, 2016; pp. 267–287. [Google Scholar]
  10. Food and Agriculture Organization of the United Nations. Available online: https://www.fao.org/statistics/en/ (accessed on 29 June 2021).
  11. Singh, A.; Raina, S.N.; Sharma, M.; Chaudhary, M.; Rajpal, V.R. Functional Uses of Peanut (Arachis hypogaea L.) Seed Storage Proteins. In Grain and Seed Proteins Functionality; InTech Open: London, UK, 2021. [Google Scholar]
  12. Shi, A.; Wang, Q.; Liu, H.; Wang, L.; Zhang, J.; Du, Y.; Chen, X. Peanut processing quality evaluation technology. In Peanuts: Processing Technology and Product Development; Academic Press: Cambridge, MA, USA, 2016; pp. 23–61. [Google Scholar]
  13. Wang, Q. Peanut Processing Characteristics and Quality Evaluation; Springer: Singapore, 2018. [Google Scholar]
  14. Lu, R.; Yang, D.; Gao, L. Design and test on plot peanut sheller with vertical tapered drum. Trans. Chin. Soc. Agric. Mach. 2019, 50, 114–123, (In Chinese with English abstract). [Google Scholar]
  15. Na, X.; Liu, M.; Zhang, W.; Li, F.; Du, X.; Gao, L. Damage characteristics and regularity of peanut kernels. Trans. CSAE 2010, 26, 117–121. [Google Scholar]
  16. Helmy, M.A.; Mitrroi, A.; Abdallah, S.E.; Basiouny, M.A. Modification and performance evaluation of a reciprocating machine for shelling peanut. AMA Agric. Mech. Asia Afr. Lat. Am 2013, 44, 18–24. [Google Scholar]
  17. Gao, L.; Hui, Z.; Dong, H.; Xu, Z.; Liu, Z.; Li, H. Design and experiment of peanut sheller with three drums for plot breeding. Trans. CSAE 2016, 47, 159–165. [Google Scholar] [CrossRef]
  18. Butts, C.L.; Sorensen, R.B.; Nuti, R.C.; Lamb, M.C.; Faircloth, W.H. Performance of equipment for in-field shelling of peanut for biodiesel production. Trans ASABE 2009, 52, 1461–1469. [Google Scholar] [CrossRef]
  19. Atiku, A.A.; Aviara, N.A.; Haque, M.A. Performance evaluation of a bambara ground nut sheller. CIGR J. 2004, VI, 1–18. [Google Scholar]
  20. Yi, K.; Zhang, X.; Shen, Y.; Gao, L. Effect of moisture content on mechanical properties of peanut shelling and peanut kernel damage. J. Yangzhou Univ. Agric. Life Sci. Ed. 2013, 34, 65–69, (In Chinese with English abstract). [Google Scholar]
  21. Hou, J.; Yang, Y.; Dong, S.; He, T.; Bai, J.; Li, J. Experimental and finite element simulation of typical peanut seeds shelling characteristics. J. Northeast. Agric. Univ. 2017, 48, 74–85, (In Chinese with English abstract). [Google Scholar]
  22. Lan, X. Improved Design and Experimental Research on the Shelling Parts of Peanut Shellers. Master’s Thesis, Jilin Agricultural University, Changchun, China, 2017. [Google Scholar]
  23. Isaac, D.B.; Xiao, M.Y.; Li, Y.Y. Optimization of infrared-drying parameters for Ginkgo biloba L. seed and evaluation of product quality and bioactivity. Ind. Crops Prod. 2021, 160, 113108. [Google Scholar] [CrossRef]
  24. Pinto, J.A.; Prieto, M.A.; Ferreira, I.C.; Belgacem, M.N.; Rodrigues, A.E.; Barreiro, M.F. Analysis of the oxypropylation process of a lignocellulosic material, almond shell, using the response surface methodology (RSM). Ind. Crops Prod. 2020, 153, 112542. [Google Scholar] [CrossRef]
  25. Koya, O.A.; Faborode, M.O. Mathematical modeling of palm nut cracking based on Hertz’s theory. Biosyst. Eng. 2005, 91, 471–478. [Google Scholar] [CrossRef]
  26. Ojolo, J.S.; Eweina, B.A. Predicting cashew nut cracking using hertz theory of contact stress. J. Saudi Soc. Agric. Sci. 2019, 18, 157–167. [Google Scholar] [CrossRef]
  27. Palade, A.C.; Pillon, G.; Cicala, E.; Grevey, D. Subsurface treatment of a contact subjected to a hertz pressure. Int. J. Mech. Sci. 2013, 77, 107–112. [Google Scholar] [CrossRef]
  28. ASABE Standards. S410.2: Moisture Measurement—Peanuts; ASABE: St. Joseph, MI, USA, 2010. [Google Scholar]
  29. Chowdhury, M.H.; Buchele, W.F. Effects of the operating parameters of the rubber roller sheller. Trans. ASAE 1975, 18, 482–486. [Google Scholar] [CrossRef] [Green Version]
  30. Prabhakaran, P.; Ranganathan, R.; Muthu Kumar, V.; Rajasekar, R.; Devakumar, L.; Pal, S.K. Review on parameters influencing the rice breakage and rubber roll wear in sheller. Arch. Metall. Mater. 2017, 62, 1875–1880. [Google Scholar] [CrossRef] [Green Version]
  31. Askari, M.; Abbaspour-Gilandeh, Y.; Taghinezhad, E.; El Shal, A.M.; Hegazy, R.; Okasha, M. Applying the response surface methodology (RSM) approach to predict the tractive performance of an agricultural tractor during semi-deep tillage. Agriculture 2021, 11, 1043. [Google Scholar] [CrossRef]
  32. Xie, H.; Kong, D.; Shan, J.; Xu, F. Study the parametric effect of pulling pattern on cherry tomato harvesting using RSM-BBD techniques. Agriculture 2021, 11, 815. [Google Scholar] [CrossRef]
  33. Zhang, N.; Fu, J.; Chen, Z.; Chen, X.; Ren, L. Optimization of the process parameters of an air-screen cleaning system for frozen corn based on the response surface method. Agriculture 2021, 11, 794. [Google Scholar] [CrossRef]
  34. Petkevichius, S.; Shpokas, L.; Kutzbach, H.D. Investigation of the maize ear threshing process. Biosyst. Eng. 2008, 99, 532–539. [Google Scholar] [CrossRef]
Figure 1. (a) Shelling machine (6BH-800 peanut sheller, designed by Nanjing Institute of Agricultural Mechanization, Ministry of Agriculture and Rural Affairs), (b) schematic diagram of the shelling bin, and (c) internal structure of the shelling bin.
Agriculture 12 00146 g001
Figure 2. A kinematic scheme illustration of peanut shelling.
Agriculture 12 00146 g002
Figure 3. Key components with different radii of curvature. (a) key components with a radius of curvature of 5 mm, (b) key components with a radius of curvature of 12.5 mm, and (c) key components with a radius of curvature of 20 mm.
Agriculture 12 00146 g003
Figure 4. Relationship between MDR and SE for different materials.
Agriculture 12 00146 g004
Figure 5. Cloud maps of wear tests for different materials (a) cloud map of surface wear for rubber, (b) cloud map of surface wear for Nylon, (c) cloud map of surface wear for wood(cypress), and (d) cloud map of surface wear for Polyurethane.
Agriculture 12 00146 g005aAgriculture 12 00146 g005b
Figure 6. Effects of the single factor on MDR and SE.
Agriculture 12 00146 g006aAgriculture 12 00146 g006b
Figure 7. Four-dimensional slice diagrams of significant influencing factors on MDR (a) and SE (b).
Agriculture 12 00146 g007
Table 1. Test results of elastic modulus of different materials.
MaterialRubberPolyurethaneQ235NylonWood (Cypress)
Elastic modulus (MPa)22282.0 × 1052830100
Table 2. Key parameters and levels of the experiment for MDR and SE.
FactorsLevels
−101
X1: elastic modulus (MPa)1027.545
X2: radius of curvature of key components (mm)512.520
X3: rotating speed of the shelling drum (rpm)260270280
X3: clearance between shelling drum and concave screen (mm)202530
Table 3. Test scheme and results of the RSM experiments for MDR(Y1) and SE(Y2).
Test No.X1X2X3X4Y1 (%)Y2 (%)
100006.991.7
2110013.9386.03
30−10−19.2591.42
40000690.4
5−10−103.0187.26
6011011.3392.14
700−1−16.6185.4
800005.891.6
9001−111.8597.06
10−11004.3392.57
11−10010.2490.01
12−100−17.297.71
130−1−103.9385.86
1400005.792.1
15010−110.2191.74
16100−113.884.91
1701−104.3986.3
1800−110.1588.98
190−1015.5989.26
20−10104.9997.54
2110−106.8584.36
22100111.8488.33
2300119.3989.2
240−11011.4791.9
250000690.4
2601014.9589.62
27−1−1004.6792.93
28101019.3585.96
291−10013.2784.99
Table 4. ANOVA of test results.
SourceMDRSE
Sum of SquaresdfFpSum of SquaresdfFp
Model531.0814584.89<0.0001381.6214153.14<0.0001
X1248.4313830.42<0.0001157.251883.44<0.0001
X20.07711.18<0.00010.3511.950.1845
X3157.2512424.600.2949105.851594.67<0.0001
X459.671920.10<0.000113.74177.18<0.0001
X1 X20.2513.85<0.00010.4912.750.1193
X1 X327.671426.590.069818.841105.82<0.0001
X1 X46.25196.37<0.000130.911173.67<0.0001
X2 X30.09011.39<0.00011.00 × 10−210.0560.8161
X2 X40.6419.870.25844.00 × 10−412.247 × 10−30.9629
X3 X44.00161.670.007232.721183.81<0.0001
X 1 2 22.681349.73<0.00019.19151.60<0.0001
X 2 2 7.851121.01<0.00015.49130.84<0.0001
X 3 2 2.34136.00<0.000110.46158.78<0.0001
X 4 2 0.66110.24<0.00010.2311.320.2706
R 2 0.9983 0.9935
Residual0.9114 2.4914
Lack of Fit0.000100.0001.0000.000100.0001.000
Pure Error0.914 2.494
Cor Total1029.0428 384.1228
Table 5. Comparison of theoretical value and verification test value.
TestMDR (%)Relative Error (%)SE (%)Relative Error (%)
Optimized ValueTest ValueOptimized ValueTest Value
14.895.216.597.7198.961.3
25.14.396.191.6
34.625.593.983.8
45.124.797.350.4
54.625.594.882.9
Mean value/4.95.3/96.272.0
Publisher’s Note: MDPI stays neutral with regard to jurisdictional claims in published maps and institutional affiliations.

