1. Introduction
The pear belongs to the genus Pyrus in the family Rosaceae and has been cultivated for more than 3000 years [
1]. The pear fruit (
Pyrus communis L.) is becoming increasingly popular in the diet due to its nutritional and sensory properties [
2]. Pears are an additional source of nutritional content for humans and animals [
3]. Pears are especially valuable for human consumption because they contain a number of vitamins and minerals that help strengthen the immune system [
4]. Pears can be eaten fresh and are an important ingredient for the food industry.
To enable long-distance transport of fresh fruit, fruits are often harvested at the unripe stage [
5] and ripen during transport or storage. Since pears are perishable, it is necessary to use special distribution channels to avoid their loss of quality [
6]. The choice of pear varieties depends on market demand and market capacity, both in fresh consumption and in processing [
7]. Therefore, when starting any agricultural activity, it is necessary to know how certain varieties will be accepted on the market, and how customers will accept these products.
The market connects producers on the one hand and buyers on the other. In the market, there is an interaction between seller and buyer, which enables agricultural producers to generate income by selling their products, and enables buyers to obtain food products [
8]. It is crucial for producers and wholesalers to have information about the variety which is most sought and which variety is most easily handled (processed, stored, and shipped to customers).
This paper deals with the evaluation of pear varieties in terms of customer requirements and the supply chain, because it is necessary to distribute the pear and deliver it to the customer. Customer requirements are to get the best quality at the lowest price [
9], which is often unrealistic in practice. To meet customer requirements, manufacturers use a supply chain. The supply chain has the task of connecting the flows of materials and raw materials, finance, and information [
10] between producers and customers.
The aim of this paper is to evaluate the pear varieties that are mostly produced in Serbia in order to select the variety that best meets the customers’ requirements in terms of quality, price and cost. However, in order to meet these conditions, the pear fruit needs to be processed and packaged, stored, and transported to the customer. Based on that, pear varieties will be observed using several criteria. Due to the existence of a number of criteria that individual varieties of pears must take into account, multicriteria decision-making (MDCM) will be used in this paper. Market evaluation of individual pear varieties will be done by applying expert decision-making, where experts will evaluate pear varieties.
The contribution of this paper is reflected in the following. First, when there are many varieties, it is necessary to choose between them. MCDM methods can provide better information to agricultural producers and vendors of these products. Second, decision-making based on linguistic values will make decision-making easier, because these values are close to human thinking. Third, the use of the CRITIC (criteria importance through intercriteria correlation) method will reduce the subjective influence of decision makers. Fourth, a new decision-making methodology in agriculture will be applied.
The fuzzy CRITIC and fuzzy CRADIS (compromise ranking of alternatives from distance to ideal solution) methods will be used in the research. Fuzzy methods are applied when the ratings given by experts are in the form of linguistic values. Using the membership function, linguistic values are transformed into fuzzy numbers and the steps of the applied methods are performed.
2. Literature Review
The focus of the paper is on the market assessment of individual pear varieties using fuzzy methods. Migliore et al. [
11] investigated how buyers in Italy accept prickly pears. The results of the regression analysis show that it is important for customers that the pear is red, with small amounts of seeds, and that it is easy to peel. Nedeljković et al. [
12] used fuzzy PIPRECIA (pivot pairwise relative criteria importance assessment) and MABAC (multi-attributive border approximation area comparison) methods to evaluate hybrid oilseed rape varieties.
Gallardo et al. [
13] investigated which fruit characteristics are most valued by resellers and their results showed that the quality of fruits is given the most importance. Zamani et al. [
14] used fuzzy methods to assess and rank scenarios of adaptation to climate change in agriculture. They used the fuzzy TOPSIS (technique for ordering preference by similarity to ideal solution) and fuzzy PROMETHEE II (preference ranking organization method for enrichment of evaluations) methods. Khan et al. [
15] analysed the factors influencing the decision to consume fruit without pesticides and found a certain percentage of consumers that were willing to pay more for it.
Qureshi et al. [
16] evaluated the optimal sample for the needs of sustainable agriculture in India. They used the fuzzy TOPSIS method. Wang et al. [
17] investigated how much more consumers are willing to pay for fruit that is grown organically. Ceschi et al. [
18] investigated how much consumers are willing to pay for apples in relation to their characteristics. They proved that consumers are willing to pay more if the yellow apples are harvested in the Trentino-Alto Adige region, which is located in Italy. Choi et al. [
19] conducted an experiment to investigate which characteristics of apples influence the price most and obtained results that crunchiness and taste are the most important characteristics that determine the price. Cinar [
20] researched how consumers perceive new tropical fruit products and how willing they are to pay for these products.
Banihabib and Shabestari [
21] applied modified fuzzy methods TOPSIS and AHP (analytical hierarchy process) in order to make a decision on water management in agriculture based on the opinion of experts. Alaoui et al. [
22] used the fuzzy type 2 TOPSIS method to make decisions in the supply chain in agriculture. Balezentis et al. [
23] applied the SAW (simple additive weighting), TOPSIS and EDAS (evaluation based on distance from average solution) methods to assess crop sustainability at the state level on the example of Lithuania. Maksimović et al. [
24] used the fuzzy MARCOS (measurement alternatives and ranking according to compromise solution) method to evaluate plum variety for raising new orchards. Zolfaghary et al. [
25] assessed the possibility of using treated wastewater as irrigation water in agriculture using the GIS (geographic information system) and applying the AHP method.
Golfam et al. [
26] evaluated scenarios in agriculture in adapting to climate change using the AHP and TOPSIS methods. Elleuch et al. [
27] applied the methods of MOP (mathematical optimization programming) and AHP and used them to allocate water resources for irrigation on the example of southern Tunisia. Kieu et al. [
28] selected a location for the distribution of perishable agricultural products using the CoCoSo (combined compromise solution) and AHP methods.
Yeon et al. [
29] conducted an experiment with students in their acceptance of fresh apples, and came to the conclusion that students are willing to pay more for apples if they are bigger and crispier. Ahrendsen and Majewski [
30] investigated how consumers accept apples from the Gorjec region in Poland. They proved that there would be better acceptance and greater willingness to pay a higher price for these apples if it were stated that they are protected geographical indication products. Gebreegziabher and Tsegay [
31] investigated the prickly pear and found that the taste of the fruit, the size of the fruit, the presence of thorns and the hardness of the seeds influenced the selection of these pears.
Deepa et al. [
32] developed a new MIW (modified integrated weighting) method to calculate the weights of criteria for estimating peanut crop location. They also used the COPRAS (complex proportional assessment) method to rank peanut crop locations. Puška et al. [
33] selected a viable supplier of agricultural pharmacies supplying agricultural producers, using the interval fuzzy methods PIPRECIA and MABAC. Golfam et al. [
34] applied the fuzzy VIKOR (multi-criteria optimization and compromise resolution) and FOWA (fuzzy order weighted average) methods to select the best alternatives to agricultural water supply management for climate change adaptation. Nedeljković et al. [
35] selected an apple harvesting machine using CRITIC and fuzzy MARCOS methods.
3. Research Methodology and Methods
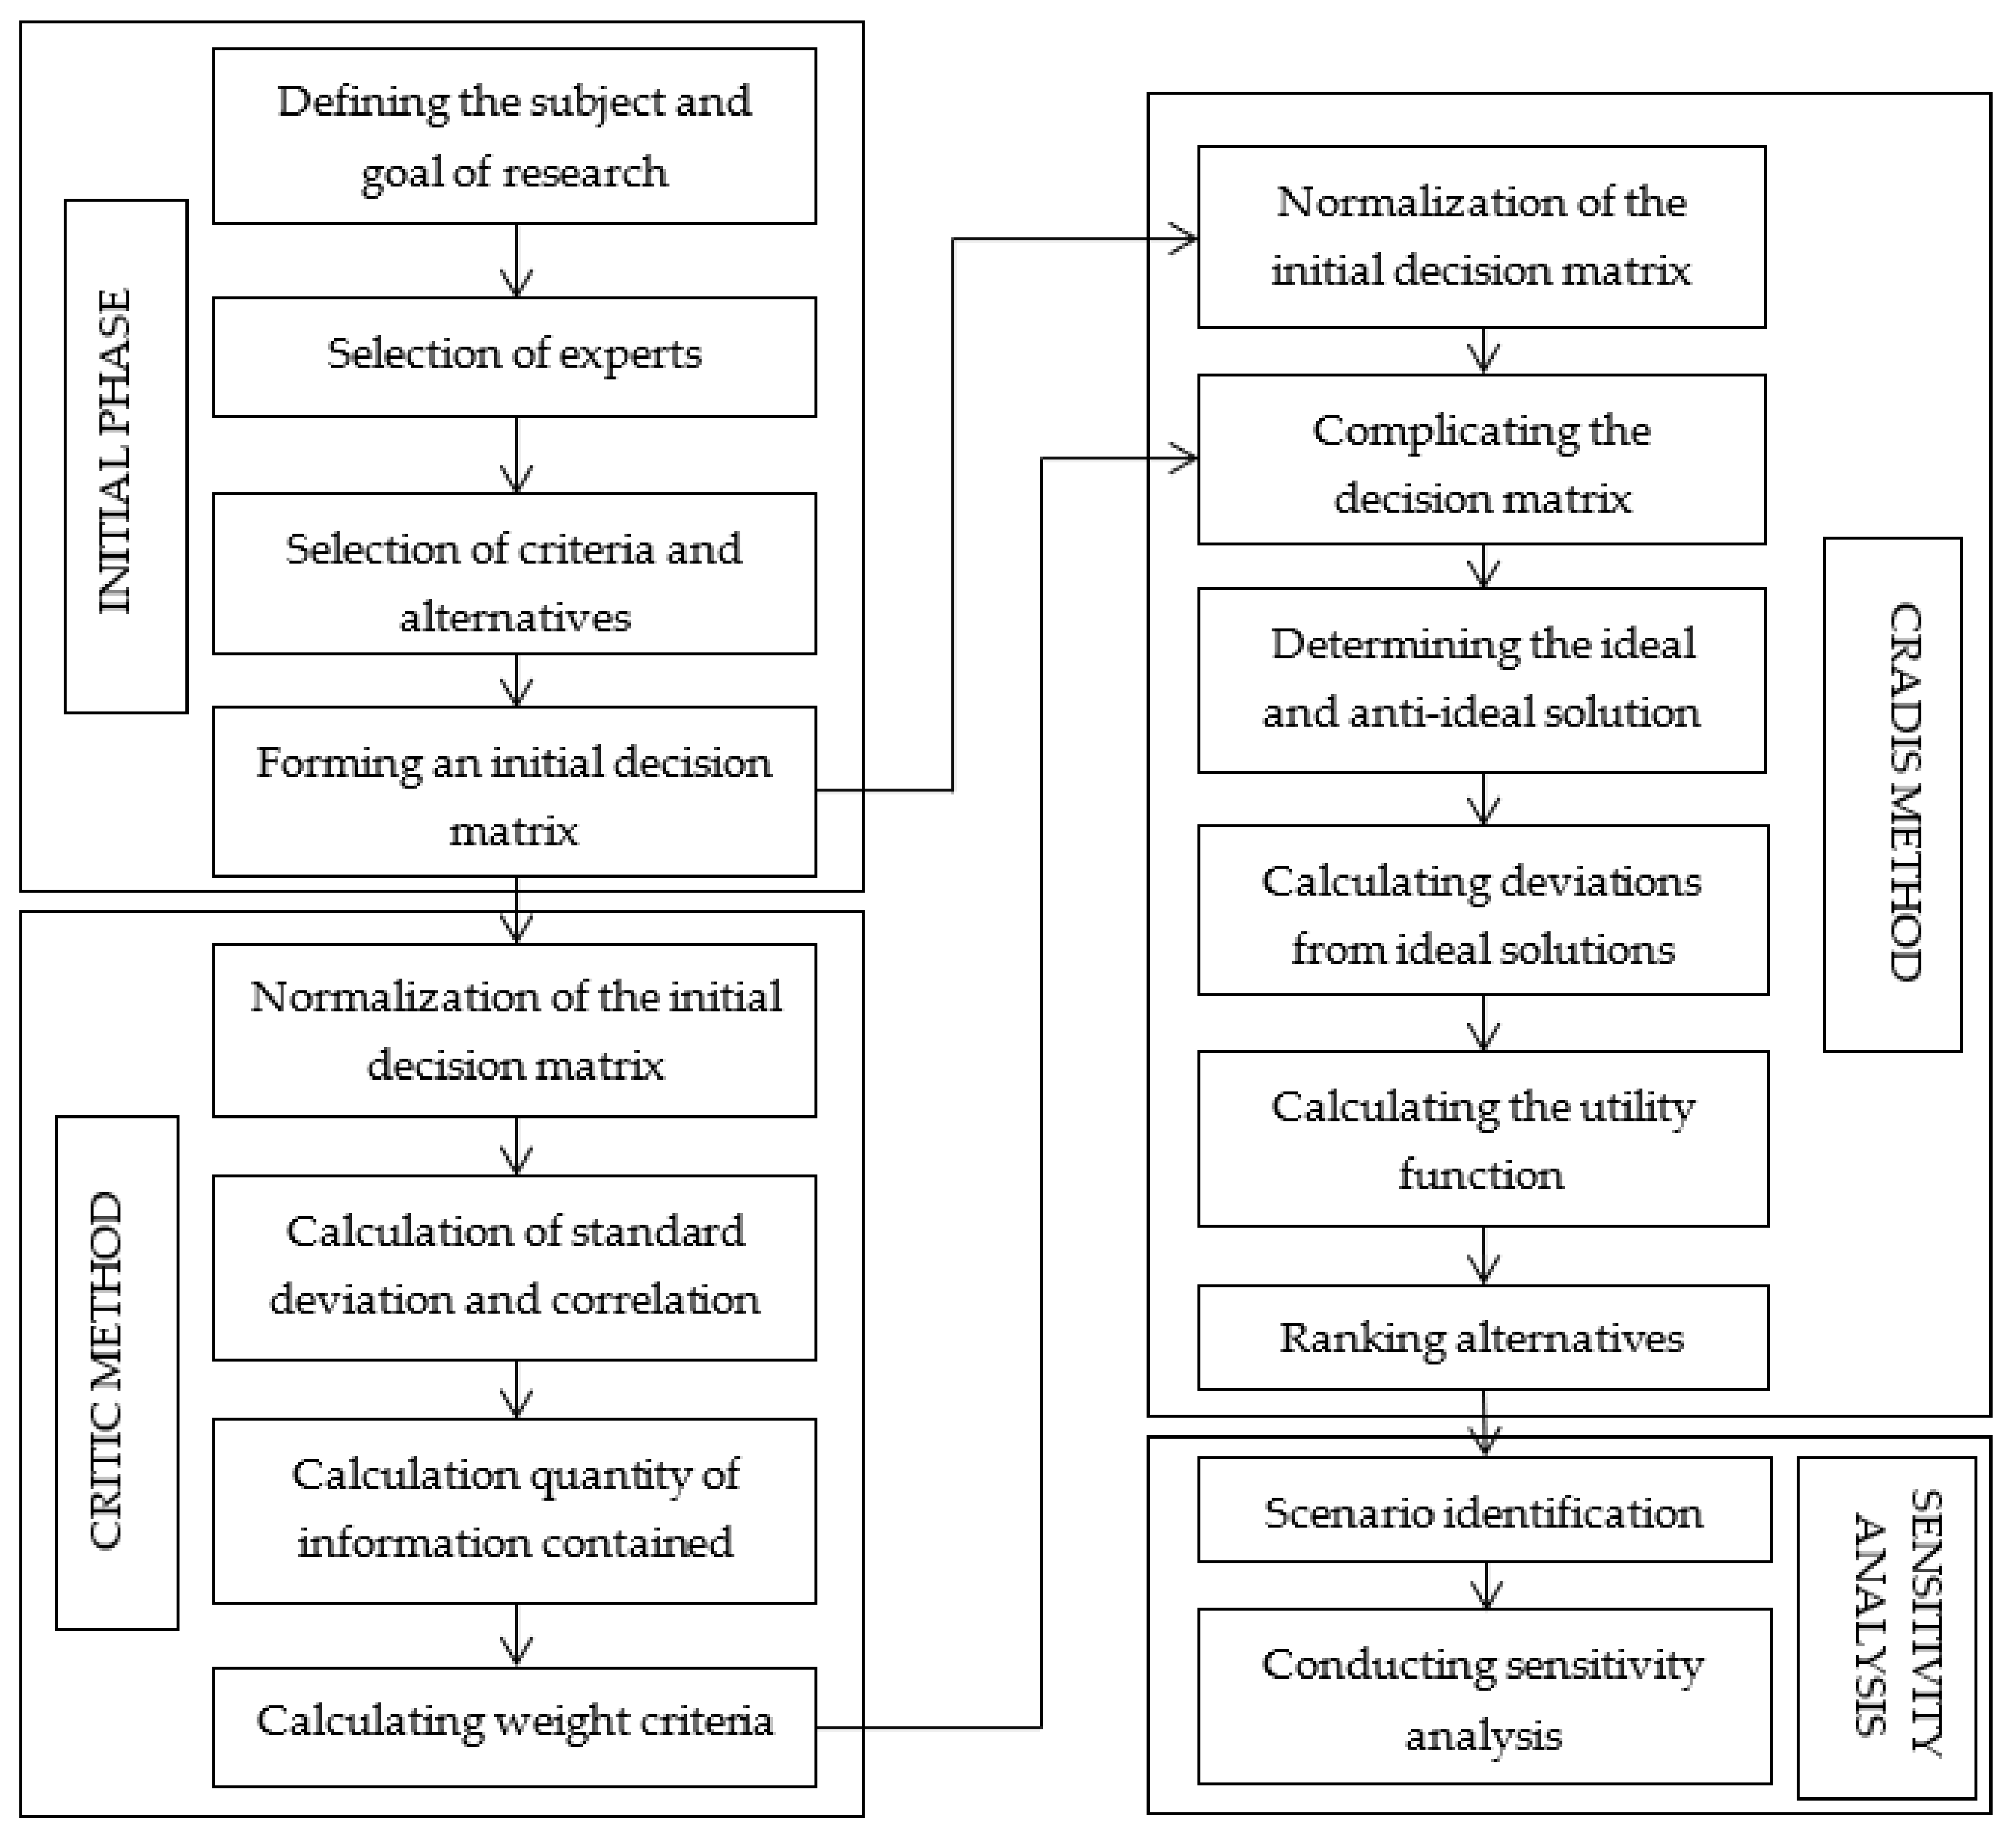
Figure 1 shows the research methodology conducted in the paper. The first step in all research is to define the subject and goal of the research. In the introduction to this paper, the subject and goal of the research are defined, so it will not be mentioned again here. The next step is to select an expert. For the needs of the research, five employees from the Department of Agriculture of the University of Novi Sad and Belgrade were selected. All experts have a doctoral degree in the field of agriculture with many years of experience in fruit growing.
Once the experts are identified, the criteria and alternatives in the research are determined (
Table 1). In this study, ten criteria are used; six criteria are of benefit type, while four criteria are of cost type. These criteria include market factors that affect fruit purchase. These factors are related to the quality of a particular pear variety, the cost of handling these varieties, and the possibility of selling and pricing these pear varieties. It is desirable that, for alternatives in the benefit type, their value is as high as possible, while in the cost type of criteria, the value of the alternative value is as small as possible.
Six alternatives will be used in the study (
Table 2). These alternatives are taken because these varieties are mostly grown in Serbia.
After the criteria and alternatives are determined, the experts’ next step is to evaluate these alternatives for the observed criteria. During the evaluation, a linguistic scale with seven degrees of disagreement is used, i.e., agreement with the stated criteria, ranging from very low to very high (Table 4). It is easier for experts to give linguistic value to a variety than a numerical estimate [
47]. Experts give ratings that are within the very low to very high scale. In this way, experts can more easily assess the criteria, especially those that are qualitative.
After the alternatives with certain criteria have been evaluated, the initial decision matrix is formed, which is the basis for calculating the values of the weights of the criteria and ranking the alternatives. Before the criteria are ranked, the weights of the criteria are calculated using the CRITIC method.
3.1. Fuzzy CRITIC Method
The CRITIC method was developed by Diakoulaki et al. [
48]. This method is used to determine the objective values of the weights of the criteria, which includes the intensity of the contrast and the conflict that is contained in the structure of the decision-making problem [
49]. To determine the contrast of the criteria, the standard deviations of the standardized criterion values of the variants per column are used, as well as the correlation coefficients of all pairs of columns. The steps in implementing the CRITIC method are as follows:
Step 1. Normalization of the initial decision matrix. The following terms are used for normalization:
For cost criteria:
where:
Xj is the maximum value of the feature for a particular criterion, and
is the minimum value of the feature for a particular criterion
Step 2. Calculation of the values of standard deviation and linear correlation of the matrix by columns.
Step 3. Determining the amount of information. The following expression is used to determine the amount of information:
where
is the standard deviation of the criterion, and
is linear correlation coefficient for the criteria.
Step 4. Calculation of final values. The following expression is used to calculate the final values of the criteria:
The CRITIC method assigns more weight to a criterion if the value of the standard deviation is higher, which means that this criterion differs more from other criteria, i.e., deviates more from these criteria if this criterion is less related to other criteria. In this way, the criterion will get a higher value if its values deviate more from the values of other criteria. Criteria weight values are necessary when forming a weighted decision matrix. The CRITIC method will be used in such a way that the weight will be calculated individually for each fuzzy number.
3.2. Fuzzy CRADIS Method
Once the weights of the criteria have been determined, the next step is to rank the alternatives. The CRADIS method developed by Puška et al. [
50] was used to rank alternatives. The steps in implementing the fuzzy CRADIS method are as follows:
Step 1. Normalization of the decision matrix. Normalization is performed based on the following terms:
Step 2. Weighted decision-making matrices. A weighted decision matrix is obtained by multiplying the value of the normalized decision matrix by the corresponding weights.
Step 3. Determining the ideal and anti-ideal solution. The ideal solution is the greatest value of
in the weighted decision matrix, the solution represents the lowest value of
in the weighted decision matrix.
Step 4. Calculation of the deviation from the ideal and anti-ideal solution. Deviation from the ideal solution is done by subtracting the values of the weighted fuzzy decision matrix from the maximum value
. Deviation from the anti-ideal solution is calculated in such a way that the values of the weighted decision matrix are reduced by the minimum value
.
Step 5. Calculation of the estimate of the deviation of individual alternatives from ideal and anti-ideal solutions.
Step 6. Defuzzification of deviation estimates of alternatives from ideal and anti-ideal solutions.
Step 7. Calculation of the utility function for each alternative in relation to the deviations from the optimal alternatives.
where
is the optimal alternative that has the smallest distance from the ideal solution, while
is the optimal alternative that has the greatest distance from the anti-ideal solution [
50].
Step 8. Ranking the alternatives. The final value of the fuzzy CRADIS method is obtained by calculating the average deviation of the alternatives from the degree of effectiveness.
Ranking of alternatives is done according to the value of the fuzzy CRADIS method. The best alternative is the one with the highest value of , while the worst is the one with the lowest value of .
After performing the steps of the fuzzy CRADIS method, a sensitivity analysis is performed. Sensitivity analysis is performed to examine how much each criterion affects the final ranking order. Therefore, it is necessary to form scenarios in order to prefer a particular criterion over other criteria.
4. Results and Discussion
In order to rank the alternatives and determine the value of the weights of the criteria, it is necessary for the experts to evaluate the selected alternative with the selected criteria. Five experts labelled DM1 to DM5 are used in this study. These experts perform the assessment through linguistic values (
Table 3).
Before calculating criterion weights, it is necessary to transform linguistic values into fuzzy numbers. This procedure is done by applying the membership function (
Table 4). Each linguistic value has a corresponding fuzzy number value. Triangular fuzzy numbers are used here.
In order to perform operations with linguistic values, it is necessary to transform these values through the membership function into the appropriate fuzzy numbers (
Table 3). After the transformation of linguistic values into fuzzy numbers is performed, it is necessary to form the initial fuzzy decision matrix (
Table 5). This matrix is obtained by calculating the average values of fuzzy numbers. In this way, the same importance is given to all experts. The initial fuzzy decision matrix is the first step in the CRITIC and fuzzy CRADIS methods. Since it is necessary to determine the weights of the criteria for the CRADIS method, as well as other multi-criteria decision analysis (MCDA) methods, the CRITIC method will be performed first.
The first step in the CRITIC method is to normalize the initial fuzzy decision matrix. Data normalization is done so that all data is uniform and ready for processing. Uniform estimates are used in this study. However, the value of certain criteria should be as high or low as possible. It all depends on which type that criterion is, whether it is a benefit or a cost type. Criteria of the benefit type are normalized with expression (1), while criteria of the cost type are normalized with expression (2). By applying these expressions, the value of alternatives for certain criteria ranges from 0 to 1. The alternative that has the lowest value for each criterion takes the value 0, while the alternative that has the highest value for each criterion takes the value 1.
After the data have normalized, the other steps of the CRITIC method are applied (
Table 6). First, the value of the standard deviation (SD) for the observed criteria is calculated. After that, the value of the correlation matrix for all criteria is calculated (
). In this case, the correlation value for each criterion is calculated. Then, the value
is calculated, i.e., the value of the correlation coefficient is subtracted from the value 1. All these values are then added up for the individual criteria. These collected values are multiplied by the standard deviation and the value of the amount of information is obtained, which is then transformed by expression (6).
By applying the steps of the CRITIC method, weight values for the criteria are obtained (
Table 7). Weights determine the importance of certain criteria. The results show that the two criteria differ in weight from the others, namely criteria C6 and C7, which are almost two times higher than the other criteria. Criterion C6 (transport costs) has the highest value, deviating the most from other criteria. Criterion C8 (sales opportunity) has the lowest weight value, which shows that this criterion is most closely related to the second criterion.
The first step of the fuzzy CRADIS method is to normalize the initial fuzzy decision matrix. This normalization is performed in the same way as with the CRITIC method, using expressions (7) and (8). Expression (7) is used for the benefit type of criteria, while expression (8) is used for the cost type of criteria. Once the data is normalized, this normalized fuzzy decision matrix is aggravated using expression (9) (
Table 8).
After the data are normalized and aggravated, it is necessary to determine the ideal and anti-ideal solution. The ideal solution is the maximum value of normalized and aggravated data (max. = 0.204), while the anti-ideal solution is the minimum value of this data (0.009). After the ideal and anti-ideal solution is calculated, a deviation from these values is performed. It is necessary that a certain value of the alternative is as close as possible to the ideal solution and as far away from the anti-ideal solution as possible, in order for that alternative to be better evaluated. The difference between the CRADIS method and other similar methods, such as TOPSIS, MARCOS and ARAS (additive ratio assessment), is that it determines a unique ideal and anti-ideal solution for all alternatives and criteria and not for individual criteria. In this way, the meaning of the weight of the criteria is not lost. The calculation of deviations from these solutions is done using expressions 12 and 13. The next step is to add up the estimates of deviations from ideal and anti-ideal solutions (
,
) (
Table 9). Since we are working with fuzzy numbers, the next step would be to transform these numbers into grips numbers by defuzzification (expression 16). Finally, the utility function in relation to the optimal alternative (S0) is determined and the average deviation of the alternatives from the degree of utility is calculated.
The obtained results showed that the best ranked alternative is A5, followed by alternative A4, while the worst ranked alternative is A6 (
Table 9). These results showed that alternatives A5 (Konferans) and A4 (Viljamovka) have the best indicators of the other observed alternatives when looking at the market value of pears. Based on these results, it can be concluded that it is best for agricultural producers to grow these varieties of pears because they will be the best accepted on the market, taking into account the assessment of experts.
After determining the rank of the orders of the observed pears, a sensitivity analysis is performed. Sensitivity analysis aims to examine how a change in the weight of sub-criteria affects the ranking of alternatives [
12]. Based on that, the scenarios (
Table 10) in which the weights of the criteria are determined are formed. In the first scenario, all criteria are given the same importance, and they are assigned the same weighting factor of 0.1. In order to examine the impact of certain criteria on the ranking of alternatives, scenarios are formed in such a way that each criterion is given priority and its weight is 11 times higher than other scenarios. This criterion is assigned a value of criterion 0.55, while other criteria are assigned a weight of 0.05. This is because the greater the difference between the criteria, the greater the impact of that criterion on the ranking of alternatives. In addition to these scenarios, another scenario is taken, where the same weights are given for all criteria. In this way, ten scenarios are formed.
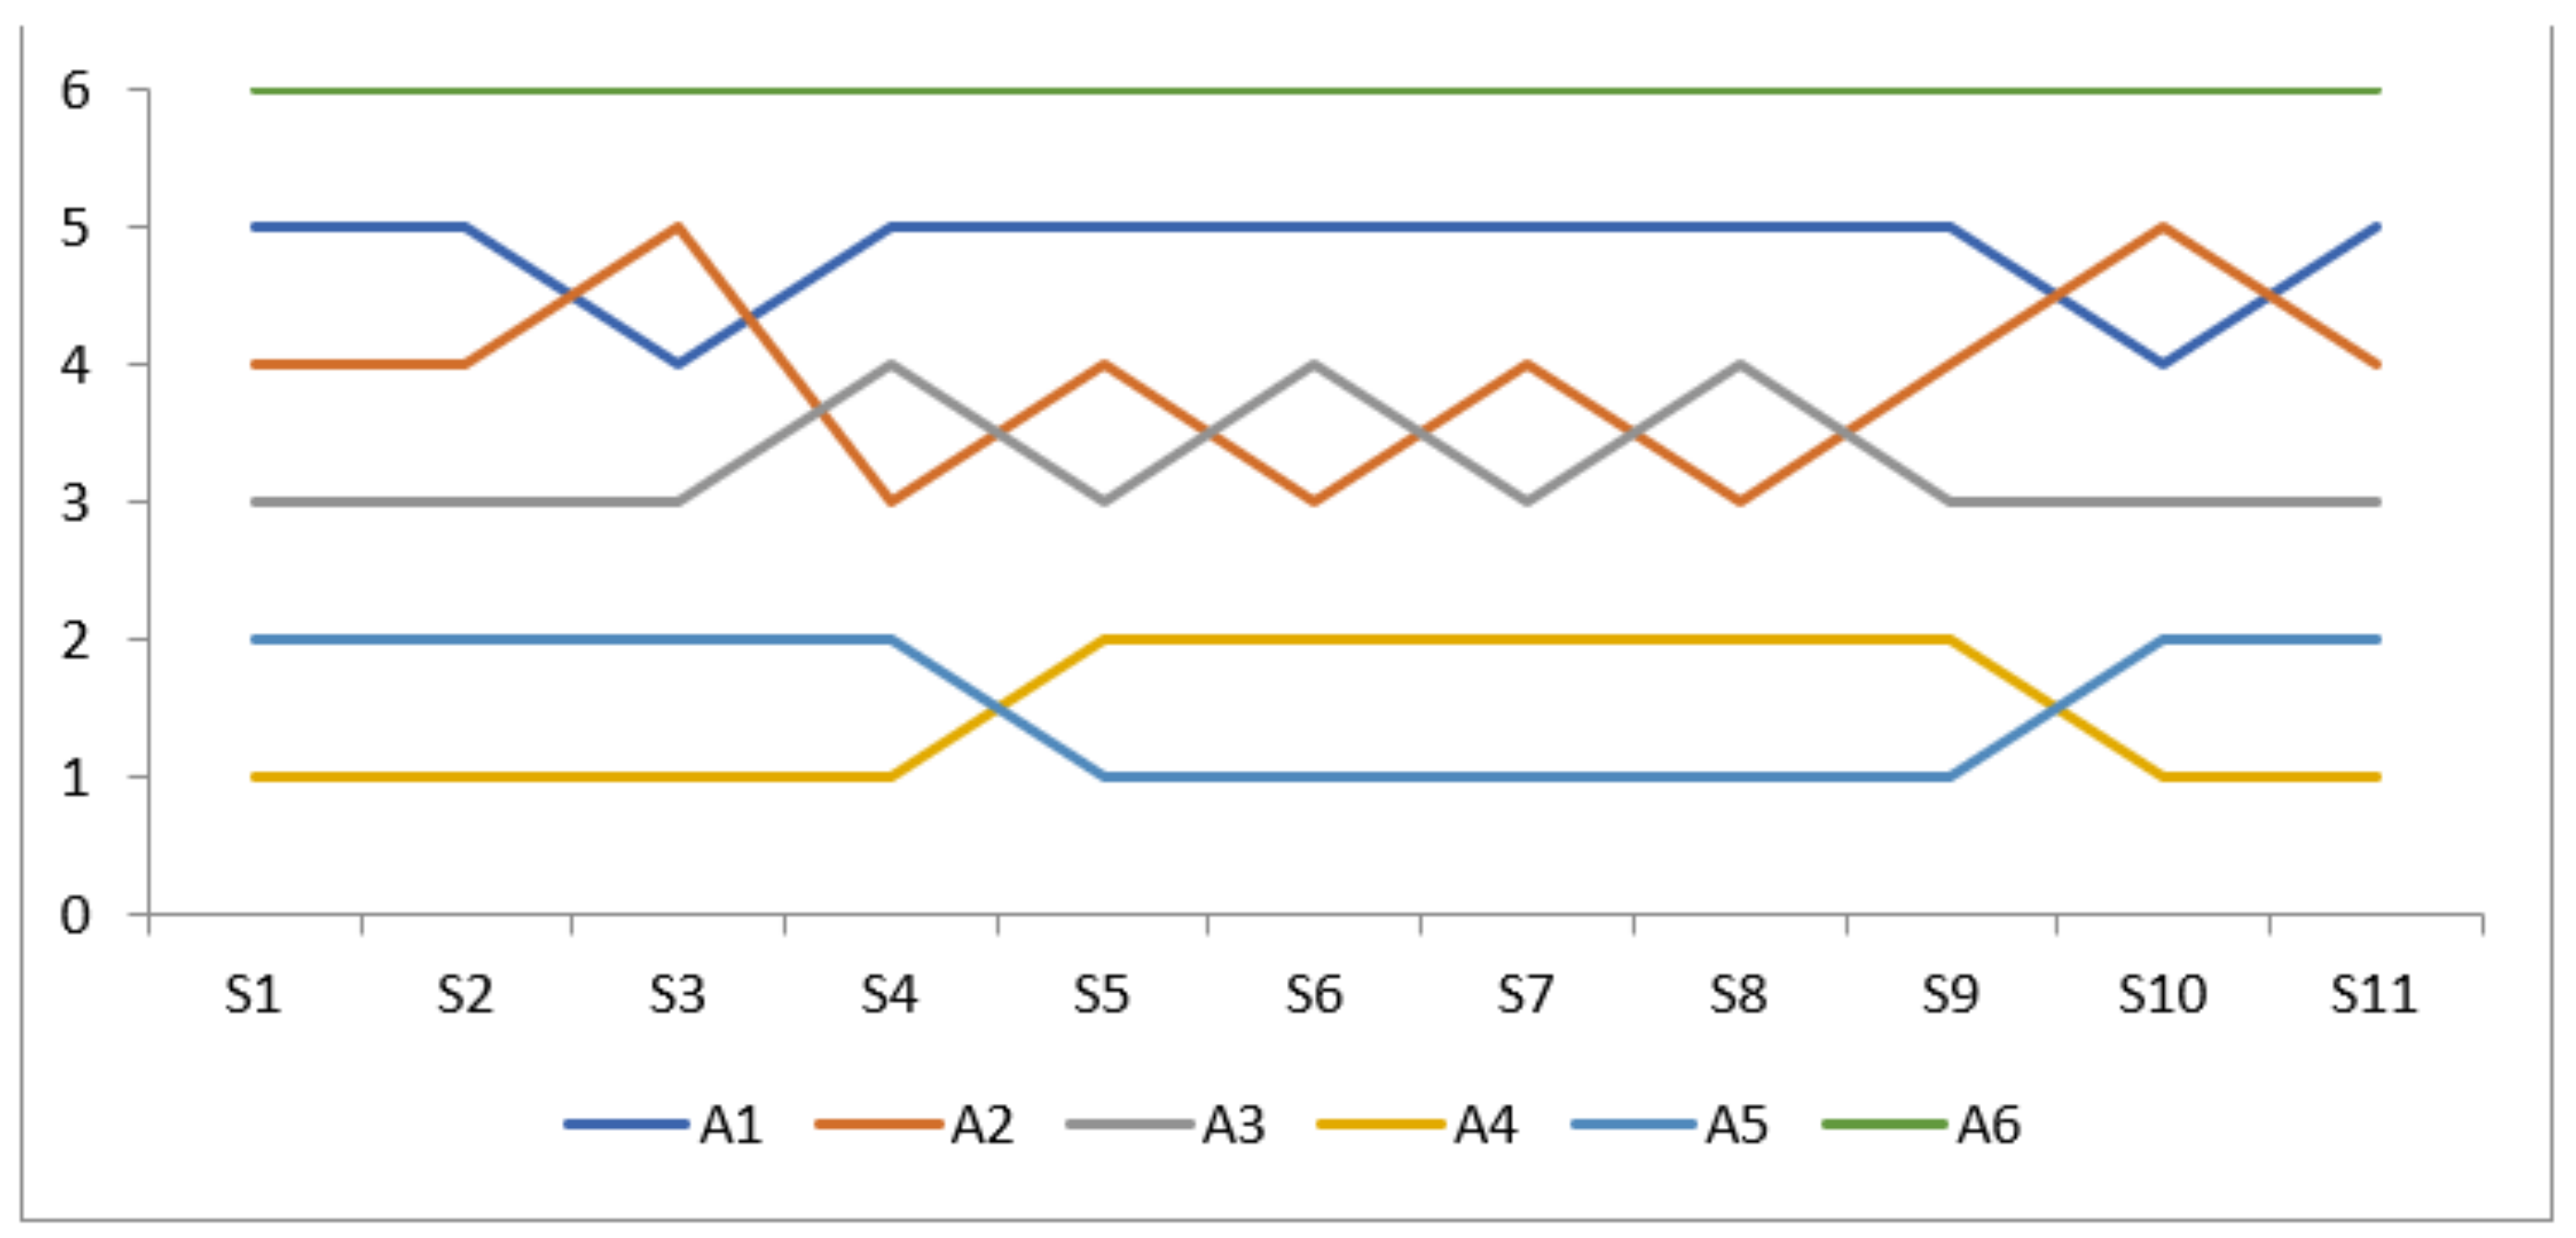
By conducting a sensitivity analysis using eleven scenarios, the obtained results show that the A4 alternative is ranked best in six scenarios, while in the remaining five scenarios the A5 alternative is ranked best (
Table 11). Alternative A3 takes third place in the rankings in nine scenarios, while Alternative A2 takes third place in two scenarios. In all scenarios, the A6 alternative takes the last place.
Results sensitivity analysis show that the A5 alternative has better indicators for criteria C4 to C8, which are mostly related to logistics costs and the possibility of selling these varieties of pears. Alternative A4 has better indicators for criteria C1 to C3 and criteria C9 and C10 (
Figure 2). These criteria are related to the quality of the fruit and the export possibilities and prices of that variety. Based on that, it can be concluded that the variety Viljamovka has a better demand than the variety Konferens, and that it is easier to handle it in case of storage and other logistical operations of delivery to customers than the variety Konferens. According to experts, the Konferens variety has a better fruit quality compared to Vijamovka, so there is a better possibility of export and a higher price on the market of this variety. This is due to the fact that the fruit of the Konferens variety is more sensitive than the Viljamovka variety, and the fruits of the Konferens variety can be stored for shorter time, and are more susceptible to rot.
Observing the varieties Julska šarena (A2) and Junska ljepotica (A3), the results of the sensitivity analysis are such that alternative A2 has a better aroma, and higher packaging and storage costs compared to A3. This tells us that when manipulating fresh fruits of the Julska šarena variety, it is necessary to pay more attention to the packaging and storage of these fruits, so in these scenarios it was lower ranked than the Julska ljepotica variety. However, the variety Santa Marija (A1) has better fruit quality characteristics and sales price compared to the Julska šarena (A2), so in these scenarios it is better ranked compared to that variety.
5. Conclusions
To get the best results when planting a new orchard, varieties must be selected with care. In doing so, customer preferences must be taken into account. When connecting producers and customers, the basic problem is the different place of production and place of consumption. The fruit must be delivered to the customer without losing its properties. Therefore, in addition to the price and quality of fruit, logistical costs need to be investigated.
In the evaluation of these pear varieties, a methodology based on the fuzzy CRITIC and CRADIS methods was used. The fuzzy CRITIC method was used to objectively determine the weights of the criteria in order to reduce the subjective influence of experts on the final ranking of pear varieties. The results of the CRITIC method application showed that criteria C6 (Transport costs) and C7 (Storage costs) received the highest values of weights, and their weights were twice as high as the weights of other criteria. These results show that through objective determination of the weight of the criteria, a higher value is given to logistics costs than to the quality of fruit or sales and export opportunities.
The CRADIS method was used to rank pear varieties. The results obtained by this method show that the best variety is Konferans (A5), followed by the variety Viljamovka (A4), while the lowest ranked variety is Šampionka (A6) according to expert estimates. In order to determine how each criterion affects the ranking of alternatives, a sensitivity analysis was conducted, which showed that when raising new pear orchards, according to market assessment, the best results are achieved by the variety Viljamovka and Konferens. These varieties are the first choice according to experts in the production of pears in Serbia.
This research addresses several research gaps that occur in the research. In the literature review, it can be noticed that during the market evaluation of individual fruits, i.e., fruit varieties, an approach based on consumer preferences was used. This paper provides a different approach. Namely, during the market assessment, the professional opinion of fruit experts is used. In order to make decision-making more realistic and to reduce the subjective assessment of experts used in this study, the fuzzy CRITIC method is applied, which determines the weight of the criteria used based on their correlation with the given assessments by experts. In order for one criterion to gain more weight, its grades should be as different as possible from other criteria. By applying this method and this procedure, the subjectivity of the expert is reduced in order to make more realistic decisions. In addition, this approach has facilitated the mere collection of data by experts. The experts only needed to evaluate the alternatives, and not to evaluate the weights according to the importance they have for them.
The limitations of this study are seen in the smaller number of criteria used in ranking pear varieties. However, increasing the number of criteria would further complicate the problem of decision-making in the market assessment of pear varieties. Some new market criteria need to be included in future research to investigate whether these new criteria affect the ranking of alternatives. In addition, the limitation of this research is reflected in the fact that not enough varieties of pears are taken into consideration. However, according to experts, these varieties are mostly grown in Serbia, which is why they were taken into consideration. In future research, it is necessary to use the same or a similar approach and take into account other varieties of pears. Moreover, in future research, it is necessary to examine which varieties of pears should be grown in other countries, as well as to determine whether these are the same varieties.
The contribution of the conducted research is reflected in the application of expert opinion in the market evaluation of pear varieties, simple methodology for decision-making in agriculture, development of a new fuzzy method, and decision-making adapted to human thinking.


 ,
, 


