Article

Ripeness Evaluation of Achacha Fruit Using Hyperspectral Image Data

by
Ngo Minh Tri Nguyen
and
Nai-Shang Liou
*
Department of Mechanical Engineering, Southern Taiwan University of Science and Technology, Tainan 710, Taiwan
*
Author to whom correspondence should be addressed.
Agriculture 2022, 12(12), 2145; https://doi.org/10.3390/agriculture12122145
Submission received: 25 October 2022 / Revised: 2 December 2022 / Accepted: 7 December 2022 / Published: 13 December 2022

Abstract

:
In this study, spectral data within the wavelength range of 400–780 nm were used to evaluate the ripeness stages of achacha fruits. The ripeness status of achacha fruits was divided into seven stages. Both average and pixel-based approaches were used to assess the ripeness. The accuracy and n-level-error accuracy of each ripeness stage was predicted by using classification models (Support Vector Machine (SVM), Partial Least Square Discriminant Analysis (PLS-DA), Artificial Neural Network (ANN) and K-Nearest Neighbor (KNN)) and regression models (Partial Least Square Regression (PLSR) and Support Vector Regression (SVR)). Furthermore, how the curvature of the fruit surface affected the prediction of the ripeness stage was investigated. With the use of an averaged spectrum of fruit samples, the accuracy of the model used in this study ranged from 52.25% to 79.75%, and the one-level error accuracy (94.75–100%) was much higher. The SVM model had the highest accuracy (79.75%), and the PLSR model had the highest one-level error accuracy (100%). With the use of pixel-based ripeness prediction results and majority rule, the accuracy (58.25–79.50%) and one-level-error accuracy (95.25–99.75%) of all models was comparable with the accuracy predicted by using averaged spectrum. The pixel-based prediction results showed that the curvature of the fruit could have a noticeable effect on the ripeness evaluation values of achacha fruits with a low or high ripeness stage. Thus, using the spectral data in the central region of achacha fruits would be a relatively reliable choice for ripeness evaluation. For an achacha fruit, the ripeness value of the fruit face exposed to sunlight could be one level higher than that of the face in shadow. Furthermore, when the ripeness value of achacha fruit was close to the mid-value of two adjacent ripeness stage values, all models had a high chance of having one-level ripeness errors. Thus, using a model with high one-level error accuracy for sorting would be a practical choice for the postharvest processing of achacha fruits.

1. Introduction

The ripening of fruits, usually involving color change and increasing sugar content, refers to the processes that occur at the later stages of maturation and the early stages of senescence for fruits [1]. Achacha (Garcinia humillis), which originates from Bolivia [2,3], has recently become one of Taiwan’s commercial plantation fruits. As the achacha fruits ripen, the skin color changes from green to yellow and then to dark orange. The color changes are due to the loss of chlorophyll and concomitant synthesis of the characteristic pigments, such as carotenoids [4]. At the current stage, in Taiwan, achacha fruits are harvested manually. Harvesters try to pick achacha fruits with proper maturity and to ensure that the fruit is not over-ripe or senescent; however, at which stage of maturity the achacha fruits should be picked from the tree is difficult to be judged by harvesters, sometimes because the color of the fruits varies under different light conditions. For example, the same achacha fruit exposed to direct sunlight or in the shadow of a tree may appear to have different colors. Furthermore, under-ripe achacha fruits could be picked by mistake during the fast-paced harvesting process. Because the ripeness stage is an important indicator of the quality of the achacha fruits from the customers’ perspective, determining the ripeness stage is an important task in the postharvest processing of achacha fruits. Currently, the ripeness stage of achacha fruits is visually identified by the farmer in front of the sorting line. The disadvantage of this method is low efficiency, prone to mistakes and inconsistency. Many physical and chemical features, such as size, shapes, texture, firmness, colors, the concentration of chlorophyll, soluble solids content (SSC), starch, sugars, acids and oils, can be used to quantify fruit ripeness [5]. The use of non-destructive techniques for fruit maturity assessment can be traced back to more than a half-century ago [6]. After that, many non-destructive fruit ripeness evaluation methods based on different technologies, including electrical bio-impedance [7], computer tomography, electric nose [8], magnetic resonance imaging, RGB color imaging [9], spectroscopy [10], spectral imaging [11,12], ultrasound [13] have been developed. Among the aforementioned techniques, imaging technologies have emerged as powerful tools for sorting and grading fruits because the same data obtained by imaging technologies can be used not only for fruit maturity measurement but also for other postharvest processing tasks, such as surface defect detection, size or shape grading.
Machine vision systems based on conventional RGB images have been adopted for fruit ripeness evaluation for many years. For example, tomato maturity was classified based on HSV color histogram and color moments extracted from RGB images captured using a computer vision system [14]. The combination of color feature and back propagation neural network (BPNN) was used to detect three maturity levels (green, orange and red) of tomatoes [15]. Cardenas-Perez et al. [16] proposed a ripening index (RPI) for assessing apple ripeness (unripe, ripe and senescent). The ripeness of fruits was determined based on the external color using image processing techniques [17,18,19]. However, color features could be affected by factors such as light intensity and exposure time of the digital camera, which cause noise [20]. Furthermore, the color difference between intermediate adjacent ripeness levels might not be significant [21]. Thus, it could be difficult to distinguish multiple intermediate adjacent ripeness stages of fruits by RGB images. In addition to using color digital cameras to obtain RGB imaging, hyperspectral imaging (HSI) systems have been successfully used for the assessment of fruit ripeness. HSI systems can acquire data in both spatial and spectral domains at the same time [22]. The ripening of fruits usually involves chemical processes, such as chlorophyll degradation, changes in respiration, biosynthesis of carotenoids and changes in ethylene production [23]. Many of the visible changes throughout the ripening process are ascribed to changes in pigmentation induced by changes in chlorophyll content and accumulation of carotenoids. Compared with using RGB images obtained by digital image sensors with broadband Bayer filter mosaic, the changes in ripeness stages can be better observed using high spectral resolution data obtained by hyperspectral imaging systems, because, for fruits without significant color difference between intermediate adjacent ripeness levels, the ripeness level can be differentiated better based on the subtle spectral shifts in the measured spectra. Logan et al. used RGB images and hyperspectral images to analyze the ripeness of fruits and vegetables. The results showed that hyperspectral images outperform RGB images for age classification on all their tested produce [24]. Furthermore, Zhang et al. used VIS-NIR and NIR hyperspectral image data to evaluate the maturity of strawberries with three levels [25], and Wei et al. classified four ripeness levels of persimmons using VIS-NIR hyperspectral image data [26].
Machine learning classification models using hyperspectral data were widely used for maturity assessment. To name a few, a Support Vector Machine (SVM) was used to evaluate the ripeness of strawberries [25] and blueberries [27]. An artificial Neural Network (ANN) was used to recognize bananas with four ripeness levels [28]. Soft independent modeling of class analogies (SIMCA) was used for bananas [29] and pears [30]). Linear Discriminant Analysis (LDA) was applied to tomatoes [31] and apples [32].
The objective of this study was to develop ripeness stage evaluation models with the use of HSI data for achacha fruits. Both pixel-based and averaged hyperspectral data were used in this study. The performance of classification and regression models was investigated. Furthermore, how the curvature of the fruit surface affects the prediction of the ripeness stage was explored.

2. Materials and Methods

2.1. Hyperspectral Image Data Acquisition and Preparation

A custom-made push-broom Hyperspectral Imaging (HSI) system was used to obtain spectral data of achacha fruits. The system consists of a Basler Ace acA2440-175 um monochrome camera, an Imaging spectrograph (Imspector V10E, Spectral Imaging Ltd., Oulu, Finland) with 23 mm C-mount zoom lens (OLE23-f/2.4, Spectral Imaging Ltd., Oulu, Finland), two halogen lamps, a computer (3.1 GHz Ryzen 9-3900 CPU, 32 GB memory) and a motorized positioning sample table driven by an AC servo motor (SDE-010A2, Shihlin, Taiwan) and PWM signals from data acquisition devices (NI-myDAQ, National Instruments, Austin, TX, USA). The spectral images were acquired by a GUI program developed in Labview software 2020. The black-and-white calibration was performed on the raw data obtained by the hyperspectral imaging system to obtain the relative reflectance [33]. The black reference images were obtained by turning off the light sources and covering the lens with a black cap, and the white reference images were acquired with the use of a white diffuse board.

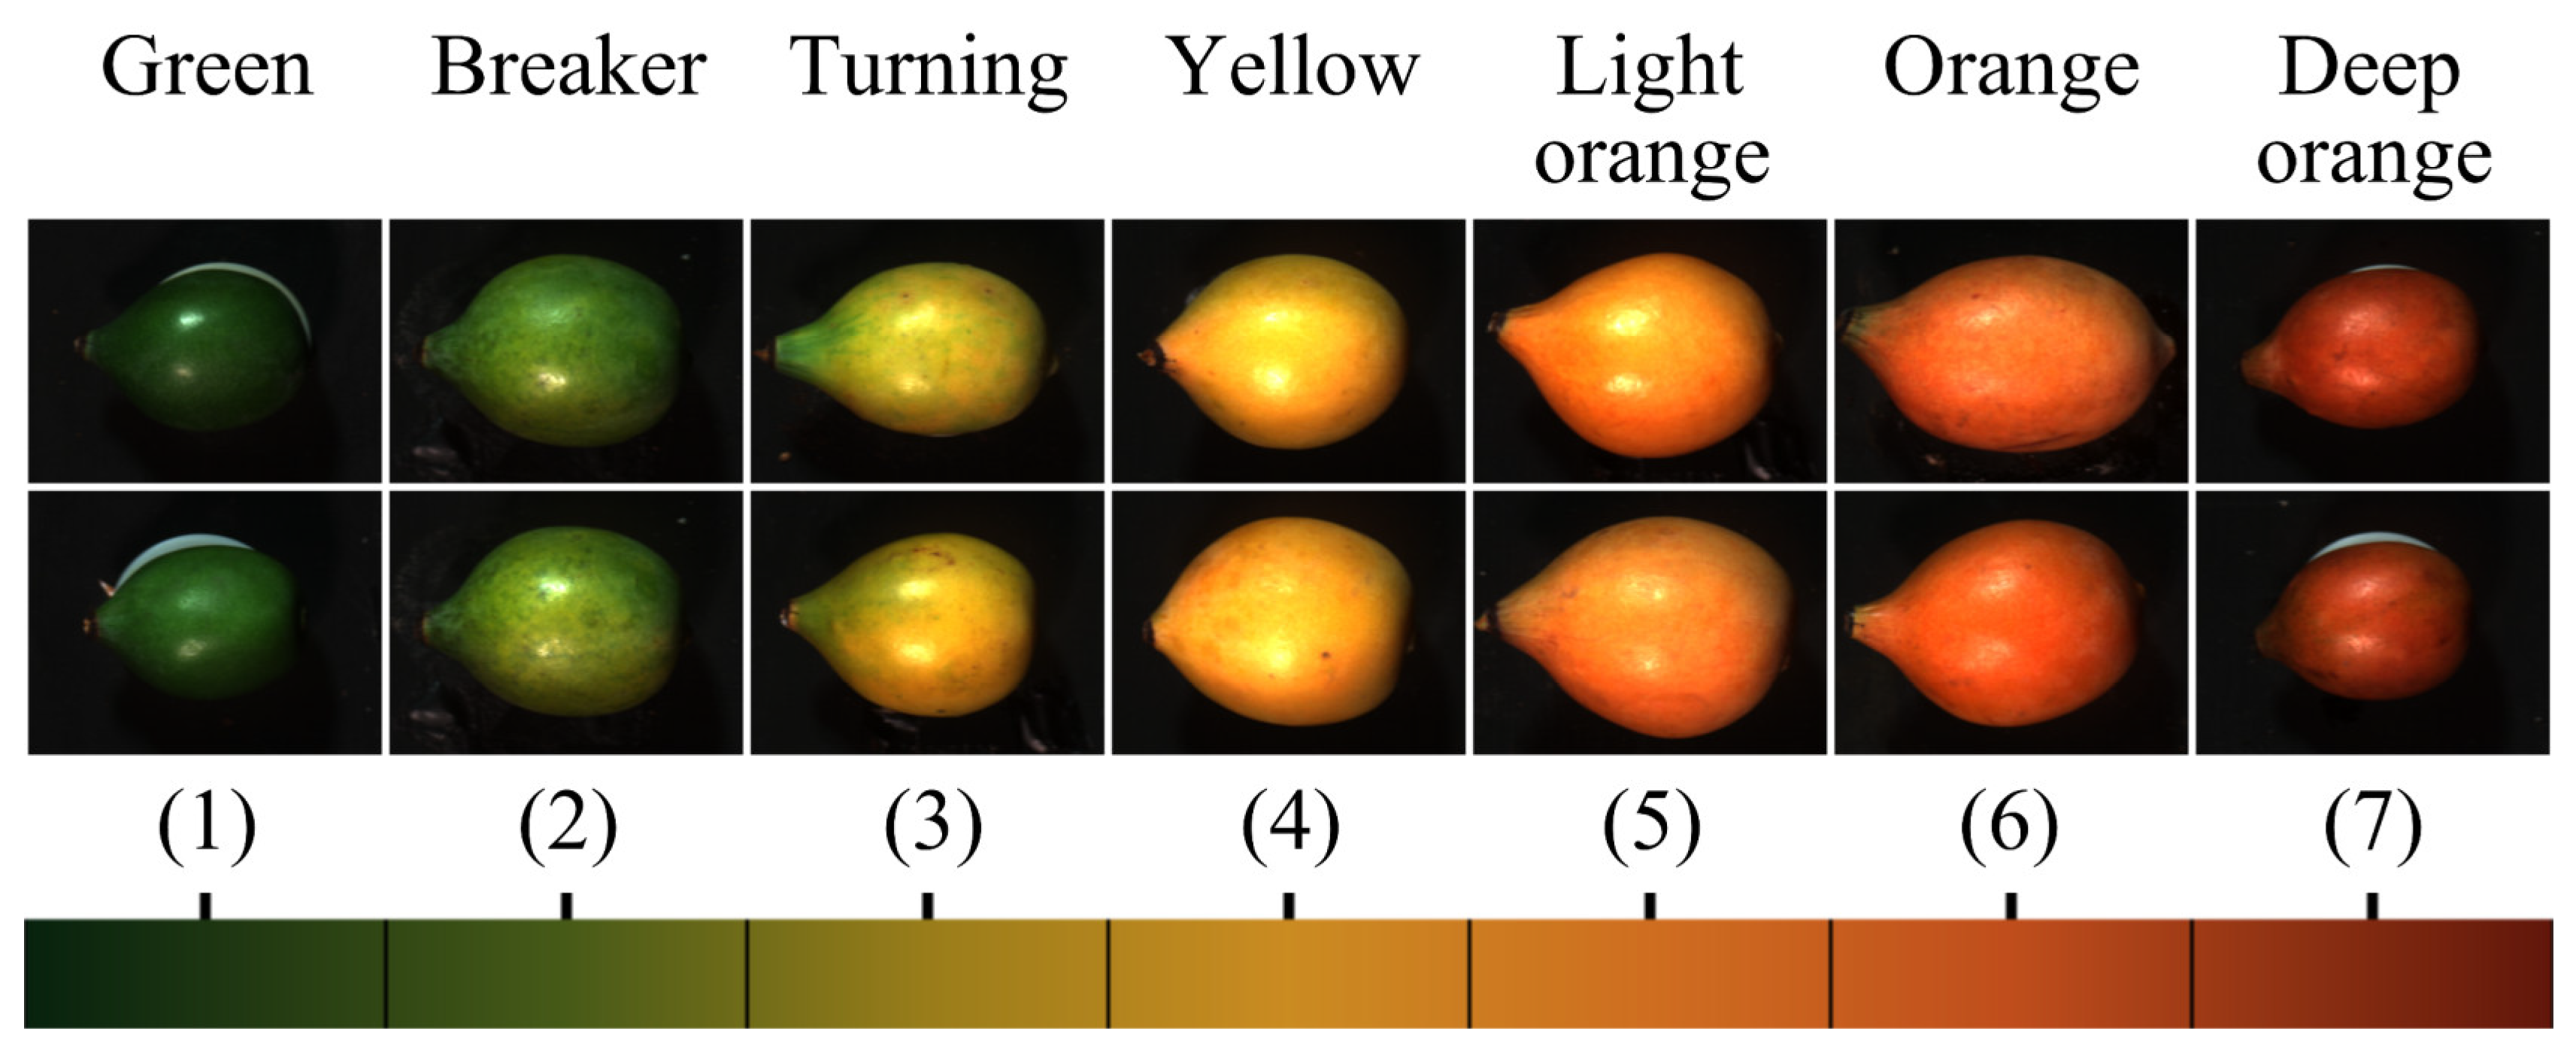
2.2. Achacha Samples

The achacha fruits with various ripeness stages were obtained from an orchard in Pingtung, Taiwan. The specimens were stored at room temperature (25 °C), and hyperspectral images of specimens were obtained within two days after specimens were harvested. Seven ripeness stages were used to discern the various ripening levels of the achacha fruits. The total number of achacha specimens used in this study was 414. When preparing the data for training and validation, the extremes were numbered as ripeness stage “1” and “7”. Then the rest of the samples were sorted into five fairly equal intervals. Finally, the two most representative samples of the seven ripeness stages were selected for obtaining hyperspectral image data for training and validation of ripeness evaluation models. The pseudo-RGB images, created by combining three wavelengths (Red: 622 nm; Green: 530 nm; Blue: 465 nm), of the most representative samples of the seven ripeness stages are shown in Figure 1. Except at ripeness stage 1 (green) or 7 (deep orange), achacha fruits more or less have a mix of colors or color gradients with the neighboring ripeness stage. At ripeness stages 2 and 3, the surface of the achacha fruits consists of mixed colors of green and yellow mottles. For achacha fruits at ripeness stages 2 to 6, since sunlight exposure can accelerate the color changing of the fruit surface, the side exposed to sunlight usually had a riper look than that of the opposite side for the same fruit.
In order to create a mask for separating the fruit sample from the background, an ANN classification model was trained to differentiate fruit pixels from background pixels using HSI data (Figure 2b). The curvature of the achacha fruits led to intensity distortion during the scan. The intensity of the spectral data of pixels near the border was low. Therefore, the mask image was eroded from the border to remove pixels belonging to severe intensity distortion regions (Figure 2c). Because the ripeness stages of the achacha fruits were visually assigned by human experts, spectral data within the wavelength range of 400–780 nm were used in this study.

2.3. Training and Validation Data Preparation

For each ripeness stage, 20,000 labeled data points were randomly selected from the region defined by the eroded mask of the two most representative achacha fruit samples shown in Figure 1; the data were divided into training and validation sets. The training set was used for model training, and the validation set was used for the selection of hyperparameters.

2.4. Ripeness Evaluation Models

Classification models were widely used to classify the ripeness stage of fruits. For example, with the use of RGB images, tomatoes were classified into 3 ripeness levels [15]; by using hyperspectral image data, navel oranges and okras were classified into 3 ripeness levels [34,35]. However, in general, classification models are used for predicting discrete labels, and regression models are used for predicting continuous quantities. The ripening of fruits is a continuous process. The color of achacha fruits continuously changes from green to yellow and to dark orange when ripening; the evaluation of the ripeness stage of achacha fruits can be considered a regression problem. In this study, both classification models (Support Vector Machine (SVM), Partial Least Square Discriminant Analysis (PLS-DA), Artificial Neural Network (ANN) and K-Nearest Neighbor (KNN)) and regression models (Partial Least Square Regression (PLSR) and Support Vector Regression (SVR)) were used to identify the ripeness stage of achacha fruits. For regression models, the predicted levels were obtained by rounding the regression output to the nearest integer value.
PLSR projects both independent and dependent variables to new spaces to find the direction in which independent variables can explain dependent variables as much as possible. PLSR relieves the limitation of multiple-variable linear regression on correlated data and therefore is effective for use as a regression model for full wavelength hyperspectral data [5]. PLS-DA was developed based on the Partial Least Square (PLS) algorithm for classification purposes. For binary problems, PLS-DA is performed by training a PLSR model with dummy variables representing the 2 classes, then separating them, such as by thresholding. In multiclass problems, a one-vs-rest scheme is applied. The PLS base algorithms were used to predict ripeness [29,30,36] and ripeness parameters, such as firmness [26], Ripening Index (RPI) and Internal Quality Index (IQI) [37]. In this study, the optimal number of components for PLS and PLS-DA was obtained by performing a Least Mean Squared Error (LMSE) evaluation on the validation data set.
SVM is a popular model for ripeness classification [25,27] due to its ability to work well with a limited number of samples. A binary SVM model tries to find the separating hyperplane that can separate the 2 classes with the largest margin to the support vectors. In this study, multiclass SVM was performed through a one-vs.-one scheme. Support Vector Regression (SVR) is a regression version of SVM. Instead of considering all prediction errors, SVR ignores errors smaller than a threshold defined by an ε-insensitive tube [38], so it becomes less sensitive to noise as well as more robust [39]. SVR was used to predict parameters related to ripeness, such as anthocyanin concentration, pH index and sugar content of wine grape berries [40]. The kernel trick is commonly applied for SVM and SVR to tackle nonlinearly separable problems. In this study, Radial Basis Function (RBF) kernel was used for SVM and SVR models.
KNN is a model that can be used for both classification and regression. Without training, the prediction of new data points is based on K nearest training point(s), where K is the number of considered nearest neighbors. In ripeness evaluation, the KNN classification form is commonly used [27,29]. In this study, K was chosen as 1, and the Standardized Euclidean distance was used. ANN is widely used in many fields, including ripeness classification [28,41,42]. ANN models can distinguish classes via training weights and bias using backpropagation. In this study, the ANN model structure had 3 layers, including an input layer (381 nodes), a hidden layer (500 nodes, ReLU activation function), and an output layer (7 nodes, Softmax activation function).

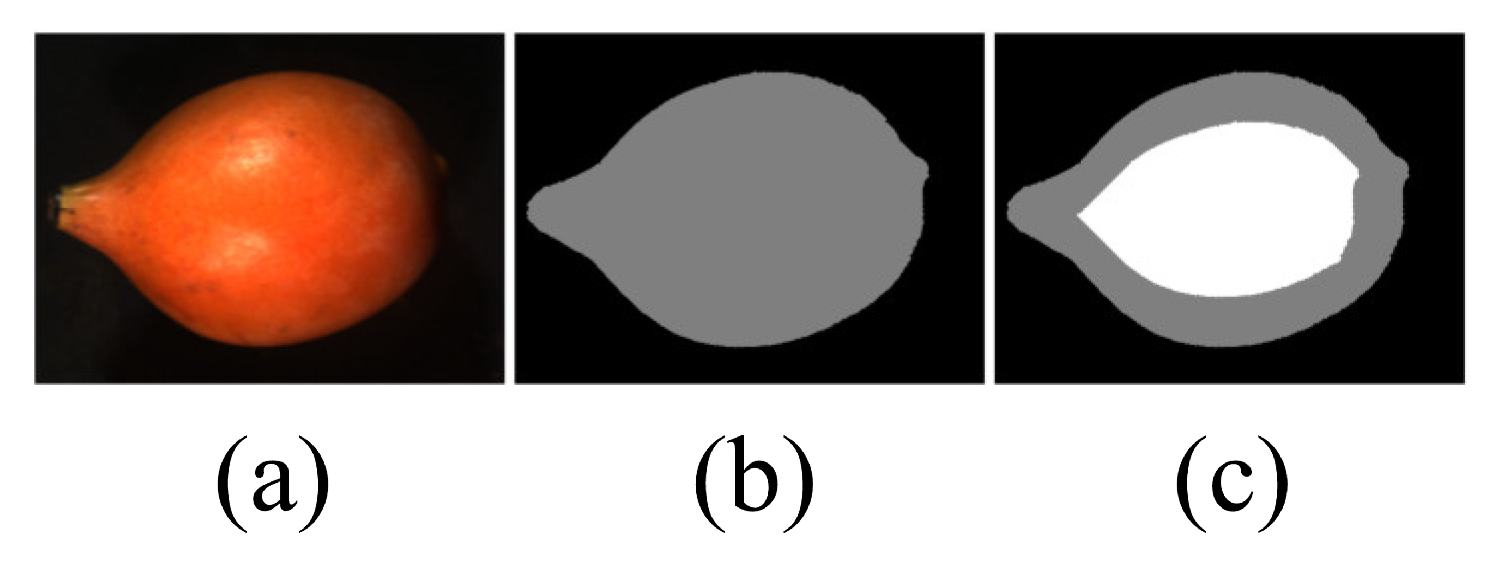
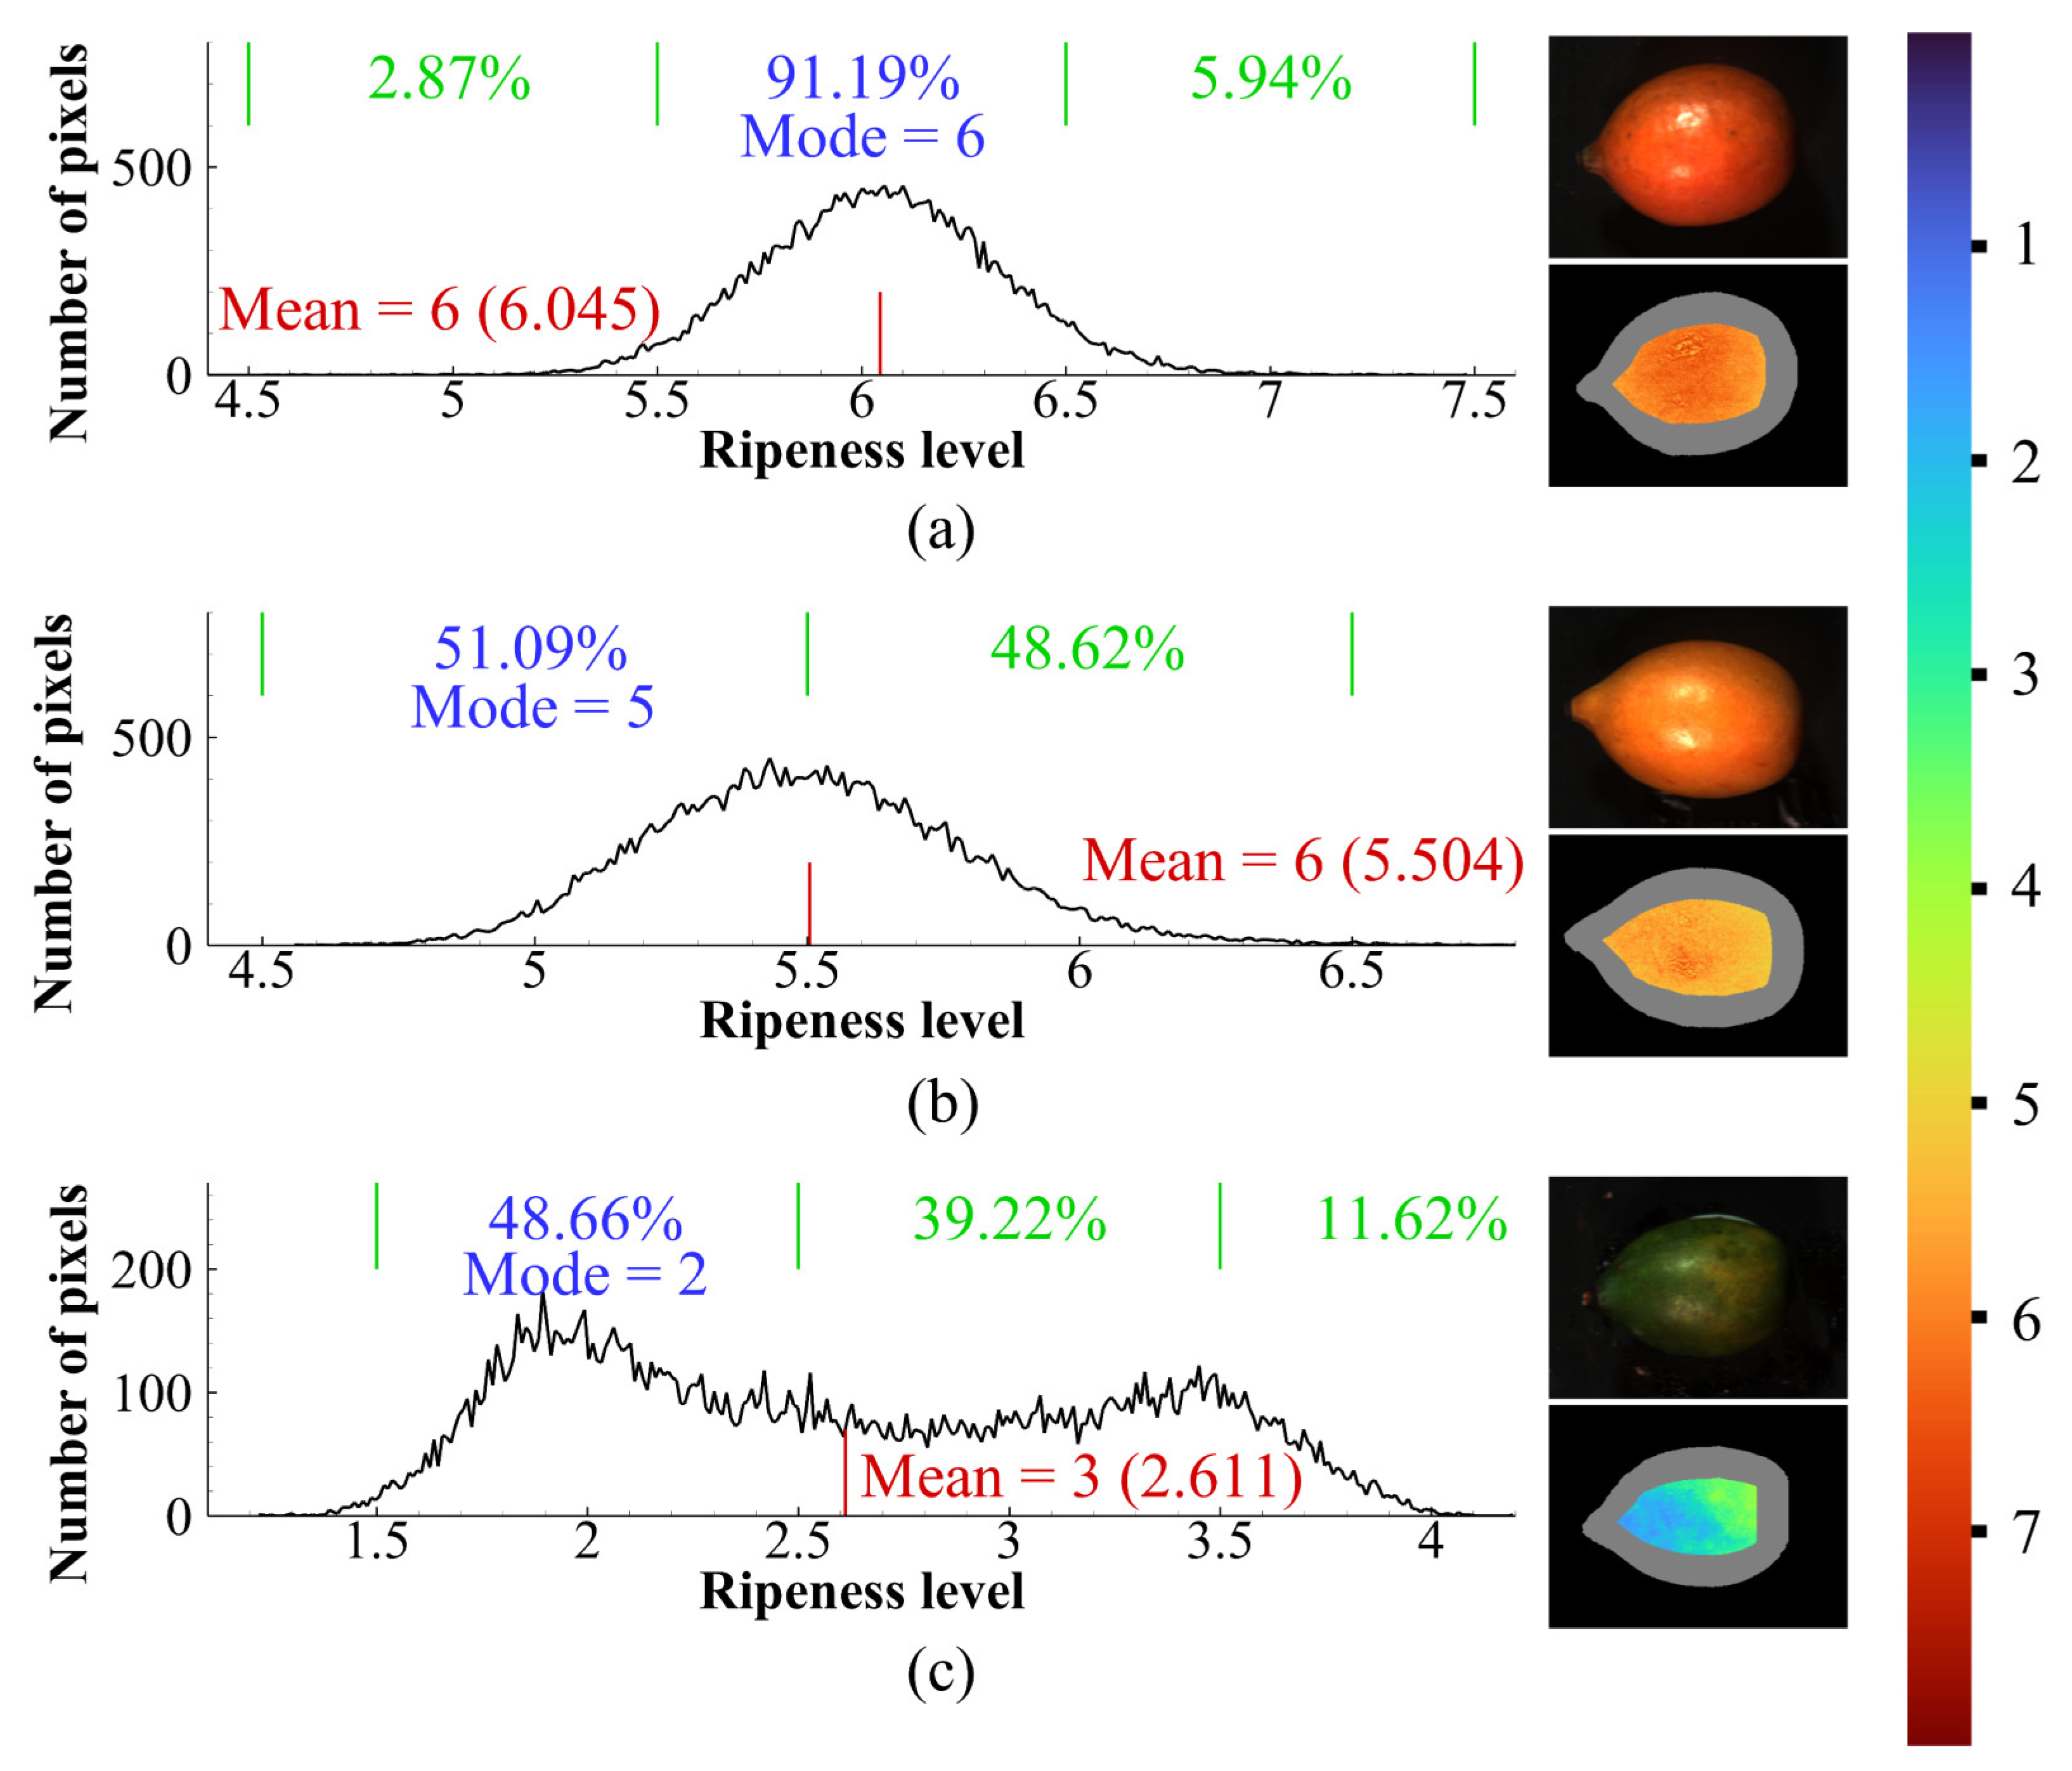
2.5. Pixel-Based Classification and One-Level Error Prediction

When performing ripeness stage assessment using data from imaging devices, such as color CCD cameras or hyperspectral imaging systems, using the average of image data from the region of interest (ROI) as the single data point to represent the whole fruit for training and predicting is a common method adopted by researchers. With the use of the mean spectrum of each fruit sample, strawberries were classified into 3 ripeness levels by SVM [25]. Bananas were classified into 3 ripeness stages using the mean spectrum averaged from the ROIs of two sides with the tip-end and stalk-end removed [29]. Tomatoes were classified into 4 ripeness stages using the mean spectrum representing each sample averaged from 100 × 100 pixels at the center of the ROI [20]. However, for fruits that have a non-uniform color distribution at certain ripeness stages, the use of averaged data could lose the information related to the mixed color and color gradient and may produce incorrect predictions. In order to solve the non-uniform color issue, Amirulah et al. [43] and Garcia et al. [44] use a pixel-based approach to investigate starfruit and tomato ripening stages.
Polder et al. used a pixel-based approach to grade tomatoes into 5 ripeness levels. In addition to an exact prediction, one-level error prediction was also considered. The ripeness of the sample was decided through the majority rule of all pixels within the mask, and the one-level error accuracy was also investigated [45]. The ripening process of achacha fruits is a continual progression, and there are no clear separation borders between consecutive ripeness stages. Furthermore, achacha fruits more or less have a mix of colors or color gradients between the neighboring ripeness stages. In this study, both average and pixel-based approaches were used for the ripeness stage study of achacha fruits. The accuracy (named as exact accuracy in this study) and n-level error accuracy of the ripeness stage evaluation models were investigated. For the n-level error accuracy (n is a positive integer), the predicted ripeness stage within an n-level higher or lower than the actual label was considered correct. The formula for n-level-error accuracy calculation is
n - level - error   accuray = Number   of   prediction   of   Predicted   level   -   Actual   level n Total   number   of   prediction
Furthermore, for the pixel-based approach, how the curvature of fruits affects the ripeness predictions were also examined.

3. Results and Discussion

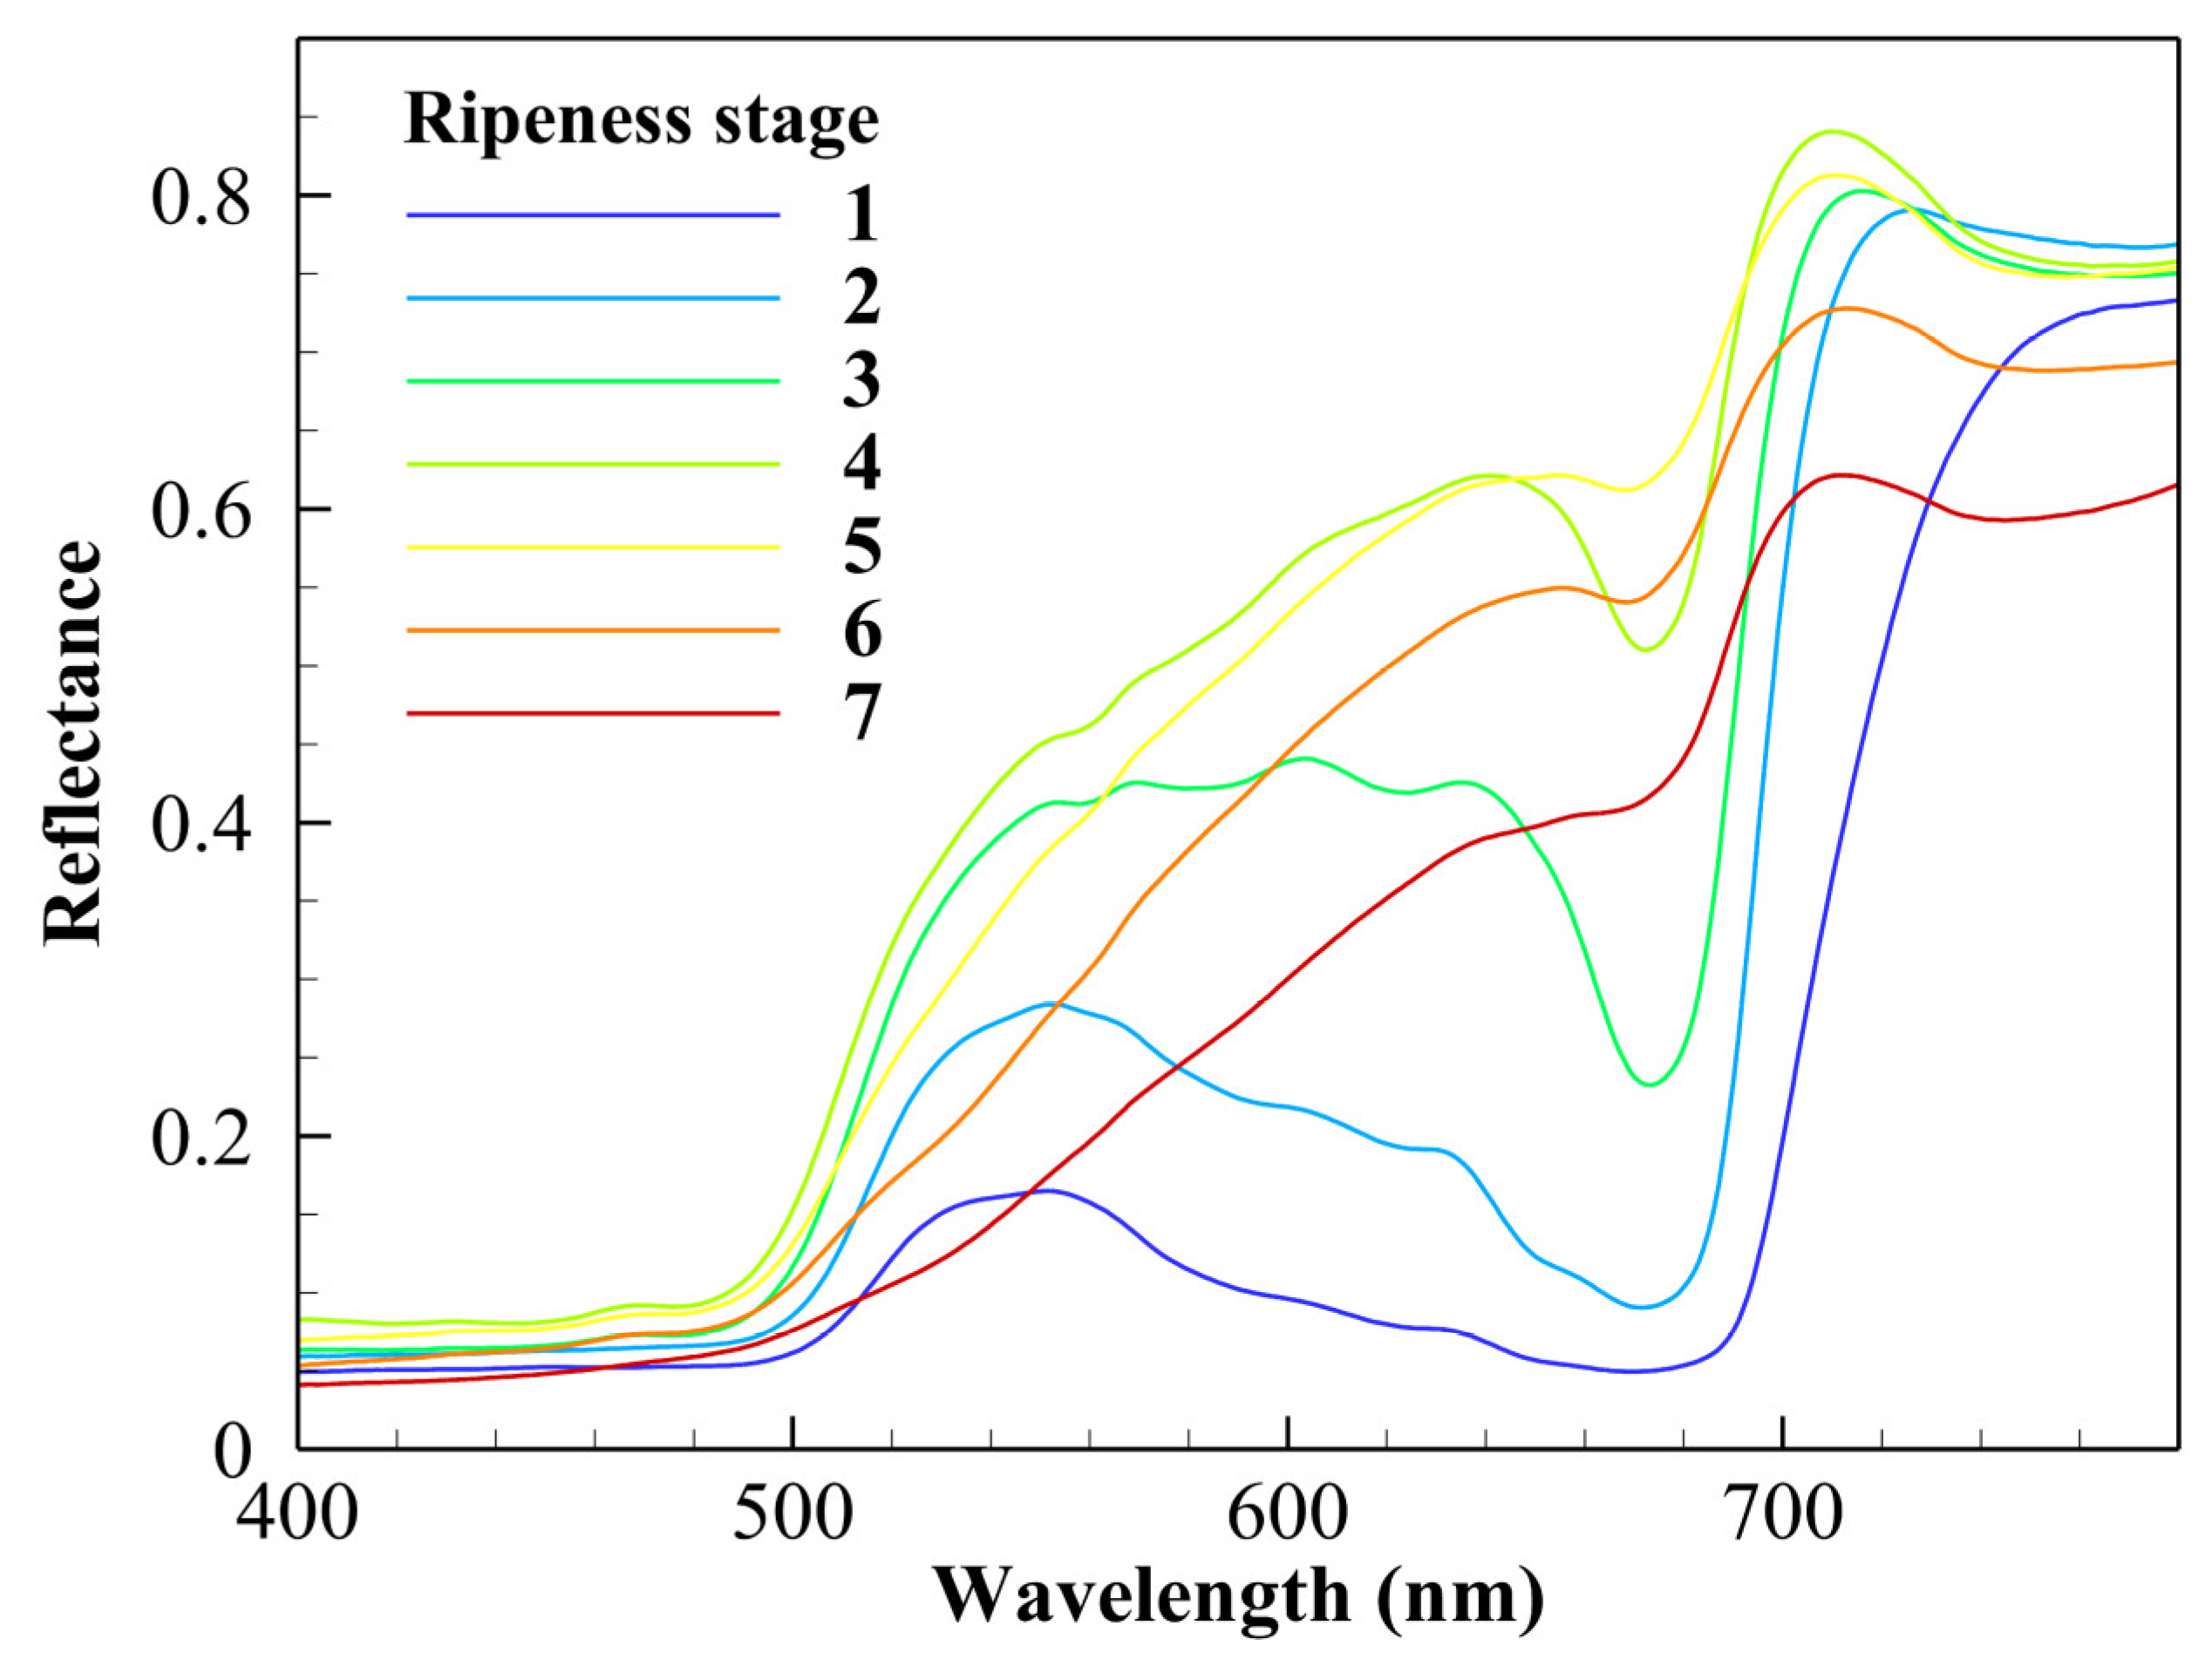
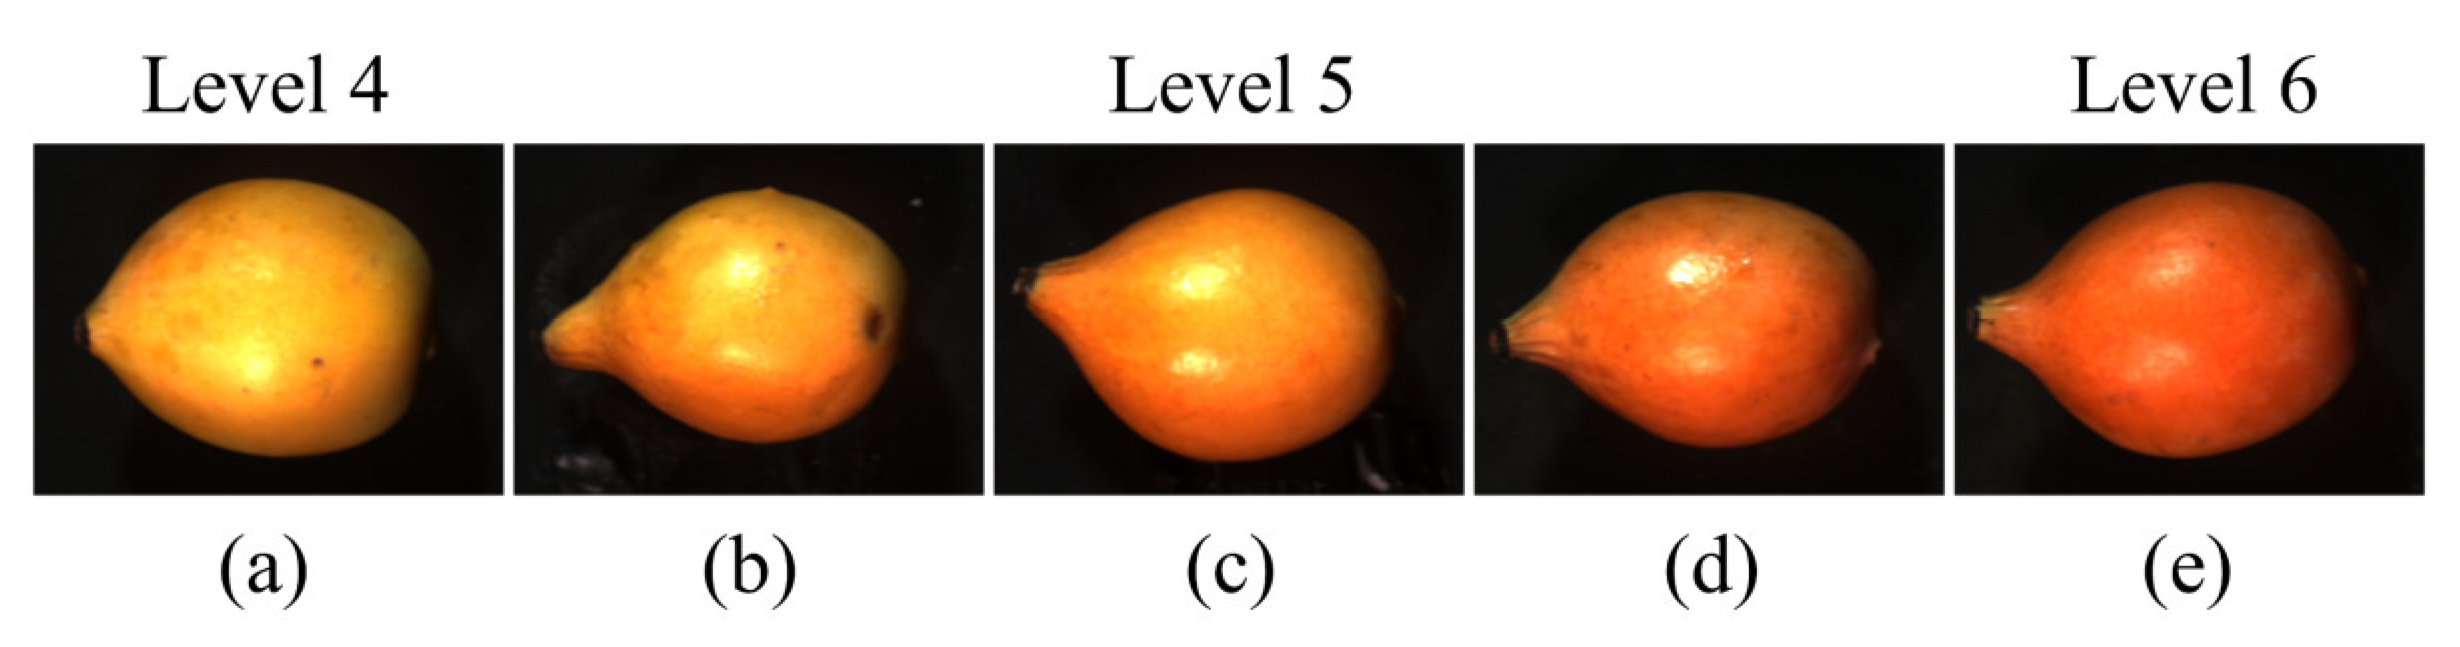
3.1. Spectral Characteristics of Different Ripeness Stages

The average spectra of the seven ripeness stages of achacha fruits are shown in Figure 3. For achacha fruits at ripeness stages 1 and 2, the rapid change in reflectance in the near-infrared range (red edge) can be clearly seen. For fruit at ripeness stage 1 (green), the fruit surface is completely green, and chlorophylls are the dominant photosynthetic pigments. The reflectance peak (or chlorophyll bump) and the valley of the spectrum are located at wavelengths corresponding to the local minimum and maximum absorption wavelengths (550 nm and 670 nm) of chlorophyll, respectively [46,47]. At ripeness stage 2, there is an obvious break in color from green to yellow; however, the color of the skin is not uniform. The reflectance of the spectrum is higher than that of stage 1 due to the appearance of beta-carotene; however, the absorption peak and valley of chlorophyll can still be observed. Most of the surface is not green at ripeness stage 3; instead of chlorophylls, beta-carotene is the dominant pigment. Although the absorption peak (670 nm) of chlorophyll still can be observed, the reflectance of spectra at a wavelength greater than 520 nm is higher than those of fruits at ripeness stages 1 and 2 since beta-carotene has low absorption of light with a wavelength higher than 520 nm. For the achacha fruits at ripeness stage 4~7, the reflectance of spectrum or color depends on the breaking down status of chlorophyll and carotene. In general, the molecules of carotene are more stable than those of chlorophyll.

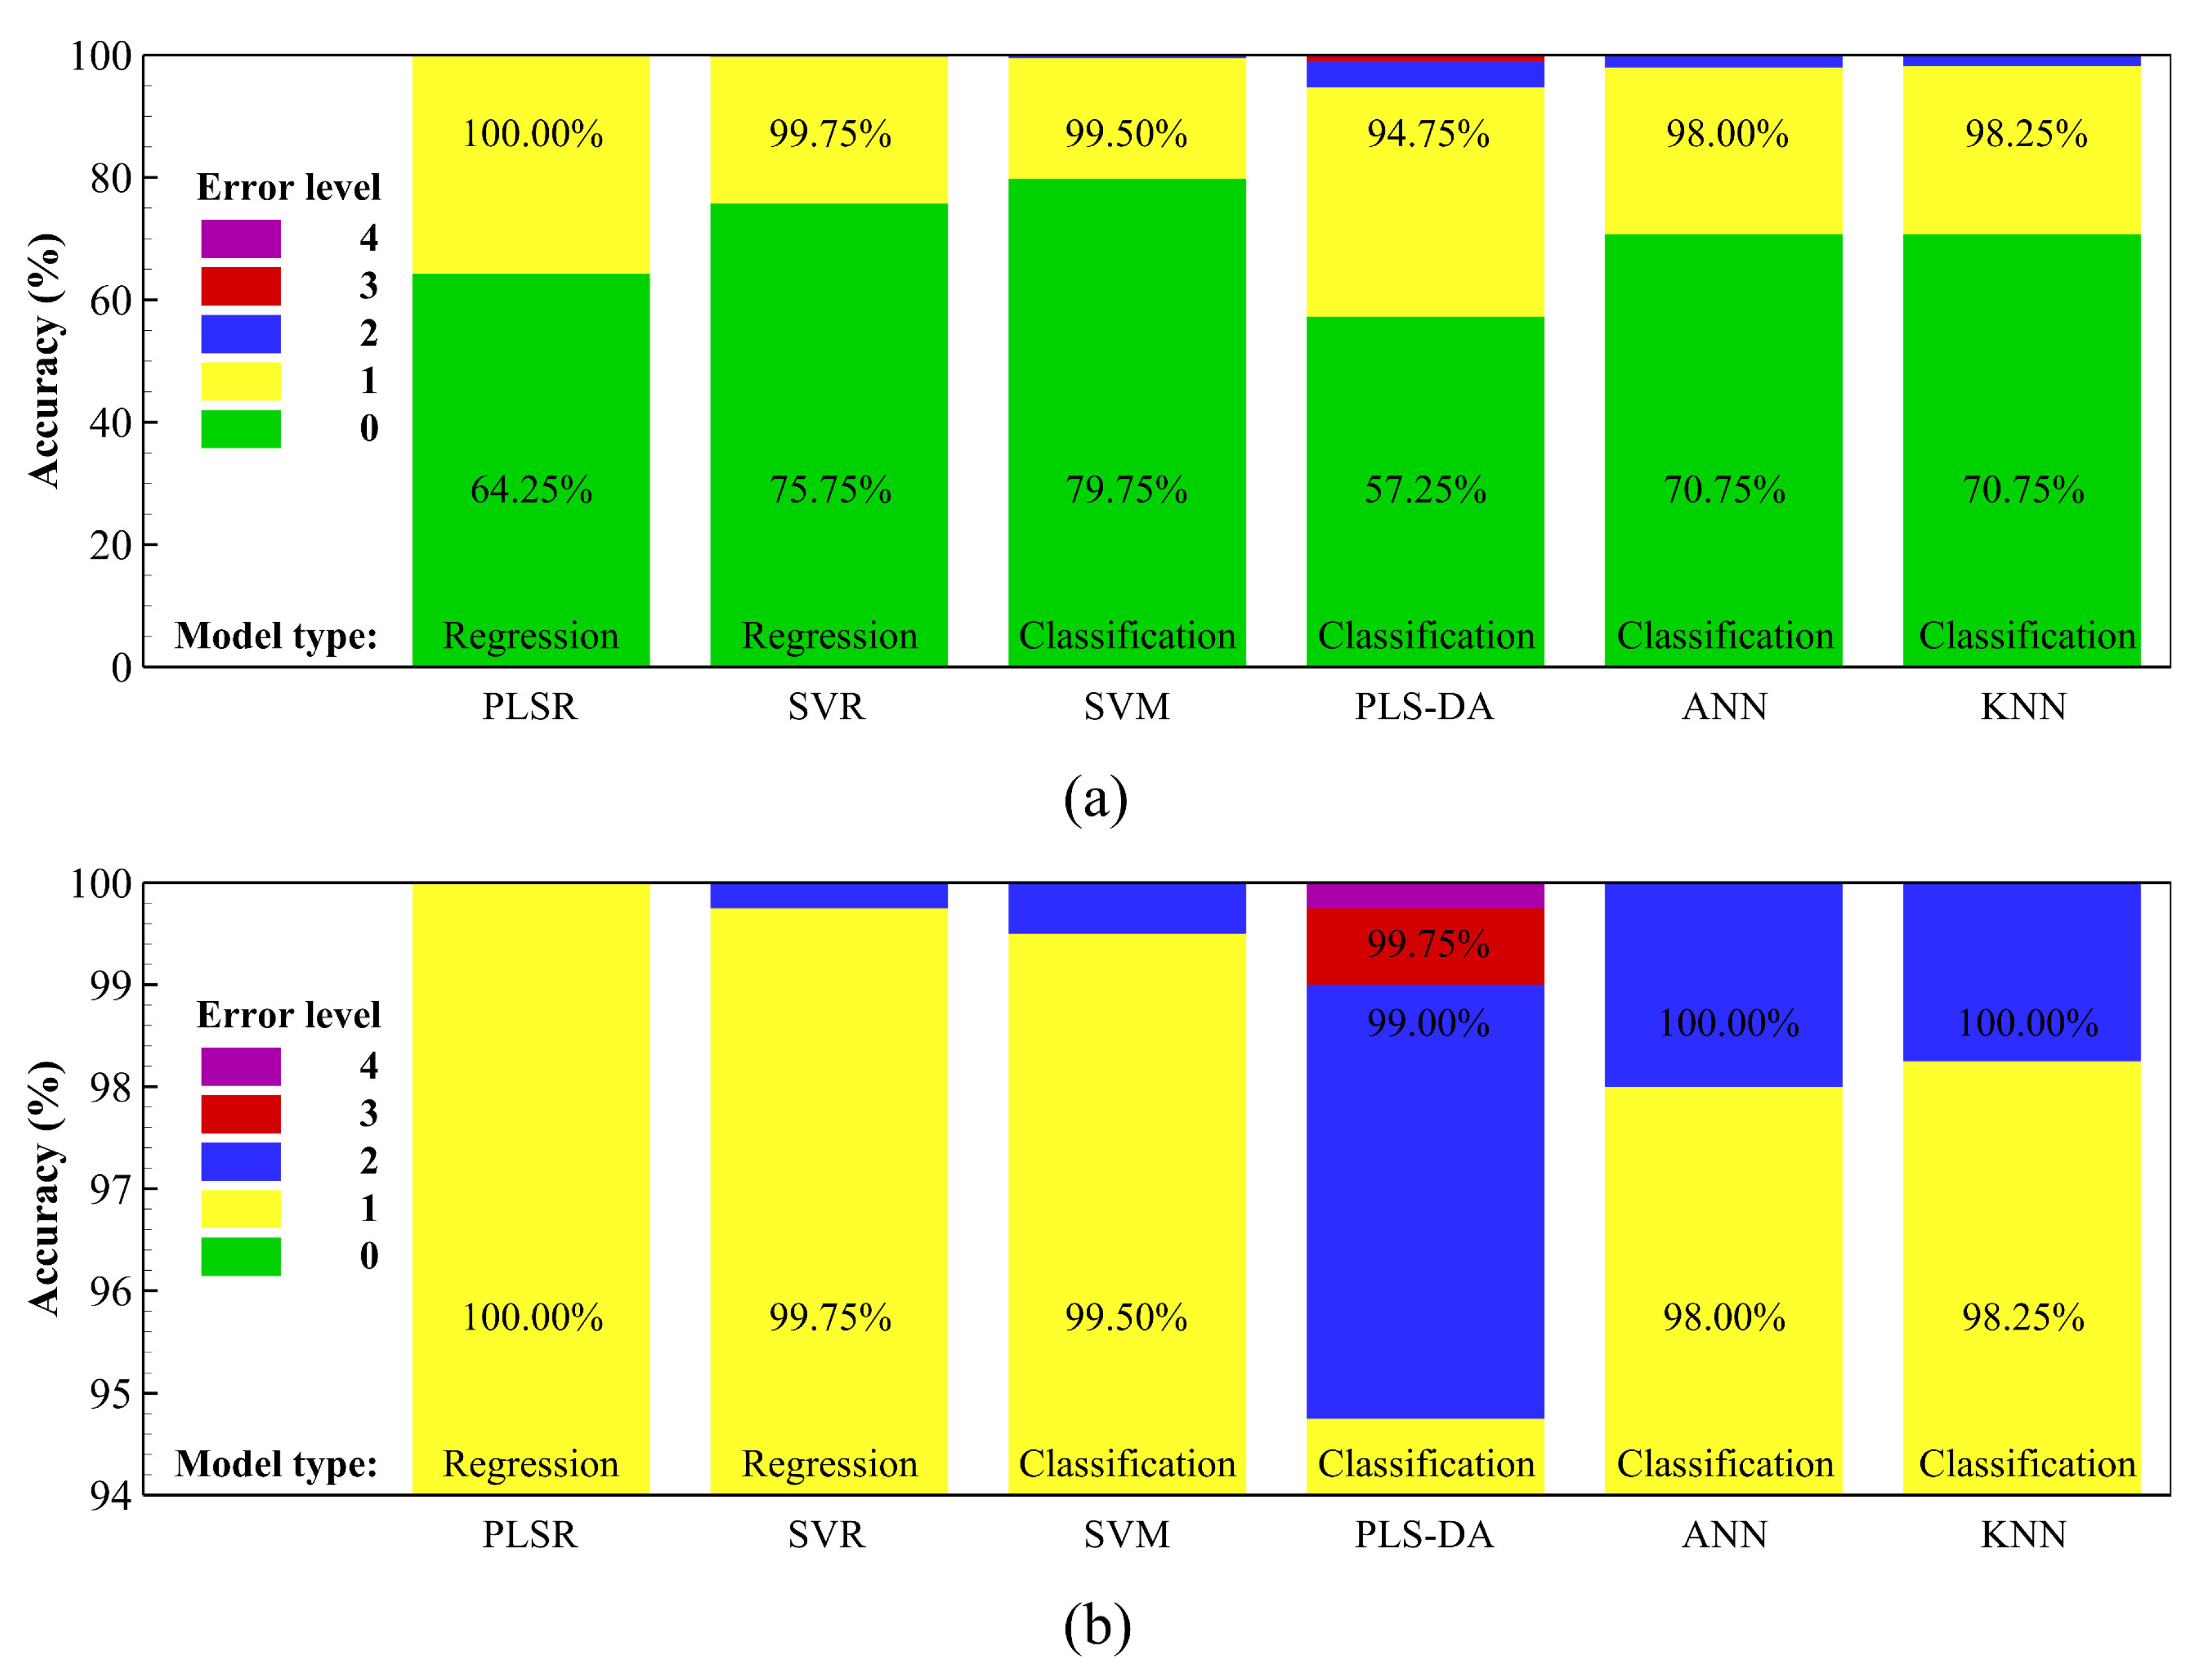
3.2. Average-Spectrum Approach Using Regression and Classification Algorithms

The exact accuracy and n-level error accuracy of the six ripeness evaluation models with the use of averaged spectral data of ROI of each fruit are shown in Figure 4. The exact accuracy of all models used in this study ranges from 52.25% to 79.75%. Compared with other models, PLS-based models had the lowest accuracy. In this study, the optimal numbers of components chosen, through Least Mean Squared Error (LMSE) on the validation data set, for PLSR and PLS-DA are 26 and 48, respectively. The degrees of accuracy of PLS-DA and PLSR are 57.25% and 64.25%, respectively. Furthermore, the support vector-based models had the highest accuracy. The degrees of accuracy of SVR and SVM are 79.75% and 75.75%, respectively.
Of all models, the one-level error accuracy is much higher than exact accuracy. Furthermore, the regression models have higher one-level error accuracy than classification models do. Both one-level error accuracies of PLSR and SVR are higher than 99%. The reason why regression models have higher one-level error accuracy could be regression models retain the information about the order of the ripeness levels. Compared to classification models, most incorrect predictions of regression models fell into adjacent ripeness levels instead of other ones.
The PLSR model has the highest one-level error accuracy (100%); however, the PLS-DA model has the lowest one-level error accuracy. Moreover, PLS-DA is the only algorithm with a prediction error higher than 2-level (0.75% and 0.25% for three- and four-level errors, respectively). Although PLS-DA was commonly used for ripeness prediction with high accuracy using averaged spectrum [29,30,36], it seems that it is not suitable for the ripeness evaluation of achacha fruits.
Figure 5 shows the exact accuracy and n-level-error accuracy of the six ripeness evaluation models using pixel-based prediction and the majority rule approach. For the classification models, the output of pixels is considered as the labels of ripeness level; the majority rule can be applied to the classification results to obtain the ripeness level of the fruit. Because, for the regression models, the ripeness value of each pixel is a real number, the classification results were converted to the labels of ripeness level before applying the majority rule. The conversion rules are as follows. For a pixel with a ripeness value less than 1.5, the ripeness level is 1; for a pixel with a ripeness value within the interval of [n − 0.5, n + 0.5) where n is an integer ranges from 2 to 6, the ripeness level is n; and for pixel with ripeness value equal or greater than 6.5, the ripeness level is 7. The exact and n-level-error accuracies of the six models using pixel-based prediction and majority rule are comparable to those of the six models using the average spectrum. Thus, the same pixel-based spectral data can be used for defect classification (if necessary) and ripeness evaluation, and there is no need to prepare an additional average spectrum for ripeness assessment.
Because the ripeness outputs of regression models (SVR and PLSR) are real numbers, additionally applying the majority rule to the pixel-based classification results to obtain the ripeness level of a fruit, the mean or average of pixel-based prediction results can also be used to obtain the ripeness stage of fruits. In this study, the mean of pixel-based prediction results was rounded to an integer to be the ripeness level of achacha fruits. Figure 6 shows the exact accuracy and n-level-error accuracy of regression models using the average and majority rule of pixel-based prediction results. For both average and majority rule approaches, SVR has higher exact accuracy; however, PLSR has higher one-level error accuracy. PLSR using the average approach has the highest one-level error accuracy and has no ripeness stage error of more than one level; in addition, the predicting speed of the PLSR model is much faster (about 400 times) than that of the SVR model in this study. Therefore, the pixel-based approach using the PLSR model is more suitable for on-line real-time sorting applications if a one-level error is acceptable.

3.3. The Effect of Curvature on Ripeness Evaluation

When performing hyperspectral imaging acquisition using uniform illumination, reflected light from regions near the edge of an object with a curved surface will have its intensity reduced greatly [48] and may have undesired imaging artifacts [49]. In this work, no surface curvature effect correction algorithm was applied to the hyperspectral data of achacha fruit samples because the correction needs fruit shape information, which should be obtained by using an extra device, such as a 3D profilometer. Figure 7 shows the effect of curvature on ripeness evaluation results of regression models. The pixel-based prediction results of samples with low, medium and high ripeness levels evaluated using PLSR and SVR models are shown in Figure 7b,c, respectively. The curvature of fruit has a similar influence on the ripeness evaluation results of both models; however, the curvature effects on the two models are not the same. For fruit that had a low ripeness stage, the curvature effect shifts the ripeness values to higher values for the PLSR model and to lower values for the SVR model, respectively. The curvature of the fruit has no obvious effect on the ripeness evaluation values of both models for medium ripeness fruits. Furthermore, the curvature of high ripeness stage fruits moves the ripeness values to lower values for both models. However, the effect on the SVR model, shown in Figure 7c, is more serious. It is worth noting that, for both models, the ripeness evaluation results of the central regions of samples are relatively consistent, except that the ripeness values predicted by PLSR are slightly higher than those predicted by SVR for the high ripeness level fruit.
The aforementioned results suggest that using the spectral data in the central region of achacha fruits would be a relatively reliable option for ripeness evaluation. In this study, the original mask of the fruit was eroded by a diamond structuring element with 101 × 101 kernel size. Depending on the fruit size, about 50% to 65% of the area was eroded.
Figure 8 shows the normalized histograms (bin width = 0.01) and standard deviations of the ripeness value distribution of pixels in ROI of the typical fruit samples at different ripeness stages predicted by PLSR and SVR models. The shapes of histograms of the PLSR model, compared with those of the SVR model, are closer to normal distribution. However, the standard deviations of the SVR model were significantly lower than those of the PLSR model, and the reason could be that the SVR can ignore smaller errors and thus are less sensitive to noise [38,39]. The sample with ripeness stage three has the largest standard deviation and the widely spread pixel-based classification results, and thus the sample is more prone to the occurrence of one-level error. The reason why fruits at ripeness stage three had the largest standard deviation of ripeness value could be due to the combined effects of color gradient caused by non-uniform sunlight exposure and the mixed color between the neighboring ripeness stages.
The regression models using a pixel-based approach have high one-level error accuracy; however, applying different statistical methods to the same pixel-based classification outcomes can result in different ripeness levels. The three typical cases shown in Figure 9 are used to illustrate how the distribution of ripeness values of pixels and the statistical methods affect the classification outcome of achacha fruits.
It can be seen from Figure 9a,b that, for fruits with the histograms of pixel-based prediction results close to Gaussian distributions, the means of ripeness value are close to the ripeness value corresponding to histograms’ peaks. If the mean of ripeness values of the sample is far away from the bounds of intervals used to calculate the mode, the ripeness levels predicted using the mean or mode of ripeness values would be the same. On the other hand, if the mean is close to a bound of intervals, the ripeness levels predicted using the mean or mode have a high chance of being one level different. For example, as shown in Figure 9a, the mean ripeness value (6.045) of fruit is far away from the bounds (5.5 and 6.5) used to compute mode, and thus the ripeness levels predicted using the mean or mode of ripeness values are the same (stage 6). In contrast, the mean ripeness value (5.504) of fruit shown in Figure 9b is only slightly higher than the upper bound (5.5) of the interval for mode calculation because 51.09% and 48.62% of pixels had ripeness values within the intervals 4.5, 5.5 and 5.5, 6.5 respectively, the ripeness level predicted the using mean ripeness value is one level higher than that predicted using the mode of the histogram. This specific sample was correctly predicted at level 5 by using mode since the distribution of level five is 2.47% higher than that of level 6. However, it was misclassified as level 6 using the mean of ripeness values due to the long spread of the histogram on the right-hand side. For fruit with non-Gaussian distributions of ripeness value histogram shown in Figure 9c, the standard deviation of the histogram is larger than that of fruit with Gaussian distributions of ripeness value histogram. Thus, the ripeness level calculated using the majority vote (mode) or the rounded average (mean) could have a higher chance of being different.
One thing that should be pointed out is that defect pixels, when performing pixel-based classification, on the fruit surface can have abnormal ripeness values, which are much higher or lower than the ripeness value the fruit should have. For fruits with small defect area(s), which were not screened out by the sorting algorithm, the highly abnormal ripeness values in a small area could have a more significant effect on the ripeness value calculation based on mean rather than mode. Therefore, for achacha fruits with minor defects, using the mode to obtain the ripeness level from pixel-based classification outcomes could be more reliable than using the mean.
Although mere visual inspection by human vision allows inspectors to perform ripeness stage sorting of fruits, quantification can be enhanced and standardized if fruits under inspection can be compared to some type of standard. Thus, color charts have been developed to make the ripeness evaluation of fruits more objective and allow normalization of the measurements of different inspectors. The photo shown in Figure 1 can be used as a ripeness chart to measure the ripeness stage of achacha fruits by inspectors. It is worth noting that the ripening of fruits is a continuous process. When the ripeness value is close to the bounds n − 0.5 or n + 0.5 of interval for mode calculation, using human vision, machine vision with an RGB camera or a hyperspectral imaging system to classify the ripeness stage has a high chance of having one-level ripeness errors. For example, the ripeness stages of specimens shown in Figure 10b,d were assigned as four and six, respectively, by human experts; however, the ripeness statuses of these samples predicted by all models are stage 5 (one level higher or lower than the assigned ripeness stages correspondingly). Furthermore, for achacha fruits at ripeness stages from two to six, the ripeness values of the face exposed to sunlight could be one level higher than that of the face in the shadow when using the current seven-level ripeness scale. For this reason, dividing the ripeness status of achacha into more stages (levels) would have limited usage to improve the ripeness evaluation of achacha fruits. Taking the aforementioned circumstances into consideration, using models with high one-level error accuracy for on-line sorting of achacha fruits would be a more practical option.
It is worth noting that, for regression models, the ripeness values are real numbers, so the ripeness value (n + 0.5) at the midpoint of two adjacent ripeness levels (n and n + 1) can be assigned to suitable fruits by human experts and combine the spectral data to the training data set to improve the model without increasing the number of ripeness level. Furthermore, although the ripeness level n was assigned to pixels with ripeness value within the interval of [n − 0.5, n + 0.5), this interval can be adjusted to meet specific requirements of ripeness stage output if necessary without re-training the regression models. Thus, compared to classification models for fruit ripeness level determination [17,18,19], regression models could have more flexibility when they are deployed to the sorting line of fruits.
In this study, only spectral reflectance was used to evaluate the ripeness stage of the fruit. However, the physicochemical properties of achacha fruits with the same color or spectral reflectance from different farms, may more or less vary due to different cultivar and environmental factors [50]. Therefore, the evaluation of other ripeness properties, such as SSC [51,52], Total Soluble Solids (TSS) [53] and acidity [54,55], can help the ripening evaluation of achacha fruits. However, the advantages of using color or spectral features to evaluate fruit ripeness are non-invasive and fast, so they are suitable for on-line postharvest processing. In future study, ripeness properties, obtained from invasive tests, such as SSC, TSS and Titratable acidity, can be combined with spectral data to refine the ripeness evaluation models.

4. Conclusions

The hyperspectral image data were used to evaluate the seven ripeness stages of achacha fruits. Classification and regression machine learning models were used to assess the accuracy and n-level-error accuracy of ripeness stages. The spectral data used for training and validation were selected from the two most representative achacha fruit samples of each ripeness stage. Besides using an averaged spectrum of fruit samples to predict the ripeness stage, pixel-based ripeness prediction results of fruit samples were also used to evaluate the ripeness stage. With the use of averaged spectral data, the support-vector-based models (SVM and SVR) have higher accuracy than other models, and the PLS-based models (PLSR and PLS-DA) have the lowest accuracy. Furthermore, the regression models (PLSR and SVR) have the highest one-level error accuracy. With the use of pixel-based ripeness prediction results and majority rule, the accuracy and one-level error accuracy of all models used in this study are comparable to the accuracy and one-level error accuracy predicted by models using averaged spectrum. Thus, the same pixel-based spectral data can be used for ripeness evaluation and defect classification (if necessary) of achacha fruits. The ripening of fruits is a continuous process. When the ripeness value of achacha fruit is close to the mid value of two adjacent ripeness stage values, all models have a high chance of having one-level ripeness errors. The use of high one-level-error accuracy models would be a practical option for the postharvest process of achacha fruits. The PLSR has the highest one-level error accuracy and has no ripeness stage error of more than one level; additionally, the predicting speed of the PLSR model is fast. Therefore, the pixel-based approach using the PLSR model is suitable for on-line real-time sorting applications. For fruits with low or high ripeness stages, the curvature of the fruit has a noticeable influence on the ripeness evaluation values. Thus, using only spectral data in the central region of achacha fruits would be a relatively reliable choice for ripeness evaluation. In order to improve the ripeness evaluation models, ripeness properties obtained from invasive tests can be combined with spectral data to train the machine learning models.

Author Contributions

Conceptualization: N.-S.L. and N.M.T.N.; analysis: N.M.T.N.; funding acquisition: N.-S.L.; writing—original draft preparation: N.M.T.N.; writing—review & editing: N.-S.L. and N.M.T.N. All authors have read and agreed to the manuscript submitted to Agriculture.

Funding

This research was supported by the Ministry of Science and Technology, Taiwan (MOST 110-2637-E-218-005).

Institutional Review Board Statement

Not applicable.

Informed Consent Statement

Not applicable.

Data Availability Statement

Not applicable.

Conflicts of Interest

The authors declare no conflict of interest.

References

  1. Toivonen, P.M. Fruit maturation and ripening and their relationship to quality. Stewart Postharvest Rev. 2007, 3, 1–5. [Google Scholar] [CrossRef]
  2. Nunes, R.; Broering, M.F.; De Faveri, R.; Goldoni, F.C.; Mariano, L.N.B.; Mafessoli, P.C.M.; Delle Monache, F.; Cechinel, V.; Niero, R.; Santin, J.R.; et al. Effect of the metanolic extract from the leaves of Garcinia humilis Vahl (Clusiaceae) on acute inflammation. Inflammopharmacology 2021, 29, 423–438. [Google Scholar] [CrossRef] [PubMed]
  3. Almeida, R.L.J.; Santos, N.C.; Alves, I.L.; Andre, A.M.M.C.N. Evaluation of thermodynamic properties and antioxidant activities of Achachairu (Garcinia humilis) peels under drying process. Flavour. Frag. J. 2021, 36, 213–222. [Google Scholar] [CrossRef]
  4. Valero, D.; Serrano, M. Growth and ripening stage at harvest modulates postharvest quality and bioactive compounds with antioxidant activity. Stewart Postharvest Rev. 2013, 3, 7. [Google Scholar]
  5. Li, B.; Lecourt, J.; Bishop, G. Advances in Non-Destructive Early Assessment of Fruit Ripeness towards Defining Optimal Time of Harvest and Yield Prediction-A Review. Plants 2018, 7, 3. [Google Scholar] [CrossRef] [PubMed] [Green Version]
  6. Birth, G.S.; Norris, K.H. An instrument using light transmittance for nondestructive measurement of fruit maturity. Food Technol. 1958, 12, 592–595. [Google Scholar]
  7. Gonzalez-Araiza, J.R.; Ortiz-Sanchez, M.C.; Vargas-Luna, F.M.; Cabrera-Sixto, J.M. Application of electrical bio-impedance for the evaluation of strawberry ripeness. Int. J. Food Prop. 2017, 20, 1044–1050. [Google Scholar] [CrossRef]
  8. Llobet, E.; Hines, E.L.; Gardner, J.W.; Franco, S. Non-destructive banana ripeness determination using a neural network-based electronic nose. Meas. Sci. Technol. 1999, 10, 538. [Google Scholar] [CrossRef]
  9. Choi, K.; Lee, G.; Han, Y.J.; Bunn, J.M. Tomato Maturity Evaluation Using Color Image-Analysis. Trans. Asae 1995, 38, 171–176. [Google Scholar] [CrossRef]
  10. Yang, H.Q. Nondestructive Prediction of Optimal Harvest Time of Cherry Tomatoes Using VIS-NIR Spectroscopy and PLSR Calibration. Adv. Eng. Forum 2011, 1, 92–96. [Google Scholar] [CrossRef] [Green Version]
  11. Sivakumar, S.S.; Qiao, J.; Wang, N.; Gariépy, Y.; Raghavan, G.S.V.; McGill, J. Detecting Maturity Parameters of Mango Using Hyperspectral Imaging Technique; American Society of Agricultural and Biological Engineers: St. Joseph, MI, USA, 2006. [Google Scholar]
  12. Lleo, L.; Barreiro, P.; Ruiz-Altisent, M.; Herrero, A. Multispectral images of peach related to firmness and maturity at harvest. J. Food Eng. 2009, 93, 229–235. [Google Scholar] [CrossRef] [Green Version]
  13. Flitsanov, U.; Mizrach, A.; Liberzon, A.; Akerman, M.; Zauberman, G. Measurement of avocado softening at various temperatures using ultrasound. Postharvest Biol. Technol. 2000, 20, 279–286. [Google Scholar] [CrossRef]
  14. El-Bendary, N.; El Hariri, E.; Hassanien, A.E.; Badr, A. Using machine learning techniques for evaluating tomato ripeness. Expert Syst. Appl. 2015, 42, 1892–1905. [Google Scholar] [CrossRef]
  15. Wan, P.; Toudeshki, A.; Tan, H.Q.; Ehsani, R. A methodology for fresh tomato maturity detection using computer vision. Comput. Electron. Agric. 2018, 146, 43–50. [Google Scholar] [CrossRef]
  16. Cardenas-Perez, S.; Chanona-Perez, J.; Mendez-Mendez, J.V.; Calderon-Dominguez, G.; Lopez-Santiago, R.; Perea-Flores, M.J.; Arzate-Vazquez, I. Evaluation of the ripening stages of apple (Golden Delicious) by means of computer vision system. Biosyst. Eng. 2017, 159, 46–58. [Google Scholar] [CrossRef]
  17. Mohammadi, V.; Kheiralipour, K.; Ghasemi-Varnamkhasti, M. Detecting maturity of persimmon fruit based on image processing technique. Sci. Hortic. 2015, 184, 123–128. [Google Scholar] [CrossRef]
  18. Kheiralipour, K.; Nadimi, M.; Paliwal, J. Development of an Intelligent Imaging System for Ripeness Determination of Wild Pistachios. Sensors 2022, 22, 7134. [Google Scholar] [CrossRef] [PubMed]
  19. Azadnia, R.; Kheiralipour, K. Evaluation of hawthorns maturity level by developing an automated machine learning-based algorithm. Ecol. Inform. 2022, 71, 101804. [Google Scholar] [CrossRef]
  20. Jiang, Y.P.; Chen, S.F.; Bian, B.; Li, Y.H.; Sun, Y.; Wang, X.C. Discrimination of Tomato Maturity Using Hyperspectral Imaging Combined with Graph-Based Semi-supervised Method Considering Class Probability Information. Food Anal. Methods 2021, 14, 968–983. [Google Scholar] [CrossRef]
  21. Arias, R.; Lee, T.C.; Logendra, L.; Janes, H. Correlation of lycopene measured by HPLC with the L*, a* b* color readings of a hydroponic tomato and the relationship of maturity with color and lycopene content. J. Agric. Food Chem. 2000, 48, 1697–1702. [Google Scholar] [CrossRef]
  22. Wang, H.T.; Hu, R.; Zhang, M.Y.; Zhai, Z.Q.; Zhang, R.Y. Identification of tomatoes with early decay using visible and near infrared hyperspectral imaging and image-spectrum merging technique. J. Food Process Eng. 2021, 44, e13654. [Google Scholar] [CrossRef]
  23. Prasanna, V.; Prabha, T.N.; Tharanathan, R.N. Fruit ripening phenomena–An overview. Crit. Rev. Food Sci. Nutr. 2007, 47, 1–19. [Google Scholar] [CrossRef] [PubMed]
  24. Riley, D.L.; Bryan, S.; Jacob, S.; Neil, S.W.; Amy, P.; John, W.S.; Joseph, A.S. Hyperspectral imaging and machine learning for monitoring produce ripeness. In Proceedings of the Sensing for Agriculture and Food Quality and Safety XII, Online, 22 April 2020; p. 114210O. [Google Scholar]
  25. Zhang, C.; Guo, C.T.; Liu, F.; Kong, W.W.; He, Y.; Lou, B.G. Hyperspectral imaging analysis for ripeness evaluation of strawberry with support vector machine. J. Food Eng. 2016, 179, 11–18. [Google Scholar] [CrossRef]
  26. Wei, X.; Liu, F.; Qiu, Z.J.; Shao, Y.N.; He, Y. Ripeness Classification of Astringent Persimmon Using Hyperspectral Imaging Technique. Food Bioprocess Technol. 2014, 7, 1371–1380. [Google Scholar] [CrossRef]
  27. Yang, C.; Lee, W.S.; Gader, P. Hyperspectral band selection for detecting different blueberry fruit maturity stages. Comput. Electron. Agric. 2014, 109, 23–31. [Google Scholar] [CrossRef]
  28. Zhao, W.; Yang, Z.; Chen, Z.; Liu, J.; Wang, W.C.; Zheng, W.Y. Hyperspectral Surface Analysis for Ripeness Estimation and Quick UV-C Surface Treatments for Preservation of Bananas. J. Appl. Spectrosc. 2016, 83, 254–260. [Google Scholar] [CrossRef]
  29. Pu, Y.Y.; Sun, D.W.; Buccheri, M.; Grassi, M.; Cattaneo, T.M.P.; Gowen, A. Ripeness Classification of Bananito Fruit (Musa acuminata, AA): A Comparison Study of Visible Spectroscopy and Hyperspectral Imaging. Food Anal. Methods 2019, 12, 1693–1704. [Google Scholar] [CrossRef]
  30. Khodabakhshian, R.; Emadi, B. Application of Vis/SNIR hyperspectral imaging in ripeness classification of pear. Int. J. Food Prop. 2018, 20, S3149–S3163. [Google Scholar] [CrossRef] [Green Version]
  31. Polder, G.; van der Heijden, G.; Young, I. Hyperspectral image analysis for measuring ripeness of tomatoes. Trans. ASAE 2000, 45, 1155–1161. [Google Scholar]
  32. Zhang, M.S.; Zhang, B.; Li, H.; Shen, M.S.; Tian, S.J.; Zhang, H.H.; Ren, X.L.; Xing, L.B.; Zhao, J. Determination of bagged ‘Fuji’ apple maturity by visible and near-infrared spectroscopy combined with a machine learning algorithm. Infrared Phys. Technol. 2020, 111, 103529. [Google Scholar] [CrossRef]
  33. Van Der Heijden, G.W.; Polder, G.; Gevers, T. Comparison of multispectral images across the Internet. In Proceedings of the Internet Imaging, San Jose, CA, USA, 26–28 January 2000; pp. 196–206. [Google Scholar]
  34. Wei, X.; He, J.C.; Ye, D.P.; Jie, D.F. Navel Orange Maturity Classification by Multispectral Indexes Based on Hyperspectral Diffuse Transmittance Imaging. J. Food Qual. 2017, 2017, 1023498. [Google Scholar] [CrossRef] [Green Version]
  35. Xuan, G.T.; Gao, C.; Shao, Y.Y.; Wang, X.Y.; Wang, Y.X.; Wang, K.L. Maturity determination at harvest and spatial assessment of moisture content in okra using Vis-NIR hyperspectral imaging. Postharvest Biol. Technol. 2021, 180, 111597. [Google Scholar] [CrossRef]
  36. Shao, Y.Y.; Wang, Y.X.; Xuan, G.T.; Gao, Z.M.; Hu, Z.C.; Gao, C.; Wang, K.L. Assessment of Strawberry Ripeness Using Hyperspectral Imaging. Anal. Lett. 2020, 54, 1547–1560. [Google Scholar] [CrossRef]
  37. Munera, S.; Amigo, J.M.; Blasco, J.; Cubero, S.; Talens, P.; Aleixos, N. Ripeness monitoring of two cultivars of nectarine using VIS-NIR hyperspectral reflectance imaging. J. Food Eng. 2017, 214, 29–39. [Google Scholar] [CrossRef]
  38. Drucker, H.; Burges, C.J.; Kaufman, L.; Smola, A.; Vapnik, V. Support vector regression machines. In Advances in Neural Information Processing Systems; MIT Press: Cambridge, MA, USA, 1996; Volume 9. [Google Scholar]
  39. Awad, M.; Khanna, R. Efficient Learning Machines: Theories, Concepts, and Applications for Engineers and System Designers; Springer Nature: Berlin/Heidelberg, Germany, 2015. [Google Scholar]
  40. Silva, R.; Gomes, V.; Mendes-Faia, A.; Melo-Pinto, P. Using Support Vector Regression and Hyperspectral Imaging for the Prediction of Oenological Parameters on Different Vintages and Varieties of Wine Grape Berries. Remote Sens. 2018, 10, 312. [Google Scholar] [CrossRef] [Green Version]
  41. Azarmdel, H.; Jahanbakhshi, A.; Mohtasebi, S.S.; Munoz, A.R. Evaluation of image processing technique as an expert system in mulberry fruit grading based on ripeness level using artificial neural networks (ANNs) and support vector machine (SVM). Postharvest Biol. Technol. 2020, 166, 111201. [Google Scholar] [CrossRef]
  42. Jaramillo-Acevedo, C.A.; Choque-Valderrama, W.E.; Guerrero-Alvarez, G.E.; Meneses-Escobar, C.A. Hass avocado ripeness classification by mobile devices using digital image processing and ANN methods. Int. J. Food Eng. 2020, 16, 20190161. [Google Scholar] [CrossRef]
  43. Amirulah, R.; Mokji, M.; Ibrahim, Z. Starfruit color maturity classification using Cr as feature. In Proceedings of the 2010 Sixth International Conference on Signal-Image Technology and Internet Based Systems, Kuala Lumpur, Malaysia, 15–18 December 2010; pp. 93–97. [Google Scholar]
  44. Garcia, M.B.; Ambat, S.; Adao, R.T. Tomayto, tomahto: A machine learning approach for tomato ripening stage identification using pixel-based color image classification. In Proceedings of the 2019 IEEE 11th International Conference on Humanoid, Nanotechnology, Information Technology, Communication and Control, Environment, and Management (HNICEM), Laoag, Philippines, 29 November–1 December 2019; pp. 1–6. [Google Scholar]
  45. Polder, G.; van der Heijden, G.W.A.M.; Young, I.T. Spectral image analysis for measuring ripeness of tomatoes. Trans. Asae 2002, 45, 1155–1161. [Google Scholar] [CrossRef]
  46. Seager, S.; Turner, E.L.; Schafer, J.; Ford, E.B. Vegetation’s red edge: A possible spectroscopic biosignature of extraterrestrial plants. Astrobiology 2005, 5, 372–390. [Google Scholar] [CrossRef]
  47. Gates, D.M.; Keegan, H.J.; Schleter, J.C.; Weidner, V.R. Spectral properties of plants. Appl. Opt. 1965, 4, 11–20. [Google Scholar] [CrossRef]
  48. Delwiche, S.R.; Baek, I.; Kim, M.S. Effect of curvature on hyperspectral reflectance images of cereal seed-sized objects. Biosyst. Eng. 2021, 202, 55–65. [Google Scholar] [CrossRef]
  49. Rogelj, L.; Simoncic, U.; Tomanic, T.; Jezersek, M.; Pavlovcic, U.; Stergar, J.; Milanic, M. Effect of curvature correction on parameters extracted from hyperspectral images. J. Biomed. Opt. 2021, 26, 096003. [Google Scholar] [CrossRef] [PubMed]
  50. Valero, D.; Serrano, M. Postharvest Biology and Technology for Preserving Fruit Quality; CRC Press: Boca Raton, FL, USA, 2010. [Google Scholar]
  51. Omar, A.F.; MatJafri, M.Z. Near infrared spectral linearisation in quantifying soluble solids content of intact carambola. Sensors 2013, 13, 4876–4883. [Google Scholar] [CrossRef] [PubMed]
  52. Li, X.L.; Wei, Y.Z.; Xu, J.; Feng, X.P.; Wu, F.Y.; Zhou, R.Q.; Jin, J.J.; Xu, K.W.; Yu, X.J.; He, Y. SSC and pH for sweet assessment and maturity classification of harvested cherry fruit based on NIR hyperspectral imaging technology. Postharvest Biol. Technol. 2018, 143, 112–118. [Google Scholar] [CrossRef]
  53. Blanke, M.M. Non-invasive Assessment of Firmness and NIR Sugar (TSS) Measurement in Apple, Pear and Kiwi Fruit. Erwerbs-Obstbau 2013, 55, 19–24. [Google Scholar] [CrossRef]
  54. Teerachaichayut, S.; Ho, H.T. Non-destructive prediction of total soluble solids, titratable acidity and maturity index of limes by near infrared hyperspectral imaging. Postharvest Biol. Technol. 2017, 133, 20–25. [Google Scholar] [CrossRef]
  55. Chauchard, F.; Cogdill, R.; Roussel, S.; Roger, J.M.; Bellon-Maurel, V. Application of LS-SVM to non-linear phenomena in NIR spectroscopy: Development of a robust and portable sensor for acidity prediction in grapes. Chemom. Intell. Lab. Syst. 2004, 71, 141–150. [Google Scholar] [CrossRef]
Figure 1. Seven ripeness stages of achacha fruits.
Agriculture 12 02145 g001
Figure 2. (a) RGB image of achacha fruit, (b) full mask containing fruit sample and (c) eroded mask to define region of interest (ROI) for ripeness evaluation.
Agriculture 12 02145 g002
Figure 3. Spectra of 7 ripeness levels.
Agriculture 12 02145 g003
Figure 4. (a) The exact accuracy and n-level-error accuracy of the six ripeness evaluation models using averaged spectral data and (b) close-up of prediction accuracy.
Agriculture 12 02145 g004
Figure 5. (a) The exact accuracy and n-level-error accuracy of the six ripeness evaluation models using pixel-based prediction and majority rule and (b) the close-up of prediction accuracy.
Agriculture 12 02145 g005
Figure 6. The accuracy and n-level-error accuracy of the regression models using (a) the average and (b) majority rule of pixel-based prediction results.
Agriculture 12 02145 g006
Figure 7. (a) RGB images of samples with low, medium and high ripeness stages. Ripeness values evaluated by using (b) PLSR and (c) SVR models.
Agriculture 12 02145 g007
Figure 8. The normalized histograms of ripeness value distributions of typical fruit samples at different ripeness stages classified by (a) PLSR and (b) SVR models. (c) The related standard deviations of histograms.
Agriculture 12 02145 g008
Figure 9. Ripeness evaluation of fruit samples based on classification results using different statistical methods. The histograms of pixel-based ripeness prediction results which are (a,b) close to Gaussian distribution and (c) non-Gaussian distribution.
Agriculture 12 02145 g009
Figure 10. (a,c,e) Fruit samples of reference stages four, five and six. (b) Fruit samples with ripeness stage four assigned and classified as ripeness stage five by all models. (d) Fruit samples with ripeness stage six assigned and classified as ripeness stage five by all models.
Agriculture 12 02145 g010
Publisher’s Note: MDPI stays neutral with regard to jurisdictional claims in published maps and institutional affiliations.

