Author Contributions
Conceptualization, H.Z., H.W. and T.C.; methodology, H.Z. and H.W.; validation, D.Z., L.Y., X.H. and W.S.; formal analysis, H.Z., H.W. and J.D.; investigation, H.W.; resources, T.C.; data curation, J.D.; writing—original draft preparation, H.Z.; writing—review and editing, D.Z., L.Y., X.H. and W.S.; visualization, H.Z. and J.D.; supervision, T.C.; project administration, T.C.; funding acquisition, T.C. All authors have read and agreed to the published version of the manuscript.
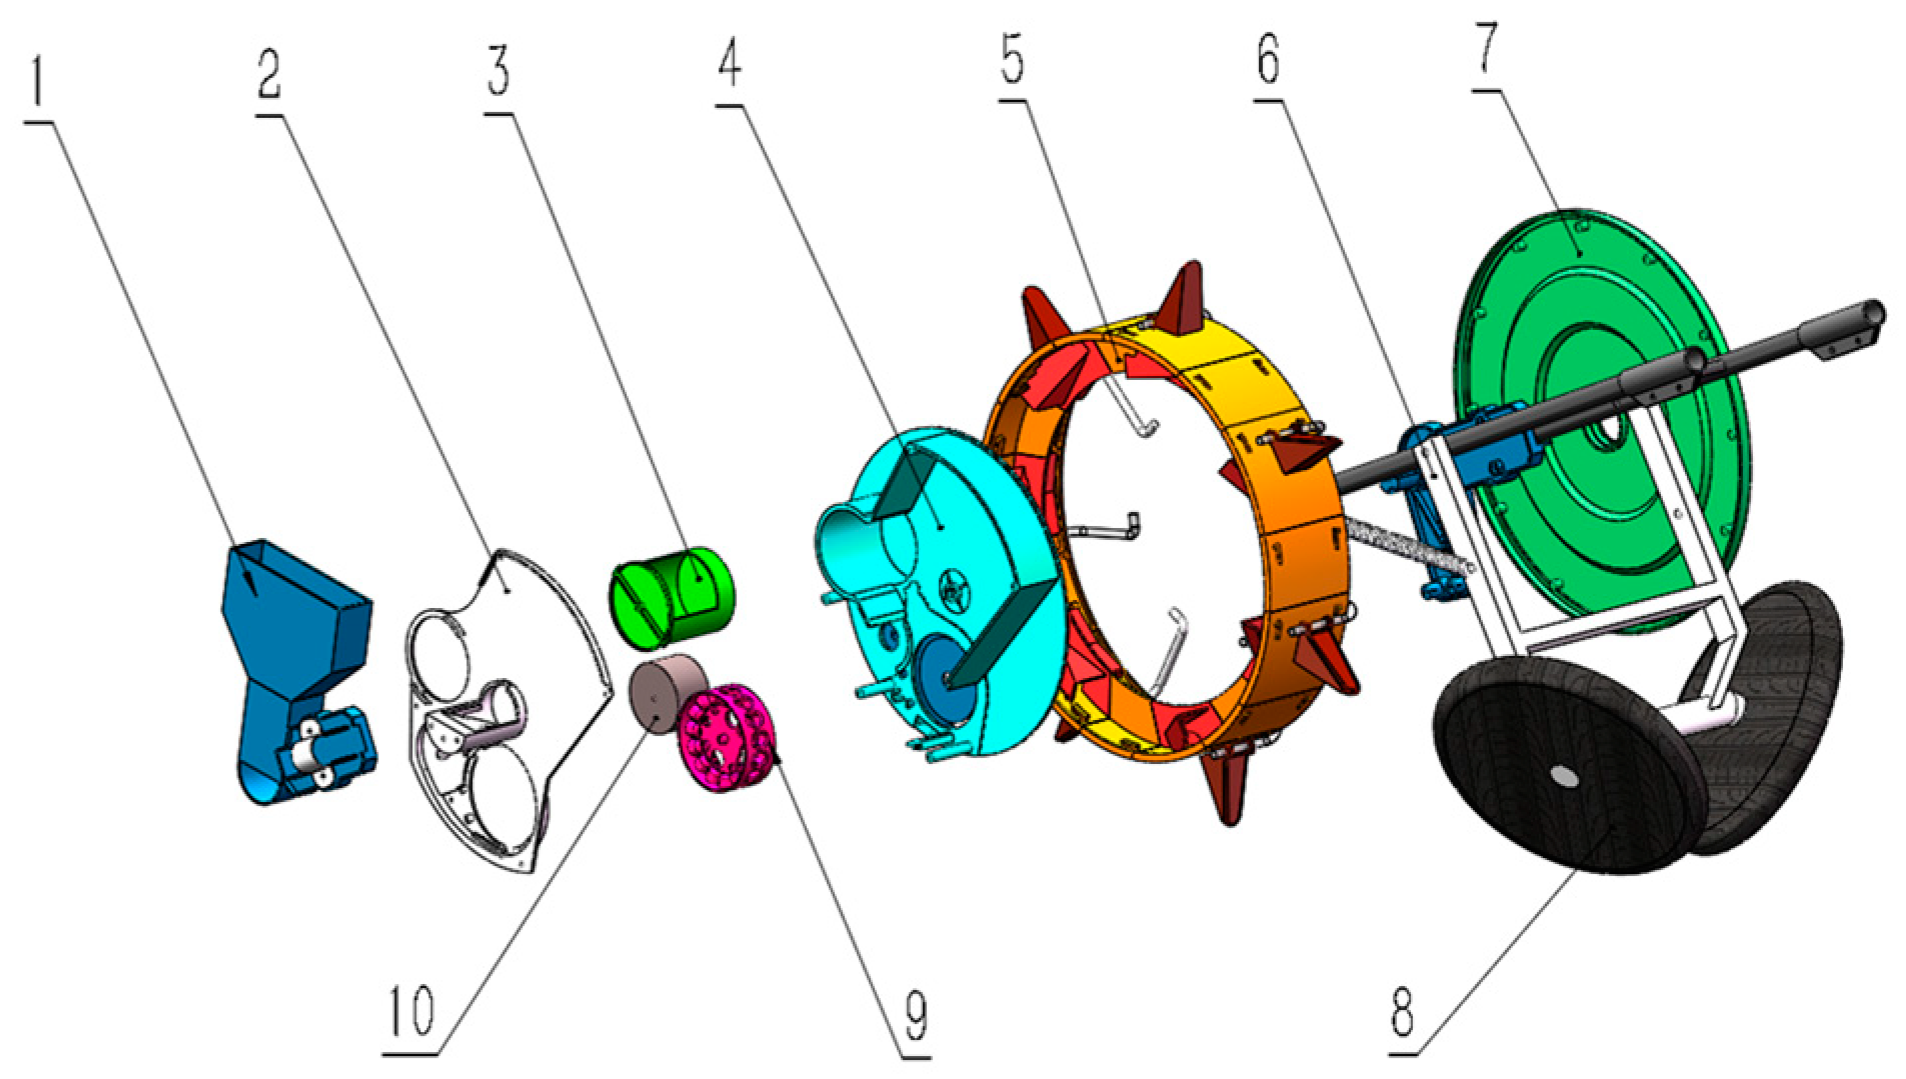
Figure 1.
Three-dimensional assembly drawing of plot seeder. Components: 1. Seed box. 2. Front shell of seeder. 3. Rotary bin type seed changer. 4. Shell of seed meter. 5. Duckbill devices. 6. Body frame of seeder. 7. Rear shell of seeder. 8. Closing wheels. 9. Hole seed-metering wheel. 10. Seed-clearing brush.
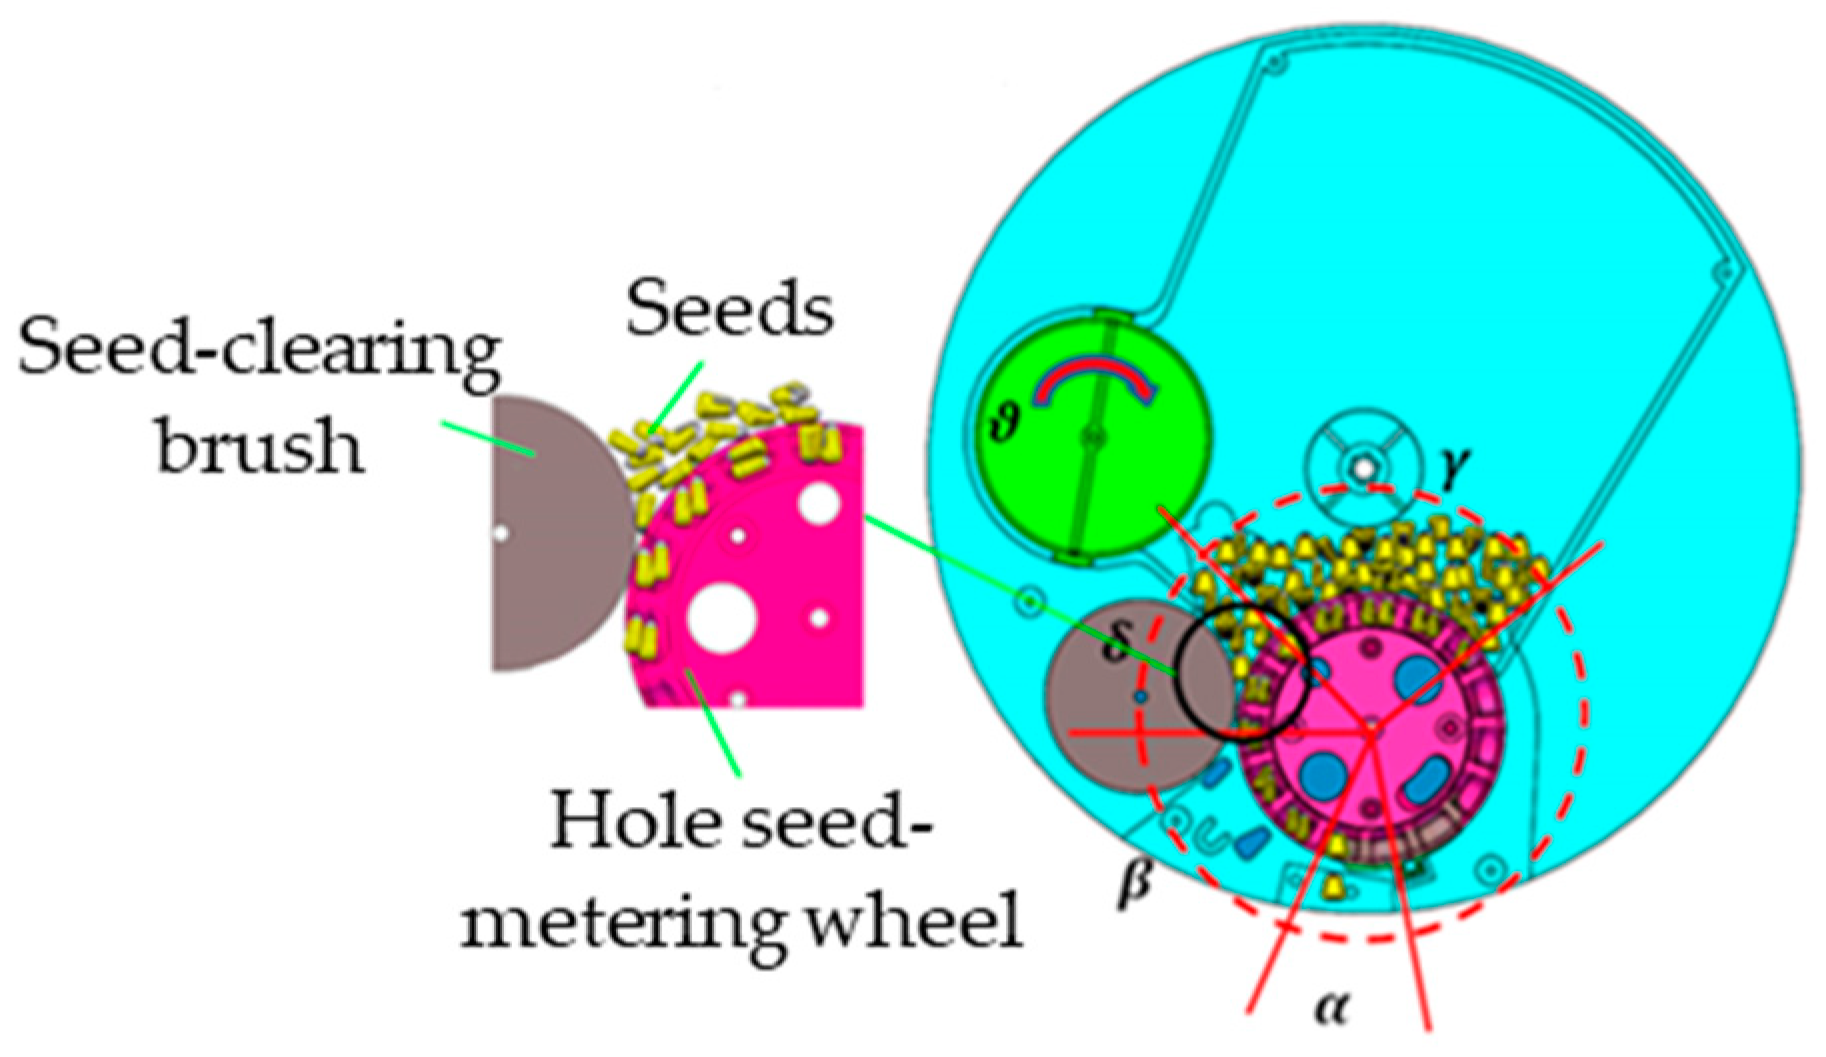
Figure 2.
Working principal diagram of seeder. α, Seed discharging area. β, Seed carrying area. γ, Seed filling area. δ, Seed clearing area. ϑ, Columnar seed changing area.
Figure 2.
Working principal diagram of seeder. α, Seed discharging area. β, Seed carrying area. γ, Seed filling area. δ, Seed clearing area. ϑ, Columnar seed changing area.
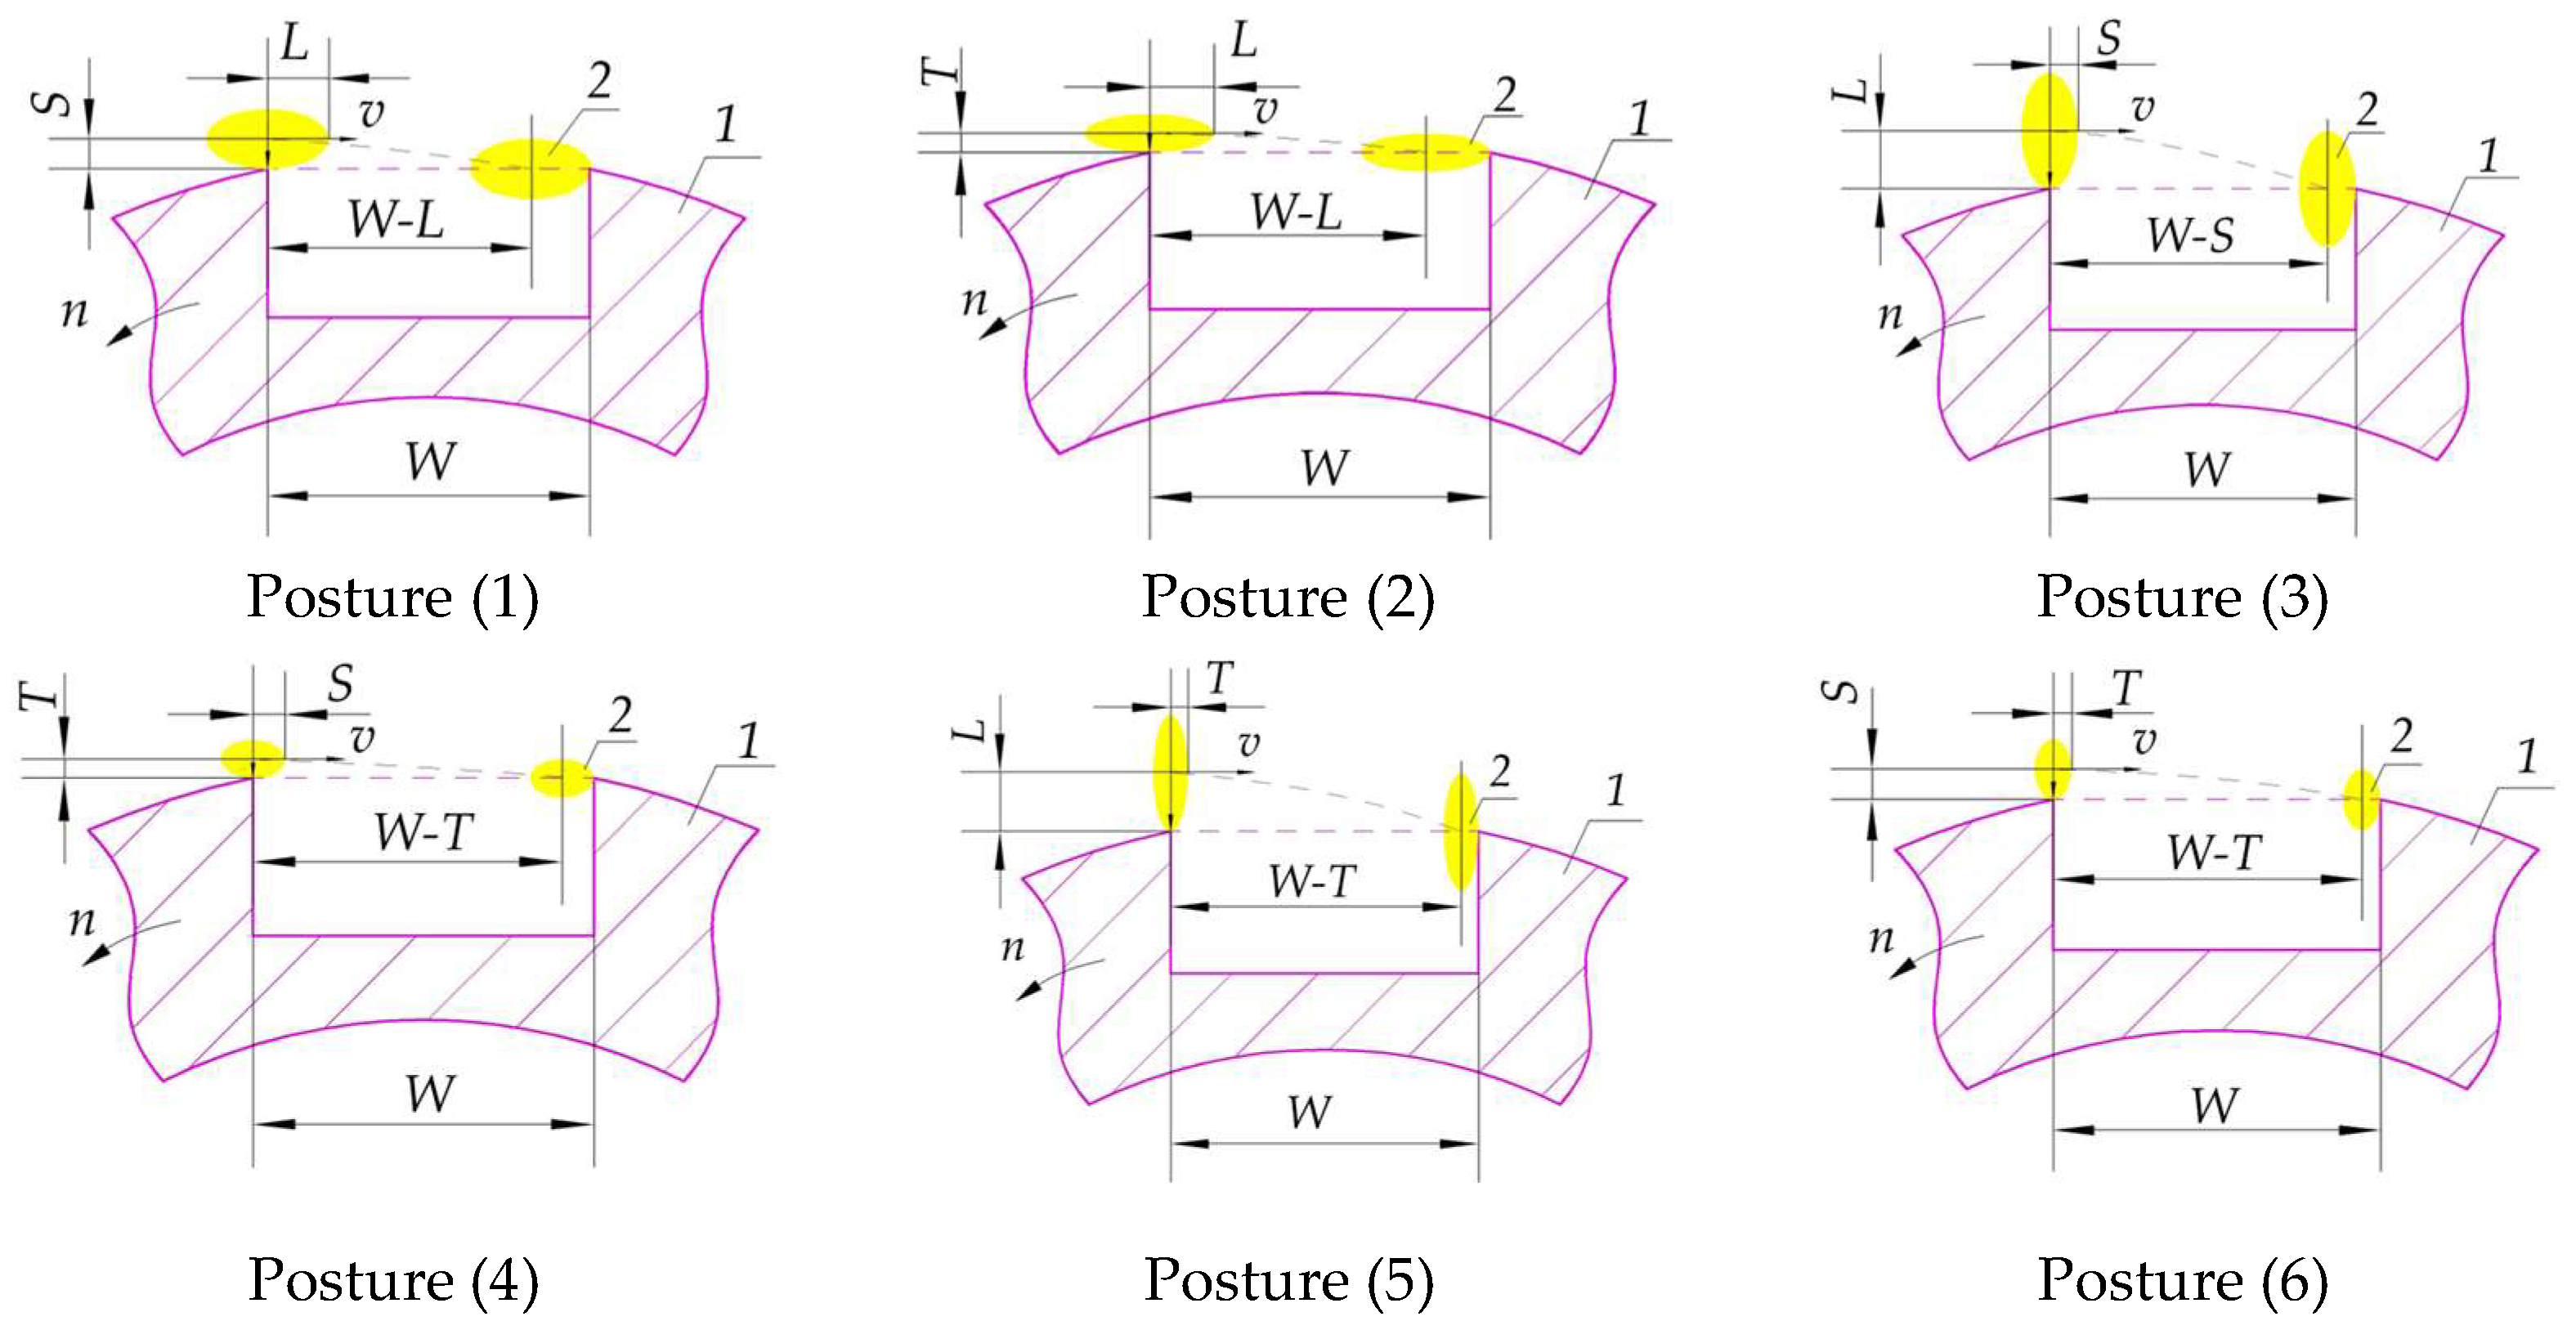
Figure 3.
Schematic diagram of corn seed horizontal filling hole posture. 1, Hole seed-metering wheel; 2, corn seed. L, S and T are the half-dimensions of the seed in the direction of length, width, and thickness, mm. Posture (1) indicates that the seed is filled into the hole horizontally taking L as the half section width and S as the half section height; Posture (2) indicates that the seed is filled into the hole horizontally taking L as the half section width and T as the half section height; Posture (3) indicates that the seed is filled into the hole horizontally taking S as the half section width and L as the half section height; Posture (4) indicates that the seed is filled into the hole horizontally taking S as the half section width and T as the half section height; Posture (5) indicates that the seed is filled into the hole horizontally taking T as the half section width and L as the half section height; Posture (6) indicates that the seed is filled into the hole horizontally taking T as the half section width and S as the half section height.
![Agriculture 12 02103 g003]()
Figure 4.
Schematic diagram of corn seed turned 90° filling hole posture. 1, Hole seed-metering wheel; 2, corn seed. Posture (1) indicates that the seed is filled into the hole by turned 90° taking S as the half section height; Posture (2) indicates that the seed is filled into the hole by turned 90° taking T as the half section height; Posture (3) indicates that the seed is filled into the hole by turned 90° taking L as the half section height.
Figure 5.
Three seeds in the hole. 1, Hole seed-metering wheel, 2, corn seed.
Figure 5.
Three seeds in the hole. 1, Hole seed-metering wheel, 2, corn seed.
Figure 6.
Three-dimensional model of the hole seed-metering wheel.
Figure 6.
Three-dimensional model of the hole seed-metering wheel.
Figure 7.
Distribution of corn seeds in seeder chamber.
Figure 7.
Distribution of corn seeds in seeder chamber.
Figure 8.
Schematic diagram of structure optimization of planter chamber. ω, angle between the connecting plate and horizontal direction (ACP); η, angle between the back plate and horizontal direction (ABP).
Figure 8.
Schematic diagram of structure optimization of planter chamber. ω, angle between the connecting plate and horizontal direction (ACP); η, angle between the back plate and horizontal direction (ABP).
Figure 9.
Large-, medium-, and small-grain solid corn seeds and seed discrete models.
Figure 9.
Large-, medium-, and small-grain solid corn seeds and seed discrete models.
Figure 10.
Three-dimensional simulation model of plot planter.
Figure 10.
Three-dimensional simulation model of plot planter.
Figure 11.
Experimental plot division.
Figure 11.
Experimental plot division.
Figure 12.
Sowing test in soil bin.
Figure 12.
Sowing test in soil bin.
Figure 13.
Effect of each index on sowing performance of small seeds. DH, hole depth.
Figure 13.
Effect of each index on sowing performance of small seeds. DH, hole depth.
Figure 14.
Effect of each index on sowing performance of medium seeds. DH, hole depth.
Figure 14.
Effect of each index on sowing performance of medium seeds. DH, hole depth.
Figure 15.
Effect of each index on sowing performance of large seeds. DH, hole depth.
Figure 15.
Effect of each index on sowing performance of large seeds. DH, hole depth.
Figure 16.
Effect of each index on filling performance. ABP, angle between the back plate and the horizontal line; SFR, seed filling rate; DSR, double seed rate.
Figure 16.
Effect of each index on filling performance. ABP, angle between the back plate and the horizontal line; SFR, seed filling rate; DSR, double seed rate.
Figure 17.
Results of speeding adaptability test. (a), Qualified seeding rate; (b), Double seeds rate; (c), Missing seeding rate; (d), Multiple seeding rate.
Figure 17.
Results of speeding adaptability test. (a), Qualified seeding rate; (b), Double seeds rate; (c), Missing seeding rate; (d), Multiple seeding rate.
Table 1.
Size parameters of corn seeds of different varieties.
Table 1.
Size parameters of corn seeds of different varieties.
| Index | Corn Varieties |
|---|
| 1 | 2 | 3 | 4 | 5 | 6 | 7 |
|---|
| Length (mm) | 10.90 | 10.58 | 12.96 | 11.16 | 10.34 | 12.55 | 11.24 |
| Width (mm) | 8.33 | 7.61 | 7.61 | 6.50 | 7.45 | 7.19 | 6.17 |
| Thickness (mm) | 6.17 | 6.00 | 4.13 | 4.55 | 5.55 | 4.51 | 3.64 |
| Index | Corn Varieties |
| 8 | 9 | 10 | 11 | 12 | 13 | 14 |
| Length (mm) | 13.54 | 9.40 | 12.27 | 10.22 | 9.69 | 7.80 | 10.38 |
| Width (mm) | 7.31 | 6.36 | 8.63 | 7.38 | 7.24 | 7.58 | 8.09 |
| Thickness (mm) | 4.21 | 4.81 | 4.84 | 5.14 | 5.30 | 6.33 | 6.51 |
Table 2.
Relative motion analysis of corn seed and the hole seed-metering wheel.
Table 2.
Relative motion analysis of corn seed and the hole seed-metering wheel.
| Filling Gesture | Schematic Diagram | Relative Motion Analysis | |
|---|
| Horizontal filling into the hole | ![Agriculture 12 02103 i001]() | The tangential direction of the hole seed-metering wheel: | |
| (2) |
| Axis direction of hole seed-metering wheel: | |
| (3) |
| Required diameter of seed filling into hole horizontally: | |
| (4) |
| Turn 90° filling into the hole | ![Agriculture 12 02103 i002]() | The tangential direction of the hole seed-metering wheel: | |
| (5) |
| Axis direction of hole seed-metering wheel: | |
| (6) |
| Required diameter of the seed filling into hole by turn 90°: | |
| (7) |
1: Hole seed-metering wheel, 2: corn seed
Where: W is the hole diameter, mm; A is half width of the corn seed section, mm; B is half height of the corn seed section, mm; r is the radius of the hole seed-metering wheel, mm; v is the relative velocity between corn seed and hole seed-metering wheel, m/s; g is the acceleration of gravity, m/s2; t is the time when seeds are successfully filled into the hole, s; n is the rotating speed of hole seed-metering wheel, r/min. |
Table 3.
Summary of the hole diameter range of different maize varieties.
Table 3.
Summary of the hole diameter range of different maize varieties.
| Index | Corn Varieties |
|---|
| 1 | 2 | 3 | 4 | 5 | 6 | 7 |
|---|
| Upper limit (mm) | 16.00 | 15.68 | 17.98 | 16.25 | 14.46 | 17.60 | 16.33 |
| Lower limit (mm) | 10.58 | 10.83 | 8.54 | 9.12 | 10.31 | 9.04 | 7.92 |
| Index | Corn Varieties |
| 8 | 9 | 10 | 11 | 12 | 13 | 14 |
| Upper limit (mm) | 18.52 | 14.50 | 17.33 | 15.32 | 14.79 | 12.82 | 15.48 |
| Lower limit (mm) | 8.66 | 9.47 | 12.87 | 9.83 | 10.00 | 11.21 | 11.41 |
Table 4.
Average value of size parameters of corn seeds after classification.
Table 4.
Average value of size parameters of corn seeds after classification.
| Index | Size Parameters of Corn Seeds |
|---|
| Length/mm | Width/mm | Thickness/mm |
|---|
| Large seed | 12.51 | 7.39 | 4.27 |
| Medium seed | 10.67 | 7.60 | 5.76 |
| Small seed | 9.51 | 7.14 | 5.40 |
Table 5.
Simulation parameter setting.
Table 5.
Simulation parameter setting.
| Item | Variable | Value |
|---|
| Corn seeds | Poisson’s ratio | 0.4 |
| Shear modules/MPa | 1.37 × 10⁸ |
| Solid density/(kg·m−3) | 1.197 |
| Seed box and hole seed-metering wheel | Poisson’s ratio | 0.35 |
| Shear modules/MPa | 1.3 × 10⁹ |
| Solid density/(kg·m−3) | 1.20 |
| Seeds to seeds | Coefficient of restitution | 0.182 |
| Coefficient of static friction | 0.0338 |
| Coefficient of rolling friction | 0.0021 |
| Seeds to seed box and hole seed-metering wheel | Coefficient of restitution | 0.709 |
| Coefficient of static friction | 0.459 |
| Coefficient of rolling friction | 0.0931 |
Table 6.
Factor level table of orthogonal test.
Table 6.
Factor level table of orthogonal test.
| Levels | Diameter of Hole A/mm | Depth of Hole B/mm | Seeds |
|---|
| 1 | 13 | 6 | Large seed |
| 2 | 15 | 8 | Medium seed |
| 3 | 17 | 10 | Small seed |
| 4 | 19 | 12 | |
Table 7.
Factor level table of orthogonal test.
Table 7.
Factor level table of orthogonal test.
| Levels | ACP (°) | ABP (°) |
|---|
| 1 | 35° | 40° |
| 2 | 45° | 55° |
| 3 | 55° | 70° |
Table 8.
Test factors and levels.
Table 8.
Test factors and levels.
| Levels | RSP (r/min) | DMH-DH (mm) | ACP (°) | ABP (°) |
|---|
| 1 | 9.6 | Small seed
13–8 | 45° | 70° |
| 2 | 12.8 | Medium seed
15–10 | | |
| 3 | 16.0 | Large seed
17–8 | | |
| 4 | 19.2 | | | |
Table 9.
Range analysis of small corn seeds.
Table 9.
Range analysis of small corn seeds.
| Evaluation Indices | Factors |
|---|
| A | B |
|---|
| Qualified seeding rate/% | k1 | 91.14 | 89.28 |
| k2 | 85.00 | 90.00 |
| k3 | 72.14 | 72.85 |
| k4 | 62.44 | 59.58 |
| Rj | 28.7 | 30.42 |
| Missing seeding rate/% | k1 | 2.86 | 5.00 |
| k2 | 1.43 | 0.00 |
| k3 | 0.72 | 0.00 |
| k4 | 0.00 | 0.00 |
| Rj | 2.86 | 5.00 |
| Multiple seeding rate/% | k1 | 5.00 | 5.72 |
| k2 | 13.57 | 10.00 |
| k3 | 27.85 | 27.85 |
| k4 | 37.55 | 40.42 |
| Rj | 32.55 | 34.7 |
| Double seeds rate/% | k1 | 59.28 | 43.57 |
| k2 | 55.71 | 65.71 |
| k3 | 33.57 | 35.71 |
| k4 | 23.35 | 26.93 |
| Rj | 35.93 | 38.78 |
Table 10.
Variance analysis results of small seeds.
Table 10.
Variance analysis results of small seeds.
| Evaluation Indices | Source | Sum of Squares | df | Mean Square | F-Value | p-Value |
|---|
| Qualified seeding rate/% | A | 2101.04 | 3 | 700.35 | 4.379 | 0.037 * |
| B | 2547.19 | 3 | 849.07 | 5.309 | 0.022 * |
| Error | 1439.45 | 9 | 159.94 | | |
| Missing seeding rate/% | A | 17.857 | 3 | 5.952 | 1.00 | 0.436 |
| B | 75.00 | 3 | 25.00 | 4.20 | 0.041 * |
| Error | 53.571 | 9 | 5.952 | | |
| Multiple seeding rate/% | A | 2528.9 | 3 | 842.9 | 6.414 | 0.013 * |
| B | 3113.8 | 3 | 1037.9 | 7.898 | 0.007 ** |
| Error | 1182.7 | 9 | 131.4 | | |
| Double seeds rate/% | A | 3606.8 | 3 | 1202.3 | 6.47 | 0.013 * |
| B | 3311.4 | 3 | 1103.8 | 5.94 | 0.016 * |
| Error | 1672.7 | 9 | 185.8 | | |
Table 11.
Range analysis of each index of medium seeds.
Table 11.
Range analysis of each index of medium seeds.
| Evaluation Indices | Factors |
|---|
| A | B |
|---|
| Qualified seeding rate/% | k1 | 89.58 | 88.54 |
| k2 | 94.79 | 91.14 |
| k3 | 88.57 | 92.19 |
| k4 | 85.94 | 86.98 |
| Rj | 8.85 | 5.21 |
| Missing seeding rate/% | k1 | 8.33 | 8.32 |
| k2 | 3.125 | 4.69 |
| k3 | 3.125 | 1.56 |
| k4 | 0.52 | 0.52 |
| Rj | 7.81 | 7.80 |
| Multiple seeding rate/% | k1 | 2.09 | 3.13 |
| k2 | 2.08 | 4.17 |
| k3 | 8.33 | 6.25 |
| k4 | 13.54 | 12.50 |
| Rj | 11.46 | 9.37 |
| Double seeds rate/% | k1 | 33.33 | 34.38 |
| k2 | 65.63 | 54.17 |
| k3 | 58.85 | 65.62 |
| k4 | 44.27 | 47.92 |
| Rj | 32.3 | 31.24 |
Table 12.
Variance analysis results of medium seeds.
Table 12.
Variance analysis results of medium seeds.
| Evaluation Indices | Source | Sum of Squares | df | Mean Square | F-Value | p-Value |
|---|
| Qualified seeding rate/% | A | 165.77 | 3 | 55.26 | 6.02 | 0.016 * |
| B | 68.07 | 3 | 22.70 | 2.47 | 0.128 |
| Error | 82.61 | 9 | 9.18 | | |
| Missing seeding rate/% | A | 128.84 | 3 | 42.95 | 10.39 | 0.003 ** |
| B | 148.30 | 3 | 49.43 | 11.96 | 0.002 ** |
| Error | 37.19 | 9 | 4.13 | | |
| Multiple seeding rate/% | A | 367.79 | 3 | 677.95 | 59.89 | 0.00 *** |
| B | 211.46 | 3 | 122.59 | 34.43 | 0.00 *** |
| Error | 18.42 | 9 | 70.49 | | |
| Double seeds rate/% | A | 2525.30 | 3 | 842.77 | 2.87 | 0.096 |
| B | 2034.98 | 3 | 678.32 | 2.31 | 0.145 |
| Error | 2645.80 | 9 | 293.98 | | |
Table 13.
Range analysis of each index of large seeds.
Table 13.
Range analysis of each index of large seeds.
| Evaluation Indices | Factors |
|---|
| A | B |
|---|
| Qualified seeding rate/% | k1 | 84.13 | 85.83 |
| k2 | 89.73 | 90.26 |
| k3 | 92.53 | 89.74 |
| k4 | 87.58 | 88.14 |
| Rj | 8.4 | 4.43 |
| Missing seeding rate/% | k1 | 14.91 | 11.83 |
| k2 | 8.27 | 6.81 |
| k3 | 1.96 | 5.01 |
| k4 | 0.91 | 2.41 |
| Rj | 14.0 | 9.42 |
| Multiple seeding rate/% | k1 | 0.96 | 2.34 |
| k2 | 2.01 | 2.93 |
| k3 | 5.51 | 5.26 |
| k4 | 11.52 | 9.46 |
| Rj | 10.56 | 7.12 |
| Double seed rate/% | k1 | 35.40 | 40.28 |
| k2 | 54.58 | 58.62 |
| k3 | 71.22 | 56.81 |
| k4 | 51.71 | 57.20 |
| Rj | 35.82 | 16.92 |
Table 14.
Variance analysis results of large seeds.
Table 14.
Variance analysis results of large seeds.
| Evaluation Indices | Source | Sum of Squares | df | Mean Square | F-Value | p-Value |
|---|
| Qualified seeding rate/% | A | 150.69 | 3 | 50.23 | 3.097 | 0.082 |
| B | 47.57 | 3 | 15.86 | 0.978 | 0.445 |
| Error | 145.97 | 9 | 16.22 | | |
| Missing seeding rate/% | A | 502.68 | 3 | 167.56 | 25.573 | 0.000 *** |
| B | 189.92 | 3 | 63.31 | 9.67 | 0.004 ** |
| Error | 58.97 | 9 | 6.55 | | |
| Multiple seeding rate/% | A | 271.79 | 3 | 90.60 | 27.67 | 0.000 *** |
| B | 125.32 | 3 | 41.78 | 12.76 | 0.001 *** |
| Error | 29.48 | 9 | 3.28 | | |
| Double seeds rate/% | A | 2583.03 | 3 | 861.01 | 3.026 | 0.086 |
| B | 901.55 | 3 | 300.52 | 1.056 | 0.415 |
| Error | 2560.81 | 9 | 284.53 | | |
Table 15.
Results of plant spacing.
Table 15.
Results of plant spacing.
| | Mean Plant Spacing/mm | Variation Coefficient/% |
|---|
| Small seed | 24.80 | 3.37 |
| Medium seed | 24.89 | 3.44 |
| Large seed | 24.97 | 3.79 |
Table 16.
Results of plant spacing.
Table 16.
Results of plant spacing.
| Evaluation Indices | Small Seed | Medium Seed | Large Seed |
|---|
| Qualified seeding rate/% | 98.22 | 97.96 | 98.25 |
| Missing seeding rate/% | 0.00 | 0.00 | 0.00 |
| Multiple seeding rate/% | 1.78 | 2.04 | 1.75 |
| Double seeds rate/% | 88.00 | 88.33 | 88.21 |


