Next Article in Journal
Aqueous Seaweed Extract Alleviates Salinity-Induced Toxicities in Rice Plants (Oryza sativa L.) by Modulating Their Physiology and Biochemistry
Next Article in Special Issue
Using Deficit Irrigation Strategies and Organic Mulches for Improving Yield and Water Productivity of Mango under Dry Environment Conditions
Previous Article in Journal
DFCANet: A Novel Lightweight Convolutional Neural Network Model for Corn Disease Identification
 
 
Correction published on 5 March 2024, see Agriculture 2024, 14(3), 417.
Article

Effect of Surface and Subsurface Drip Irrigation with Treated Wastewater on Soil and Water Productivity of Okra (Abemoschus esculentus) Crop in Semi-Arid Region of Tunisia

1
High Agronomic Institute of Chott Mariem (ISA CM), University of Sousse, Sousse 4000, Tunisia
2
National Research Institute for Rural Engineering, Water and Forestry (INRGREF), University of Carthage, BPN 10, Ariana 2080, Tunisia
3
Water Research and Technology Center, University of Carthage, Soliman 8020, Tunisia
*
Author to whom correspondence should be addressed.
Agriculture 2022, 12(12), 2048; https://doi.org/10.3390/agriculture12122048
Submission received: 21 September 2022 / Revised: 26 October 2022 / Accepted: 7 November 2022 / Published: 29 November 2022 / Corrected: 5 March 2024
(This article belongs to the Special Issue New Irrigation Strategies to Improve Crop Water Efficiency)

Abstract

:
Under semi-arid conditions, irrigated agriculture faces hard competition for water. It is against this backdrop that appropriate management of irrigation techniques and water resources becomes a major concern. This study investigated the effect of surface (SDI) and subsurface drip irrigation (SSDI) with domestic treated wastewater (TWW) and fresh water (FW) on soil water dynamics, salinity, yield, and mineral nutrition of okra. The experimental design was set-up based on two adjacent plots according to the water quality: Fresh Water (FW) T1 and domestic Treated Wastewater (TWW) T2. Results showed that measured soil water contents (SWCs), under TWW treatment (T2), were greater than their corresponding measurements under FW (T1), and in particular at 35 cm depth. Meanwhile, for both water qualities, soil Electrical Conductivity (EC) registered at 5 cm depth was higher than those measured at 35 cm, with values ranging from 0.14 to 0.36 mS·cm−1 and from 0.20 to 0.47 mS·cm−m for T1 and T2, respectively. Regarding crop yield, a statistically significant increase (p = 0.05) in okra fresh yield was observed when TWW was used. Fresh yield in SDI was 2.55 t·ha−1 and 3.9 t·ha−1 in T1 and T2, respectively. Nevertheless, results indicated that lateral depth did not significantly affect okra fresh yield. Moreover, a significant higher irrigation water productivity (WPirrig) with TWW (1.08 ± 0.26 and 1.23 ± 0.18 kg m−1) was observed, which was nearly double those obtained with FW (0.72 ± 0.33 to 0.78 ± 0.18 kg m−1). Appropriate use of SSDI with TWW stands as an irrigation management technique to improve yield and irrigation water productivity of okra crops.

1. Introduction

Water scarcity is one of the key constraints for agricultural activity in arid and semi-arid regions, as in the case of Tunisia. High competition for water due to population growth and the development of the socio-economic sectors, combined with climate changes and marked by the increase in temperatures and the irregularity of rainfall, have led countries in these regions to turn towards the exploitation of lower-quality irrigation resources. Among these resources, treated wastewater (TWW) is used by farmers and is perceived as a cheap alternative that could reduce pressure on groundwater [1,2,3] under some conditions related to the nature of the crop used and the quality of the water processed. According to [4], the reuse of TWW in irrigation has experienced significant success worldwide over the past 30 years. In Tunisia, the use of TWW in irrigation is an old practice that began in 1965 to safeguard the citrus-growing perimeter of Charguia after the salinization of groundwater. [5,6]. Then, with the creation of the National Sanitation Office (ONAS) in 1974, the number of wastewater treatment plants and the volume of treated water have continually increased. Since 1996 in Tunisia, the reuse of TWW has been an integral part of the strategy for mobilizing the country’s water resources. According to the latest ONAS publications, there are currently 122 steps, including 61 steps directly concerned with water reuse in the agriculture sector. The total volume of TWW produced in 2019 was 284 Mm3, of which 62 Mm3 were reused to irrigate 2734 ha among the 8435 ha actually devoted to this purpose [7]. Further efforts have been made to improve the quality and availability of wastewater, as well as to propose other irrigation techniques and practices, promoting its reuse in irrigation as mandatory. According to [1], it is necessary to integrate appropriate irrigation management and strategies to resolve certain problems linked to the reuse of TWW in agriculture. Drip irrigation remains the safest technic for using TWW in crop production [8,9], as it allows the application of irrigation water directly into the root zone. Similarly, [10,11,12] micro-irrigation has been considered as a solution to conserve water and protect users.
Surface drip irrigation (SDI) systems have become increasingly popular and are considered a solution to conserve water [10,11,13]. However, a few studies [14,15,16] have focused on subsurface drip irrigation (SSDI) using TWWs. It has been demonstrated to be an appropriate tool to improve yields and water use efficiency in comparison with other irrigation systems [17,18]. In addition, it limits weed germination and growth [16]. According to [19,20], these latter advantages are attributed to the better soil moisture distribution and the limiting of salt accumulation in the root zone [17]. Some operational parameters, such as the emitter discharge rate and spacing, the duration and frequency of irrigation, and the placement of the drip laterals [13,21] are very important factors that significantly influence the soil moisture and salt distribution in the soil. In this context, [18] reported that selecting drip tape installation depths for various crops is the most critical decision. Hence, appropriate depths of the emitters and deficit irrigation are important in terms of modeling wetted areas and enhancing water use efficiency [22]. In addition, the quality of irrigation water under drip irrigation has a considerable effect on the distribution of water content, salinity, and root development [23].
Moreover, the choice of irrigation systems and the reuse of non-conventional water sources can be made more efficient with an appropriate choice of plants to grow. Okra (Abelmoschus esculentus L.) is classified as a moderately salt-tolerant plant [24]. In fact, okra is widely cultivated in several regions around the world. It is characterized by a wealth of nutrients beneficial to human health, including potassium, carbohydrates, dietary fibers, unsaturated fatty acids, calcium, and vitamins [25,26]. Limited studies have been devoted to assess the performance of SSDI using treated wastewater on SWCs and salts distribution in loamy-sand soil. Therefore, the aims of this study were: (1) to assess the combined effect of water quality and lateral depth on okra production, as well as the sodium content (Na+) and potassium content (K+) in different parts of the plant; and (2) to evaluate the effect of treated wastewater on soil water content (SWC) and soil salinity in the root zone, between 5 and 35 cm depth, and particularly at 15 cm lateral depth.

2. Materials and Methods

2.1. Site Description and Experimental Setup

Field experiments were carried out in 2018, at the agricultural experimental unit of the National Institute for Research in Rural Engineering, Water and Forestery (INRGREF) of Oued Souhil, Nabeul, Tunisia (long. 32°37′3′′ N; lat.10°42′22′′ E, altitude 25 m a.s.l.). The area is characterized by a Mediterranean semi-arid climate with a mild winter. The average annual precipitation is about 440 mm and the reference evapotranspiration (ET0), computed using the FAO-56 PM method, is around 1350 mm.
Some physical and chemical properties of the experimental field soil are summarized in Table 1. According to USDA classification, the soil texture is loamy sand. Mean bulk density is 1.47 g·cm−3. Mean water content at field capacity and permanent wilting point are equal to 0.20 m3·m−3 and 0.09 m3·m−3, respectively. The soil is moderately alkaline with a pH value close to 8. The Soil ECs values range from 1.46 to 1.12 dS·m−1. ECs was higher in the top soil layer (0–10 cm) and below 50 cm depth. The soil content of Mn, Ni, Zn, Fe, and Pb in experimental soil was below European Union Standards, 2000.
The okra crop (Abelmoschus esculentus L.) was cultivated on 13 May 2018, at a density of 35 kg·ha−1. Plants were spaced at 30 cm along the rows and 95 cm between the rows. Experimental soil was periodically tilled to control weeds. To ensure optimal growth of the okra, a foliar fertilizer, floriatal N30, was applied at the beginning of the development stage (6–7 leaves) at a rate of 2 L·h−1. To establish the potential performance of the crop, two treatments with pesticides were applied. The picking of okra pods started at 55 DAS and three pickings were made per week. The experimental field was divided into two 11-m long and 5-m large plots. Two adjacent experimental plots were defined according to water quality: Fresh Water (FW) T1 and domestic Treated Wastewater (TWW) T2. The first plot (T1) was irrigated using fresh water (FW) pumped from a deep well located adjacent to the INRGREF experimental unit. The second plot (T2) was irrigated with Treated Wastewater (TWW) supplied by the Nabeul wastewater treatment plant “SE4”, located approximately 6 km from the experimental site. The TWW was mainly domestic and treated with up to a secondary biological treatment. At the INRGREF experimental unit, TWW was stored in a geo-membrane basin with a capacity of 500 m3 to undergo additional treatment (decantation and filtration) before use, to avoid dripper clogging.
According to the drip line’s depth (0, 5, 15, and 25 cm), the main plots for each water quality, T1 and T2, were divided into four individual sub-plots (Figure 1), each designated to one depth. In all, eight treatments were used: T1-0, T1-5, T1-15, T1-25 and T2-0, T2-5, T2-15, T2-25 for FW and TWW, respectively. Each plant row was equipped with a drip line with one emitter per plant and were spaced 35 cm apart. For T2, drippers were characterized by a flow rate equal to 3 L h−1. However, for T1, dripper discharge was equal to 1.5 L h−1. A micro-valve was installed on each lateral to control water supply.
Daily meteorological data relative to minimum and maximum air temperature, relative humidity, wind speed, and solar radiation were collected from a local weather station in order to estimate daily reference evapotranspiration using the standard FAO-56 Penman-Monteith model. Crop evapotranspiration was determined using the FAO-crop coefficient approach, which consists of multiplying ET0 by a pre-determined crop-specific coefficient Kc [27].
E T C m m =   ET 0 ×   Kc
Kc values of okra crop are those proposed by [28,29] (Table 2).
For both treatments, irrigation water requirements (I) were determined at weekly time steps using the following equation:
I   m m =   ET C R e
where ETc: crop evapotranspiration (mm); Re: Effective precipitation (mm). At sowing, initial soil water content was equal to zero.
In order to avoid deep percolation, irrigation depths were split equally into three applications from the beginning of the crop cycle (13 May) until harvesting (8 September), for a total of 42 irrigation events. This irrigation scheduling allowed for the replenishment of the soil to field capacity.

2.2. Field Measurements

For each water quality (FW and TWW), samples were taken during okra irrigation and collected in polyethylene bottles. The pH and electrical conductivity were measured using a conductivity meter. Dry residue of water samples was assessed by oven drying at 105 °C until at constant weight. The dry residue (g·L−1) was measured as residue weight resulting from the evaporation of one liter of water. The sodium adsorption ratio (SAR) determines the level of crop damage. SAR was calculated considering the square root of the sodium (Na+) to calcium plus magnesium (Mg2+ Ca2+) divided by two, as cited by [30]. Samples were divided into two parts. The first consisted of mineral analysis (sodium (Na+), calcium (Ca2+), magnesium (Mg2+), chloride (Cl), bicarbonates (HCO3), sulfate (SO42−); kept in the dark at less than 4 °C. The second part consisted of adding some drops of nitric acid to obtain the determination of the element trace metallic, such as cadmium (Cd), cobalt (Co), chromium (Cr), copper (Cu), nickel (Ni), iron (Fe), Zinc (Zn), and lead (Pb). For TWW, additional analysis was performed for ammonia nitrogen (N-NH4+), nitrate nitrogen (N-NO3−), and phosphorus (P).
The dynamic of soil water content (SWC) and soil electrical conductivity (EC) were monitored using capacitive 5TE sensors (METRE Group, Inc., Pullman, WA, USA) after a preliminary calibration. SWC measurements were performed at daily time steps, starting from 24 July, from the T1-15 and T2-15 sub-plots. In each sub-plot, two sensors were installed vertically at 5 and 35 cm depth from the soil surface.
For each sub-plot, a total of 12 Okra plants were labeled in order to assess the total fruit yield per plant. Okra yield was measured after every harvest using an electric weighing machine. At final harvest, the labeled plants were separated into roots, shoots, and fruits, and washed with de-ionized water. These different sections were placed in a forced-air circulation oven and dried at 70 °C to a constant weight. After drying, samples were ground and then subjected to acid digestion using a mixture of acids (HClO4, HNO3). Then, exchangeable Na+ and K+ were analyzed by means of flame photometry (PFP7/C Research flame photometer, Jenway, Stone, UK). Total soil heavy metals were extracted by HF-HClO4 mixture, and were analyzed by flame atomic absorption spectrophotometer (PFP7/C Research flame photometer, Jenway, Stone, UK)
Irrigation water productivity ( W P i r r i g )   is determined as the ratio between total harvestable fresh yield (Y) and the total irrigation water (I) supplied from planting to harvest [31].
W P i r r i g Kg .   m 3 = Y I
where Y: total harvestable fresh yield (Kg ha−1); I: total irrigation water (m3·ha−1).

2.3. Statistical Analysis

Data related to Na+, K+ content in roots, shoots, and fruits, yield and WPirrig were subjected to two-way ANOVA (irrigation water quality, lateral depths) using IBM SPSS.16 software. Duncan’s Multiple Range Test was used for comparing means estimated at (p = 0.05).

3. Results and Discussion

3.1. Irrigation Water Quality Assessment

The physicochemical quality of TWW and FW used in this study are reported in Table 3. For both water qualities, pH means were classified as slightly basic with values equal to 7.25 and 7.4 for TWW and FW, respectively. These values fell within the range of Tunisian Standards NT 106.03 (6.5–6.8). The EC value for TWW (3.35 mS·cm−1) was higher than that recorded for FW quality (2.77 mS·cm−1). The EC value relative to TWW was considered slightly higher than the upper limit set for irrigation use (3 mS·cm−1). The EC indicated a high and a very high salinization risk for TWW and FW; while the SAR indicated a low sodicity risk. According to the classification by [32], this result indicated that both TWW and FW fell in the C4-S1 category and were suitable for irrigation in almost all soil and crop types. Dry residue values in TWW (2.17 g·L−1) were slightly higher than those found in FW (1.94 g·L−1). Based on water quality classification relative to its potential for drip emitter clogging [33], FW and TWW presented moderate hazard ratings. Moreover, chloride (Cl) and sodium (Na+) ion contents in TWW were relatively higher than those measured in FW. Concerning metallic trace elements, the values were below Tunisian standards for agricultural use.

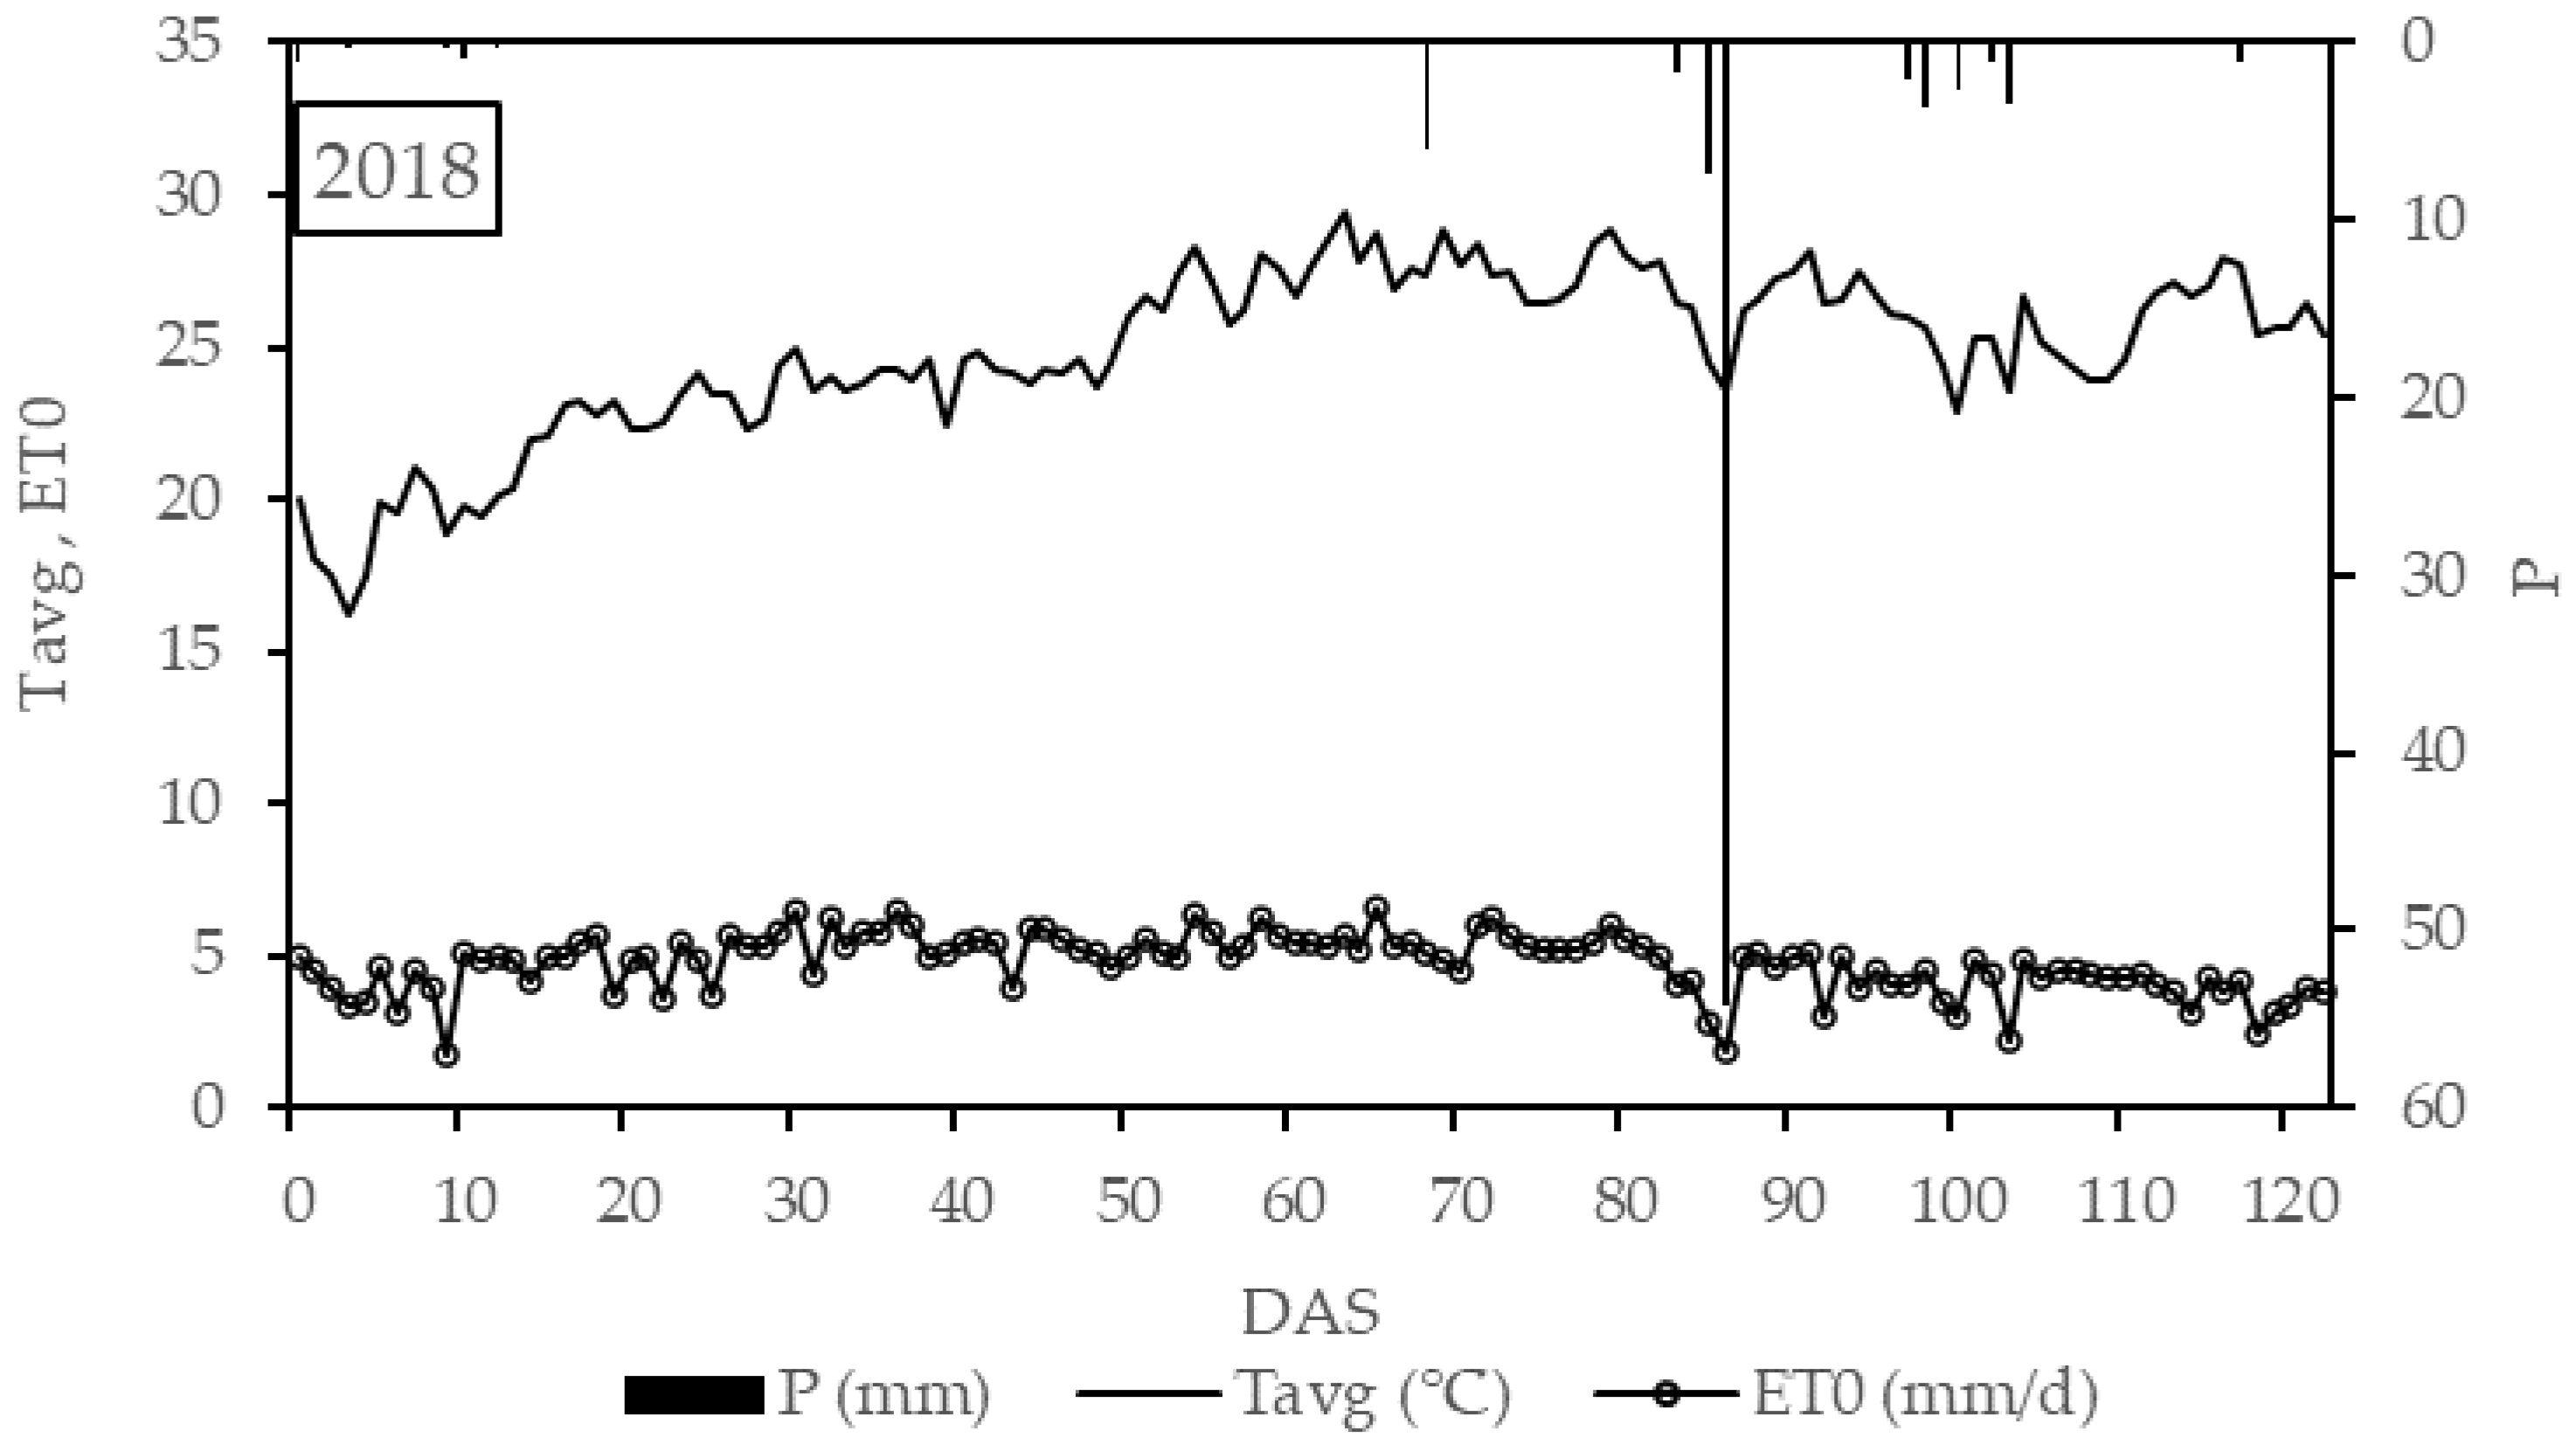
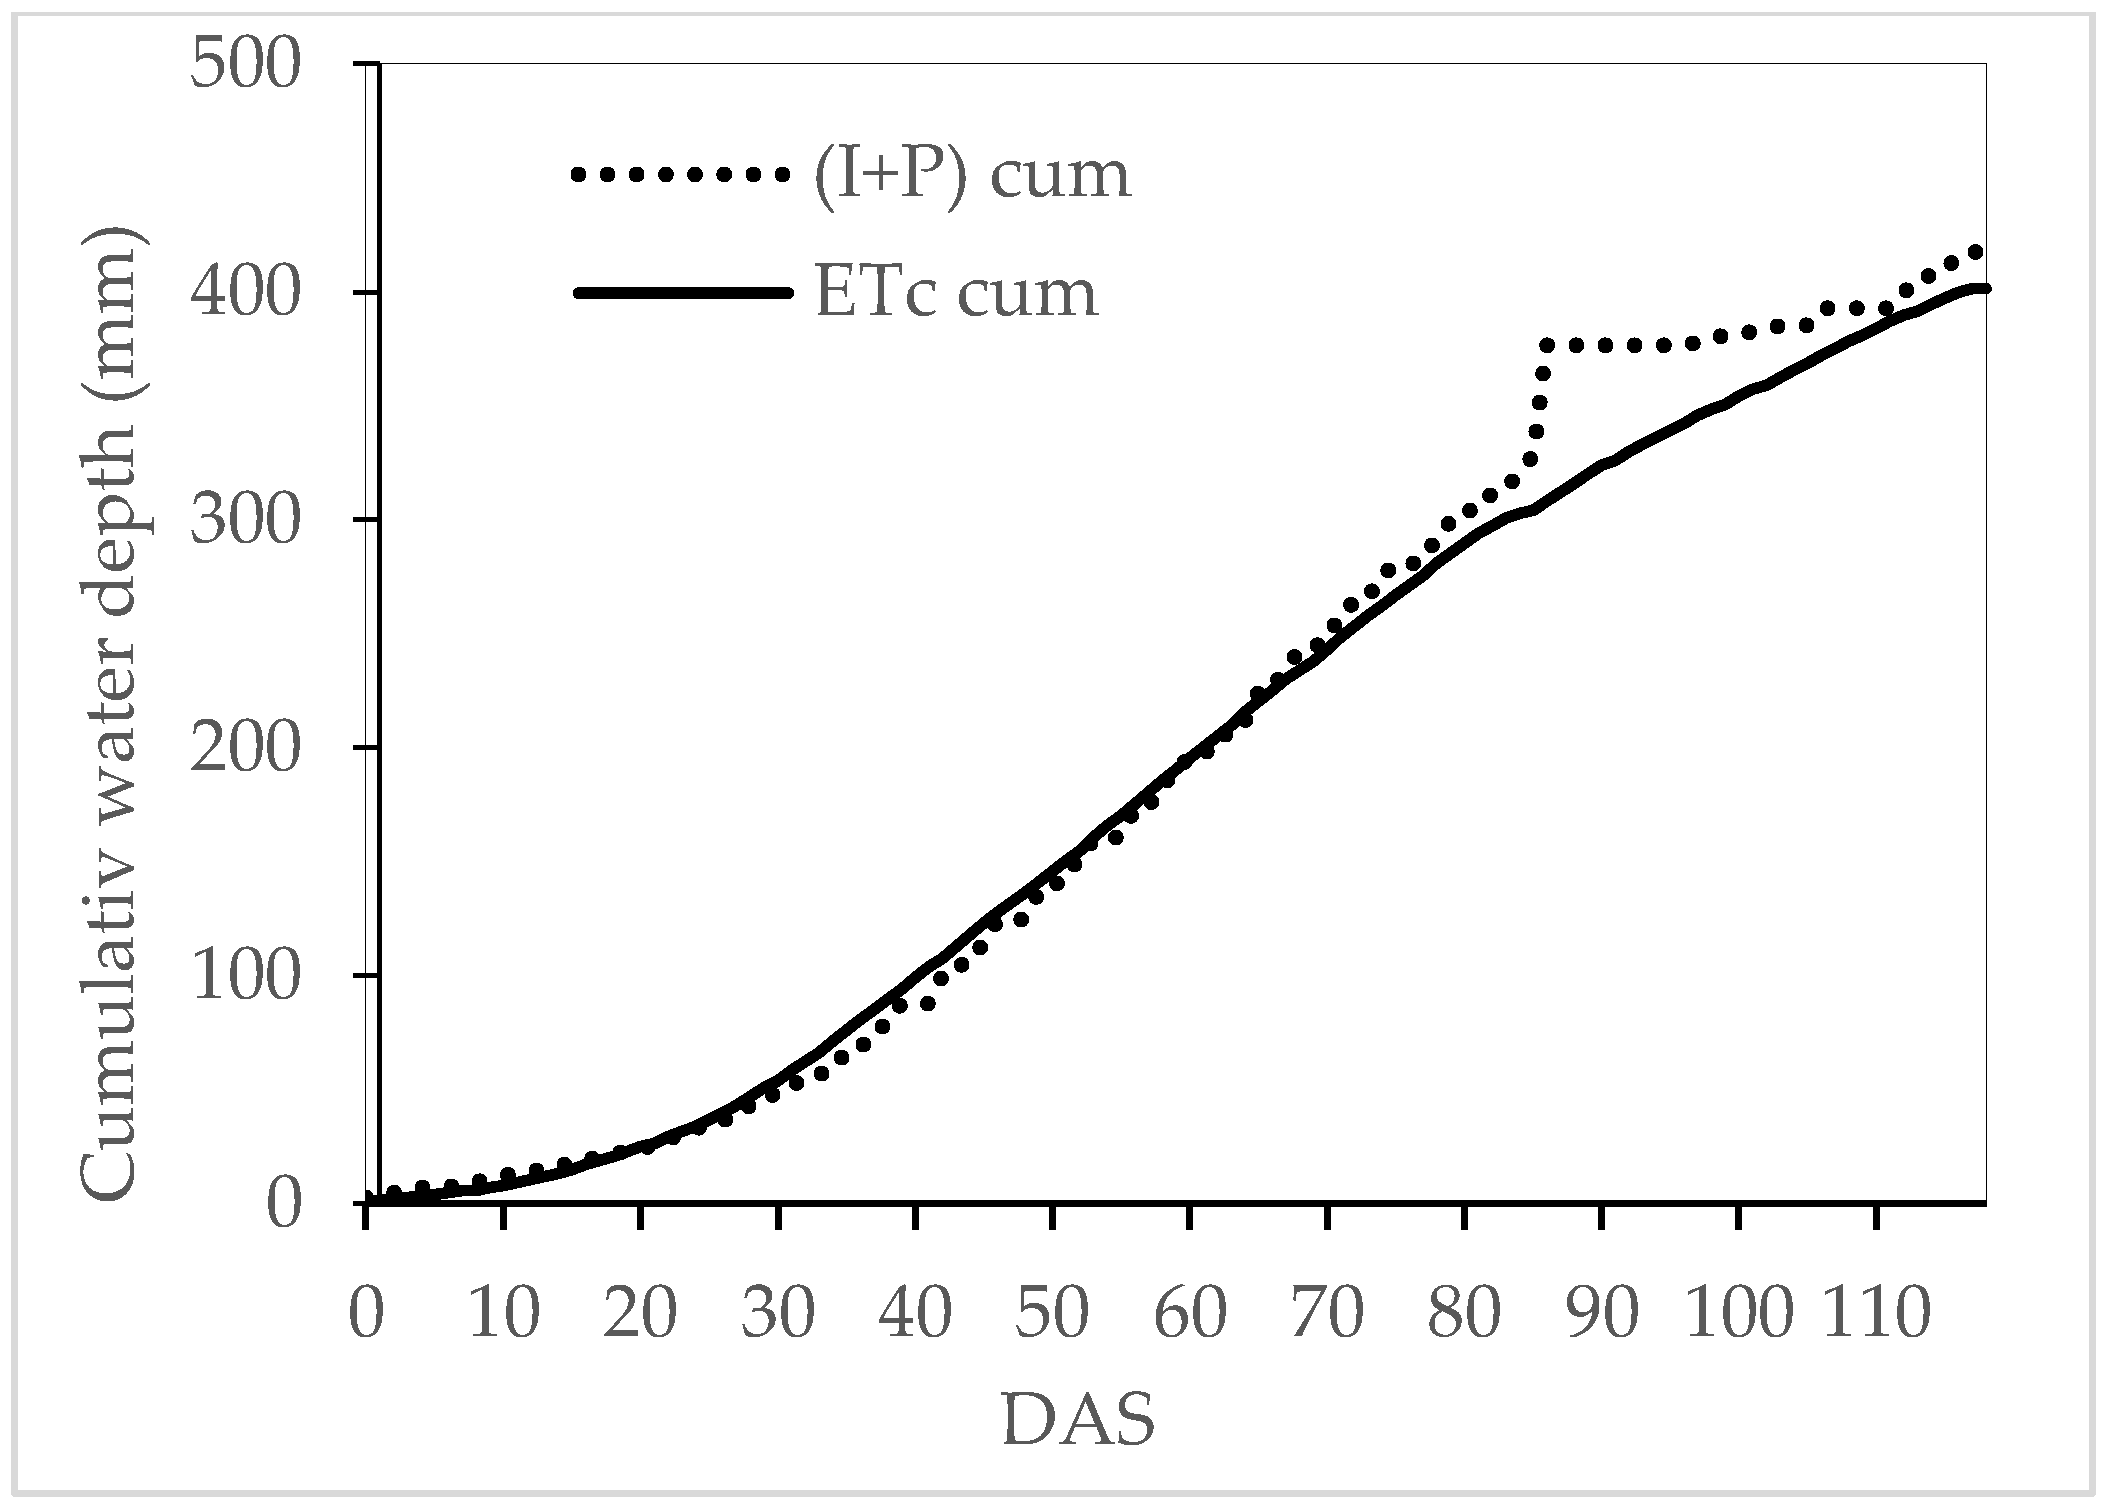
3.2. Agro-Meteorological Characterization of the Study Area

Patterns of daily average temperature, reference evapotranspiration (ET0), and precipitation (P) for the entire growing period are shown in Figure 2. As can be seen, Tavg and ET0 follow similar trends over the growing season. Daily Tavg increases from approximately 18 °C at the beginning of the growth season to 29.5 °C in mid-July (63 DAS). Then, Tavg values present a general tendency to decrease. Regarding precipitation, limited events occur during the entire crop season, with a total amount equal to 87.6 mm.
The total irrigation amount applied during the crop growth cycle and total crop water requirements were equal to 365.4 mm and 401.4 mm, respectively (Table 4). Based on the daily evolution of cumulative okra crop evapotranspiration ETc and amounts of water supply (I + P) (Figure 3), it can be concluded that okra plants were grown under optimum water conditions from sowing till harvest. Starting from 86 DAS, the total amount of supplied water (I + P) largely exceeded ETc as a result of the particular heavy precipitation event that occurred.

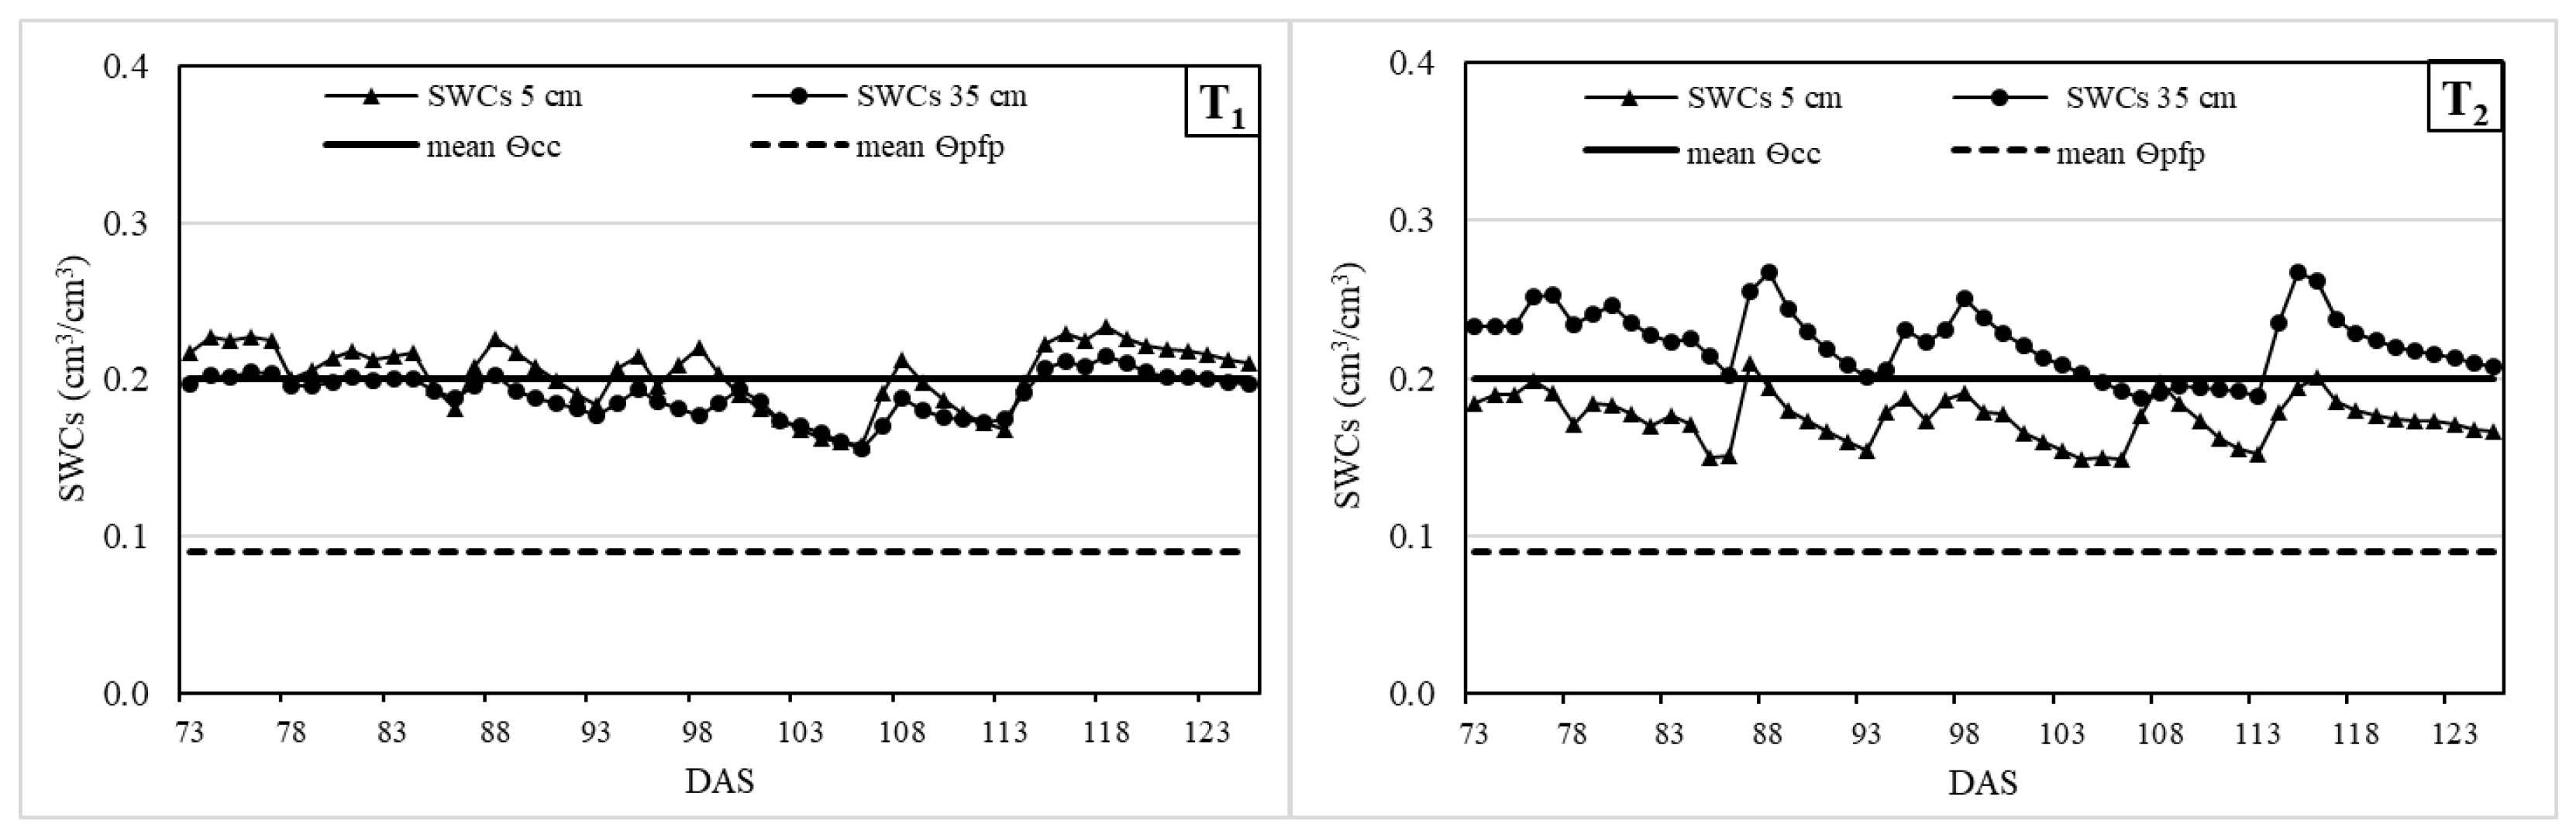
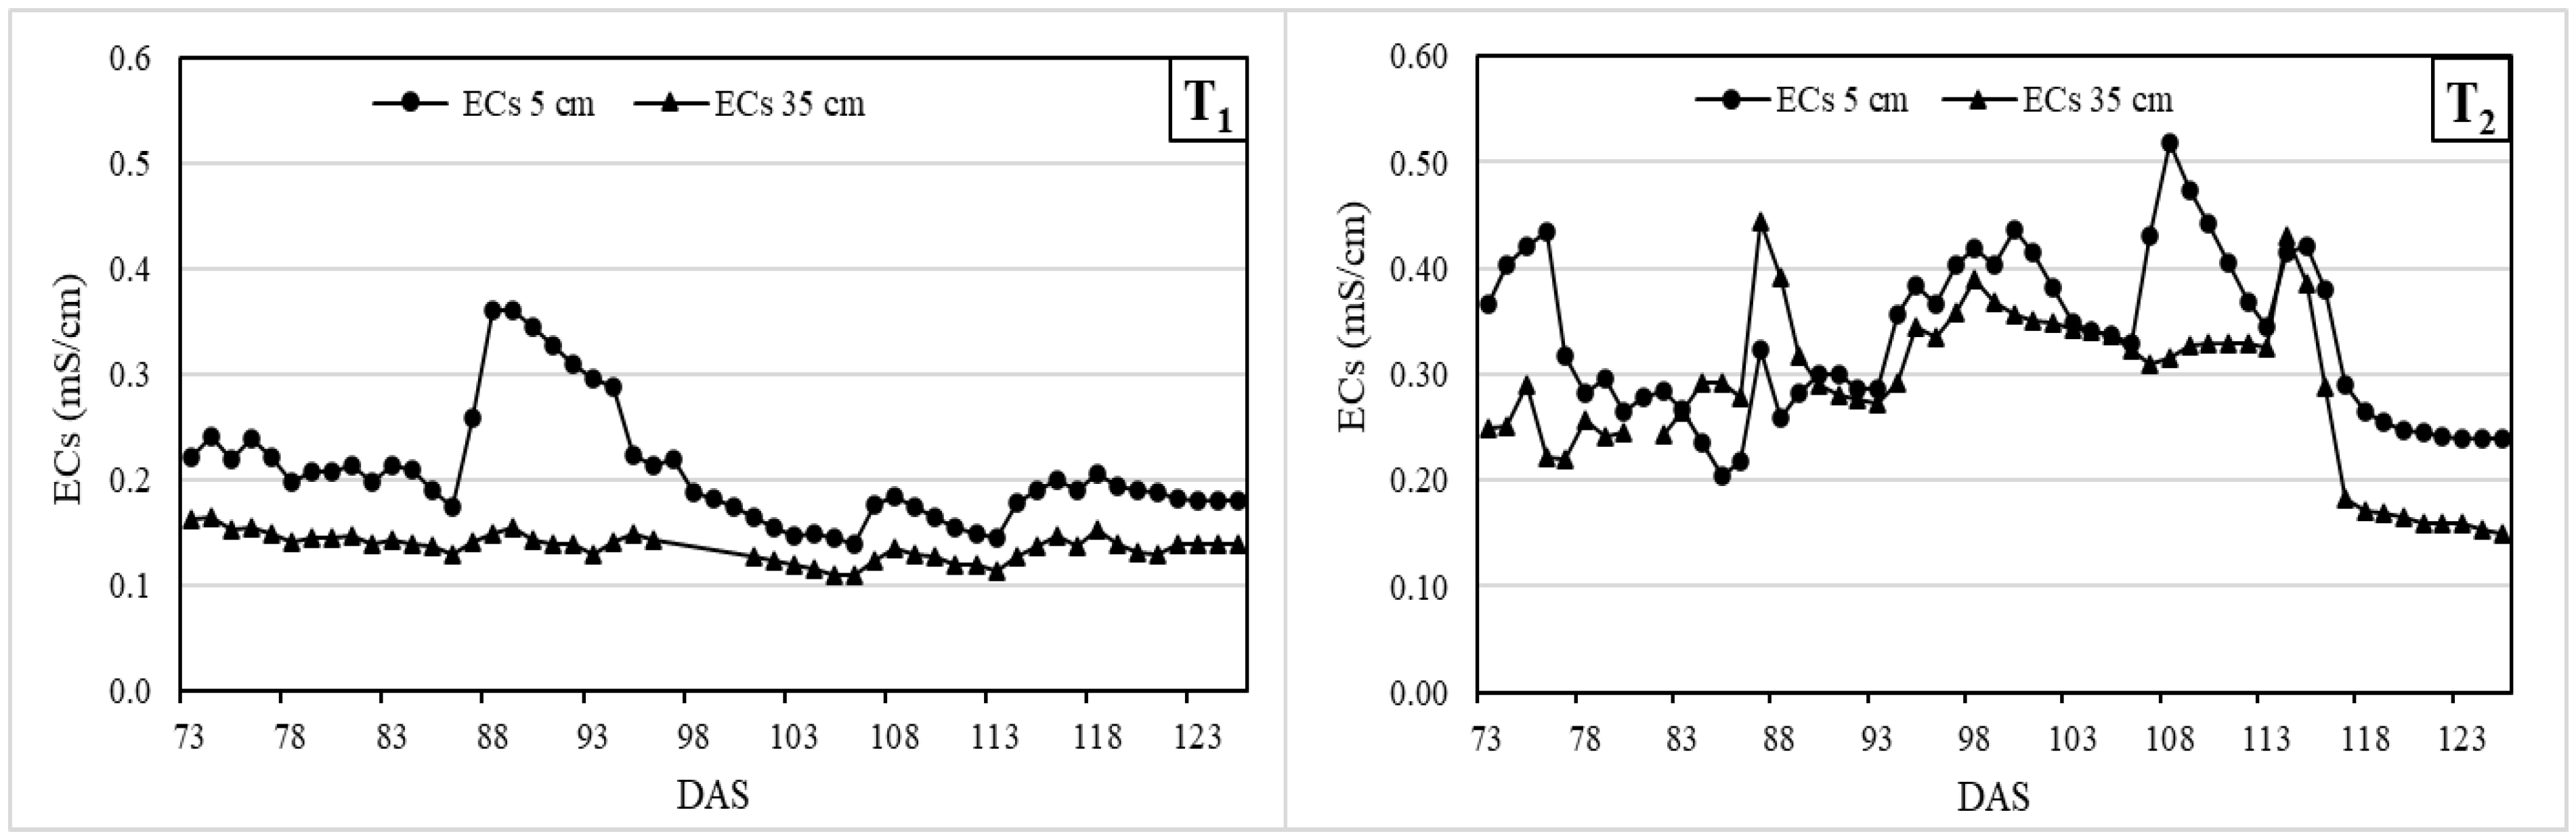
3.3. Soil Water and Electrical Conductivity Monitoring

Daily patterns and magnitudes of the soil water content measurements at 5 and 35 cm depth under T1-15 and T2-15 treatments are shown in Figure 4.
For both treatments, SWCs recorded at a 5 cm depth followed the same trend as those recorded at 35 cm. As can be observed under T1, except for fewer overlaps, SWCs measurements at 5 cm are relatively higher than their corresponding measurements at 35 cm. During the considered period, both patterns (under T1) tend to decrease with local peaks following a watering or precipitation event. In addition, the daily SWCs were not much different from the field capacity value for the root zone, insuring optimum water conditions for the okra crop during the whole growing period. Contrary to T1, SWCs recorded at 35 cm were higher than those recorded at 5 cm, with an average value of 0.22 ± 0.021 and 0.17 ± 0.015 (cm−3 cm−3), respectively. Furthermore, the average SWCs under Treatment T2 seemed to be greater than under T1, particularly at a 35 cm depth where values were higher than field capacity. As expected, the high rates of chemical elements and suspended matter (SM) in TWW resulted in an obstruction of soil micro-pores [34] and impeded deep percolation. Therefore, it promotes waterlogging and subsequently higher water content in the deep layer. These results are in good agreement with those obtained by [35,36], who found that the water infiltration rate decreased with increasing water SM load. In addition, their results evidenced that clogging occurred on the soil surface when fine textured soils were considered. However, this behavior was observed in depths of sandy soils, which corresponds to our case study.
Figure 5 shows the daily measurements of soil bulk electrical conductivity (mS cm−1) for both sub-treatments, T1-15 and T2-15, at 5 and 35 cm depths. As can be seen, EC values recorded for T2 were higher than their corresponding measurements for T1. Similar to the SWC curves, different peaks occurred after watering or precipitation events were detected.
EC values, measured at 5 cm depth, vary from 0.14 to 0.36 mS.cm−1 and from 0.20 to 0.47 mS cm−1 for T1 and T2, respectively. However, at 35 cm depth, values ranged from 0.11 to 0.16 and from 0.15 and 0.44 mS cm−1 for T1 and T2, respectively. Thus, for both water qualities, EC registered at 5 cm depths were greater than those at 35 cm depths. These patterns are relatively different from those observed for SWCs, in particular those under TWW treatment. These results could be explained by the fact that the top layer is more subjected to water evaporation, inducing an ascension of water through a capillarity rise, leading to salt accumulation near the soil surface. In this context, [37,38] stated that salinity at the top layer increased as the depth of the drippers increased. Furthermore, [39] indicates that the highest EC values were in the top 3 cm in both cases of tape placement at 18 and 25 cm in loamy sand soil conditions.

3.4. Okra Response to Water

The total irrigation amount supplied during the okra growing season, total yield, and WPirrig are summarized in Table 5.
As can be observed, total fresh yield was significantly affected by irrigation water quality. For treatment T1, total fresh yield varied from 2.55 ± 0.93 to 2.8 ± 0.22 t ha−1. However, higher yield values were recorded under treatment T2, which varied from 3.9 ± 0.34 to 4.4 ± 0.22 t ha−1. These results might be attributed to the high concentration of nutrient elements (nitrogen, potassium, calcium, magnesium, and phosphorus) in TWW compared to FW [26,40,41]. When separately considering both treatments, detailed analysis evidenced that total fresh yields of the okra crop were not significantly affected by lateral depth. In this context, [42] revealed that the maximum root density of okra is located in the top 0–20 cm soil layer. In addition, they highlighted that optimal crop yield and irrigation efficiency could be reached with a dripper depth not exceeding 20 cm. Regardless of lateral position, higher WPirrig values were achieved under TWW compared to those recorded under treatment T1. WPirrig values varied from 0.72 ± 0.33 to 0.78 ± 0.18 kg m−3 for T1, and between 1.08 ± 0.26 and 1.23 ± 0.18 kg m−3 for T2. These results were considered below those achieved by [43]. The authors found that the WP of okra crops can reach 2.84 ± 0.1 kg m−3 under conventional furrow irrigation (CFI) and 5.29 ± 0.1 kg m−3 under alternate furrow irrigation (AFI). This observed difference might be attributed to the okra variety used, which resulted in lower yield, and in the difference in the adopted technical package.

3.5. Sodium and Potassium Concentration in Okra Crop

Effects of irrigation water quality and lateral position on Na+ and K+ concentration, as a percentage of dry matter (% DM), are presented in Table 6. Results revealed that irrigation with TWW resulted in higher Na+ and K+ content in different okra plant organs (fruits, roots, and shoots) compared to those recorded with FW irrigation. Relatively similar results were obtained by [44,45]. The authors reported that irrigation with TWW significantly increased Na+ and K+ content in plant fruits compared to those irrigated with fresh water.
The highest contents of Na+ were observed in plant roots with average values equal to 1.3 and 1.54% DM for T1 and T2, respectively. Meanwhile, the highest amounts of K+ were recorded in okra fruits, then followed by shoot and root sections. These results highlighted that roots act as a barrier against the transition of Na+ to the aerial region, while fruits act as storage for K+. For both treatments, shoots were characterized by the lowest Na+ content, with average values of 0.3 and 0.48% DM for T1 and T2, respectively. These low Na+ levels might be explained by the fact that shoots act as organs of transition for the solutes from the roots to the fruits. Therefore, they are subjected to continuous changes which impede the effect of water quality or the irrigation system. In fact, Na+ content increased in the root zone with increasing dripper depth when TWW was used. The values increased from 1.11 to 1.89% DM for T2-0 and T2-15, respectively. Regarding K+ content, higher values were recorded in plant fruits and shoots compared to the roots. Obtained values ranged from 3.34 to 4.27% DM in the fruits, and varied from 2.8 to 3.21% DM in the shoots. These values were in the same order of magnitude as those obtained by [46,47] for okra crop fruits. Independent of irrigation water quality, the values of Na+ and K+ recorded in the different parts of the plant suggested that the Na/K pump in the roots acts in favor of K. Indeed, higher values of K+ were found in the fruits and the shoots than in the roots.

4. Conclusions

Under semi-arid and water scarcity conditions, improving water management practices in agriculture is widely recommended. The appropriate use of SDI and SSDI techniques and non-conventional water resources stand as useful options to save and better valorize water. The results of this study evidence that adopting subsurface drip irrigation with TWW, as an alternative to water saving through irrigation, allows for better retention of soil water contents, particularly in the root zone. Based on electrical conductivity measurements, salt concentrations tend to increase near the soil surface than in dipper layers. In the investigated soil, using both irrigation water qualities resulted in significant effects on okra crop yield and WPirrig. In fact, the nutrient-rich TWWs significantly improved the okra yield and the WPirrig. However, for both water qualities, the SDI and SSDI systems did not significantly affect okra crop yield and WPirrig. In terms of Na+ and K+ concentrations, our findings showed that irrigation with TWW resulted in higher Na+ and K+ absorption by okra compared to fresh water. This result was closely related to the TWW composition characterized by high Na+ and K+ elements.
Regardless of the lateral depth, the highest Na+ content was noted in the roots acting as barriers preventing passage to the aerial part. This behavior was related to the intrinsic physiological specificity of okra crops. At the same time, a significant amount of K+ was recorded in okra fruits, which are reputed to be very rich in potassium nutritional value. Considering the limited studies on okra crops, and beyond the regional implications of this study, our findings could be considered as a contribution to the irrigation management of okra crops under local conditions in terms of water quality and irrigation systems. Further field trials are needed to assess the impact of the lateral depth on crop response to water, soil water dynamics, and the mineral nutrition of okra crops. Similarly, the long-term effects of TWW on soil should be assessed in the future.

Author Contributions

Conceptualization, M.M. and M.N.K.; Data curation, M.M. and R.G.; Formal analysis, S.H.; Investigation, M.M. and R.G.; Resources, M.N.K. and S.Y.; Supervision, A.B. and S.Y.; Validation, B.L. and S.Y.; Visualization, M.N.K. and B.L.; Writing—original draft, M.M. and M.N.K.; Writing—review and editing, MM, M.N.K. and S.Y. All authors have read and agreed to the published version of the manuscript.

Funding

This research received no external funding.

Institutional Review Board Statement

Not applicable.

Informed Consent Statement

Not applicable.

Data Availability Statement

Not applicable.

Acknowledgments

The authors are thankful to the National Research Institute for Rural Engineering, Water and Forestry (INRGREF) for the valuable support of this research. Authors also grateful to all the staff of the agricultural experimental unit of INRGREF, Oued Souhil, Nabeul for their collaboration granted to carry out this study. The authors wish to thank also editor and the anonymous reviewers, whose insightful comments and helpful suggestions significantly contributed to improving this paper.

Conflicts of Interest

The authors declare no conflict of interest.

References

  1. Asgari, K.; Cornelis, W.M. Heavy metal accumulation in soils and grains, and health risks associated with use of treated municipal wastewater in subsurface drip irrigation. Environ. Monit. Assess. 2015, 187, 410. [Google Scholar] [CrossRef] [PubMed]
  2. Jaramillo, M.F.; Restrepo, I. Wastewater reuse in agriculture: A review about its limitations and benefits. Sustainability 2017, 9, 1734. [Google Scholar] [CrossRef]
  3. Hassena, A.B.; Zouari, M.; Trabelsi, L.; Decou, R.; Amar, F.B.; Chaari, A.; Zouari, N. Potential effects of arbuscular mycorrhizal fungi in mitigating the salinity of treated wastewater in young olive plants (Olea europaea L. cv. Chetoui). Agric. Water Manag. 2021, 245, 106635. [Google Scholar] [CrossRef]
  4. Deshmukh, S.K.; Singh, A.K.; Datta, S.P. Impact of wastewater irrigation on the dynamics of metal concentrations in the vadose zone: Monitoring: Part I. Environ. Monit. Assess. 2015, 187, 695. [Google Scholar] [CrossRef] [PubMed]
  5. Angelakis, A.N.; Do Monte, M.M.; Bontoux, L.; Asano, T. The status of wastewater reuse practice in the Mediterranean basin: Need for guidelines. Water Res. 1999, 33, 2201–2217. [Google Scholar] [CrossRef]
  6. Kessira, M.; Hamdy, A. Gestion de l’irrigation avec les eaux non conventionnelles; Bari: CIHEAM/EU DG Research. In Proceedings of the International Workshop, Alger, Algeria, 12–14 June 2005; pp. 203–216. [Google Scholar]
  7. ONAS. Activity Report of the National Sanitation Utility. Tunisia. 2020. Available online: http://www.onas.nat.tn/Fr/page.php?code=19 (accessed on 21 October 2022).
  8. Ayars, J.; Fulton, A.; Taylor, B. Subsurface drip irrigation in California-here to stay? Agric. Water Manag. 2015, 157, 39–47. [Google Scholar] [CrossRef]
  9. Tabatabaei, S.H.; Fatahi Nafchi, R.; Najafi, P.; Karizan, M.M.; Nazem, Z. Comparison of traditional and modern deficit irrigation techniques in corn cultivation using treated municipal wastewater. Int. J. Recycl. Org. Waste Agric. 2017, 6, 47–55. [Google Scholar] [CrossRef]
  10. Martínez-Gimeno, M.A.; Bonet, L.; Provenzano, G.; Badal, E.; Intrigliolo, D.S.; Ballester, C. Assessment of yield and water productivity of clementine trees under surface and subsurface drip irrigation. Agric. Water Manag. 2018, 206, 209–216. [Google Scholar] [CrossRef]
  11. Aydinsakir, K.; Buyuktas, D.; Dinç, N.; Erdurmus, C.; Bayram, E.; Yegin, A.B. Yield and bioethanol productivity of sorghum under surface and subsurface drip irrigation. Agric. Water Manag. 2021, 243, 106452. [Google Scholar] [CrossRef]
  12. Van der Kooij, S.; Zwarteveen, M.; Boesveld, H.; Kuper, M. The efficiency of drip irrigation unpacked. Agric. Water Manag. 2013, 123, 103–110. [Google Scholar] [CrossRef]
  13. Kandelous, M.M.; Šimůnek, J.; van Genuchten, M.T.; Malek, K. Soil water content distributions between two emitters of a subsurface drip irrigation system. Soil Sci. Soc. Am. J. 2011, 75, 488–497. [Google Scholar] [CrossRef]
  14. Palacios-Díaz, M.P.; Mendoza-Grimón, V.; Fernández-Vera, J.R.; Rodríguez-Rodríguez, F.; Tejedor-Junco, M.T.; Hernández-Moreno, J.M. Subsurface drip irrigation and reclaimed water quality effects on phosphorus and salinity distribution and forage production. Agric. Water Manag. 2009, 96, 1659–1666. [Google Scholar] [CrossRef]
  15. Camp, C.R. Subsurface drip irrigation: A review. Trans. ASAE 1998, 41, 1353–1367. [Google Scholar] [CrossRef]
  16. Singh, D.K.; Rajput, T.B.S. Response of lateral placement depths of subsurface drip irrigation on okra (Abelmoschus esculentus). Int. J. Plant Prod. 2007, 1, 73–84. [Google Scholar]
  17. Al-Harbi, A.R.; Al-Omran, A.M.; El-Adgham, F.L. Effect of drip irrigation levels and emitters depth on okra (Abelmoschus esculentus) growth. J. Appl. Sci. 2008, 8, 2764–2769. [Google Scholar] [CrossRef]
  18. Bozkurt, S.; Mansuroglu, G.S. Responses of unheated greenhouse grown green bean to buried drip tape placement depth and watering levels. Agric. Water Manag. 2018, 197, 1–8. [Google Scholar] [CrossRef]
  19. Del Amor, M.A.; Del Amor, F.M. Response of tomato plants to deficit irrigation under surface or subsurface drip irrigation. J. Appl. Hortic. 2007, 9, 97–100. [Google Scholar] [CrossRef]
  20. Al-Omran, A.M.; Al-Harbi, A.R.; Wahb-Allah, M.A.; Nadeem, M.; Al-Eter, A. Impact of irrigation water quality, irrigation systems, irrigation rates and soil amendments on tomato production in sandy calcareous soil. Turk. J. Agric. For. 2010, 34, 59–73. [Google Scholar] [CrossRef]
  21. Lui, M.X.M.; Mei, Y.U.; Jin, W. Effects of irrigation water quality and drip tape arrangement on soil salinity, soil moisture distribution, and cotton yield (Gossypium hirsutum L.) under mulched drip irrigation in Xinjiang, China. J. Integr. Agric. 2012, 11, 502–511. [Google Scholar] [CrossRef]
  22. Karimi, B.; Mohammadi, P.; Sanikhani, H.; Salih, S.Q.; Yaseen, Z.M. Modeling wetted areas of moisture bulb for drip irrigation systems: An enhanced empirical model and artificial neural network. Comput. Electron. Agric. 2020, 178, 105767. [Google Scholar] [CrossRef]
  23. Chen, W.; Jin, M.; Ferré, T.P.; Liu, Y.; Xian, Y.; Shan, T.; Ping, X. Spatial distribution of soil moisture, soil salinity, and root density beneath a cotton field under mulched drip irrigation with brackish and fresh water. Field Crops Res. 2018, 215, 207–221. [Google Scholar] [CrossRef]
  24. Azeem, A.; Javed, Q.; Sun, J.; Nawaz, M.I.; Ullah, I.; Kama, R.; Du, D. Functional traits of okra cultivars (Chinese green and Chinese red) under salt stress. Folia Hortic. 2020, 32, 159–170. [Google Scholar] [CrossRef]
  25. Abd El-Kader, A.; Shaaban, S.; Abd El-Fattah, M. Effect of irrigation levels and organic compost on okra plants (Abelmoschus esculentus L.) grown in sandy calcareous soil. Am. J. Agric. Biol. Sci. 2010, 1, 225–231. [Google Scholar] [CrossRef]
  26. Kumar, V.; Chopra, A.K.; Srivastava, S.; Singh, J.; Thakur, R.K. Irrigating okra with secondary treated municipal wastewater: Observations regarding plant growth and soil characteristics. Int. J. Phytoremediat. 2017, 19, 490–499. [Google Scholar] [CrossRef] [PubMed]
  27. Allen, R.G.; Pereira, L.S.; Raes, D.; Smith, M. Crop Evapotranspiration-Guidelines for Computing Crop Water Requirements—FAO Irrigation and Drainage Paper 56; FAO: Rome, Italy, 1998; p. 300. [Google Scholar]
  28. Owusu-Sekyere, J.D.; Annan, E. Effect of deficit irrigation on growth and yield of Okra (Abelmoscus esculentus). J. Sci. Technol. Ghana 2010, 30, 128–134. [Google Scholar]
  29. Willie, W.K.T.; Owusu-Sekyere, J.D.; Sam-Amoah, L.K. Interactions of deficit irrigation, chicken manure and NPK 15: 15: 15 on okra growth and yield and soil properties. Asian J. Agric. Res. 2016, 10, 15–27. [Google Scholar] [CrossRef]
  30. Lesch, S.M.; Suarez, D.L. Technical note: A short note on calculating the adjusted SAR index. Am. Soc. Agric. Biol. Eng. 2009, 52, 493–496. [Google Scholar]
  31. Nagaz, K.; EL Mokh, F.; Alva, A.K.; Masmoudi, M.M.; Ben Mechlia, N. Potato response to different irrigation regimes using saline water. Irrig. Drain. 2016, 65, 654–663. [Google Scholar] [CrossRef]
  32. Richards, L.A. Diagnosis and Improvement of Saline Alkali Soils; Handbook 60; US Department of Agriculture: Washington, DC, USA, 1954; Volume 78, p. 154. [Google Scholar]
  33. Bucks, D.A.; Nakayama, F.S.; Gilbert, R.G. Trickle irrigation water quality and preventive maintenance. Agric. Water Manag. 1979, 2, 149–162. [Google Scholar] [CrossRef]
  34. Morvannou, A.; Forquet, N. Projet ROSEEV: Role du Sol Dans les Zones de Rejet Végétalisées. Etude de l’Application de Différentes Charges Hydrauliques sur la Plateforme Lysimétrique de Mionnay (69); Irstea: Paris, France, 2019. [Google Scholar]
  35. Djedidi, N.; Hassen, A. Propriétés physiques des sols et pouvoir colmatant des eaux usées en fonction de leur degré de traitement. Cah. ORSTOM Pédologie 1991, 26, 3–10. [Google Scholar]
  36. Yong, C.F.; McCarthy, D.T.; Deletic, A. Predicting physical clogging of porous and permeable pavements. J. Hydrol. 2013, 481, 48–55. [Google Scholar] [CrossRef]
  37. Selim, T.; Berndtsson, R.; Persson, M.; Somaida, M.; El-Kiki, M.; Hamed, Y.; Zhou, Q. Influence of geometric design of alternate partial root-zone subsurface drip irrigation (APRSDI) with brackish water on soil moisture and salinity distribution. Agric. Water Manag. 2012, 103, 182–190. [Google Scholar] [CrossRef]
  38. Sun, S.M.; Yang, P.L.; An, Q.X.; Xu, R.; Yao, B.L.; Li, F.Y.; Zhang, X.X. Investigation into surface and subsurface drip irrigation for jujube trees grown in saline soil under extremely arid climate. Eur. J. Hortic. Sci. 2016, 81, 165–174. [Google Scholar] [CrossRef]
  39. Roberts, T.L.; White, S.A.; Warrick, A.W.; Thompson, T.L. Tape depth and germination method influence patterns of salt accumulation with subsurface drip irrigation. Agric. Water Manag. 2008, 95, 669–677. [Google Scholar] [CrossRef]
  40. Khelil, M.N.; Rejeb, S.; Henchi, B.; Destain, J.P. Effects of irrigation water quality and nitrogen rate on the recovery of 15N fertilizer by sorghum in field study. Commun. Soil Sci. Plant Anal. 2013, 44, 2647–2655. [Google Scholar] [CrossRef]
  41. Phung, L.D.; Ichikawa, M.; Pham, D.V.; Sasaki, A.; Watanabe, T. High yield of protein-rich forage rice achieved by soil amendment with composted sewage sludge and topdressing with treated wastewater. Sci. Rep. 2020, 10, 10155. [Google Scholar] [CrossRef]
  42. Jayapiratha, U.; Sivakumar, S. Performance evaluation of okra (Abelmoschus esculentus). Asian J. Agric. Res. 2010, 4, 139–147. [Google Scholar]
  43. Siyal, A.A.; Mashori, A.S.; Bristow, K.L.; Van Genuchten, M.T. Alternate furrow irrigation can radically improve water productivity of okra. Agric. Water Manag. 2016, 173, 55–60. [Google Scholar] [CrossRef]
  44. Tarchouna, L.G.; Merdy, P.; Raynaud, M.; Pfeifer, H.R.; Lucas, Y. Effects of long-term irrigation with treated wastewater. Part I: Evolution of soil physico-chemical properties. Appl. Geochem. 2010, 25, 1703–1710. [Google Scholar] [CrossRef]
  45. Liu, Y.; Zhou, S.; Sun, J.; Wang, X.; Yuan, Z. Optimum combination of soil amendments under drip irrigation with different water sources in coastal areas of East China. Span. J. Agric. Res. 2018, 16, 22. [Google Scholar] [CrossRef]
  46. Kouassi, J.B.; Cisse-camara, M.; Sess, D.E.; Tiahou, G.G.; Monde, A.A.; Djohan, F.Y. Détermination des teneurs en fer, en calcium, en cuivre et en zinc de deux variétés de gombo. Bull. Soc. R. Sci. Liége 2013, 82, 22–32. [Google Scholar]
  47. Ahiakpa, J.K.; Quartey, E.K.; Amenorpe, G.; Klu, G.Y.P.; Agbemavor, W.S.K.; Amoatey, H.M. Essential mineral elements profile of 22 accessions of Okra (Abelmoscus spp L.) from eight regions of Ghana. J. Agric. Sci. 2014, 6, 18–25. [Google Scholar]
Figure 1. Experimental layout.
Agriculture 12 02048 g001
Figure 2. Trends of daily average temperature (Tavg), reference evapotranspiration (ET0), and precipitation (P) during the study period.
Agriculture 12 02048 g002
Figure 3. Daily evolution of cumulative okra crop evapotranspiration (ETc) and irrigation plus precipitation (I + P) in mm.
Agriculture 12 02048 g003
Figure 4. Daily patterns of soil water contents (SWCs) at 5 and 35 cm depths under fresh water (T1) and domestic treated wastewater (T2). ⊖cc: soil moisture content at field capacity; ⊖pfp: soil moisture content at permanent wilting point; DAS: days after sowing.
Agriculture 12 02048 g004
Figure 5. Daily patterns of electrical conductivity (ECs) at 5 and 35 cm under fresh water (T1) and domestic treated wastewater (T2). DAS: days after sowing.
Agriculture 12 02048 g005
Table 1. Physical and chemical properties of the experimental soil.
Soil DepthSandClayLoamBd 1pHOC 2HumusECs 3MnNiZnFePb
(cm)%(g·cm−3) %mS·cm−1(mg·Kg−1)
0–10797.113.91.408.10.701.41.46106.35.569.114,00715.8
10–2076.77.515.81.458.00.601.31.24108.37.969.115,4837.8
20–3079.37.013.71.48.20.601.11.12115.97.878.715,90013.7
30–4075.18.216.71.578.30.601.11.21126.24.964.417,37310.8
40–5073.48.518.11.528.40.53<1.11.1595.58.151.313,51215.9
50–60777.415.61.508.40.53<1.11.3970.43.419.812,5558.3
Permissible limit 4 200050300-100
1 Bulk density; 2 organic carbon; 3 soil electrical conductivity, 4 European Union Standards, 2000.
Table 2. Okra crop coefficients Kc and stage development length.
Crop Development Stages
InitialDevelopmentMid-SeasonFinal Season
Period length (d)10312520
Kc0.20.2–110.9
Table 3. Chemical properties of TWW and FW.
Treated Wastewater Fresh WaterNT 106.03
pH7.25 ± 0.21 7.46.5–8.5
CE (mS/cm)3.35 ± 0.22 2.777
SAR8.06 ± 0.20 5.09-
Dry residue (g/L)2.17 ± 0.26mg/L1.94-
N-NO3<5--
N-NH4+38.70 ± 3.82 --
P5.05 ± 1.68 --
K+42.71 ± 11.06 8.4-
Na+487.6 ± 54.53 325-
Cl666.2 ± 93.51 518.32000
Ca2+126.3 ± 5.42 178-
Mg2+88.4 ± 7.09 78-
HCO3333.1 ± 34.39 579.5-
SO42−490.6 ± 158.4 288-
Cd0.0072 ± 0.0032 -0.01
Co0.0114 ± 0.0099 -0.1
Cr0.0312 ± 0.0302 -0.10
Cu0.0084 ± 0.0054 -0.50
Fe0.2348 ± 0.1370 0.035
Mn0.0120 ± 0.0140 0.080.50
Ni0.0137 ± 0.0121 -0.20
Pb0.0349 ± 0.0142 -1
Zn0.0144 ± 0.0090 0.035
Table 4. Total applied water and crop evapotranspiration (mm).
TreatmentETc
(mm)
P
(mm)
I
(mm)
T1
T1-0401.487.6365.4
T1-5401.487.6365.4
T1-15401.487.6365.4
T1-25401.487.6365.4
T2
T2-0401.487.6365.4
T2-5401.487.6365.4
T2-15401.487.6365.4
T2-25401.487.6365.4
ETc: Okra crop evapotranspiration. P: Precipitation. I: Irrigation.
Table 5. Yield and WPirrig of okra crop under different treatments.
TreatmentP
(mm)
I
(mm)
Yield
(t ha−1)
WPirrig (Kg m−3)
T1
T1-087.6365.42.55 ± 0.93 a0.72 ± 0.33
T1-587.6365.42.7 ± 0.37 a0.75 ± 0.23
T1-1587.6365.42.6 ± 0.46 a0.73 ± 0.30
T1-2587.6365.42.8 ± 0.22 a0.78 ± 0.18
T2
T2-087.6365.43.9 ± 0.34 b1.10 ± 0.26
T2-587.6365.44.4 ± 0.22 b1.23 ± 0.18
T2-1587.6365.44.1 ± 0.09 b1.16 ± 0.23
T2-2587.6365.43.9 ± 0.6 b1.08 ± 0.26
(P = precipitation; I = irrigation; WPirrig = irrigation water productivity). Means in the same row followed by the same letters are not significantly different at p < 0.05, according to Duncan multiple range test (DMRT).
Table 6. Na+ and K+ concentration in roots, shoots, and fruits under different treatments (% DM).
Emitter Depth (cm)Na+ ContentsK+ Contents
RootsShootsFruitsRootsShootsFruits
T1T2T1T2T1T2T1T2T1T2T1T2
01.37 bc1.11 a0.22 a0.41 cd0.74 ab0.64 a1.79 cd1.72 c2.87 a3.09 b4.03 a4.13 bc
51.19 ab1.41 c0.27 ab0.49 d0.62 a1.52 a1.40 b1.65 c2.99 ab3.21 c3.43 a4.17 bc
151.19 ab1.89 e0.39 c0.44 cd0.63 a1.14 c1.06 a2.03 d3.06 ab3.03 ab3.93 ab4.13 bc
251.44 c1.73 d0.31 bc0.56 e0.75 b0.84 a1.18 a2.51 e3.09 b3.02 ab4.10 a4.27 c
average1.301.540.300.480.691.041.361.983.003.093.873.89
Mean value of ± standard deviation of yield three replicate (n = 3) with same letters are not significantly different according to Duncan multiple range test (DMRT) at significance level 5% (p < 0.05). DM = Dry matter.
Publisher’s Note: MDPI stays neutral with regard to jurisdictional claims in published maps and institutional affiliations.

