1. Introduction
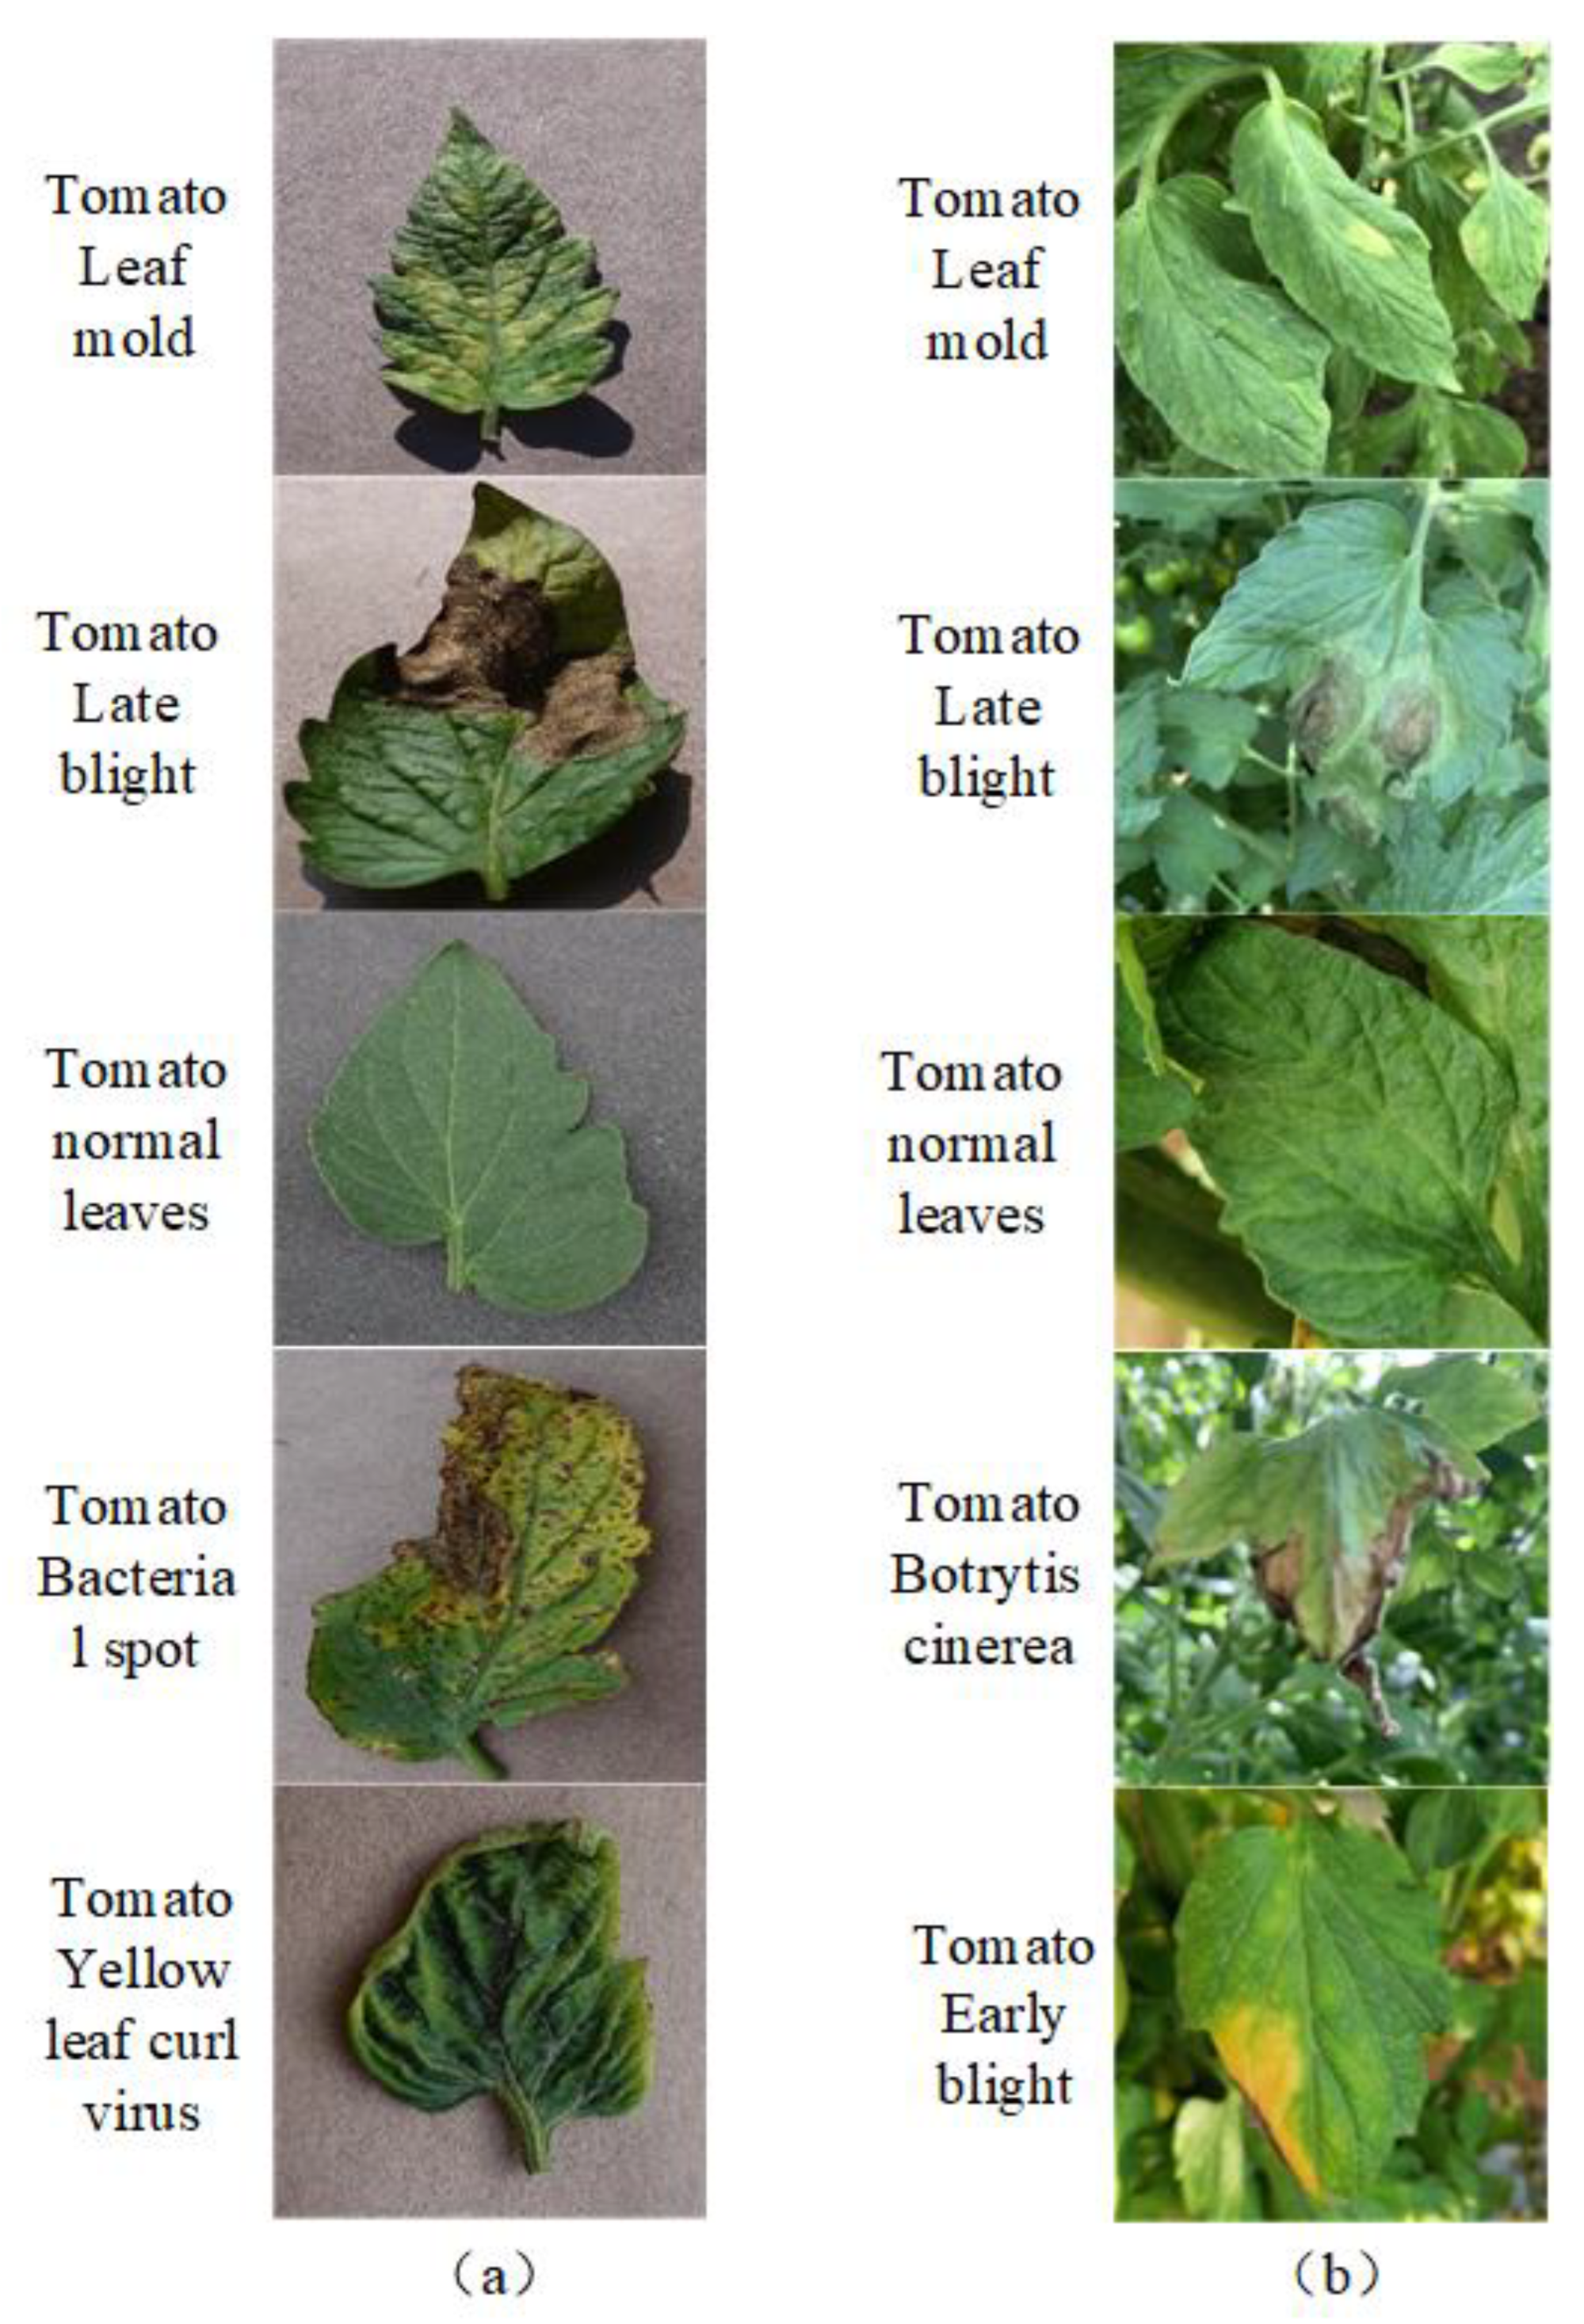
Tomato is one of the important vegetable crops in China, and its planting area and total output rank first in the world. The increased occurrence of tomato diseases will seriously affect the yield and quality of tomatoes, such as tomato bacterial spot, late light, leaf mold, yellow leaf curl virus, Botrytis cinerea, early light, bacterial pulp necrosis, gray leaf spot, sclerotinia, etc. The traditional expert diagnosis efficiency is low and the number of experts is limited. Only relying on traditional expert knowledge and image processing methods to diagnose diseases cannot meet the development needs of agricultural informatization. However, crop disease surveillance is an important measure to ensure the healthy development of tomato industry. With the continuous development of computer vision [
1], deep learning methods [
2] have been widely studied and applied in the field of agricultural diseases. Many researchers have conducted a lot of studies in the field of image classification [
3,
4], and have achieved certain results. Some researchers use deep learning image recognition methods to carry out research. Lucas et al. [
5] selected the AlexNet model to identify six kinds of apple disease images. The experimental results showed that the convolutional neural network method can achieve an accuracy of 97.3%. Guo Xiaoqing et al. [
6] proposed a multi-receptive field recognition model based on AlexNet for the problem of similar tomato disease identification. The average recognition accuracy of this model for early, middle and late tomato leaf diseases reached 92.7%. Wang et al. [
7] compared de novo training and transfer learning to fine-tune the training model. The experimental results showed that transfer learning can effectively speed up the model convergence, and the accuracy rate was 90.4% on the VGG16 neural network. Wang Chunshan et al. [
8] proposed a multi-scale residual lightweight Multi-scale ResNet disease identification model combined with a multi-scale feature extraction module in response to the large number of parameters and high computing and storage costs that occurred when the neural network model was deployed to agricultural Internet of Things equipment. The group convolution operation decomposed the large convolution kernel, the training parameters of the model reduced by about 93%, the overall size of the model reduced by about 35%, and the accuracy rate of 93.05% was obtained in the collected seven kinds of disease image data, which is a good result. At present, most of the research on vegetable disease identification at home and abroad is to identify a single disease image, since tomato diseases are closely related to the planting environment. Therefore, it is suggested to introduce multi-source information fusion to identify diseases and improve the quality of disease diagnosis.
With the vigorous development of wireless sensor networks and 5G transmission, agricultural greenhouses generate a large amount of agricultural production data, providing a data basis for intelligent disease diagnosis. Multi-source data reflects the growth status of crops from different perspectives. With the rapid growth of data, processing information and fusing different types of data are more and more important for crop disease diagnosis. With the development of deep learning and the rapid growth of multimedia data, and the fact that the actual problem scene is complex and changeable and contains various types of data, the research on multi-modal problems such as images, texts, and audios has been born [
9,
10]. Multimodal learning is composed of information from different modalities, usually including two or more modalities. The purpose is to combine the data of different modalities, pay attention to the internal relationship between modalities, and realize the mutual transformation of each modal information, even if it can fill in the missing information in the transfer process in the case of missing certain modalities. The data collected by the sensor has multi-modal characteristics, and the introduction of multi-modal information into disease identification helps to improve the accuracy of identification. Making full use of the complementarity and correlation between modalities to achieve multimodal data fusion has become a research focus in recent years [
11,
12,
13]. Gao Ronghua et al. [
14] collected environmental parameters in real time through the Internet of Things, integrated image feature fusion, environmental information and expert knowledge, and adopted the method of multi-structure parameter ensemble learning for disease identification to ensure the accuracy of identification under the condition of less identification time. In the experiment of 50 samples of four diseases of cucumber, the sample recognition rate was 79.4–93.6%. In order to enhance the accuracy and robustness of the visibility deep learning model under the condition of small samples, Shen Kecheng et al. [
15] proposed a multi-modal visibility deep learning method based on visible light-far-infrared images, and constructed a multi-modal three-branch parallel structure. In the feature fusion network, the feature information of each branch realizes modal complementation and fusion through the network structure and outputs the visibility level corresponding to the image scene at the end of the network. Compared with traditional unimodal models, multimodal visibility models can significantly improve the accuracy and robustness of visibility detection under small sample conditions. Zhiqiang Yuan [
16] learned by sharing the top hidden layer in each specific unimodal network Common representation of multimodal data. Wang et al. [
17] demonstrated that a multimodal deep network structure can learn a good joint representation of audio and video data, thereby improving the recognition task accuracy. Chang Cheng [
18] established a shared expression layer to fuse inter-modal information, and the improved model has stronger generalization ability and higher accuracy than the single-modal model.
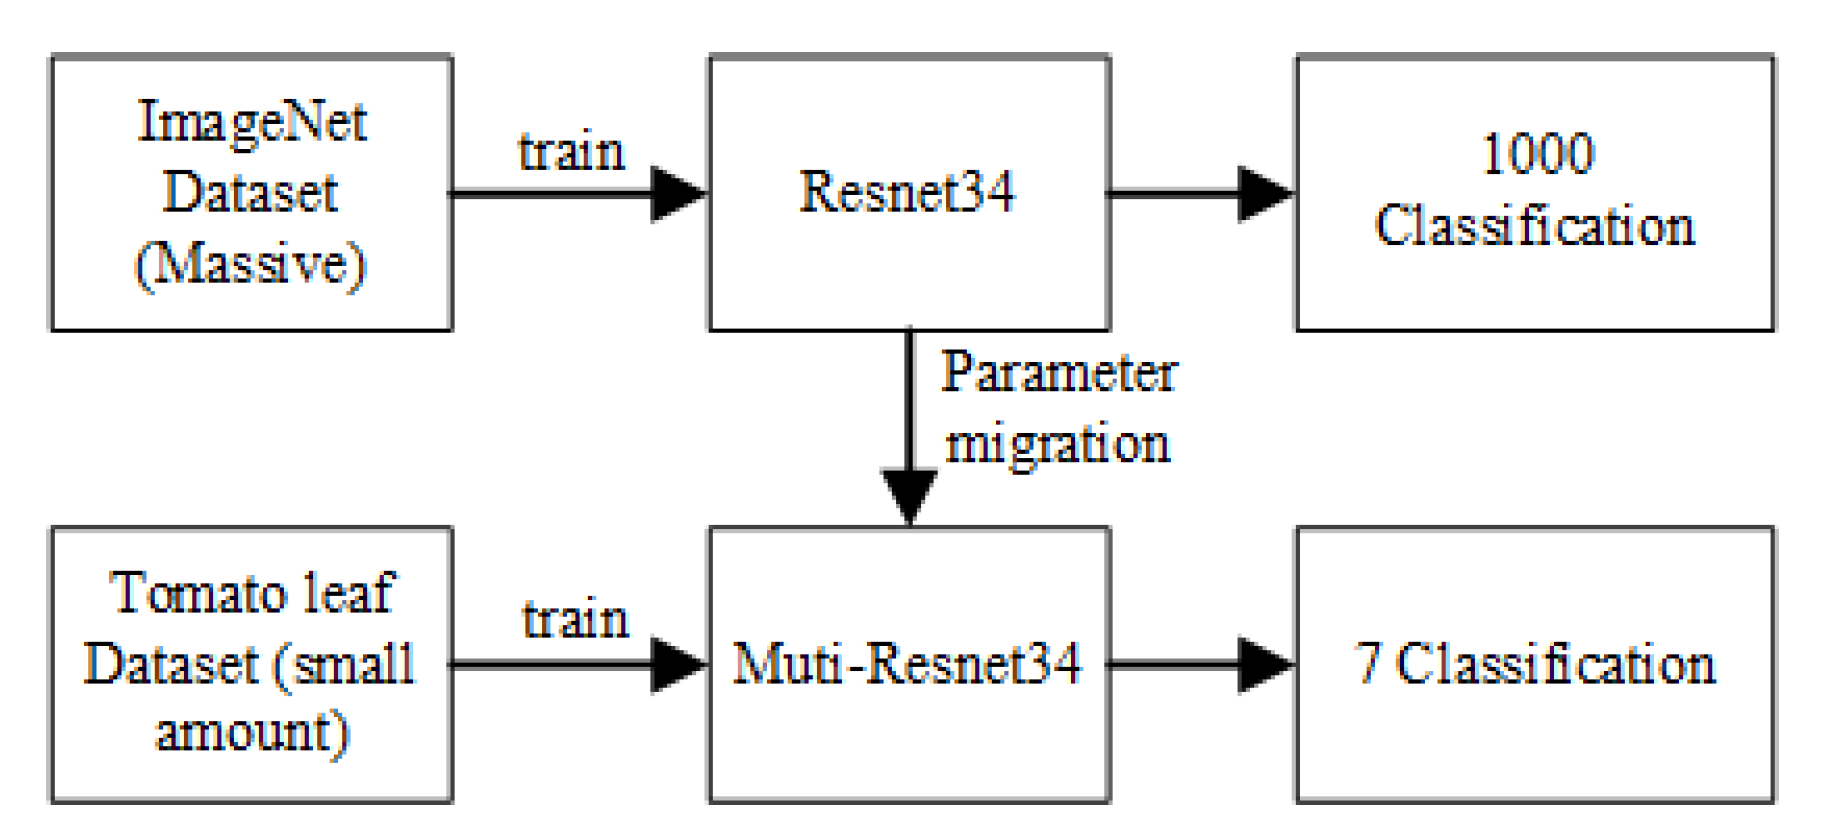
As the crop growth environment will promote the occurrence of diseases, tomato diseases are closely related to the planting environment. The change of temperature and humidity in the planting environment will lead to the breeding of bacteria, which will lead to the occurrence and spread of diseases. The recognition accuracy is limited only by relying on a single tomato disease image data. Therefore, multi-source information fusion is introduced to identify diseases and improve the quality of disease diagnosis. The method of disease identification based on multimodal fusion uses the complementarity of data to improve the accuracy of disease identification. Based on the research results of convolution neural network theory and the characteristics of tomato leaf surface disease images, this paper will study the multi-mode fusion tomato disease recognition model based on migration learning [
19,
20,
21] for disease images in small data domain and environmental data and explore multi-mode data fusion analysis and processing methods. The accuracy of tomato disease identification is improved through multi-modal information recognition method. This paper considers the environmental factors in the process of disease occurrence, and analyzes the disease types in combination with disease images and environmental factors when the disease occurs, which makes the tomato disease recognition model closer to the actual production scene and provides research ideas for vegetable disease diagnosis.
3. Experimental Results and Analysis
3.1. Test Environment and Parameter Settings
Test environment: Windows10 system, processor Intel(R) Core(TM) i5-5200 U CPU@2.20 GHz 2.19 GHz, RAM 8.0 GB, Python 3.6, Pytorch 1.2.0, JetBrains PyCharm 2018.3.3 ×64.
The multimodal image environment dataset is composed of seven types of image data and environment data. There are 3200 pieces of disease environment data for each type, totaling 22,400 groups of data. The dataset is divided into training set and test set at a ratio of 7:3. The Torch deep learning open-source framework is used to build the network model, ImageNet is used to pre-train weights, the optimizer selects the computationally efficient Adam optimizer, and the loss function selects the commonly used cross-entropy loss function. The learning rate is set to 0.0001; batch training is used to divide the training set and test set into multiple batches, and the number of samples selected for each batch of training is 16, that is, the train batch is set to 16; epoch means all the training set samples. After completing a forward propagation and back propagation, the epoch determines the number of times the network needs to be trained on all samples of the training set, and the epoch is set to 30.
3.2. Evaluation Indicators
There are various evaluation indicators for evaluating the performance of the model. Through different evaluation indicators, the recognition effect of the model can be fully understood from different angles. Benben adopts the following two evaluation methods to evaluate the performance of the model.
- (1)
The average recognition accuracy (AA) can measure the recognition accuracy of the model to the disease, and it is convenient to compare the recognition performance of different models from a macro perspective. The average recognition accuracy P refers to the ratio of correctly predicted samples to all observations in the model, as shown in the following formula:
In the formula, represents the number of correctly predicted samples of the i-th disease sample in the test set, represents the number of samples that are incorrectly predicted by the i-th disease sample in the test set, and M represents the number of disease types.
- (2)
The confusion matrix clearly shows the number of correctly classified and misclassified classes, as well as the number of each feature. The overall classification accuracy and Kappa coefficient were calculated from the confusion matrix to determine the accuracy and reliability of the evaluation results. The overall classification accuracy (OA) can well represent the accuracy of the model classification. Kappa coefficient is used to measure the classification accuracy of the model and is an indicator for consistency test. Consistency refers to whether the predicted results of the model are consistent with the actual classification results. The calculation result is usually between 0 and 1, and the closer the value is to 1, the higher the consistency. The Kappa coefficient and overall classification accuracy are calculated as follows:
Among them, Po is the overall classification accuracy; C is the number of correctly classified samples for each category; N is the total number of samples; M is the number of disease types; is the number of real samples in each category; is the predicted sample for each category number; k represents the Kappa coefficient.
3.3. Multi-ResNet34 Model Recognition Results
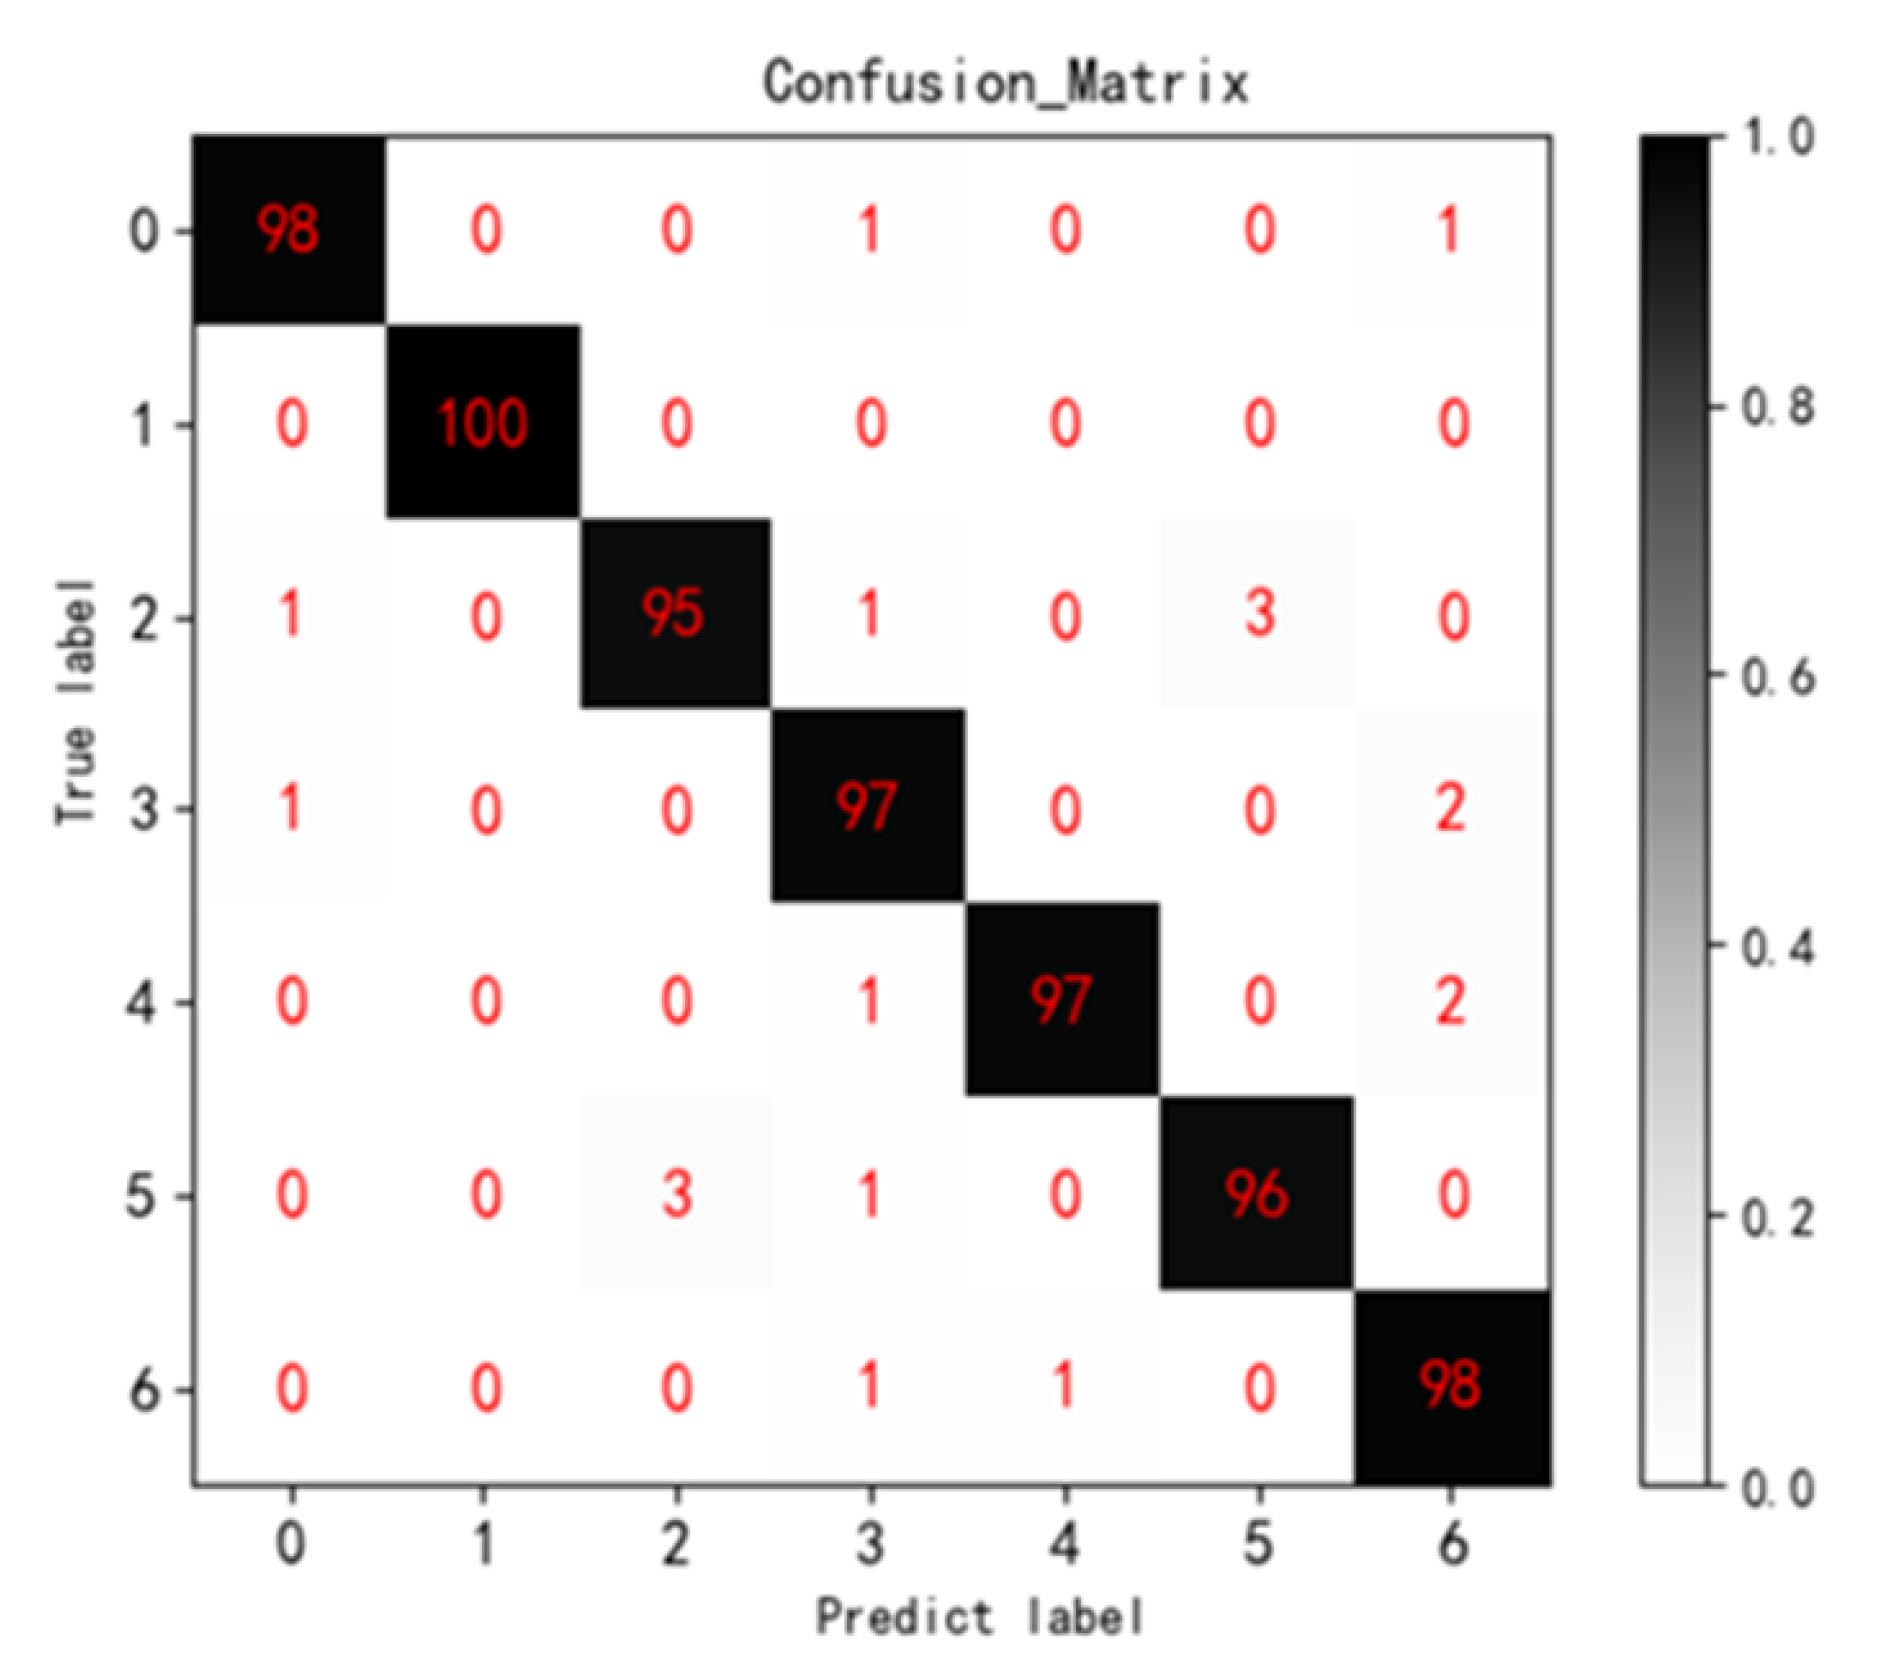
The training time of Multi ResNet34 model in tomato disease image environment dataset is 3068 s. Through the model testing, the classification of the environmental data of seven kinds of tomato disease images, the obtained seven-category confusion matrix (Confusion Matrix) and the recognition rate of each type of disease are shown in
Figure 7 and
Table 2 below. The confusion matrix clearly shows the misclassification of each type of disease. As can be seen from the figure, most of the data is classified correctly. The overall classification accuracy of the model is 97.3%, and the Kappa coefficient is 0.968. The overall judgment is accurate and the recognition rate is high. Among them, the identification accuracy of tomato late blight was the lowest at 95.00%. Because the late blight and gray mold lesions both showed large gray-brown lesions and occurred in a low temperature and high humidity environment, the two were most likely to be misjudged as each other.
3.4. Comparative Experiment
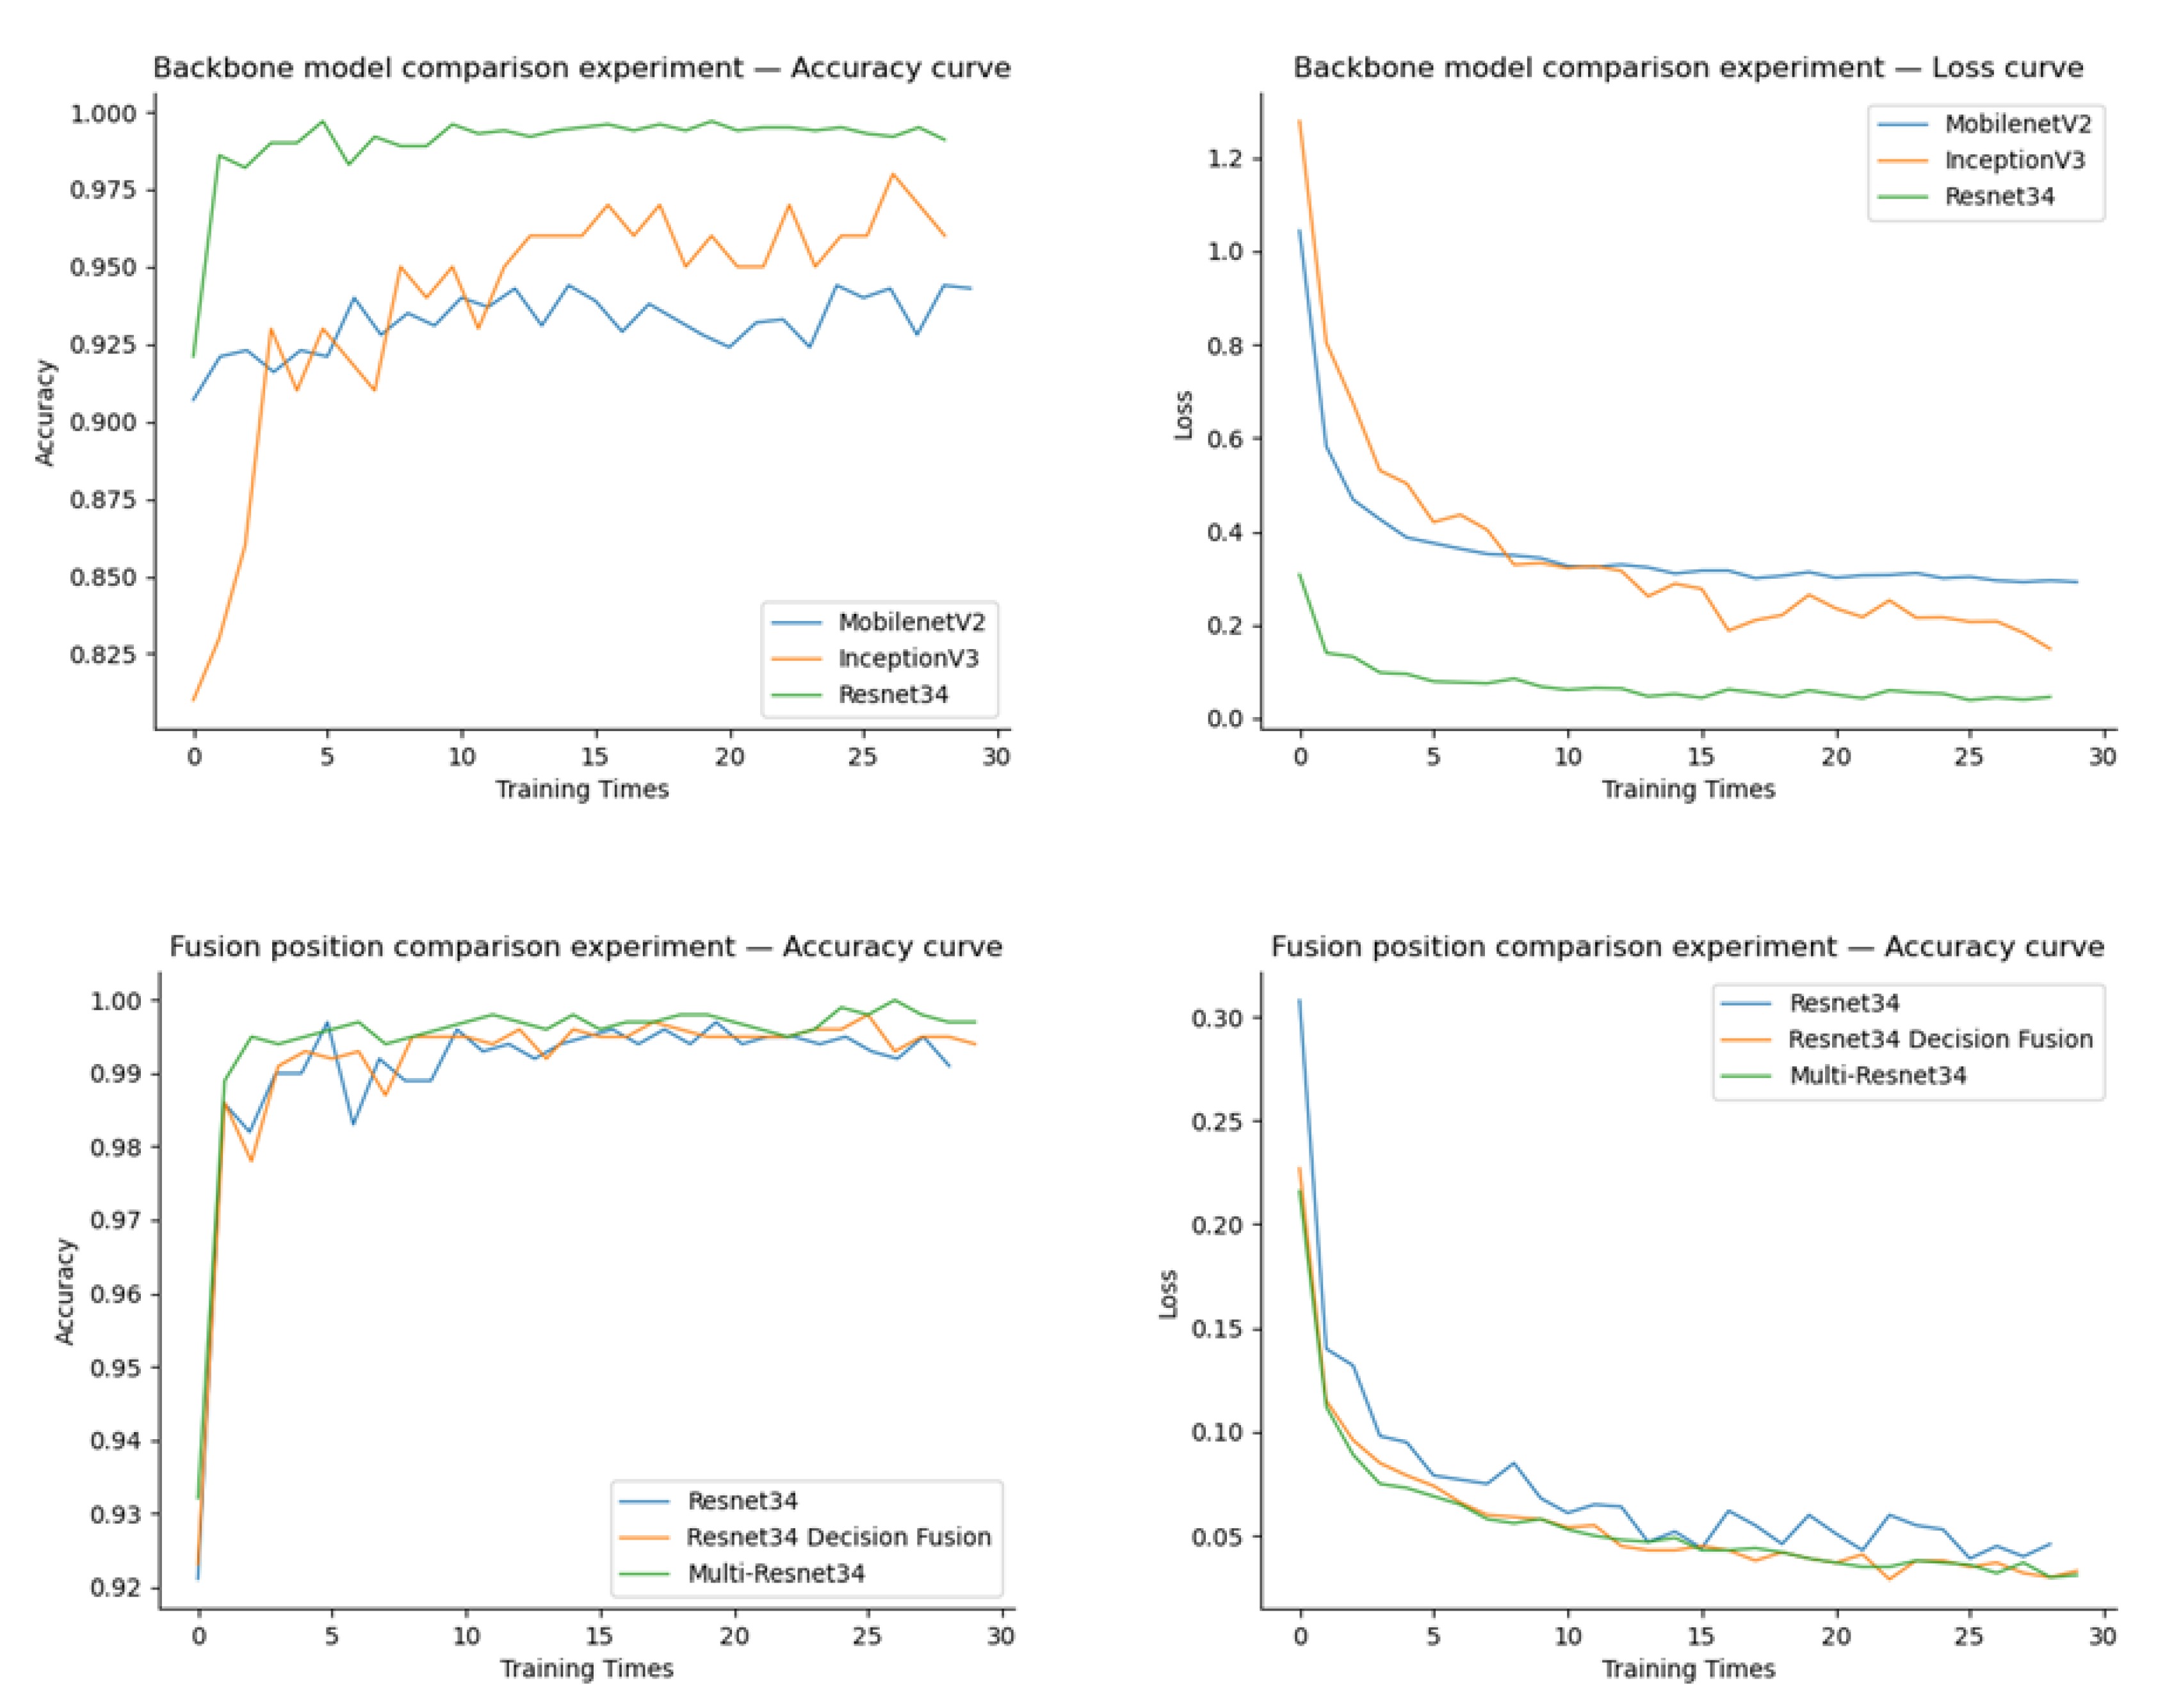
In order to verify the effectiveness of the method in this paper, three aspects are considered: the selection of the backbone model, the location of multi-structure data fusion and the addition of environmental data. The comparison experiments are MobileNetV2, InceptionV3, ResNet34, ResNet34 decision fusion, Multi-ResNet34. Including six groups of experiments, each model is iterated 30 times, and the generalization and fitting ability of each model is judged by whether the loss function curve converged, combined with the performance of each model on the test set; the accuracy is compared.
Table 3 shows the experimental results of different models. Overall, the disease recognition model based on ResNet34 multimodal feature fusion proposed in this paper is better than the baseline model.
Comparing the training process of a single image dataset of different backbone networks, the accuracy rates of the three groups of models of ResNet34, MobileNetV2, and InceptionV3 on the test set are 97.8%, 94.3%, and 95.8%, respectively. The curve changes of training accuracy (accuracy) and cross entropy (cross entropy) during the training of ResNet, MobileNetV2 and Inception V3 networks are shown in part A in
Figure 8, respectively. It can be seen from the curve that during the training process of ResNet34, the accuracy increases and the cross entropy decreases rapidly, and the curve does not fluctuate much. After 10 iterations or so, the curve tends to be stable and achieves a high accuracy rate; MobileNet convergence iteration speed is slower than that of ResNet34. Iteration tends to be stable after about 20 iterations, and the final accuracy rate is the lowest among the three groups; because the InceptionV3 network is wider and deeper, the calculation amount is large, the increase in the accuracy of InceptionV3 and the decrease in cross entropy are relatively slow, and the time required to achieve stability is longer than that of other networks. The training curve fluctuates the most. Therefore, this paper proposes ResNet34 as the backbone network.
Compared with the single tomato disease ResNet34, the accuracy of disease diagnosis was improved after adding environmental data. It can be seen from the curve that both the single-modal and multi-modal models converge faster, and the curve of the Multi-ResNet34 model has less fluctuation and higher stability. By comparing and verifying the superiority of feature fusion according to different fusion positions, a total of two schemes of ResNet34 decision fusion and Multi-ResNet34 are set up for comparison experiments. Among them, the KNN model is used in the ResNet34 decision fusion model to train the environmental data, and the output results of the environmental model and the image model are fused at the decision level, and the predicted value of the text model and the predicted value of the single image model are averaged. The accuracy rates of the two models of ResNet34 decision fusion and Multi-ResNet34 on the test set are 98.1% and 98.9%, respectively. Observing the model training process in part B in
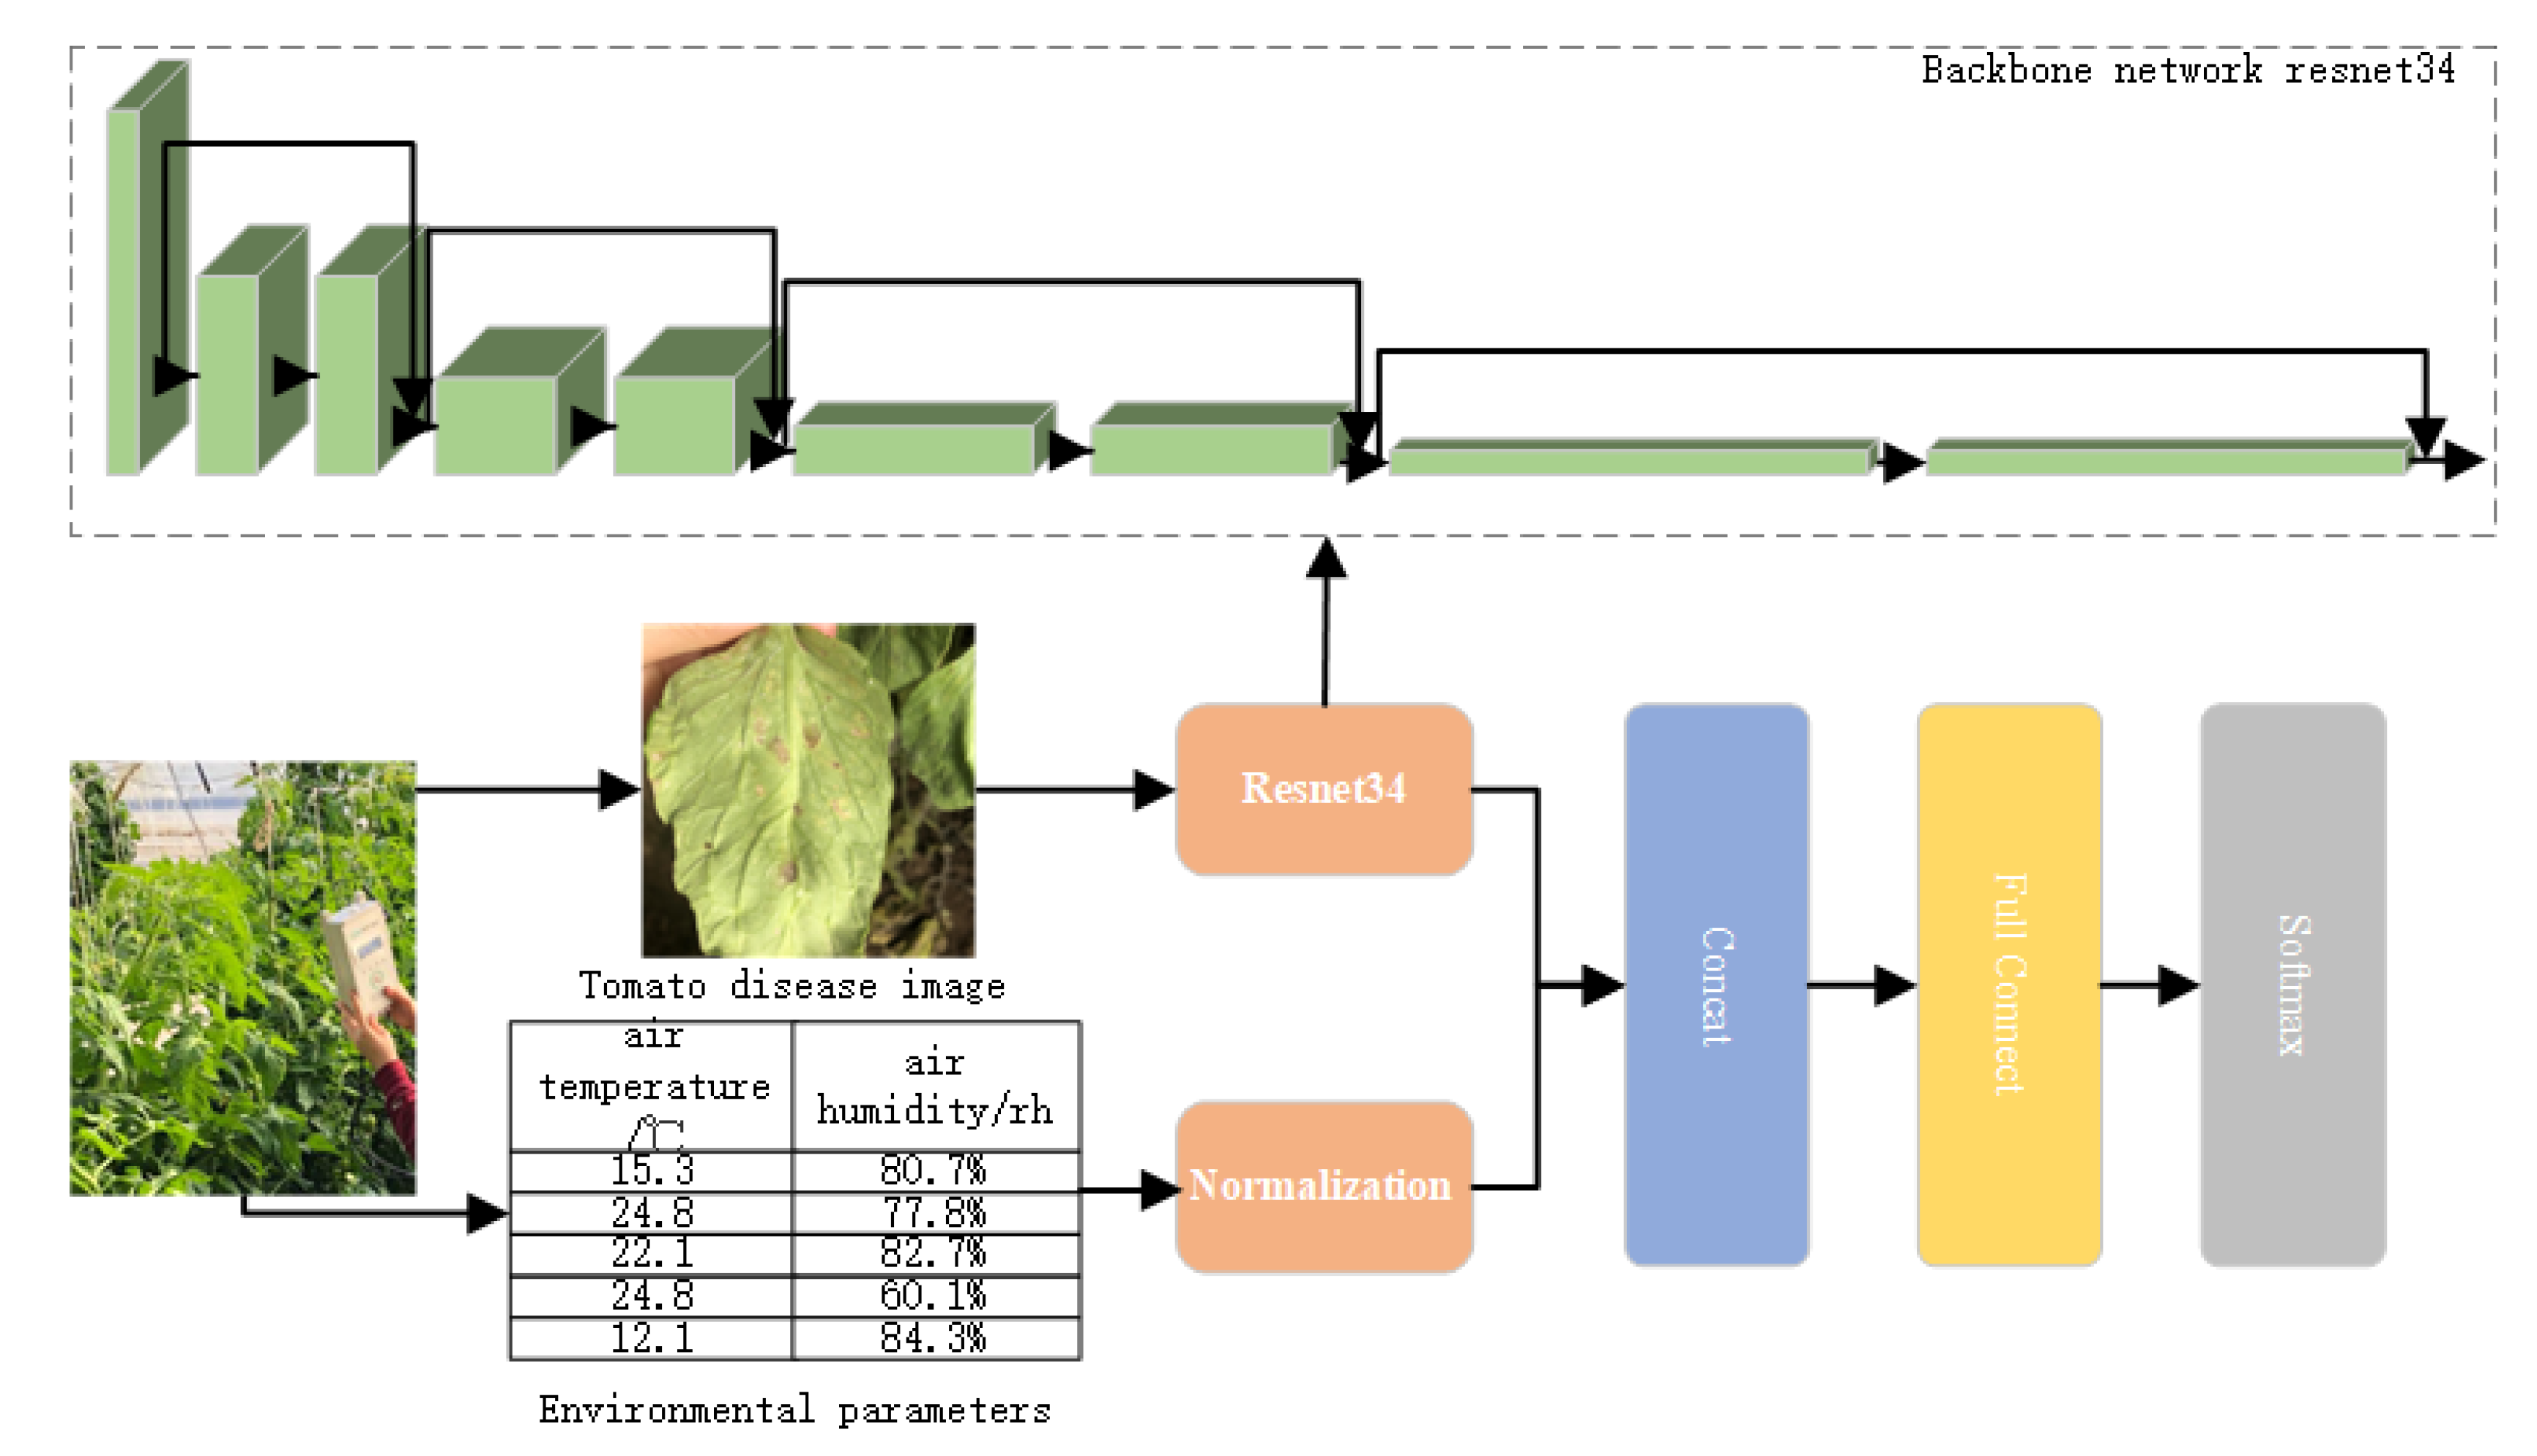
Figure 8, it can be seen that the Multi-ResNet34 model is more stable during training. This is because the complementarity between the model data improves the accuracy of the overall disease diagnosis. The image environment feature fusion model proposed in this paper considers the key information that affects the occurrence of diseases, the temperature and humidity information of the planting environment, uses ResNet34 to mine the disease information in the disease image, and fuses the environmental features and image features before making a decision. The recognition accuracy on the test set is 97.8%; the multimodal model has a recognition accuracy of 98.9% on the test set, and the accuracy is increased by 1.1%. The experimental results show that the introduction of the environmental temperature and humidity data feature fusion algorithm can significantly improve the accuracy of crop disease identification.
4. Conclusions
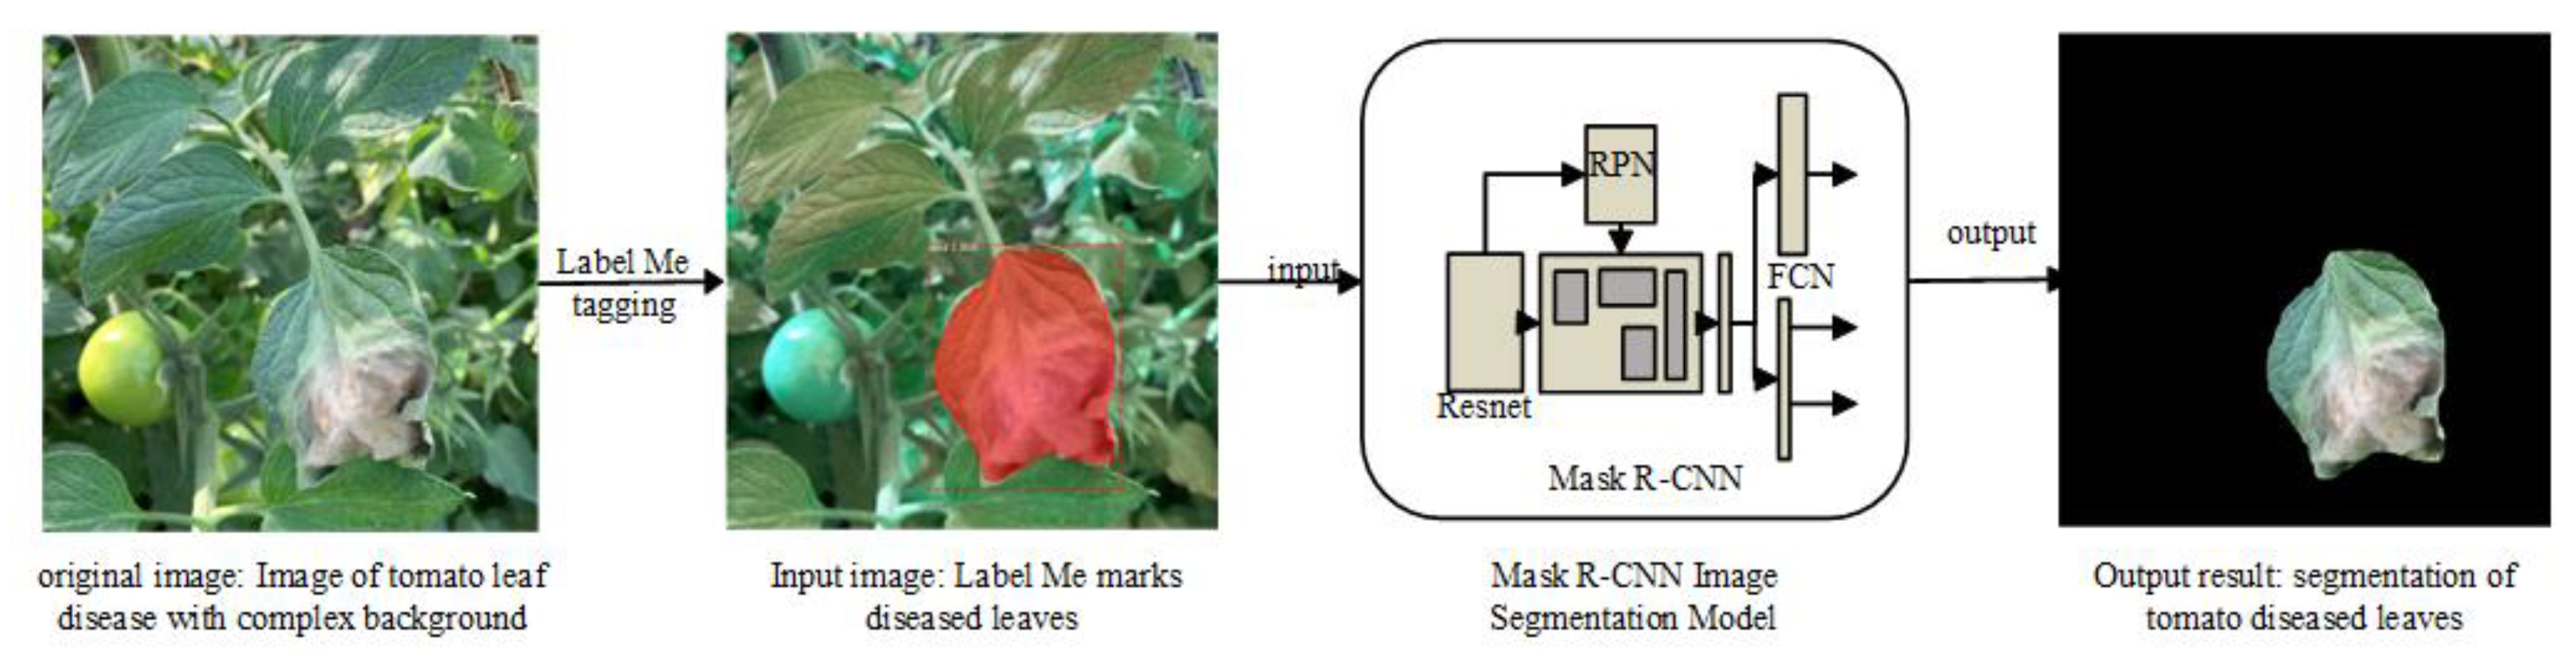
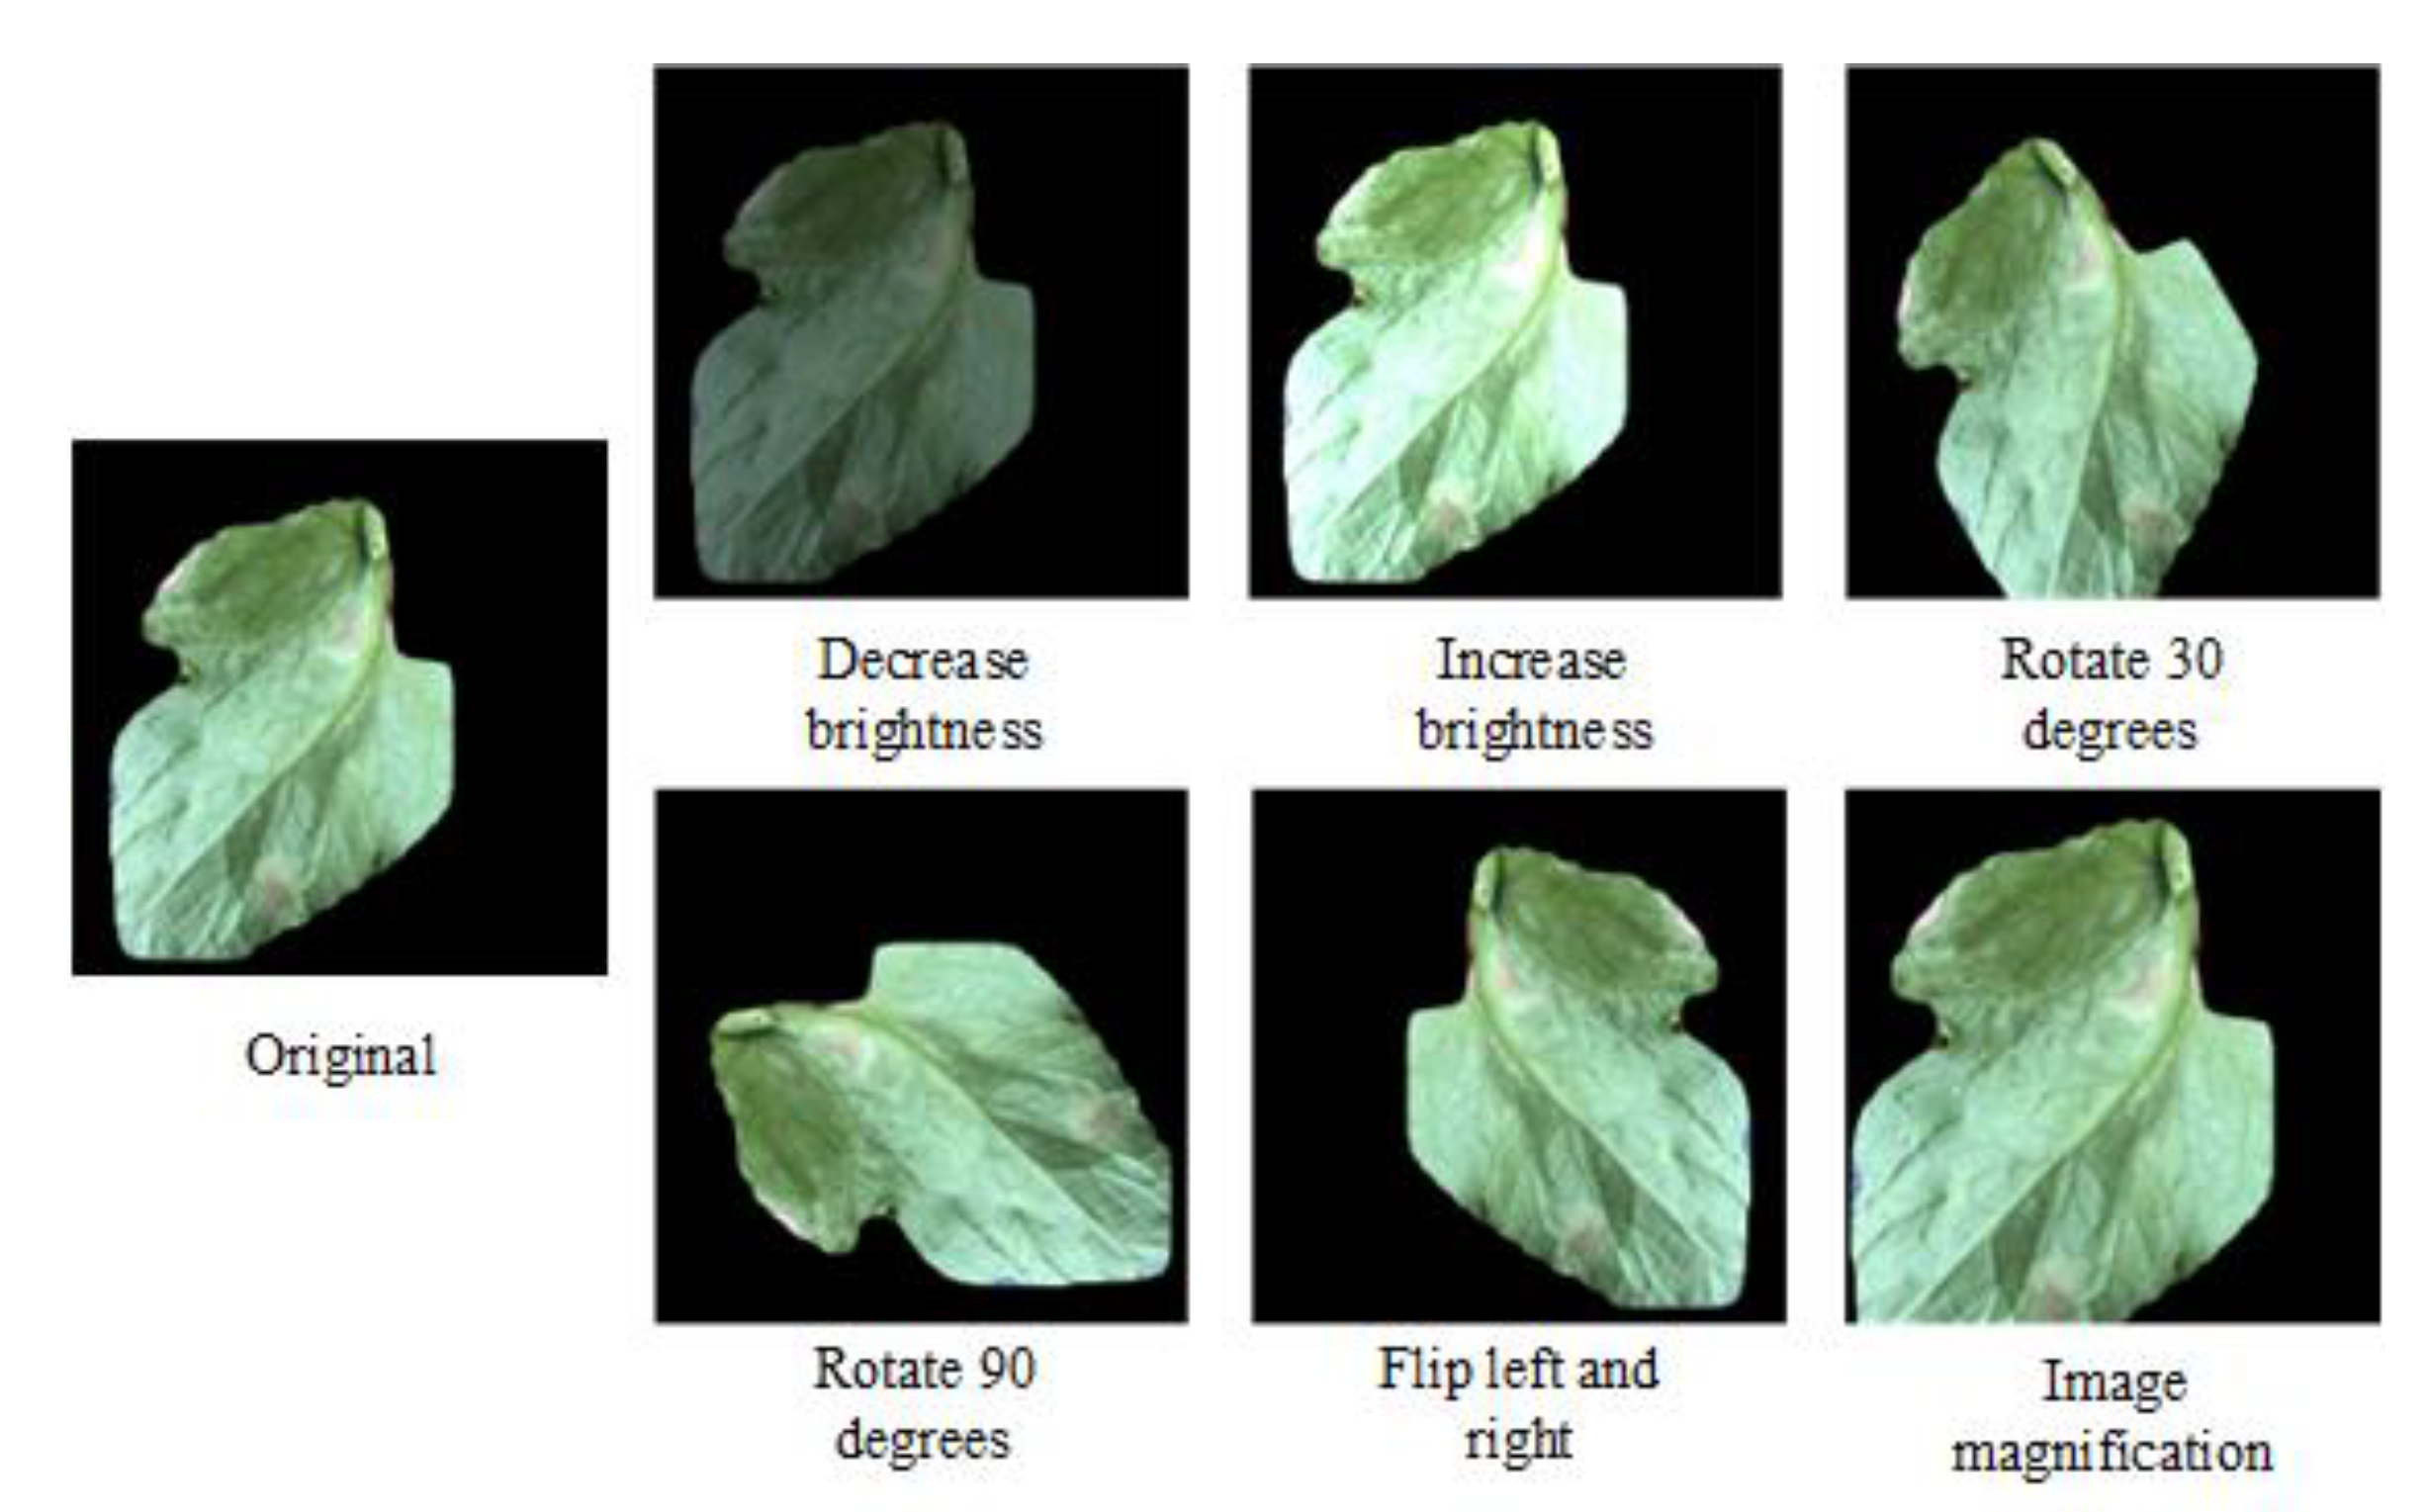
Timely identification of diseases is very important for agricultural production personnel. It can help agricultural practitioners to identify disease types in a timely manner, reduce the time required to consult experts on disease types, identify disease types more quickly and respond, and reduce economic losses caused by crop diseases. It is of great significance for agricultural production. The closed greenhouse and repeated planting of crops lead to overlapping of greenhouse crop diseases, which increases the difficulty of disease identification. Aiming at the problem that the accuracy of single modal data is limited in disease diagnosis, this paper proposes a disease recognition algorithm based on deep learning multi-modal feature fusion Multi-ResNet34 convolutional neural network model. Differences and complementarities improve the accuracy of disease diagnosis. The self-built bacterial spot disease, late blight, leaf mold, yellow smut, gray mold, and early blight image environment dataset of six types of tomato diseases are preprocessed by image segmentation and data enhancement methods to improve image recognition, efficiency, and increase the amount of data. The improved Multi-ResNet34 model has an accuracy of 98.9% in the classification of six tomato diseases, which is 1.1 percentage points higher than that of the single image recognition model, providing a certain reference for the diagnosis of greenhouse crop diseases under agricultural big data.


