Article

Performance Evaluation of Liquorice Harvester with Novel Oscillating Shovel-Rod Components Using the Discrete Element Method

1
College of Engineering, China Agricultural University, Beijing 100083, China
2
The Soil-Machine-Plant Key Laboratory of the Ministry of Agriculture of China, Beijing 100083, China
3
College of Agricultural Equipment Engineering, Henan University of Science and Technology, Luoyang 471023, China
*
Author to whom correspondence should be addressed.
Agriculture 2022, 12(12), 2015; https://doi.org/10.3390/agriculture12122015
Submission received: 1 November 2022 / Revised: 18 November 2022 / Accepted: 23 November 2022 / Published: 25 November 2022
(This article belongs to the Section Agricultural Technology)

Abstract

:
Liquorice harvesting is the key process in the development of the liquorice industry. For harvesting liquorice with about 400 mm growth depth, a lightweight harvester with novel oscillating shovel-rod components was developed. Draft force, total torque, specific energy consumption, separation proportion, and soil structure maintenance were used to evaluate harvester performance under varied working conditions, and throw intensity and total torque were analyzed. A DEM model was developed to simulate the excavation and separation of soil. Three sets of single-factor simulation tests and one set of field tests were conducted. The results indicated that: Each 1 mm increase in amplitude decreased draft force by 463.35 N and increased total torque and specific energy consumption by 35.03 Nm and 4.3 kJ/m3, respectively. Each 1 Hz increase in vibration frequency increased specific energy consumption by 3.12 kJ/m3, while draft force and total torque decreased by 375.75 N and 28.44 Nm, respectively. Each 0.1 m/s increase in forwarding speed increased the draft force, total torque and specific energy consumption by 1302.72 N, 13.26 Nm and 3.82 kJ/m3, respectively. The main separation areas of the shovel-rod were front areas, where the soil separation proportion is greater than 60%, and the soil was completely separated at the end areas. The soils after harvesting had a relatively minimal disturbance in all layers, with soil structure maintenance greater than 0.61, and soil structure was well maintained. The liquorice plants were separated from the soil after passing smoothly through the oscillating shovel-rod components, during which the soil at different layers fell in sequence. This study revealed the interactive relationship between working components and soil, specifically the potential to maintain soil structure after harvesting. This new finding will assist in developing harvest techniques for rhizome crops with deep growth depth.

1. Introduction

Liquorice is one of the most popular Chinese herbs in China, which has medicinal value [1,2]; it is also an edible and forage resource plant, commonly used for soil improvement in arid areas [3]. In China, liquorice is cultivated using two methods, direct-seeding and transplanting, and tilted transplanting (with about 350–400 mm depth) is becoming more common due to relatively low harvesting difficulty, while direct-seeded liquorice can grow to over 600 mm depth. The main harvesting methods are currently manual picking after ploughing or harvesting with excavators. Excavators, which consist of a shovel and a lifting chain, are similar to potato harvesters in that soil and tuber are separated primarily through the chain [4].
Harvesting machinery for root crops (such as potato, carrot, onion, and sweet potato) has a long history and many varieties. In recent years, root crop harvesting research has focused on structural improvement, parameter optimization, and performance enhancement. Yang et al. [5] developed a novel harvester by combining the excavation shovel and poking roller to reduce potato skin-damage rate. Zhang et al. [6] designed a potato harvester using an excavating mechanism and a multi-stage separation buffer device. Naik et al. [7] developed a tractor-operated onion digger with a bar-topping unit and optimized independent parameters by using a central composite design. Tao et al. [8] developed a combined swing root-soil separation device for the root for Radix isatidis (Banlangen) and optimized the device’s structure and working parameters. Yang et al. [9] designed a hydraulic suspended single-row yam harvester with a grid vibratory digging shovel structure that can separate soil and yams quickly and efficiently. Wei et al. [10] designed a potato harvester with double cushions at a low position laying stage and improved the harvesting efficiency and reduced losses.
However, several root crop harvesting issues should be addressed, such as high resistance, low harvesting efficiency, high energy consumption, and a large mixture of different soil layers, especially when harvesting at a deep depth. Several technical solutions (such as vibration, bionics and surface coating) have been used to reduce the cultivation machinery’s resistance and improve its performance. Wang et al. [11] studied the interaction of soil and vibrating tools and showed that a vibrating subsoiler could destroy soil internal forces more effectively than a rigid one and reduce draft force. Shahgoli et al. [12] shown that oscillation of tillage tools can effectively reduce draft force and power requirement while increasing soil breakage and loosening efficiency. Sun et al. [13] designed a new soil plowing device by imitation of the low-resistance bear claws, and it was experimentally proved that the power and specific energy consumption of a bionic ditcher are smaller than for a traditional ditching blade. Song et al. [14] developed a bionic subsoiler by combining a mole’s claw with a standard subsoiler structure, which improved the soil breakage effect at the plough’s bottom and decreased the draft force significantly. Mehrang Marani et al. [15] studied the performance of hydrophobic surfaces and roughness at the nanoscale, which substantially reduced soil adhesion and external friction compared to steel. Guan et al. [16] modified the surfaces of bionic cutter teeth with an anti-adhesion material coating and concluded that the coating avoided tool surface abrasion and lowered energy consumption and soil adhesion. Mechanical vibration is an effective technical method for improving harvester performance [17], especially for excavating and harvesting from deep soil. Another benefit of utilizing an oscillating shovel in a root crop harvester is that it increases root-soil aggregate fragmentation and reduces crop damage.
Soil disturbance is a concern in soil tillage. Previous studies have shown that appropriate disturbance can improve the quality of the field [18,19,20], but too much surface disturbance will destroy the cultivated-layer structure and reduce production capacity, especially when the tillage depth is deeper than the plough pan. Deng et al. [21] found that low-disturbance soil tillage significantly promoted the richness and diversity of soil bacterial species and enhanced the soil’s water- and nitrogen-holding capacity. Wang et al. [22] showed that reduced tillage soil disturbance was beneficial to the maintenance and development of soil microbial communities and enhanced crop yields.
The discrete element method (DEM) has been widely used to investigate the interaction of soil and tillage tools, such as analyzing soil deformation and movement [23,24], estimating tillage resistance and energy consumption [25], optimizing the structure [26], and evaluating working performance [27,28,29]. Hou et al. [30] developed a soil-shaking device for onion excavation and employed a DEM model of soil (without onion) to investigate the effects of soil deflection and soil particle flow. Awuah et al. [31] developed a DEM model of soil (without chrysanthemum) to optimize the vibratory digging shovel for chrysanthemum. The contact model needs to be selected according to the actual condition. The hysteresis spring-linear cohesive contact model was used to efficiently simulate the loose clay soils with different water contents [32]. The Hertz-Mindlin model with the JKR extension was used to simulate and analyze the width of subsoiler disturbance at different depths and soil structures with different moisture contents [33]. Zhang et al. [34] applied the Hertz Mindlin with bonding (HMB) model (simulating the bonding force characteristics between cohesive soil particles) to carry out the optimal design of a subsoiler for a tea garden. The EEPA contact model contains a nonlinear hysteretic spring model and considers compressibility, stickiness, and nonlinear behavior of cohesive solids between particle-to-particle and particle-to-geometry interactions [35].
A lightweight harvester with novel oscillating shovel-rod components was developed to harvest liquorice efficiently with less soil mix from different layers. The objective of this study was to develop a DEM model using the Edinburgh Elasto-Plastic Adhesion (EEPA) contact theory to simulate soil excavation and separation and to conduct three sets of single-factor simulation tests and one set of field tests. The working process was assumed to be a two-stage cycle with cutting and lifting to explain the liquorice harvester working process, and to investigate soil movement and interaction of the shovel-rod with the soil. Combined simulation and field test results to analyze draft force, total torque, specific energy consumption, separation ratio and soil structure maintenance. This study proposed a method for evaluating the working performance of liquorice harvesters, which can comprehensively assess the working performance and operational effectiveness of rhizome crop harvesters.

2. Materials and Methods

2.1. Liquorice Harvester with Oscillating Shovel-Rod Components

As shown in Figure 1, the liquorice harvester is composed of a drive system, four excitation devices (each with an eccentric shaft, connecting rod, and pendulum rod, using a crank-rocker mechanism), three shovel-rod components (each with a shovel frame, excavation shovel, and separating rods), and a frame. The middle shovel-rod component is driven by two intermediate excitation devices and swings with the pendulum, moving in the opposite direction to the left and right ones. When the harvester moves forward, the soil flow excavated by the oscillating shovel-rod moves backwards and is crushed by the separating rods, after which the soil falls through the rods and the liquorice roots slide smoothly along the rods to the soil surface.

2.2. Kinematics and Dynamics Analysis

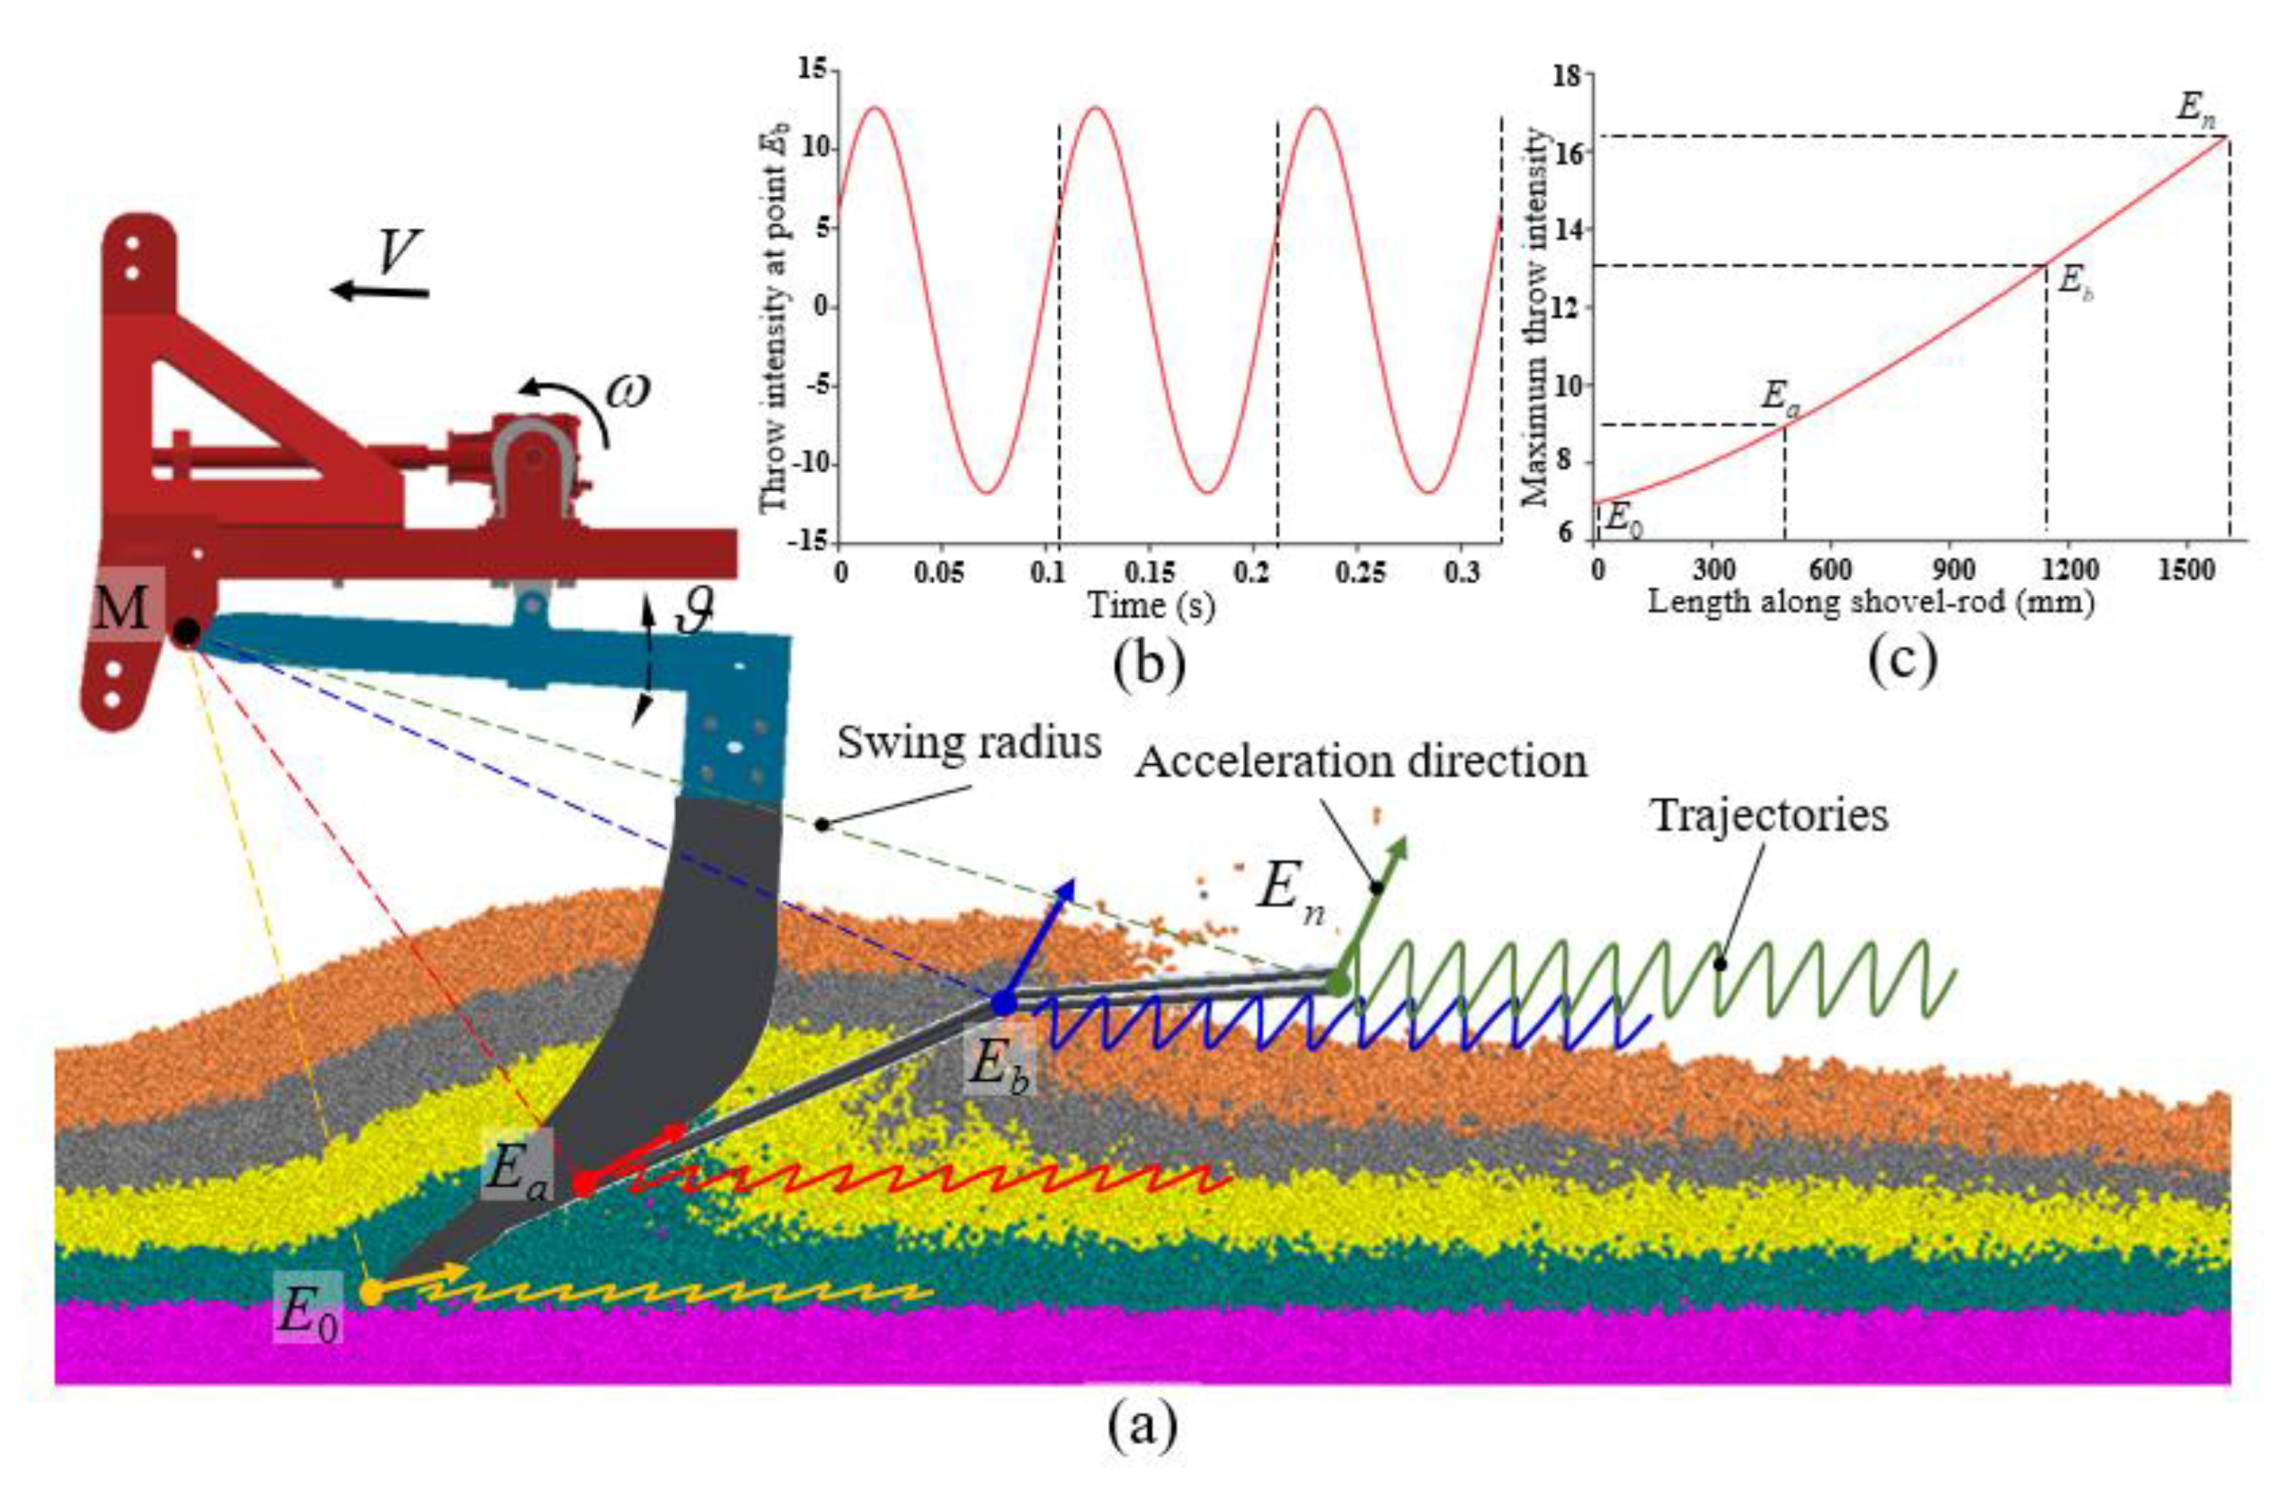
2.2.1. Throw Intensity of the Shovel-Rod

Throw intensity is the ratio of the material particles’ vibration acceleration perpendicular to the working surface to the gravity acceleration (reference study [36]), the movement analysis of the shovel-rod as shown in Figure 2. L1 is 9 mm, L2 is 260 mm, L3 is 534.6 mm, and L4 is 628.7 mm. Using point M as the origin, point A coordinates (530, 326) and point E0 (the shovel tip) coordinates (648, −704). Any point on the shovel-rod marked as Ei. Assume that the coordinates of point A are (xa, ya) and the coordinates of point M are (xm, ym); the angle δ (between BM and x-axis) is calculated by Equation (1).
δ = tan 1 ( y A   L 1 sin θ 1   y M x A + L 1 cos θ 1   x M )
Angle θ3 is calculated by Equation (2).
θ 3 = δ cos 1 ( L 5 2 + L 3 2 L 2 2 2 L 5 L 3 )
Δθ3 (the angle change of θ3) is calculated by Equation (3).
Δ θ 3 = θ 3 θ 30
ε3 (swing angular acceleration of CM) is calculated by Equation (4):
ε 3 = d 2 θ 3 d t 2
At point Ei, the inclination of the shovel-rod is calculated by αi = α0 + Δθ3 (xi ∈ [648, 1720], α0 = 25°; xi ∈ [1720, 2212], α0 = 7°). Then, the y-coordinate of point Ei can be calculated by Equation (5).
y = tan α i x i L 0 sin θ 0 + Δ θ 3 + L 0 cos ( θ 0   + Δ θ 3 )
where xi ∈ [x0, xn], mm.
βi (vibration direction angle of point Ei) is calculated by Equation (6):
β i = arctan x i y i α i
LE0Ei (the length of point E0 to Ei) is calculated by Equation (7):
L E 0 E i = x i x 0 2 + y i y 0 2
Li (the swing radius of point Ei) is calculated by Equation (8):
L i = L 0 2 + L E 0 E i 2 2 L 0 L E 0 E i · cos π 2 + β 0
where β0 is the initial vibration direction angle of point E0, (°).
Tangential acceleration ati at any point on the shovel-rod is much greater than the normal acceleration ani, when f is 7.8–11 Hz; the swing acceleration ai at this point is simplified to tangential acceleration ati, calculated by Equation (9):
a i = a t i = L i ε 3
Ki (the throw intensity of point Ei) is calculated by Equation (10), and the harvester working characteristics are shown in Figure 3.
K i = a i g = L i ε 3 g

2.2.2. Total Torque

Shovel-rods were subjected to complicated soil forces and group interactions during harvesting. The torques of the shovel-rod and connecting rod were balanced at the pendulum pins. As shown in Figure 4, total torque combined from the torques of four excitation devices (i.e., the torques of connecting rods varied periodically) is calculated by Equation (11):
T q = T a + T b + T c T d
Working parameters of liquorice harvester such as amplitude, vibration frequency, and forward speed were identified as key performance indicators based on kinematic and dynamic analysis, and the effect of each parameter on the harvesting was then investigated using single-factor tests.

2.3. Discrete Element Models

2.3.1. DEM Model of Soil Bin

Discrete Element Method (DEM) is a mathematical approach for evaluating soil-tool interactions. The soil’s stress transmission and dynamic behaviour were evaluated by variations in force and velocity of soil particles [37]. The soil in the soil bin should be considered as discontinuous medium divided into several layers to assess post-harvest soil disturbance [38]. The study focused on the interaction between the shovel-rod and soil and the changes in soil structure after the operation. Thus, a DEM model of the soil bin (without the liquorice) was developed to evaluate the working performance of the liquorice harvester. The EEPA contact model contains seven model parameters that simulate the loading, unloading, reloading and re-unloading of the normal bond between particles, which can be used to simulate soils’ cohesive, elastic and plastic properties. In this study, the EEPA contact model was used for the inter-particle contact model and Hertz-Mindlin (no-slip) model was used for the contact between soil and shovel-rod. The material, particle properties, and contact parameters of the simulation model were set according to references [39], and the accuracy of parameters was preliminarily verified by simulation pre-test, as shown in Table 1.

2.3.2. DEM-MBD Model

The discrete element method (DEM) and multibody dynamics (MBD) coupling methods were used to simulate the harvester’s excavation and separation of soil. First, creating a 3D model of a liquorice harvester using design software Inventor 2018 (Autodesk, San Francisco, CA, USA). Then, importing the model into RecurDyn V9R2 (FunctionBay, Gyeonggi-do, Korea) software to create the MBD model and generate the WALL file. Liquorice harvester’s WALL file was finally imported into EDEM (DEM Solution, Edinburgh, UK) software to generate the DEM-MBD simulation model (Figure 5). The EDEM 2020 software is operating on a simulation platform with a Windows 10 64-bit system (CPU: Intel(R) Xeon(R) Gold 6226R, 2.90 GHz, dual CPU, 64 cores; GPU: NVIDIA GeForce RTX 3080). The single sphere was used to fill a virtual soil bin that was 5500 mm long, 1600 mm wide, and 650 mm tall, and the total mass of the generated particles was 7535 kg.

2.4. Test Design

2.4.1. Simulation Test

The excavation depth of the liquorice harvester was determined to be 400 mm, according to the growth depth of the liquorice (about 350 to 400 mm, using tilted transplanting method, in Ningxia, China). Three single-factor tests were performed to assess the influence of amplitude, vibration frequency and forward speed at three levels, respectively, by varying one of the parameters and fixing the others with median. According to the preliminary field test results of the liquorice harvester, the factors and levels were determined, as shown in Table 2. Draft force, total torque, specific energy consumption, separation proportion, and soil structure maintenance were used to evaluate harvester performance under varied working conditions.

2.4.2. Field Test

To evaluate the harvesting effect of the harvester and the movement of soil, one set of field tests was carried out at a cultivation base (Yanchi, Ningxia, China, 37°52′ N, 107°22′ E) using a liquorice harvester (4GSZ-145, developed by our research team), as shown in Figure 6. In the test field (75 m length, 60 m width), the soil is grey calcium soil with a moisture content of 7.76% and a compaction of 2150–3208 kPa.
The field test used a John Deere 1404 tractor as the drive tractor, connected to the liquorice harvester by a three-point suspension. According to the pre-test results, the working parameters were selected as follows: amplitude 9 mm, vibration frequency 9.4 Hz, forward speed 0.39 m/s and excavation depth 400 mm. The marker was fixed to the top of the liquorice before the harvesting, and a camera was applied to record the spatial location variations of the maker.

2.5. Index Measurement

Export test data result from simulation analysis from EDEM software processing interface and RECURDYN software plotting interface; simulation test indexes were given as follows:
(1)
Draft force is extracted from the driving force dataset of translated motion by RECURDYN software. The mean value of the draft force is the average value of the draft force during the stable working section.
(2)
Total torque is extracted from the driving torque dataset of torque motion by RECURDYN software. The mean value of total torques is the average value of the torques during the stable working section.
(3)
Specific energy consumption (Pw) is the energy required by the harvester to process a unit volume of soil; Pw (kJ/m3) is calculated by Equation (12):
P W = 1000 F q ¯ D · B · t + 1000 T q ¯ · n 9.55 · V · D · B · t
where ( F q ¯ ) represents the mean value of draft force which is calculated from the draft force dataset, N; ( T q ¯ ) represents the mean value of total torque which is calculated from the total torque dataset for values greater than 0, Nm; n is the crank rotational speed, r/min; B is the working width, mm; D is the excavation depth, mm; t is the working time, s; V is the forward speed, m/s.
(4)
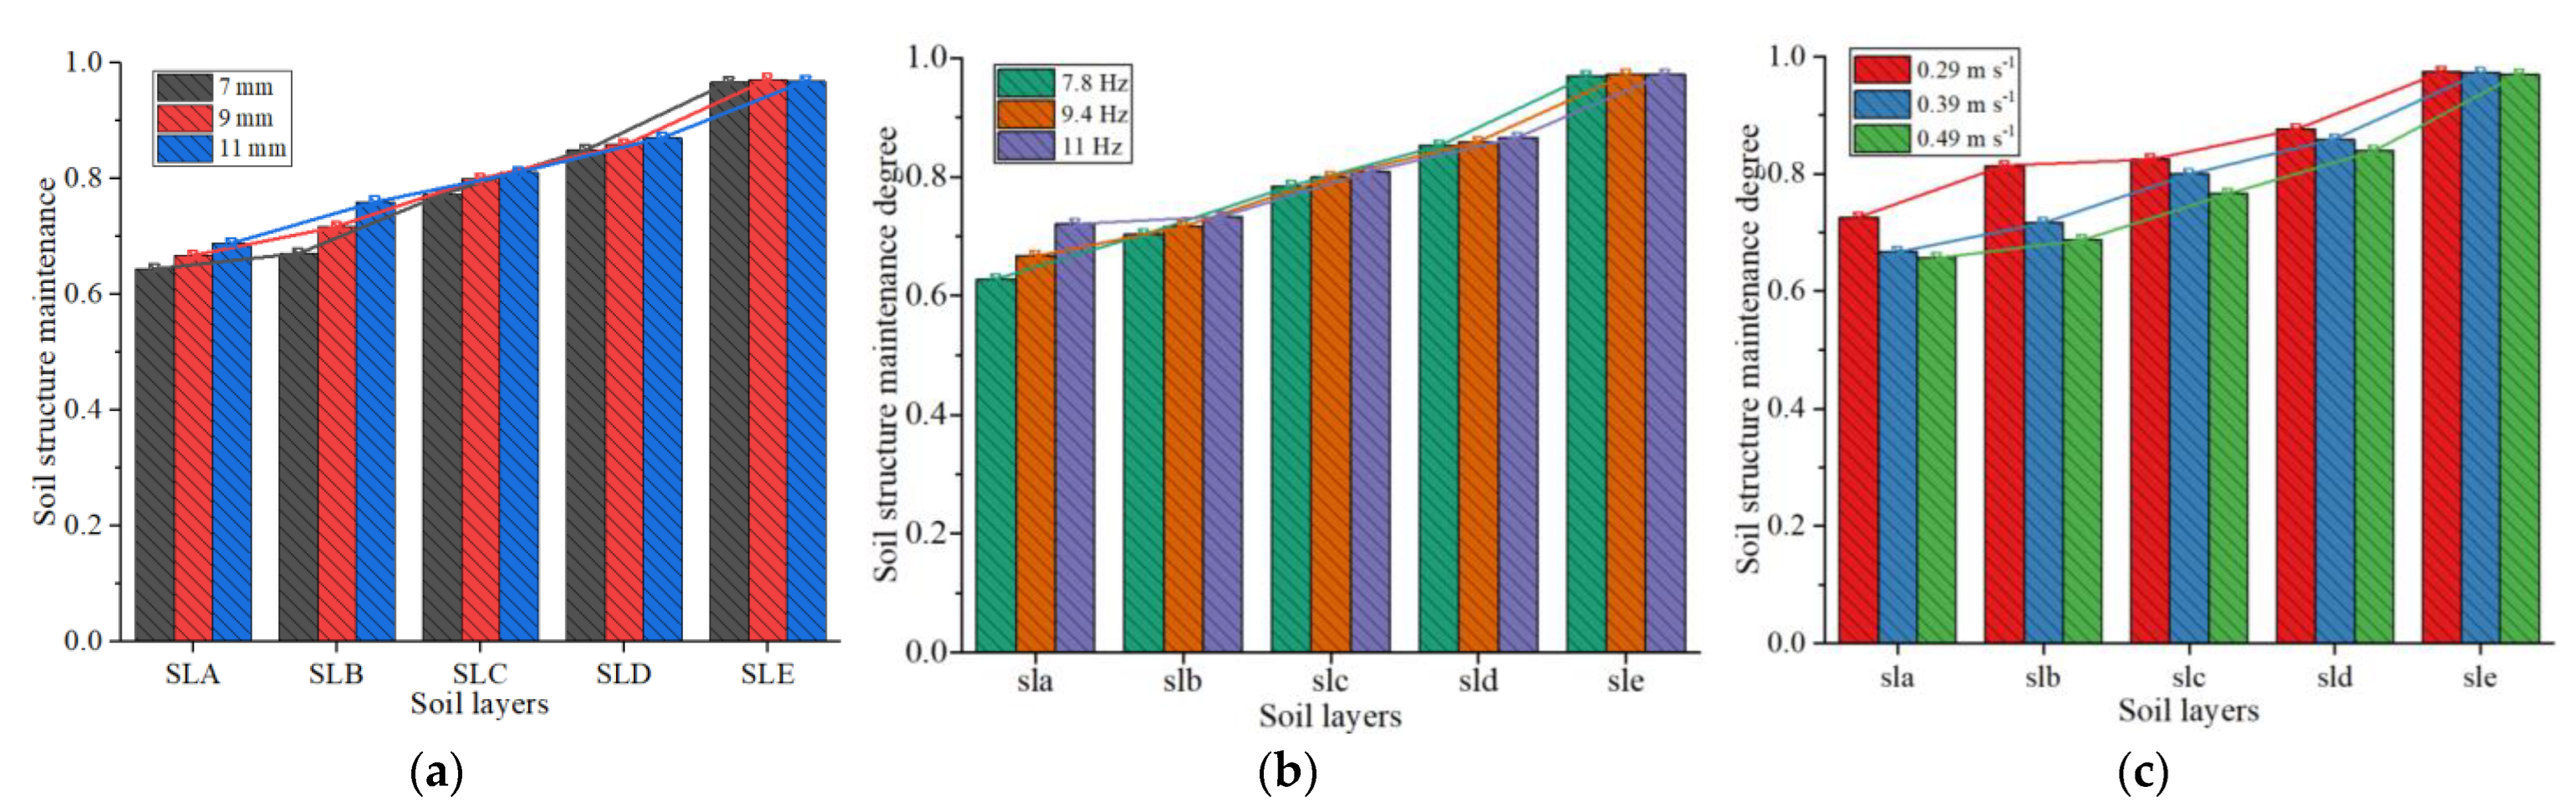
Soil structure maintenance (Csi) is an index to assess the soil layer structural change before and after the operation (Figure 7). The virtual soil bin model was divided into five layers, including SLA (0–100 mm), SLB (100–200 mm), SLC (200–300 mm), SLD (300–400 mm) and SLE (>400 mm). The variation of soil particle mass in each layer of operational stability section was recorded by a total mass sensor, and the total mass before operation was recorded as mbi (i = 1, 2, 3, 4, 5) and after operation as mai (i = 1, 2, 3, 4, 5). Csi is calculated by Equation (13):
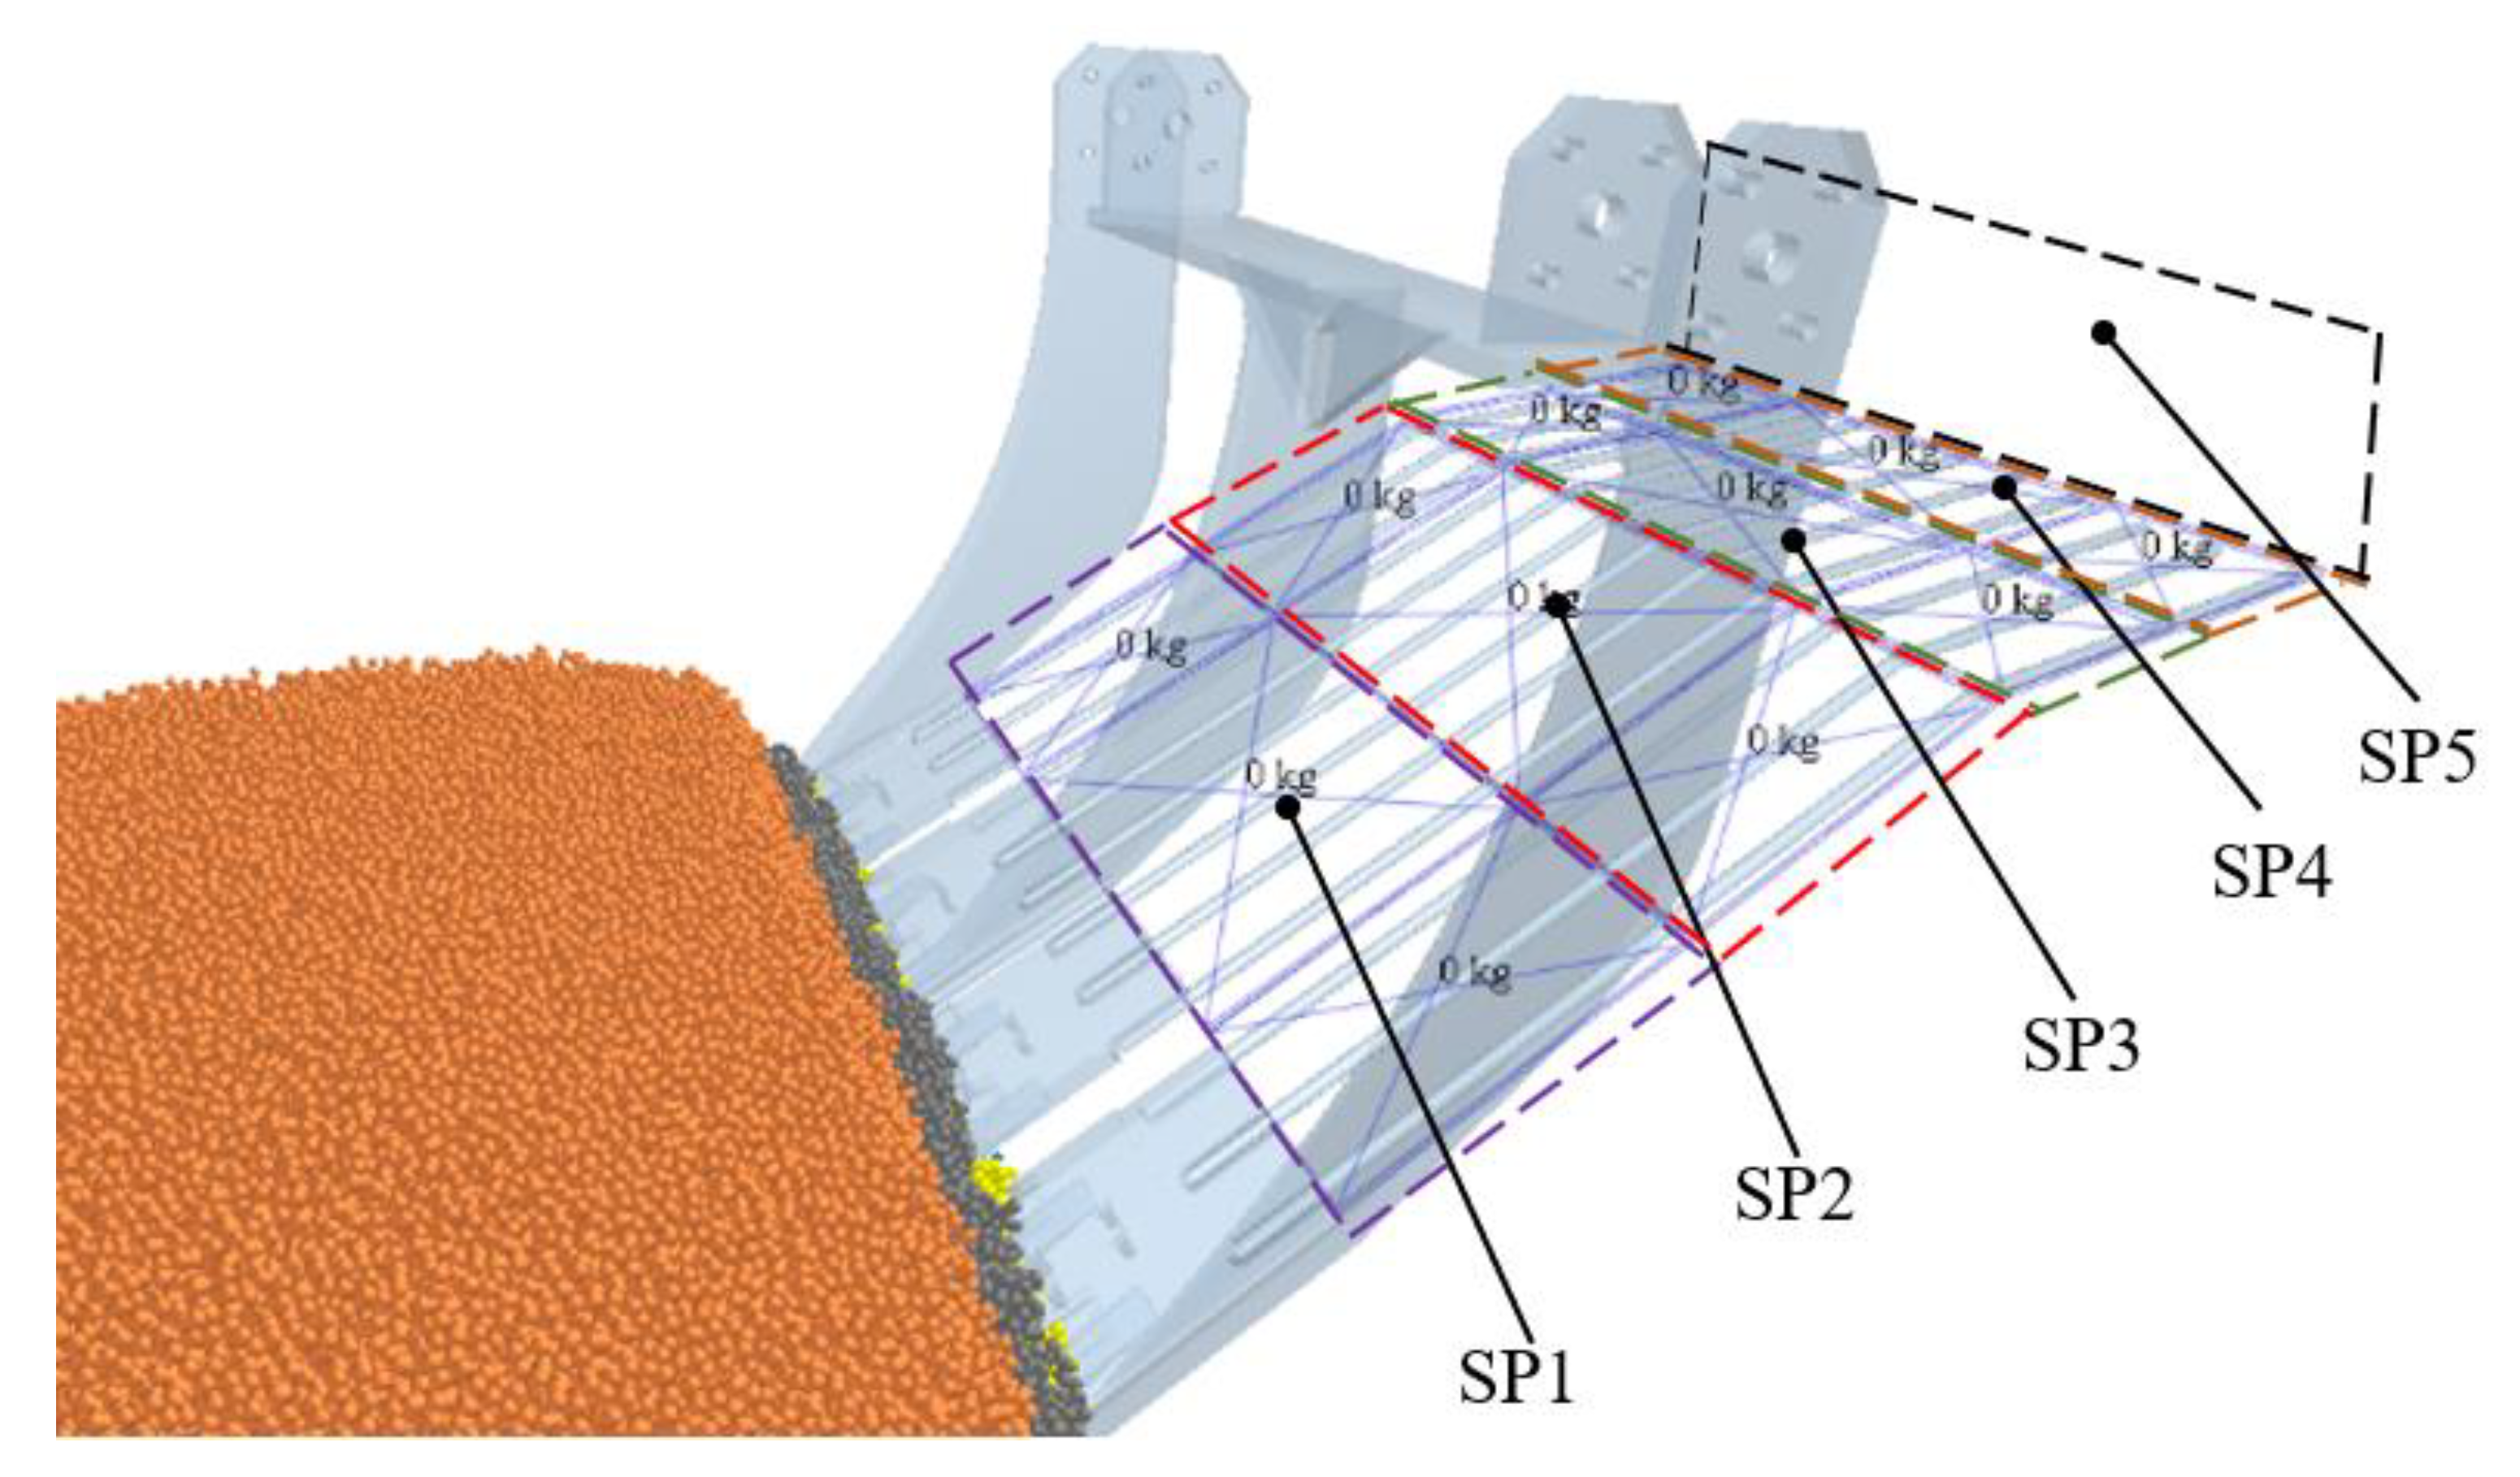
C s i = m b i m a i
(5)
Separation proportion (Qk) is an index to assess the ability of the liquorice harvester to separate the soil. The rods were divided into five quality monitoring areas, including SP1, SP2, SP3, SP4 and SP5 (Figure 8), which used a follower total mass sensor to record the separated soil mass in each monitoring area during the operational stability section, noted as mk (k = 1, 2, 3, 4, 5). The percentage of separated soil quality in each area to total treated mass is defined as Qk, calculated by Equation (14):
Q k = m k k = 1 5 m k ×   100 %

3. Results and Discussion

3.1. Analysis of Draft Force and Total Torque
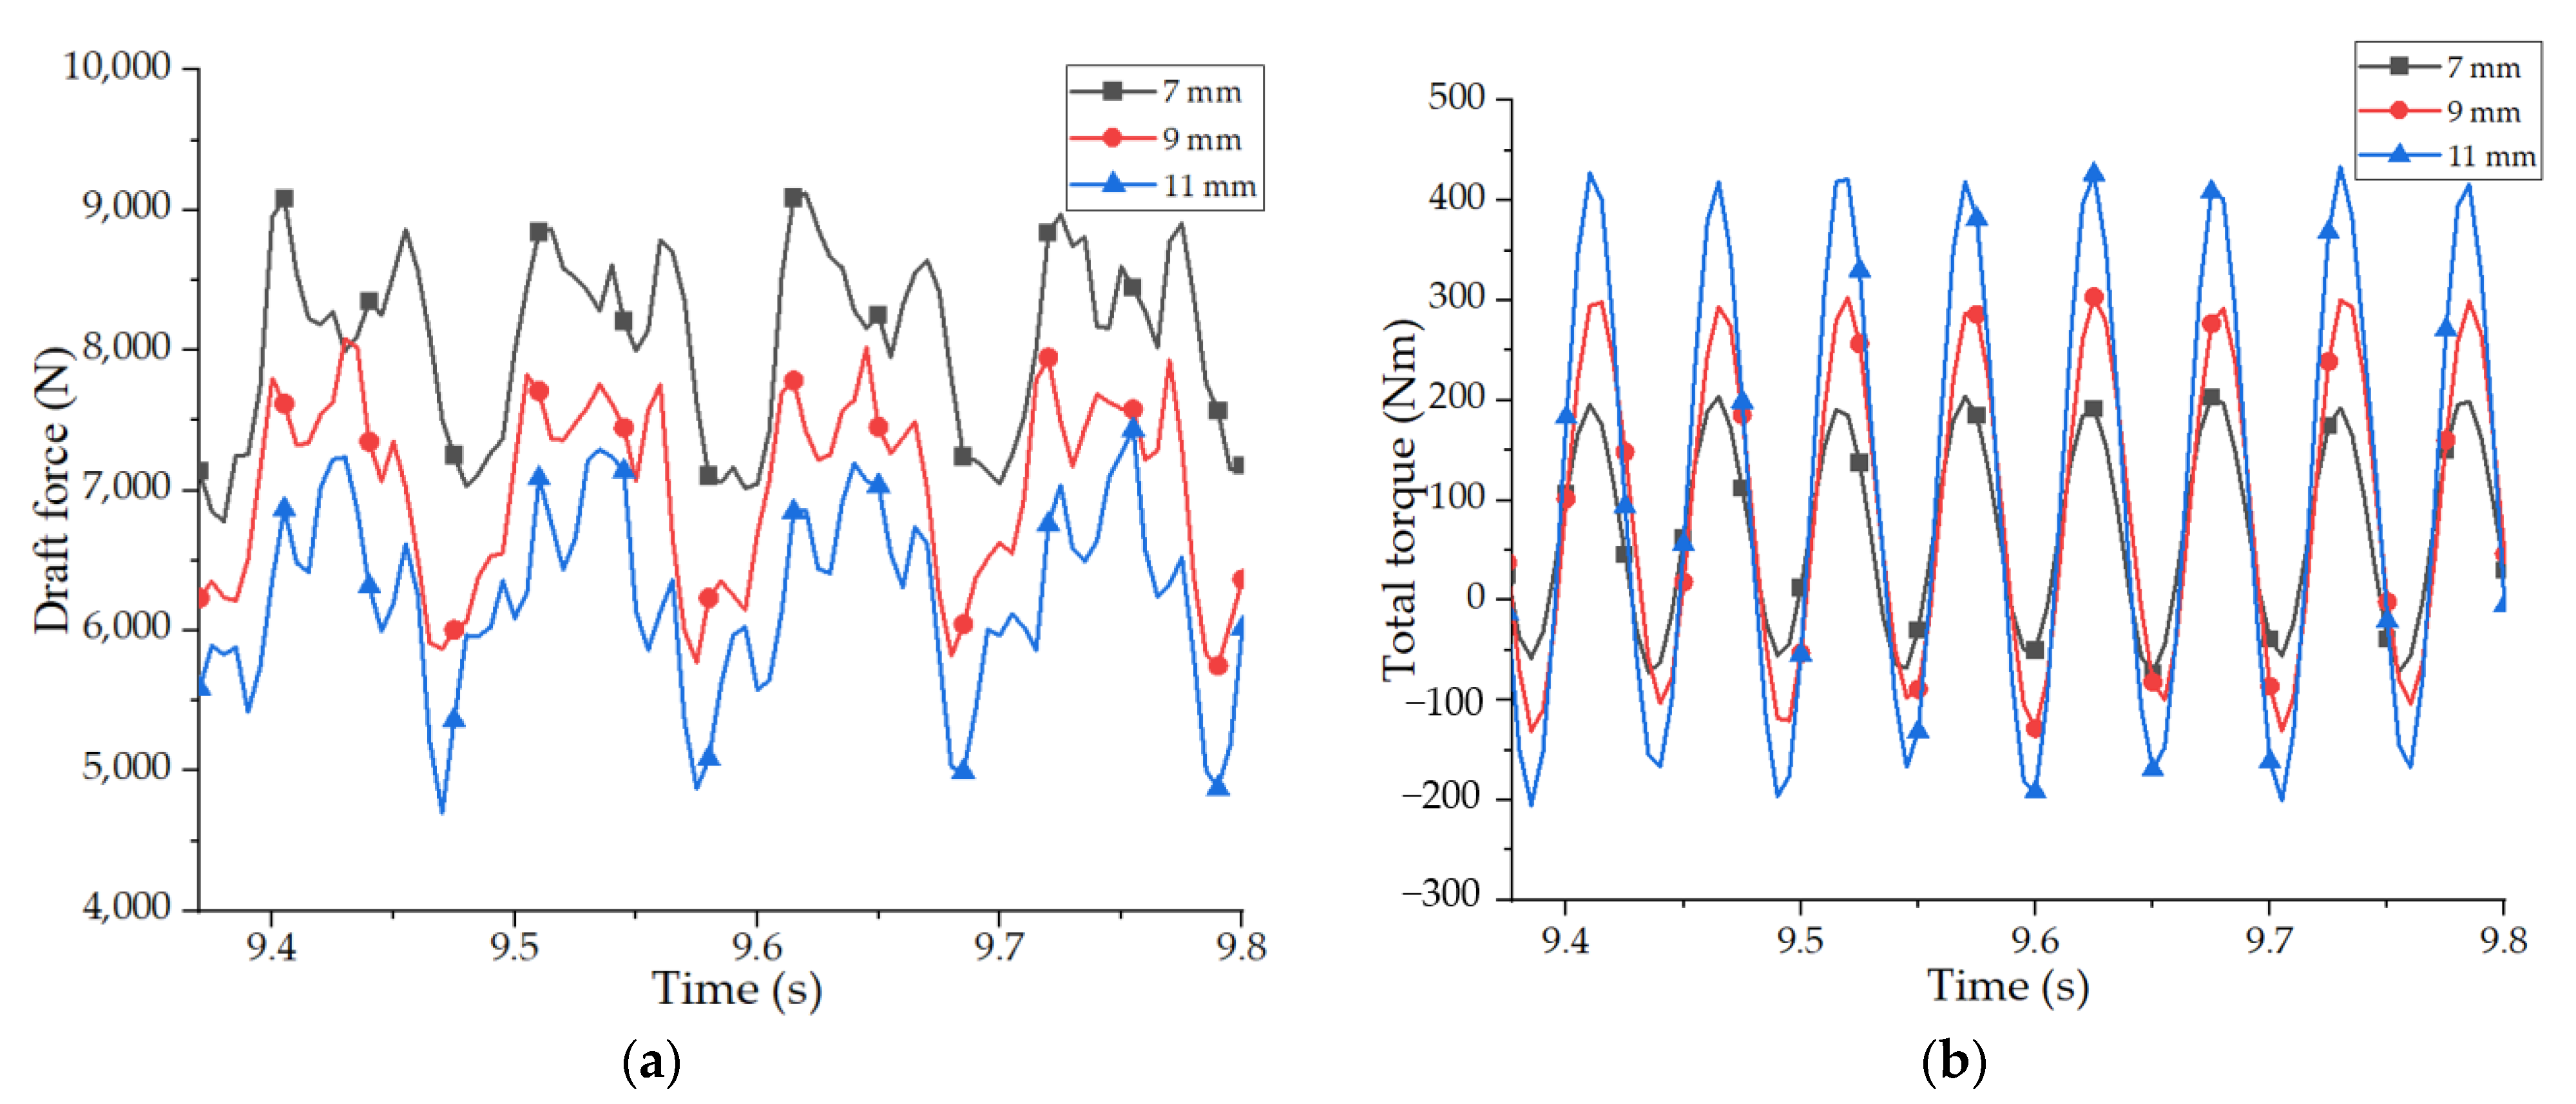
3.1.1. Amplitude

The amplitude had a significant effect on the draft force and total torque. Figure 9 shows the relationship between draft force, total torque, and amplitude, which amplitude has different values with a fixed forward speed (0.39 m/s) and vibration frequency (9.4 Hz). As the amplitude increased, the draft force gradually decreased, and the total torque gradually increased. When the amplitude was 7 mm, the shovel-rod oscillation was small, and the throwing effect on the soil above was weak, resulting in a large draft force (mean value 8156.99 N) and a small total torque (mean value 121.49 Nm). As the amplitude increased to 9 mm, the shovel-rod oscillated more violently, the throwing effect on the soil above increased, the mean value of draft force decreased to 7085.29 N, and the mean value of total torque increased to 183.52 Nm. When the amplitude was 11 mm, the shovel-rod oscillated the most, and the soil above was strongly thrown, resulting in a smaller draft force (mean value 6303.61 N) and a larger total torque (mean value 261.59 Nm). Each 1 mm increase in amplitude decreased the mean draft force by 463.35 N and increased the mean total torque by 35.03 Nm.

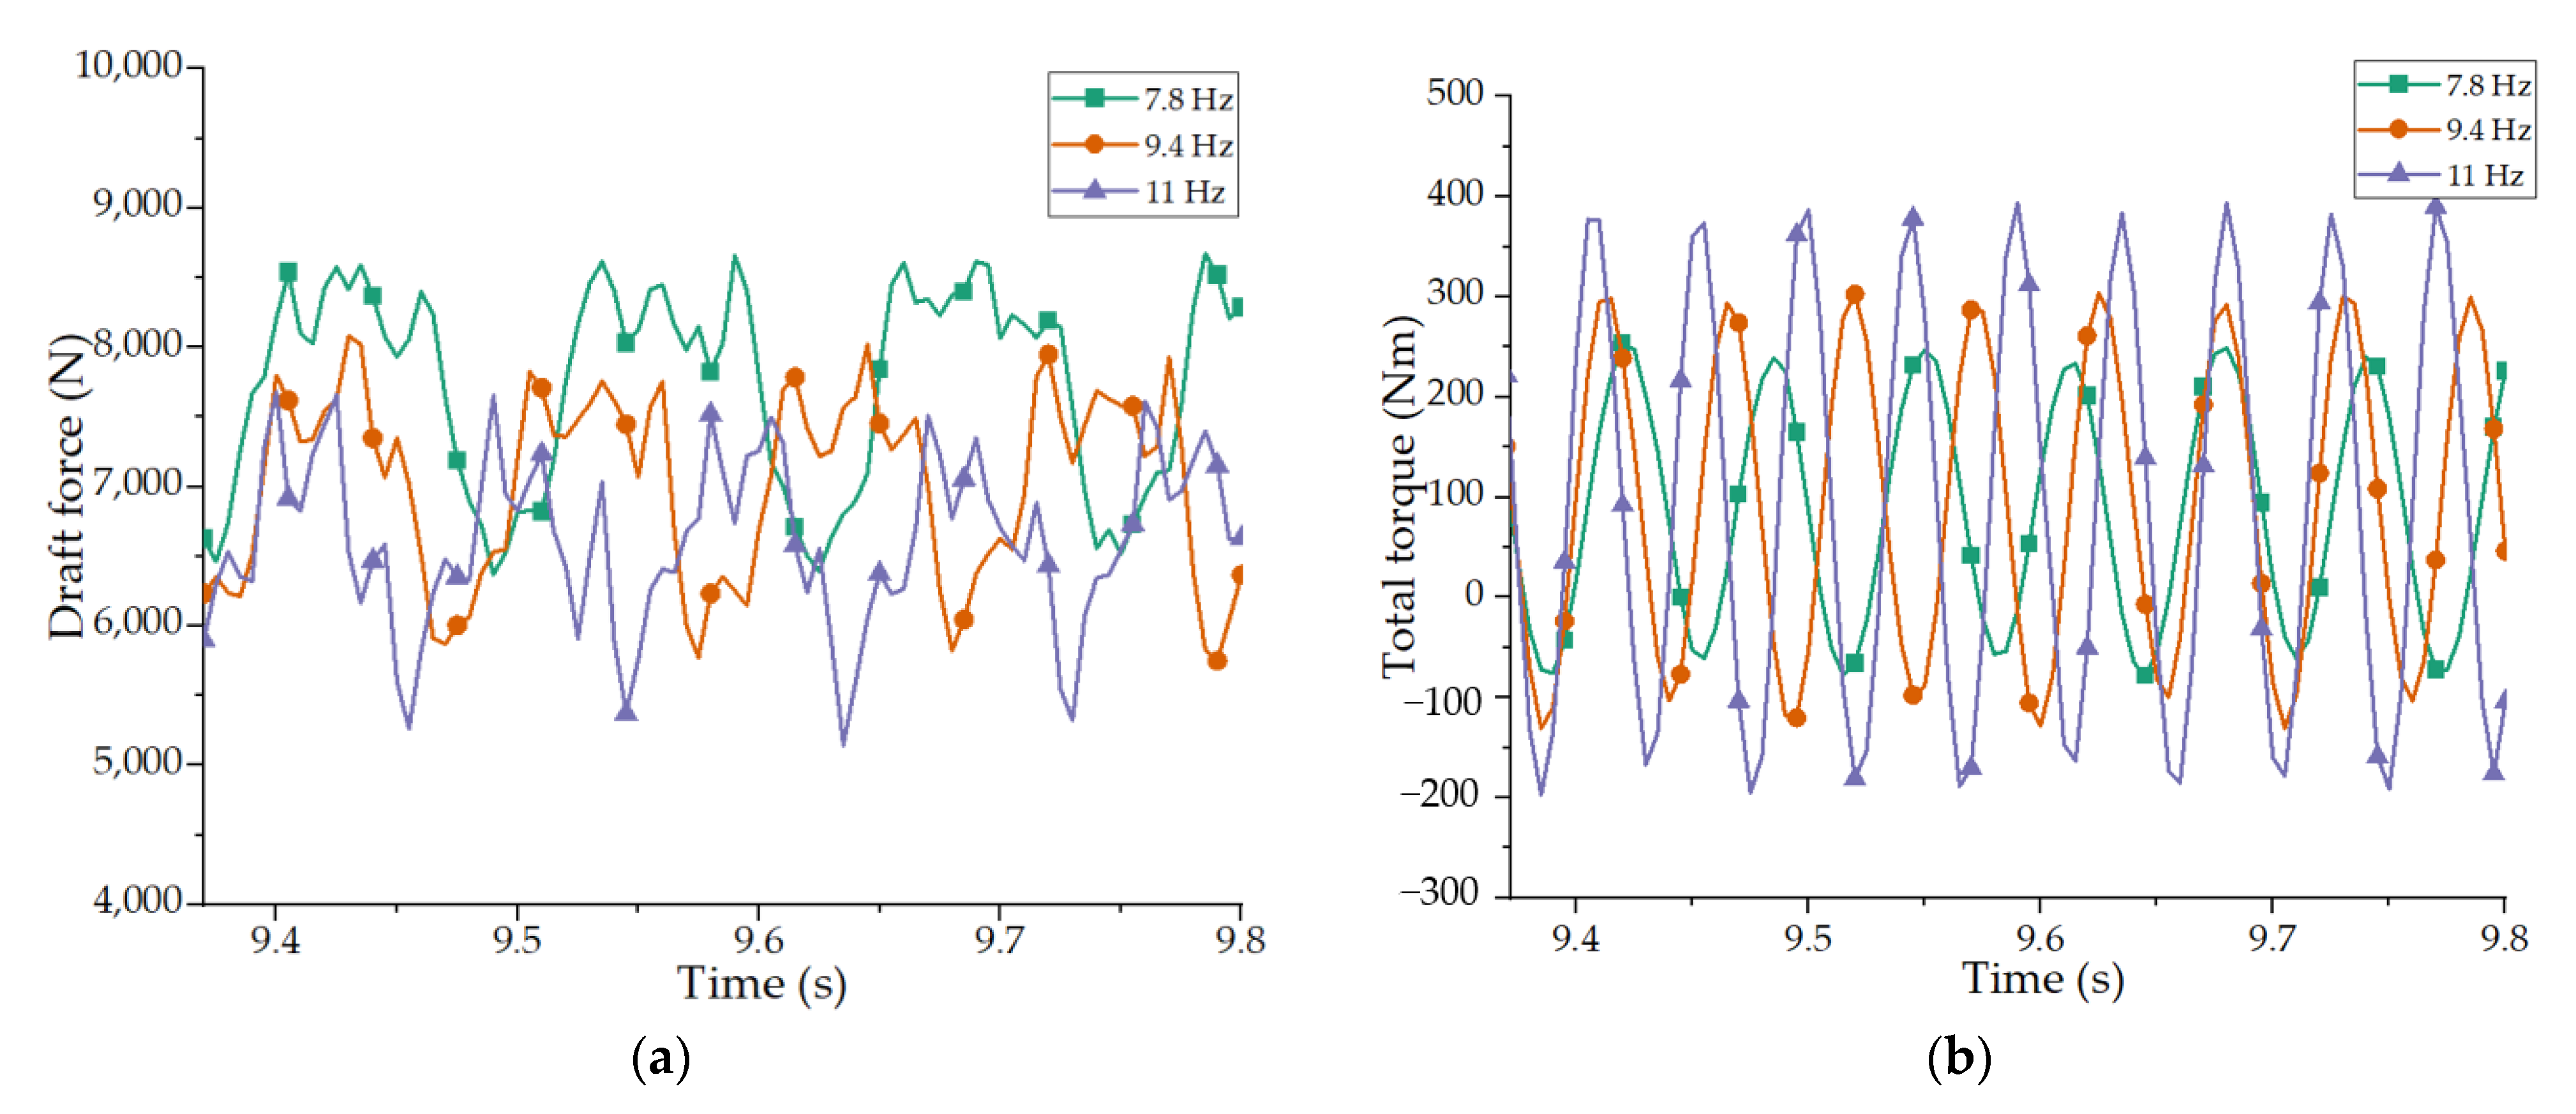
3.1.2. Vibration Frequency

Figure 10 shows the relationship between draft force, total torque, and vibration frequency, with vibration frequency of different values at a fixed forward speed (0.39 m/s) and a mean vibration frequency of 9.4 Hz. As the vibration frequency increased, the draft force gradually decreased, and the total torque gradually increased. When the vibration frequency was 7.8 Hz, the shovel-rod oscillation acceleration was small, the throwing effect on the soil above was weak, and the oscillation inertia forces were small, resulting in a large draft force (mean value 7845.77 N) and a small driving torque (mean value 148.59 Nm). As the vibration frequency increased to 9.4 Hz, the shovel-rod throwing effect on the soil above increased, the mean value of draft force decreased to 7085.29 N, and the mean value of total torque increased to 183.52 Nm. When the vibration frequency was 11 Hz, the shovel-rod had the most violent oscillation, and the soil above was strongly thrown, resulting in a smaller draft force (mean value 6643.37 N). The largest oscillation acceleration led to the largest inertial force, resulting in a larger total torque (mean value 239.61 Nm). Each 1 Hz increase in vibration frequency decreased the mean draft force by 375.75 N and increased the mean total torque by 28.44 Nm. Because the harvesting process mainly overcomes the soil’s gravitational, internal and frictional forces, when the vibration frequency is increased, the vertical lifting force of soil is enhanced, thus reducing the horizontal draft force.

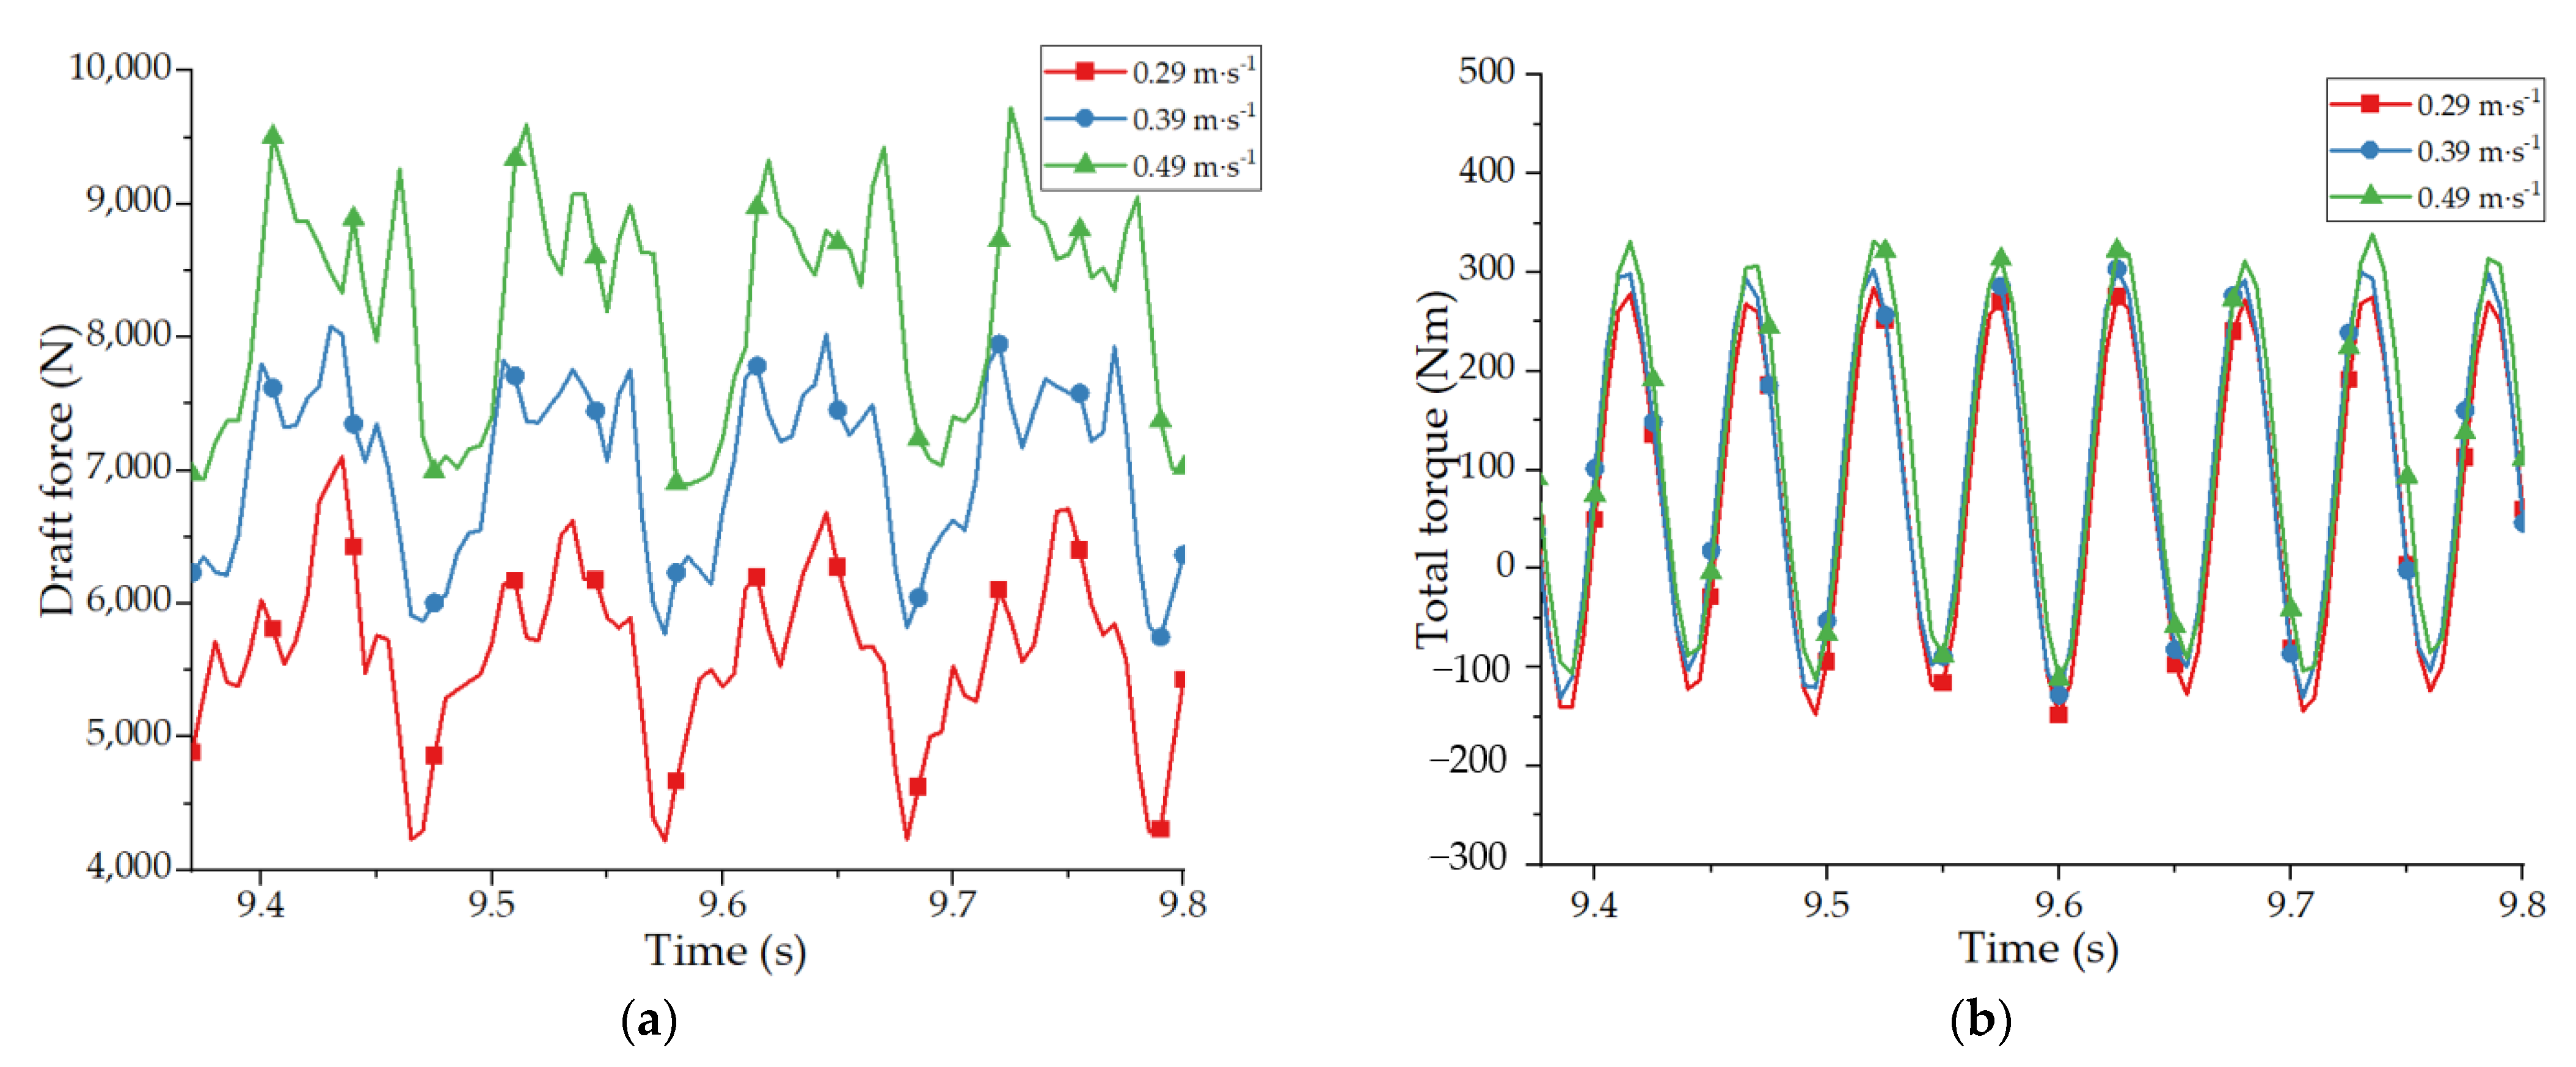
3.1.3. Forward Speed

Figure 11 shows the relationship between draft force, total torque, and forward speed, with a forward speed of different values and a fixed setting of the vibration frequency (9.4 Hz) and amplitude (9 mm). As the forward speed increased, the draft force and total torque gradually increased. When the forward speed was 0.29 m/s, the shovel-rod handled a small soil mass in unit time and was subjected to a small load, resulting in a small draft force (mean value 5699.76 N) and total torque (mean value 170.49 Nm). As the forward speed increased to 0.39 m/s, the shovel-rod handled more soil mass, and subject to increased loads the mean value of the draft force increased to 7085.29 N and the mean value of total torque increased to 183.52 Nm. When the forward speed was 0.49 m/s, the shovel-rod handled 1.69 times more soil mass per unit time than at low speed (0.29 m/s), the draft force increased to 8305.21 N, and the total torque increased to 196.99 Nm. Each 0.1 m/s increase in forwarding speed increased the mean draft force by 1302.72 N and the mean total torque by 13.26 Nm.

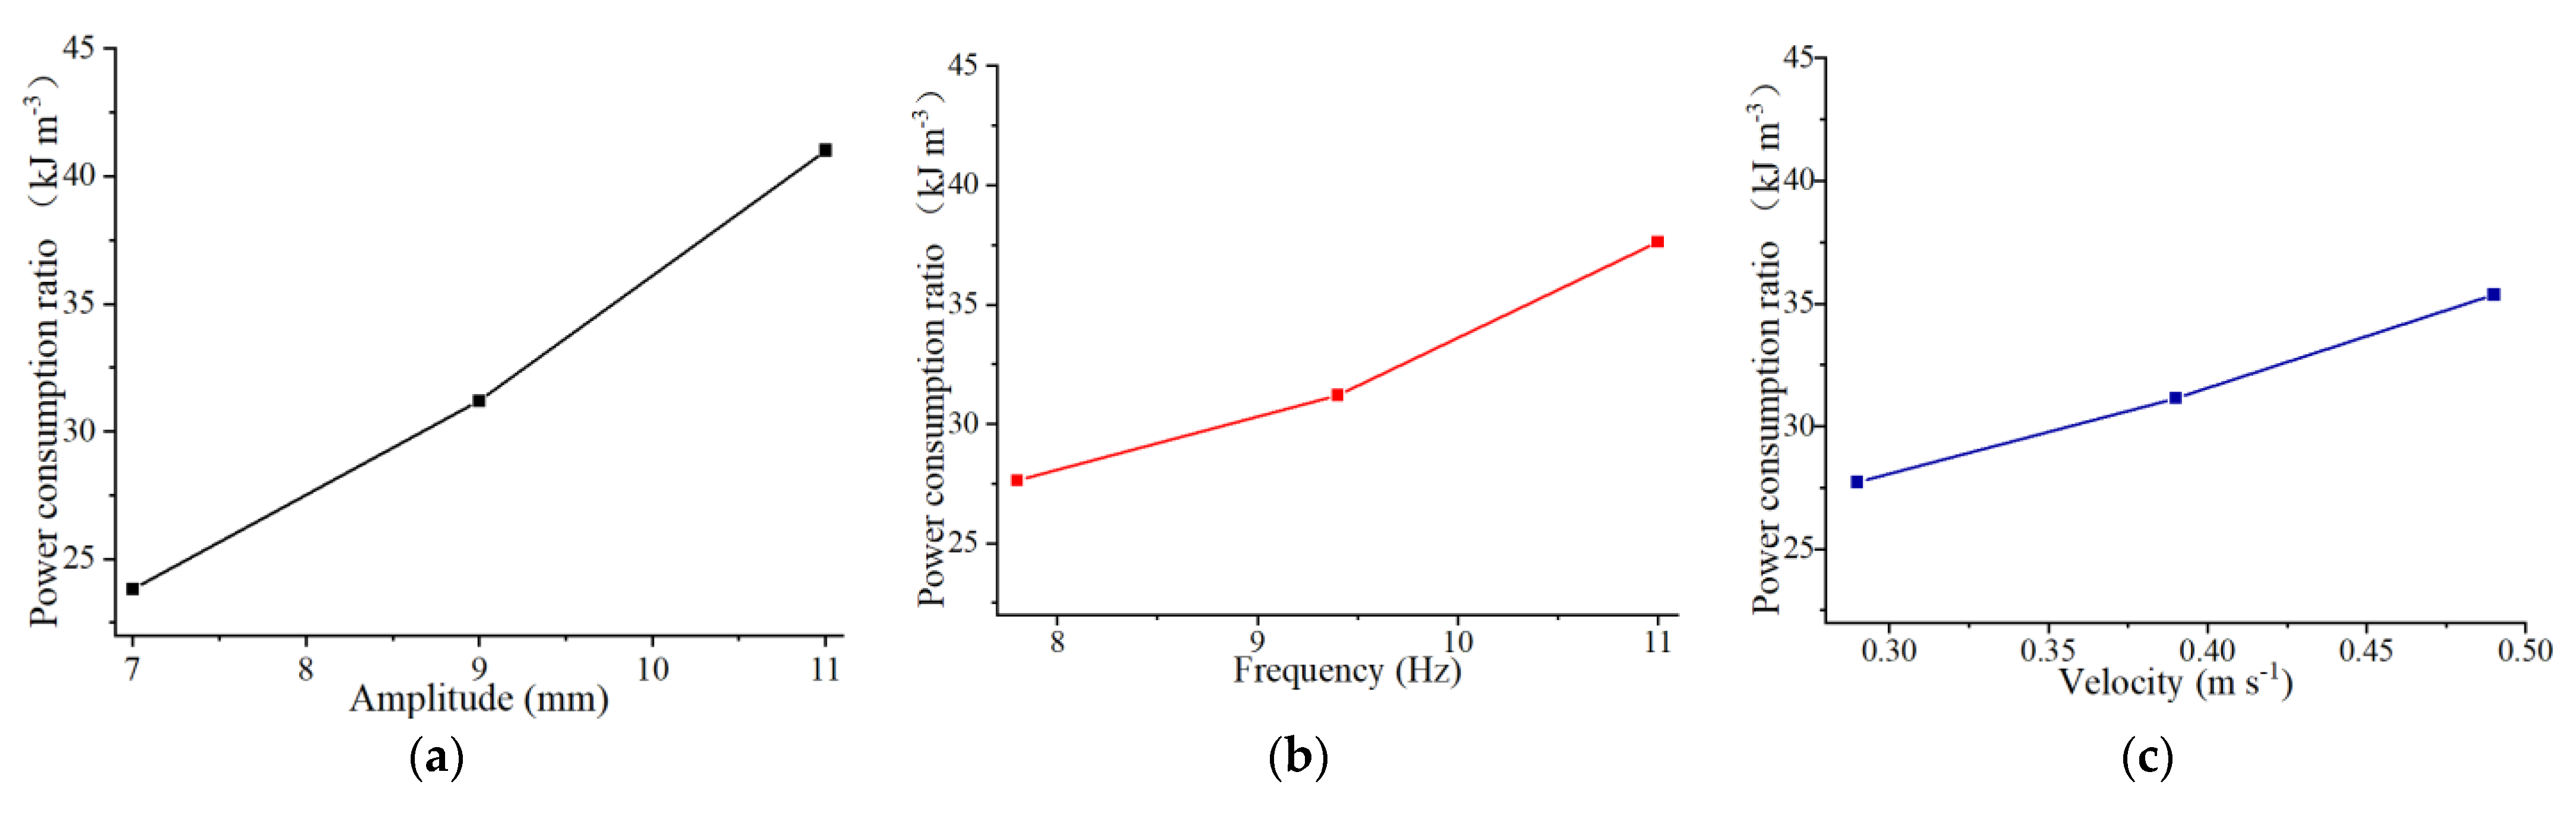
3.2. Analysis of Specific Power Consumption

Specific energy consumption for harvesting is determined by the draft force and the total torque. As shown in Figure 12, specific energy consumption positively correlates with amplitude, vibration frequency, and forward speed, and the increase gradients at amplitude, vibration frequency, and forwarding speed were 4.3 kJ/m3, 3.12 kJ/m3, and 3.82 kJ/m3, respectively. Amplitude had the most significant effect on specific energy consumption.

3.3. Analysis of Soil Structure Maintenance

3.3.1. Amplitude

Figure 13a shows the relationship between soil structure maintenance and amplitude, with amplitude of different values at a fixed forward speed (0.39 m/s) and vibration frequency (9.4 Hz). The deeper the soil layer, the larger the soil structure maintenance. In addition, as amplitude increased, soil structure maintenance on each layer gradually increased. When the amplitude was 7 mm, the shovel-rod had a weak ability to separate soil, which led to many disorderly soil collisions on the rods, and the SLA and SLB layers were strongly mixed. The minimum SLA soil structure maintenance was 0.62. As the amplitude increased to 9 mm, the separation ability increased, and the soil structure maintenance increased significantly to 0.7 in the SLB layer, approximately 0.2 in the SLA and SLB layers, slightly in the SLD and SLE layers. When the amplitude was 11 mm, the shovel-rod had the strongest ability to separate soil and small disordered soil collisions on the rods. The soil structure maintenance in the SLA layer increased to 0.72 and reached a high level in all the remaining layers.

3.3.2. Vibration Frequency

Figure 13b shows the relationship between soil structure maintenance degree and vibration frequency, with vibration frequency of different values at a fixed forward speed (0.39 m/s) and amplitude (9 mm). As vibration frequency increased, soil structure maintenance on each layer gradually increased. When the vibration frequency is 7.8 Hz, the shovel-rod had a small oscillation acceleration, and the topsoil had many disorderly collisions on the rods, resulting in a higher soil disturbance in the SLA, SLB and SLC layers. The soil structure maintenance is all at a low level. As the vibration frequency increased to 9.4 Hz, shovel-rod oscillation acceleration increased, and the topsoil’s disordered collision effect on the rod decreased. As a result, the SLA layer increased significantly to 0.68, the SLB and SLC layers increased by approximately 0.1 and the SLD and SLE layers increased slightly. When the vibration frequency was 11 Hz, the shovel-rod had the largest oscillation acceleration and the smallest disordered soil collisions on the rods. As a result, the soil structure maintenance in the SLA layer increased to 0.72 and reached a high level in all the remaining layers.

3.3.3. Forward Speed

Figure 13c shows the relationship between soil structure maintenance and forward speed, with a forward speed of different values at a fixed vibration frequency (9.4 Hz) and amplitude (9 mm). As forward speed increased, the value of each soil layer gradually decreased. When the forward speed was 0.29 m/s, the shovel-rod handled less soil per unit time, and the soil was separated smoothly, the SLA layer had a soil structure maintenance of 0.73, and all the other layers were greater than 0.8. As the forward speed increased to 0.39 m/s, the shovel-rod handled soil mass increased in unit time. The maximum decrease in soil structure maintenance is about 0.4 in the SLA and SLB layers, about 0.2 in the SLC and SLD layers, and a small decrease in the SLE layer. Finally, when the forward speed was 0.49 m/s, the shovel-rod had the largest soil mass handled in unit time, and the soil had many disorderly collisions on the rods. The SLA layer’s soil structure maintenance decreased to 0.63, and the remaining layers were at a lower level than at other speeds.

3.4. Analysis of Separation Proportion

3.4.1. Amplitude

The amplitude significantly affected the separation proportion. Figure 14a shows the relationship between separation proportion and amplitude, with an amplitude of different values at a fixed forward speed (0.39 m/s) and vibration frequency (9.4 Hz). As the amplitude increased, the SP2 separation ability gradually decreased, and the SP3 separation ability gradually increased, resulting in the primary separation areas transformed from SP2 to SP3. When the amplitude was 7 mm, the shovel-rod oscillation was small, and the primary separation areas were frontal areas (SP1 and SP2), with SP2 separation accounting for 47% of the total. As the amplitude increased to 9 mm, the shovel-rod oscillated violently and the primary separation area remained SP1 and SP2, whose percentage of separation decreased by 4%, while the separation proportion in SP3 increased by 3%. When the amplitude was 11 mm, the maximum swing amplitude of shovel-rod and separation proportion in SP1 and SP2 areas decreased by 11% and increased by 19% in the SP3 area. The proportion of unseparated soil was less than 0.5% under all working conditions, which met the requirements of liquorice harvesting.

3.4.2. Vibration Frequency

Figure 14b shows the relationship between separation proportion and vibration frequency, with vibration frequency of different values at a fixed forward speed (0.39 m/s) and amplitude (9 mm). As the vibration frequency increased, the SP1 separation ability decreased but increased in SP3. The primary separation areas were considered SP1 and SP2. When the vibration frequency was 7.8 Hz, the oscillation acceleration of the shovel-rod was small, and the primary separation areas were SP1 and SP2, with SP2 accounting for a larger separation proportion at 44%. As the vibration frequency increased to 9Hz, the oscillation acceleration of the shovel-rod became larger, the separation proportion of the SP1 and SP2 areas decreased by approximately 2%, and the SP3 area increased by 1.5%. When the vibration frequency was 11 Hz, the shovel-rod oscillation acceleration was the largest, and the separation proportion of SP3, SP4, and SP5 areas increased. The proportion of unseparated soil in all conditions was less than 0.5%, which met the requirements of liquorice harvesting. Increasing the vibration frequency helps to disperse the soil, but the dispersion effect is weaker than the amplitude.

3.4.3. Forward Speed

Figure 14c shows the relationship between separation proportion and forward speed, with a forward speed at different values at a fixed vibration frequency (9.4 Hz) and amplitude (9 mm). As the forward speed increased, the SP2 separation ability gradually decreased, but increased in the SP3, resulting in the primary separation areas transforming from SP2 to SP3. When the forward speed was 0.29 m/s, the shovel-rod treated a smaller soil mass in unit time; SP1 and SP2 were the primary separation areas, with SP1 separation accounting for a greater 47%. When the forward speed increased to 0.39 m/s, shovel-rod-handled soil mass increased in unit time, the separation proportion of the SP1 area decreased by 7%, and the SP3 area increased by 9%. When the forward speed was 0.49 m/s, the SP1 separation ratio decreased significantly, and the SP3 and SP4 separation proportion increased by 8% due to the maximum soil mass handled in unit time at the shovel-rod. The proportion of unseparated soil in all conditions was less than 0.5%, which met the requirements of liquorice harvesting.

3.5. Two-Stage Cycle of Working Process

The working process was assumed to be a two-stage (lifting and cutting) cycle based on the results of simulation tests, as shown in Figure 15. The cycle time was 0.106 s, the amplitude was 9 mm, the vibration frequency was 9.4 Hz, and the forward speed was 0.39 m/s. The cycle was further segmented into seven steps depending on the draft force’s extreme points, labelled a, b, c, d, e, f, g, and h (Figure 15a). The corresponding points on the total torque cycle curve (Figure 15b) were marked, and DEM extracted the shovel-rod-soil interaction (soil force) and soil particle vector flow for each point on the mid-plane (i.e., the middle shovel-rod) at the corresponding time (Figure 15c,d).
As shown in Figure 15a, the draft force was not sinusoidal, fluctuated irregularly throughout the cycle, and the force at the lifting stage was larger than the force at the cutting stage. The maximum draft force was detected at points b and d, while a minimum value was observed at point g. The torques of the four excitation devices were well-balanced, as shown in Figure 15b, with the total torque curve showing two peaks and two valleys in one cycle, and the variations were essentially similar in the lifting and cutting stages. The maximum values of total torque were found at points c and g (in the middle of the lifting and cutting process), where the draft force was small. The total torque was smallest at points a, e, and h, where the corresponding draft forces were also small.
The total force was the compound force on the soil particles, as shown in Figure 15c, d, denoted by a gradient of colour; the redder the colour, the stronger the force. The front part of the shovel-rod was the main interaction area in the lifting stage, from point a to point b, while the middle and rear parts were not significantly impacted due to the hysteresis of soil movement and deformation, and the shovel-rod and soil were not in sufficient contact and collision. As the shovel-rod lifted from point b to point c to point d, the impact intensified and the action area grew larger. A vortex of soil particles was detected at point c in the later steps of the lifting stage, indicating an accelerated tendency of the soil to move backwards (possibly causing tensile damage to the soil and promoting soil breakage). The interaction occurred primarily in the cutting stage, where the total force was relatively large (redder in colour). It should be noted that the diagrams of soil force and soil particle vector flow indicated the interaction of the middle shovel-rod component, whereas the interaction of the left and right components followed a similar regularity to that of the middle; however, the lifting and cutting processes alternated.

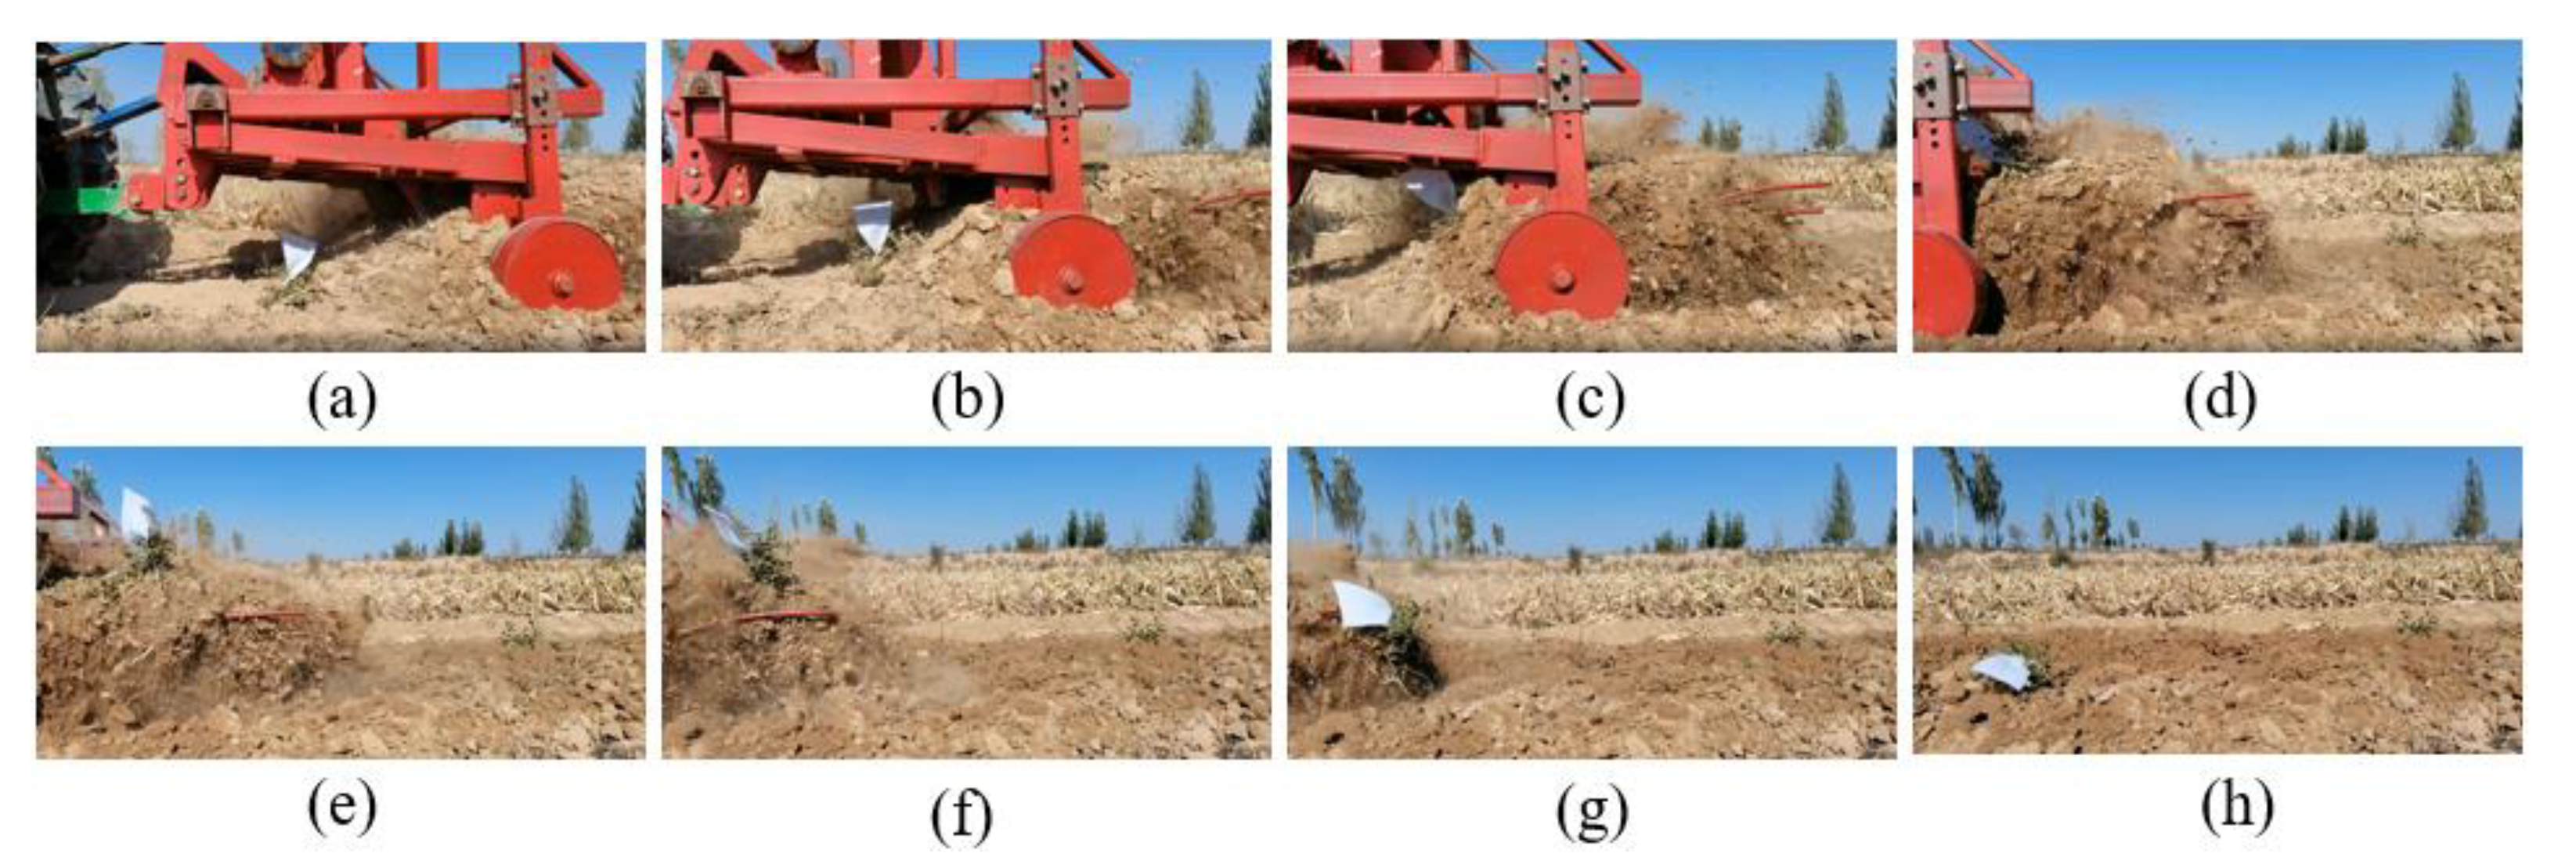
3.6. Field Test Results

The liquorice roots were separated from the soil after passing smoothly through the oscillating shovel-rod components, during which the soil at various depths dropped in sequence, and the liquorice roots were then placed near the initial position on the soil surface, as shown in Figure 16.
The marker’s location variation demonstrated the liquorice root movement and the soil flow. As the shovel-rod moved, the uncultivated soil was compelled to elevate gradually, and the marker soon followed (Figure 16a–c). During this process, the soil was gradually crushed and broken up by the shovel-rod action and fell through the rods, while the liquorice held by the rods and the moving soil were gradually carried backwards along the rods (Figure 16c–e). Finally, under the powerful throwing action of the rods, the liquorice and the soil were entirely separated at the rear of the rods, the soil falling down layer by layer, and the liquorice landing on the surface near its original position (Figure 16e–h).
Because the topsoil depth usually is 200 to 300 mm, and the liquorice harvesting depth is around 400mm or even deeper, topsoil protection is also a crucial issue while utilizing the harvester. Observing soil flow during the harvesting process revealed that most of the soil was entirely separated before reaching the tail, and the layers fell in a definite sequence, with the bottom layers falling first and the upper layers descending later. Similar regularity was observed in the simulation tests, indicating that the soil structure is effectively preserved with the shovel-rod action. That also means the fertile topsoil is not destroyed by the poorer soil at the bottom, allowing for the future cultivation of shallow-rooted crops. Field test showed that the shovel-rod was suitable for liquorice harvesting and achieved similar findings to the simulated tests. However, due to the limitations of test conditions, the field test only observed the movement of the soil and the liquorice qualitatively and did not measure draft force or total torque.
To the best of our knowledge, this is the first time the soil structure maintenance has been used to describe soil structural variation after deep-depth harvesting. This study revealed the interaction between working components and soil, and this new finding will assist in developing harvest techniques for rhizome crops with deep growth depth. In addition, when designing a root crop harvester, enhancing the harvester’s ability to break up the soil and increasing the rate of soil separation can lead to good harvesting results.

4. Conclusions

In this study, the kinematics and dynamics of the liquorice harvester were analysed. A DEM-MBD model of the soil and the liquorice harvester was established, and three sets of single-factor simulation tests and one set of field tests were carried out to evaluate the performance of the liquorice harvester under different working conditions. The findings of the study are as follows:
(1)
Analysis of the throw intensity equation shows that the throw intensity of the oscillating shovel-rod components increases with the length of the rod, and the end has a higher throwing strength and throwing action. Combined with the throw intensity equation and the driving torque equation, the amplitude, vibration frequency and forward speed were determined as the key parameters.
(2)
The results of the coupled liquorice harvester-soil DEM-MBD simulation tests show that: As the amplitude increased, the draft force decreased by 463.35 N/mm while the total torque and specific energy consumption increased by 35.03 Nm/mm and 4.3 kJ/(m3·mm), respectively. As the vibration frequency increased, the specific energy consumption increased by 3.12 kJ/(Hz·m3) while the draft force and total torque decreased by 375.75 N/Hz and 28.44 Nm/Hz, respectively. As the forwarding speed increased, the draft force, total torque and specific energy consumption increased by 1302.72 N/ (m·s−1), 13.26 Nm/ (m·s−1) and 3.82 kJ/m3· (m·s−1), respectively. The main separation areas were SP1 and SP2, with greater than 60% soil separation proportion. The soil after the operation had a relatively minimal disturbance in all layers, with soil structure maintenance greater than 0.61.
(3)
The working process was assumed to be a two-stage (lifting and cutting) cycle, in which the traction resistance underwent non-sinusoidal motion and showed irregular fluctuations. The total torque curve has two peaks and two troughs in one cycle and is similar in the lifting and cutting phases. Field tests have observed that the liquorice passed smoothly through the shovel-rod components and then separated from the soil, during which the soil fell in turn at different layers.
Note that the study aimed to evaluate the interaction between the oscillating shovel-rod components and the soil, and the simulation model included soil without any liquorice, which may have differed slightly from the actual situation. However, we have seen soil movements in the field that are more consistent with the simulations, which confirms the simulation model’s validity. The simulation of deep liquorice-containing soil is challenging and will be the focus of our future work, and soil structure maintenance will become a research focus of deep root crop harvest.

Author Contributions

Conceptualization, L.W.; Methodology, L.W.; Software, Y.L. and J.W.; Validation, X.D.; Formal analysis, L.W.; Writing—original draft, L.W., C.Z. and X.M.; Writing—review & editing, C.Z. and X.M.; Visualization, X.D.; Supervision, Y.L., J.S. and J.W.; Project administration, Y.L., J.S. and J.W. All authors have read and agreed to the published version of the manuscript.

Funding

The author thanks Jiannong Song of China Agricultural University for funding this work through the National Key Research and Development Program of China (2016YFD0701605), (2016YFD070030202).

Institutional Review Board Statement

Not applicable.

Data Availability Statement

Not applicable.

Conflicts of Interest

The authors declare no conflict of interest.

References

  1. Wen, B.Q.; Li, Y.; Kan, Z.; Li, J.B.; Li, L.; Ge, J.; Ding, L.; Wang, K.; Shi, Y. Experimental study on microstructure and mechanical properties of stalk for Glycyrrhiza Glabra. J. Biomech. 2021, 118, 110198. [Google Scholar] [CrossRef]
  2. Lu, Y.; Yao, G.; Wang, X.; Zhang, Y.; Zhao, J.; Yu, Y.J.; Wang, H. Chemometric discrimination of the geographical origin of licorice in China by untargeted metabolomics. Food Chem. 2022, 380, 132235. [Google Scholar] [CrossRef] [PubMed]
  3. He, C.; Zeng, Q.; Chen, Y.; Chen, C.; Wang, W.; Hou, J.; Li, X. Colonization by dark septate endophytes improves the growth and rhizosphere soil microbiome of licorice plants under different water treatments. Appl. Soil Ecol. 2021, 166, 103993. [Google Scholar] [CrossRef]
  4. Lü, J.; Sun, H.; Dui, H.; Peng, M.; Yu, J. Design and Experiment on Conveyor Separation Device of Potato Digger under Heavy Soil Condition. Nongye Jixie Xuebao/Trans. Chin. Soc. Agric. Mach. 2017, 48, 146–155. [Google Scholar] [CrossRef]
  5. Yang, R.; Yang, H.; Shang, S.; Xu, P.; Cui, G.; Liu, L. Design and test of poking roller shoving type potato harvester. Nongye Jixie Xuebao/Trans. Chin. Soc. Agric. Mach. 2016, 47, 119–126. [Google Scholar] [CrossRef]
  6. Zhang, Z.; Wang, H.; Li, Y.; Yang, X.; Ibrahim, I.; Zhang, Z. Design and Experiment of Multi-stage Separation Buffer Potato Harvester. Nongye Jixie Xuebao/Trans. Chin. Soc. Agric. Mach. 2021, 52, 96–109. [Google Scholar] [CrossRef]
  7. Naik, M.A.; Pateriya, R.N.; Ramulu, C. Optimization of Performance Parameters of Onion Digger with Cutter Bar Topping Unit. J. Inst. Eng. Ser. 2022, 103, 71–79. [Google Scholar] [CrossRef]
  8. Tao, G.; Zhang, Z.; Yi, S.; Xia, C.; Ma, Y. Design and Test of Combined Swing Radix isatidi Root-soil Separation Device. Nongye Jixie Xuebao/Transactions Chinese Soc. Agric. Mach. 2022, 53, 109–119. [Google Scholar] [CrossRef]
  9. Yang, F.; Yang, Y.; Li, W.; Zhao, G.; Jiang, F.; Li, J. Structural Design and Experiment on Vibrating Soil Breaking Device of Mounted Yam Harvester. Nongye Jixie Xuebao/Trans. Chin. Soc. Agric. Mach. 2020, 51, 104–111. [Google Scholar] [CrossRef]
  10. Wei, Z.; Li, H.; Su, G.; Sun, C.; Liu, W.; Li, X. Development of potato harvester with buffer type potato-impurity separation sieve. Nongye Gongcheng Xuebao/Trans. Chin. Soc. Agric. Eng. 2019, 35, 1–11. [Google Scholar] [CrossRef]
  11. Wang, Y.; Zhang, D.; Yang, L.; Cui, T.; Jing, H.; Zhong, X. Modeling the interaction of soil and a vibrating subsoiler using the discrete element method. Comput. Electron. Agric. 2020, 174, 105518. [Google Scholar] [CrossRef]
  12. Shahgoli, G.; Fielke, J.; Desbiolles, J.; Saunders, C. Optimising oscillation frequency in oscillatory tillage. Soil Tillage Res. 2010, 106, 202–210. [Google Scholar] [CrossRef]
  13. Sun, J.; Chen, H.; Wang, Z.; Ou, Z.; Yang, Z.; Liu, Z.; Duan, J. Study on plowing performance of EDEM low-resistance animal bionic device based on red soil. Soil Tillage Res. 2020, 196, 104336. [Google Scholar] [CrossRef]
  14. Song, W.; Jiang, X.; Li, L.; Ren, L.; Tong, J. Increasing the width of disturbance of plough pan with bionic inspired subsoilers. Soil Tillage Res. 2022, 220, 105356. [Google Scholar] [CrossRef]
  15. Marani, S.M.; Shahgholi, G.; Moinfar, A. Effect of nano coating materials on reduction of soil adhesion and external friction. Soil Tillage Res. 2019, 193, 42–49. [Google Scholar] [CrossRef]
  16. Guan, C.; Fu, J.; Xu, L.; Jiang, X.; Wang, S.; Cui, Z. Study on the reduction of soil adhesion and tillage force of bionic cutter teeth in secondary soil crushing. Biosyst. Eng. 2022, 213, 133–147. [Google Scholar] [CrossRef]
  17. Liu, G.; Xia, J.; Zheng, K.; Cheng, J.; Wang, K.; Zeng, R.; Wang, H.; Liu, Z. Effects of vibration parameters on the interfacial adhesion system between soil and metal surface. Soil Tillage Res. 2022, 218, 105294. [Google Scholar] [CrossRef]
  18. Karki, T.B.; Gyawaly, P. Conservation Agriculture Mitigates the Effects of Climate Change. J. Nepal Agric. Res. Counc. 2021, 7, 122–132. [Google Scholar] [CrossRef]
  19. Geppert, C.; Contri, C.; De Boni, L.; Corcos, D.; Marini, L. Drought, nitrogen deposition and arthropod herbivory modify plant establishment dynamics after soil disturbance. Sci. Total Environ. 2021, 796, 148956. [Google Scholar] [CrossRef]
  20. Biney, J.K.M.; Blöcher, J.R.; Bell, S.M.; Borůvka, L.; Vašát, R. Can in situ spectral measurements under disturbance-reduced environmental conditions help improve soil organic carbon estimation. Sci. Total Environ. 2022, 838, 156304. [Google Scholar] [CrossRef]
  21. Deng, F.; Wang, H.; Xie, H.; Bao, X.; He, H.; Zhang, X.; Liang, C. Low-disturbance farming regenerates healthy deep soil toward sustainable agriculture-Evidence from long-term no-tillage with stover mulching in Mollisols. Sci. Total Environ. 2022, 825, 153929. [Google Scholar] [CrossRef] [PubMed]
  22. Wang, X.; Zhang, S.; Pan, H.; Zheng, Z.; Huang, Y.; Zhu, R. Effect of soil particle size on soil-subsoiler interactions using the discrete element method simulations. Biosyst. Eng. 2019, 182, 138–150. [Google Scholar] [CrossRef]
  23. Wang, Z.; Li, Y.; Li, T.; Zhao, D.; Liao, Y. Tillage practices with different soil disturbance shape the rhizosphere bacterial community throughout crop growth. Soil Tillage Res. 2020, 197, 104501. [Google Scholar] [CrossRef]
  24. Ucgul, M.; Saunders, C. Simulation of tillage forces and furrow profile during soil-mouldboard plough interaction using discrete element modelling. Biosyst. Eng. 2020, 190, 58–70. [Google Scholar] [CrossRef]
  25. Sadek, M.A.; Chen, Y.; Zeng, Z. Draft force prediction for a high-speed disc implement using discrete element modelling. Biosyst. Eng. 2021, 202, 133–141. [Google Scholar] [CrossRef]
  26. Aikins, K.A.; Ucgul, M.; Barr, J.B.; Jensen, T.A.; Antille, D.L.; Desbiolles, J.M.A. Determination of discrete element model parameters for a cohesive soil and validation through narrow point opener performance analysis. Soil Tillage Res. 2021, 213, 105123. [Google Scholar] [CrossRef]
  27. Makange, N.R.; Ji, C.; Torotwa, I. Prediction of cutting forces and soil behavior with discrete element simulation. Comput. Electron. Agric. 2020, 179, 105848. [Google Scholar] [CrossRef]
  28. Li, A.; Han, Y.; Jia, F.; Zhang, J.; Meng, X.; Chen, P.; Xiao, Y.; Zhao, H. Examination milling non-uniformity in friction rice mills using by discrete element method and experiment. Biosyst. Eng. 2021, 211, 247–259. [Google Scholar] [CrossRef]
  29. Katinas, E.; Chotěborský, R.; Linda, M.; Jankauskas, V. Wear modelling of soil ripper tine in sand and sandy clay by discrete element method. Biosyst. Eng. 2019, 188, 305–319. [Google Scholar] [CrossRef]
  30. Hou, J.; Chen, Y.; Li, Y.; Li, T.; Li, G.; Guo, H. Design and experiment of shovel-screen combined green onion digging, shaking, and soil tillage device. Trans. Chin. Soc. Agric. Eng. 2021, 37, 29–39. [Google Scholar] [CrossRef]
  31. Awuah, E.; Zhou, J.; Liang, Z.; Aikins, K.A.; Gbenontin, B.V.; Mecha, P.; Makange, N.R. Parametric analysis and numerical optimisation of Jerusalem artichoke vibrating digging shovel using discrete element method. Soil Tillage Res. 2022, 219, 105344. [Google Scholar] [CrossRef]
  32. Wang, X.; Zhang, Q.; Huang, Y.; Ji, J. An efficient method for determining DEM parameters of a loose cohesive soil modelled using hysteretic spring and linear cohesion contact models. Biosyst. Eng. 2022, 215, 283–294. [Google Scholar] [CrossRef]
  33. Mudarisov, S.; Farkhutdinov, I.; Khamaletdinov, R.; Khasanov, E.; Mukhametdinov, A. Evaluation of the significance of the contact model particle parameters in the modelling of wet soils by the discrete element method. Soil Tillage Res. 2022, 215, 105228. [Google Scholar] [CrossRef]
  34. Zhang, L.; Zhai, Y.; Chen, J.; Zhang, Z.; Huang, S. Optimization design and performance study of a subsoiler underlying the tea garden subsoiling mechanism based on bionics and EDEM. Soil Tillage Res. 2022, 220, 105375. [Google Scholar] [CrossRef]
  35. Zhao, Z.; Li, H.; Liu, J.; Yang, S.X. Control method of seedbed compactness based on fragment soil compaction dynamic characteristics. Soil Tillage Res. 2020, 198, 104551. [Google Scholar] [CrossRef]
  36. Wan, L.; Li, Y.; Zhao, H.; Xu, G.; Song, J.; Dong, X.; Zhang, C.; Wang, J. Gradient throwing characteristics of oscillating slat shovel for rhizome crop harvesters. Nongye Gongcheng Xuebao/Trans. Chin. Soc. Agric. Eng. 2021, 37, 9–21. [Google Scholar] [CrossRef]
  37. Kim, Y.S.; Siddique, M.A.A.; Kim, W.S.; Kim, Y.J.; Lee, S.D.; Lee, D.K.; Hwang, S.J.; Nam, J.S.; Park, S.U.; Lim, R.G. DEM simulation for draft force prediction of moldboard plow according to the tillage depth in cohesive soil. Comput. Electron. Agric. 2021, 189, 106368. [Google Scholar] [CrossRef]
  38. Foldager, F.F.; Munkholm, L.J.; Balling, O.; Serban, R.; Negrut, D.; Heck, R.J.; Green, O. Modeling soil aggregate fracture using the discrete element method. Soil Tillage Res. 2022, 218, 105295. [Google Scholar] [CrossRef]
  39. Dong, X.; Su, C.; Zheng, H.; Han, R.; Li, Y.; Wan, L.; Song, J.; Wang, J. Analysis of soil disturbance process by vibrating subsoiling based on DEM-MBD coupling algorithm. Nongye Gongcheng Xuebao/Trans. Chin. Soc. Agric. Eng. 2022, 38, 34–43. [Google Scholar] [CrossRef]
Figure 1. Structure of liquorice harvester. (a) Main structure; (b) Excitation device and shovel-rod components.
Agriculture 12 02015 g001
Figure 2. Motion analysis diagram of oscillating shovel-rod.
Agriculture 12 02015 g002
Figure 3. Working characteristics of the harvester (a) Harvesting process and variation in kinematic characteristics of shovel-rod, (b) Eb point throw intensity-time variation pattern, (c) Variation of throw intensity with shovel-rod length.
Agriculture 12 02015 g003
Figure 4. Diagram of total torque and excitation device torque.
Agriculture 12 02015 g004
Figure 5. DEM-MBD simulation model of the liquorice harvester: (a) DEM view; (b) MBD view.
Agriculture 12 02015 g005
Figure 6. Field test of liquorice harvester.
Agriculture 12 02015 g006
Figure 7. Soil disturbance and particle distribution of soil in different layers: (a) Before harvesting; (b) After harvesting.
Agriculture 12 02015 g007
Figure 8. Monitoring areas division and follower total mass sensors arrangement.
Agriculture 12 02015 g008
Figure 9. Effect of amplitude on harvester performance: (a) Draft force; (b) Total torque.
Agriculture 12 02015 g009
Figure 10. Effect of vibration frequency on harvester performance: (a) Draft force; (b) Total torque.
Agriculture 12 02015 g010
Figure 11. Effect of forward speed on harvester performance: (a) Draft force; (b) Total torque.
Agriculture 12 02015 g011
Figure 12. Effect of each parameter on the comparison of power consumption: (a) Amplitude; (b) Vibration frequency; (c) Forward speed.
Agriculture 12 02015 g012
Figure 13. Effects of parameters on the soil structure maintenance degree: (a) Amplitude; (b) Vibration frequency; (c) Forward speed.
Agriculture 12 02015 g013
Figure 14. Effects of parameters on the separated proportion: (a) Amplitude; (b) Vibration frequency; (c) Forward speed.
Agriculture 12 02015 g014
Figure 15. The points a–h are the draft force’s extreme points of the draft force (a) and their corresponding positions in total torque (b) curves for a working cycle, (c) showing the forces on soil at each point, and (d) listing the soil vector flow at points a and c.
Agriculture 12 02015 g015
Figure 16. The field test working process and spatial location variations of the maker, Subgraphs (ah) show the order of the marker’s position changes during the liquorice harvesting.
Agriculture 12 02015 g016
Table 1. DEM parameters and material properties used in DEM model of the liquorice harvester.
ParametersValue in Each Soil Layer Depth/mm
0~100100~200200~300300~400>400
Soil particle radius (mm)6.56.56.57.57.5
Soil density (kg·m−3)26702800280028502850
Generated soil quality (kg)13751375137513752035
Poisson’s ratio of soil0.360.360.360.360.36
Shear modulus of soil (Pa)9.6 × 1069.6 × 1069.6 × 1069.6 × 1069.6 × 106
Coefficient of restitution between soil and soil0.530.450.480.450.45
Coefficient of static friction between soil and soil0.580.630.630.650.68
Coefficient of rolling friction between soil and soil0490.510.510.520.54
Contact plasticity ratio between soil and soil0.260.220.20.20.18
Surface energy between soil and soil24.925.226.526.528.7
Tensile exp between soil and soil44444
Tangential stiff multiplier between soil and soil0.390.390.390.390.39
Density of steel (kg·m−3)78617861786178617861
Poisson’s ratio of steel0.30.30.30.30.3
Shear modulus of steel (Pa)7.9 × 10107.9 × 10107.9 × 10107.9 × 10107.9 × 1010
Coefficient of restitution between soil and steel0.280.250.250.250.2
Coefficient of static friction between soil and steel0.430.490.490.520.54
Coefficient of rolling friction between soil and steel0.150.180.180.220.26
Table 2. Test factors and levels.
LevelsAmplitude (mm)Vibration Frequency (Hz)Forward Speed (m·s−1)
+177.80.29
099.40.39
−111110.49
Publisher’s Note: MDPI stays neutral with regard to jurisdictional claims in published maps and institutional affiliations.

