Article

Spatiotemporal Distribution Patterns of Pest Species (Lepidoptera: Noctuidae) Affected by Meteorological Factors in an Agroecosystem

1
Department of Entomology, FAST Bahauddin Zakariya University, Multan 60800, Pakistan
2
Department of Statistics, Bahauddin Zakariya University, Multan 60800, Pakistan
3
Biology Department, College of Science and Arts, King Khalid University, Muhayl Asser 63751, Saudi Arabia
4
Biology Department, College of Science, Ibb University, Ibb X57F+58P, Yemen
5
Department of Agriculture, University of Swabi, Anbar 23561, Pakistan
6
Department of Biology, College of Science and Humanities, Prince Sattam bin Abdulaziz University, Al-Kharj 16278, Saudi Arabia
7
Department of Biology, Faculty of Arts and Sciences, Najran University, Najran 1988, Saudi Arabia
8
Department of Zoology, Dr. Babasaheb Ambedkar Marathwada University, Aurangabad 431004, India
*
Author to whom correspondence should be addressed.
Agriculture 2022, 12(12), 2003; https://doi.org/10.3390/agriculture12122003
Submission received: 5 September 2022 / Revised: 21 November 2022 / Accepted: 21 November 2022 / Published: 24 November 2022
(This article belongs to the Special Issue Ecological Management of Insect Pests)

Abstract

:
Knowing pests’ spatiotemporal distribution patterns is essential for forecasting population outbreaks and designing control tactics or long-term management plans. The family Noctuidae is one of the largest families of the Lepidoptera order. The noctuid’s moths are well represented in all zoogeographic regions in various habitats and have immeasurable ecological and economic importance. Although the species’ ecology has been extensively studied, little is known about the spatial and temporal distribution patterns of noctuid moths in an agroecosystem. Therefore, in this study, the spatial and temporal fluctuations in the abundance of 24 important species in the family were quantified. Yellow light traps were mounted in 11 different selected localities of the Multan district. The maximum species abundance was observed in September but declined in December, January, and February. Spatial contour maps were used to determine the species’ dissemination over space. Meteorological factors such as temperature and humidity showed a significantly positive correlation, while rainfall showed a significantly negative correlation, with species richness. The maximum species abundance was recorded in crop areas as compared to forest areas. This study provides a scientific basis for developing and timely applying control strategies for localized pest control.

1. Introduction

The Lepidoptera order is one of the most predominant terrestrial orders, which performs an important role in an agroecosystem, including pollination, nutrient cycling, decomposition, and providing prey for passerine birds [1]. Noctuidae is probably the most ruling (prominent or dominant) macro-Lepidopteran family, with more than 35,000 recognized species belonging to 29 subfamilies and 4200 genera. The adults are nocturnal and attracted to a light source [2]. Due to the heavy feeding inflicted on plants by the larvae, noctuids are typically considered to be important pests of agroecological system. The immature feed on field crops and cause massive economic losses in maize [3], soybean [4], wheat [5], cotton [6], and rice [7]. Lepidopteran pests generate losses by reducing plant yield and necessitating costly control measures [8].
There is detailed knowledge regarding population abundance as a function of spatiotemporal factors explained by weather variables such as temperature and humidity [9]. Due to their ectothermic physiology, insects are extremely sensitive to climatic fluctuations and exhibit swings in response to a changing climate [10]. Many arthropod species are restricted in their spread by environmental variables such as temperature and precipitation [11]. Additionally, the agricultural landscape complexity and host diversity influence insect abundance [12]. The abundance of noctuid species varies with changes in the agricultural landscape structure at various scales. Their dispersal ability influences the abundance of insects in agricultural landscapes, reproductive success on different host plants, the spatiotemporal distributions of suitable crops and other habitats, and agronomic practices [13]. The spatial distribution of insect populations is important for understanding biotic and abiotic factors’ interactions to form ecological connections [14].
Previously, the spatiotemporal behavior of different insect pest species have been evaluated, including Neoleucinodes elegantalis in South America [15], H. armigera and Pectinophora gossypiella in Greece [16], and S. furgiperda in Mexico [17]. Although the spatiotemporal behavior of different species has been determined in other countries, the knowledge is limited, particularly in Pakistan.
Overall, this study shows the value of the spatial and temporal abundance of different Noctuidae family species that damage economically important crops from localities in Multan, Punjab-Pakistan. The influence of temperature, humidity, and rainfall on species abundance was determined. The present study was conducted to characterize the spatial distribution of the Noctuid species. We analyzed the daily changes in population patterns and the influence of certain meteorological factors on the insect populations. Spatial analysis produced a spatial trend map over space, a temporal stability map over time, and a spatial and temporal trend map for Noctuid species and correlations between other meteorological factors, temperature, and relative humidity, with insect populations, which could lead to separating the field into management zones and direct control over areas that exhibit high densities of the pest population and are stable over time. This study may also be useful for developing an effective and suitable management strategy for noctuid pest control. This is a new approach that assists the sampling of highly diverse populations of nocturnal insect pests quickly.

2. Materials and Methods
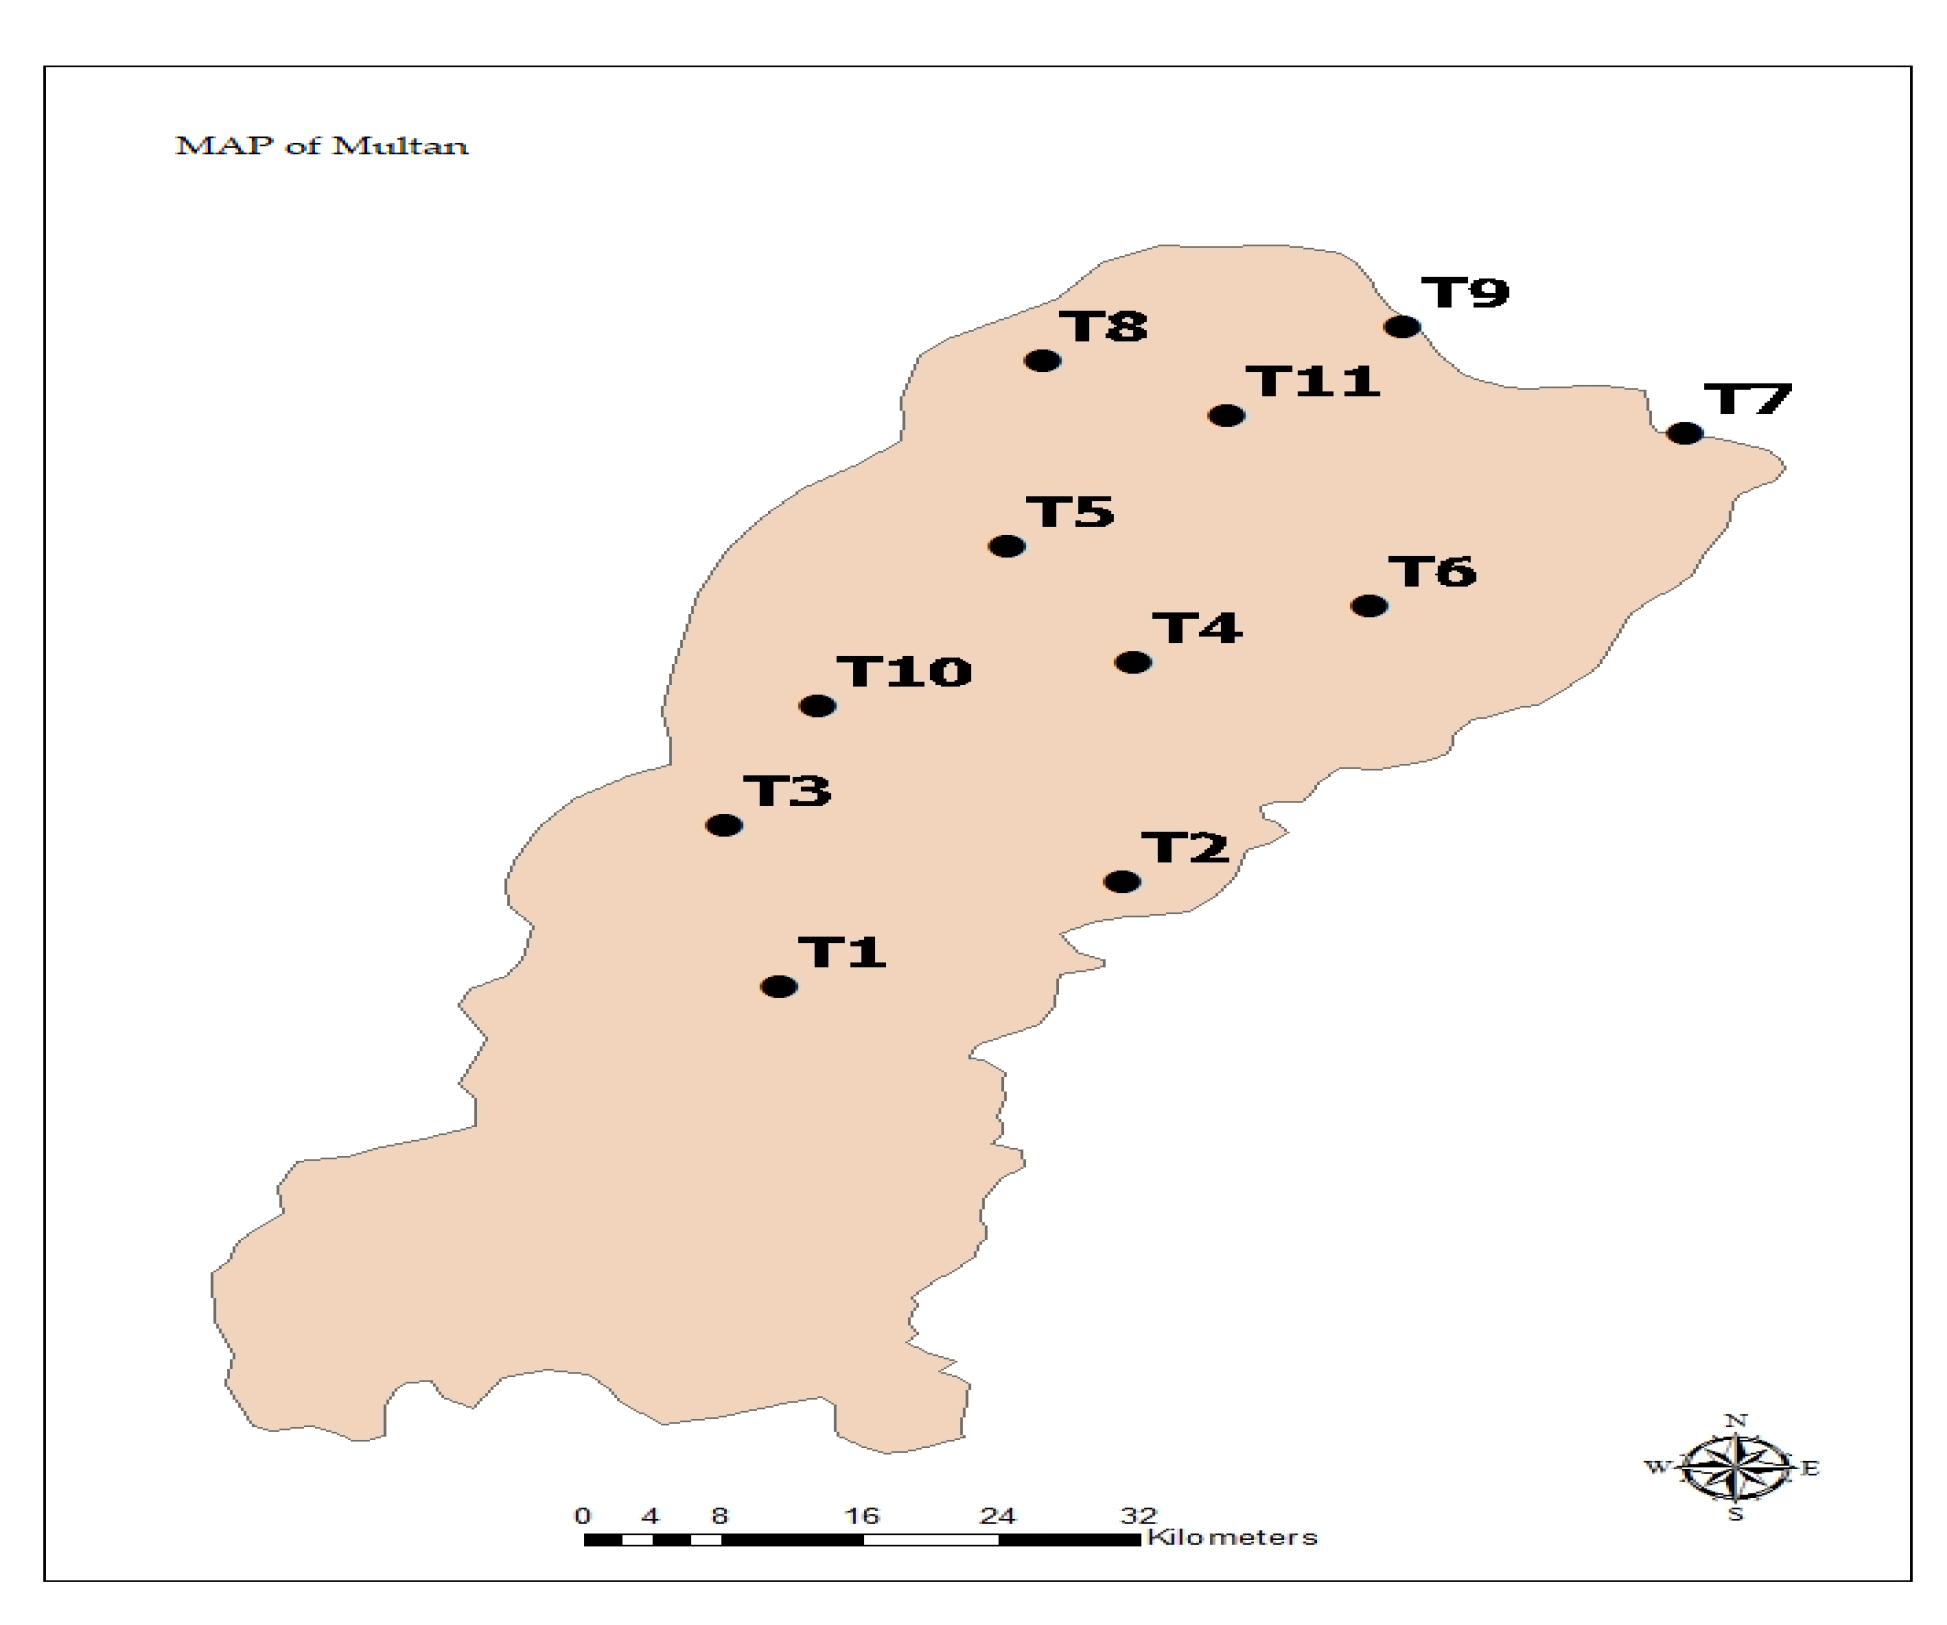
2.1. Study Area

Samples of the family Noctuidae were collected from 11 different selected localities of Multan (29°19′11″ to 30°28′16 N and 70°58′34″ to 71°43′25″ E) through funnel-shaped light traps [18] from July 2020 to June 2021. All traps were installed at 7ft high from the ground surface, and these traps were operated with yellow light bulbs (100 Watt, λ 560 nm). Data were collected on daily basis. The coordinates, i.e., the longitude and latitude of all the traps, were determined using a global positioning system (GPS). All the light traps were installed in different habitats (Figure 1; Table 1). Traps (T1, T2, T3, T4, T5, and T6) were installed in an urban area, but the remaining traps, including T7, T8, T9, T10, and T11, were installed five km away from an urban area. The meteorological data were collected from the meteorological department of the Central Cotton Research Institute (CCRI) in the Multan district.

2.2. Collection and Preservation

The insects were killed in a killing jar from each trap every day and killed trap-wise (Specimens from each trap were killed separately) using potassium cyanide killing jars. The insects were relaxed prior to pinning by placing them in a petri dish wrapped in a wet cloth. The body parts were spread properly, positioned on the stretching board, and dried for 2 to 3 days. Then, the dried specimens were saved in airtight wooden boxes along with naphthalene tablets to protect the samples from predators and other insects such as ants. All the specimens were tagged, including the information of the collector’s name, trap number, specimen number, locality, date, and host.

2.3. Genitalia Extraction and Identification

The genital characteristics do not change morphologically and are used widely for the identification of insect species, because they provide a reliable technique to distinguish species. The genitals were dissected following the techniques described by Sajjad et al. [19]. The abdomen was cut from the moth’s body using forceps and scissors and dipped in 10% potassium hydroxide solution for 12 h. The insect abdomen was dissected with the help of needles under a microscope. The genitalia were washed in distilled water to remove KOH particles and dipped in 70% ethanol solution to clear the parts of the genitalia. The collected samples were identified up to species level on the basis of the genitalia with the help of identification keys, the literature, and internet sources using a stereomicroscope.

2.4. Relative Abundance (RA) Percentage

The relative abundance (RA) percentage was calculated by the following formula.
RA = ni/N × 100
where “ni” is the total number of individuals in the “ith” specie, and “N” is the total number of noctuid moths in the sampling area [20].

2.5. Spatial and Temporal Analysis

The Golden software Surfer version 8.02 was used to analyze the spatial abundance. The spatial contour maps were constructed to determine the distribution pattern of all species over space. Surfer generated a grid of values by interpolating the z values. Linear kriging was developed as the interpolation algorithm. The interpolation grid was used to generate a contour map. The temporal pattern graphs for each species were plotted using Prism software version 8.4. The data of all traps of each species were pooled by plotting a graph.

2.6. Statistical Analysis

The data for each noctuid moth species abundance were pooled and analyzed by fixed effect model, i.e., least squares dummy variable model (LSDV) using EViews software (Markit) version 12 to determine the effect of meteorological factors including temperature (Tem), humidity (Hum), and rainfall (Rain) on species abundance (SABUN) at significance level (p < 0.05).

2.6.1. Pooled OLS

We pooled all the data and ran the ordinary least squares (OLS) regression model.
SABUNit = β1i + β2Temit + β3Humit + β4Rainit + εit
where i stands for the ith cross-sectional unit and t for the tth time.

2.6.2. Fixed Effect Model

The Fixed Effect Model for Cross Section (Intercept or Individual) was used to determine the spatial effect on the distribution of species.
Yit = α1 + α2T2i + α3T3i + α4T4i + α5T5i + α6T6i + α7T7i + α8T8i + α9T9i + α10T10i + α11T11i + α12T12i + β2Temit + β3Humit + β4Rainit + eit
where T2i = 1 if the observation belongs to cross section 1 (Trap1), T3i = 1 if the observation belongs to cross section 2 (Trap2), and it continues in the same way for all eleven cross sections. α1 represented the intercept of Trap1 and α2, α3, …, and α11 represented the differential intercept coefficients of the different cross sections.

Fixed Effect Hypothesis Testing

Fgroupseffects = [(R2fix − R2pooled)/(N − 1)] ÷ [(1 − R2LSDV)/(NT − N − k)]
Here, T is the total number of temporal observations, N is the number of cross sections, and k is the number of regressors in the model.
The statistical difference between noctuid moths captured through light traps from different types of habitats was determined by performing a one-way analysis of variance (ANOVA) using Graph prism 9.2.0, and the means were compared by the least significant difference (LSD) at significance level (p < 0.05).

3. Results

3.1. Abundance of Noctuid Moths

A total of 17,020 specimens of the family Noctuidae were collected by light traps from the 11 different selected localities in the Multan district. The maximum number of samples (2636) was captured from Trap 7 followed by Trap 9 (2261), Trap 1 (2248), Trap 11 (2157), Trap 10 (2094), Trap 8 (1430), Trap 2 (1203), Trap 6 (1056), Trap 5 (740), Trap 4 (616), and Trap 3 (579). During the research, 24 species of family Noctuidae were identified on the basis of the genitalia. The maximum abundance was recorded of specie S. litura (3171), followed by H. tripoli (2074), H. Jahangiri (1813), H. armigera (1724), S. exigua (1480), S. furgiperda (1034), H. stigmosa (721), A. ipsilon (486), Callopistria placodoides (Guenee) (449), Aletia album (Linnaeus) (442), Callopistria repleta (Walker) (366), A. cinerea (352), E. insulana (348), M. loreyi (323), L. oleracea (293), E. vitella (281), Euplexia conducta (279), Mamestra brassicae (276), Helicoverpa platigera (Wallengren) (240), Leucania venalba (Moore) (237), Ctenopulsia albostriata (Bremer) (203), Aletia decisissima (Walker) (185), Diarsia hoenei (160), and C. furthatai (83). (Table 2).

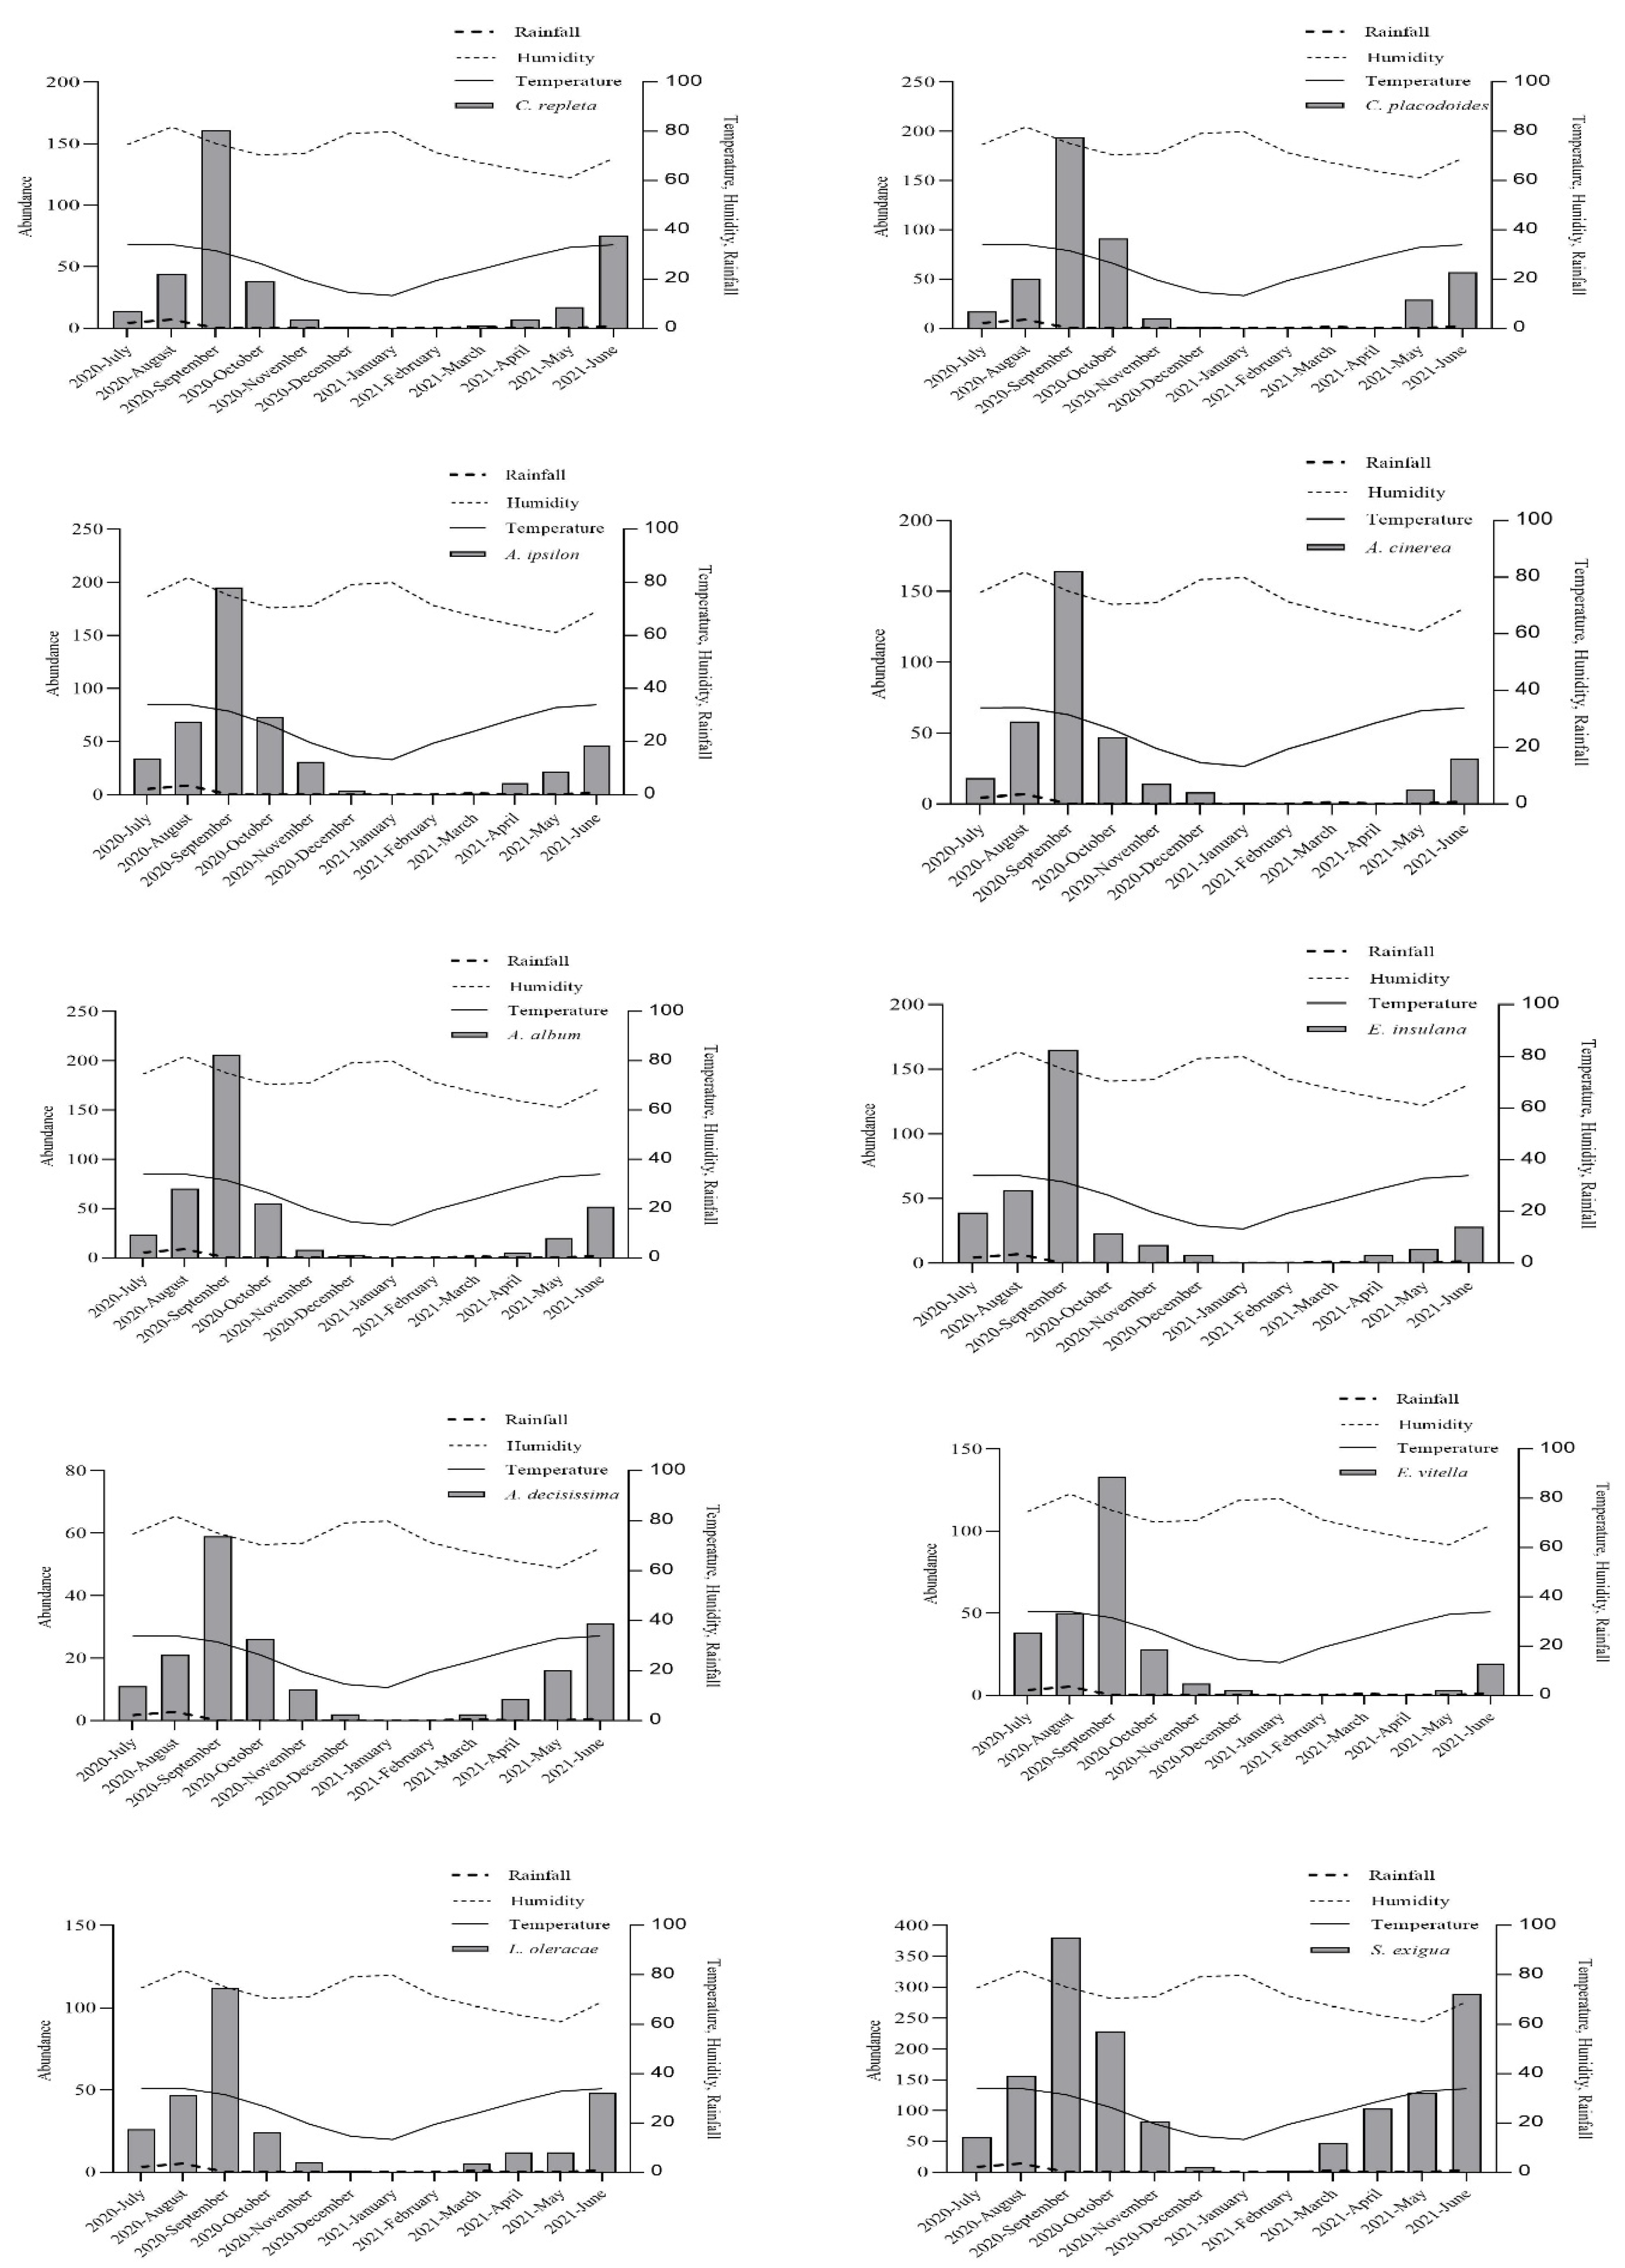
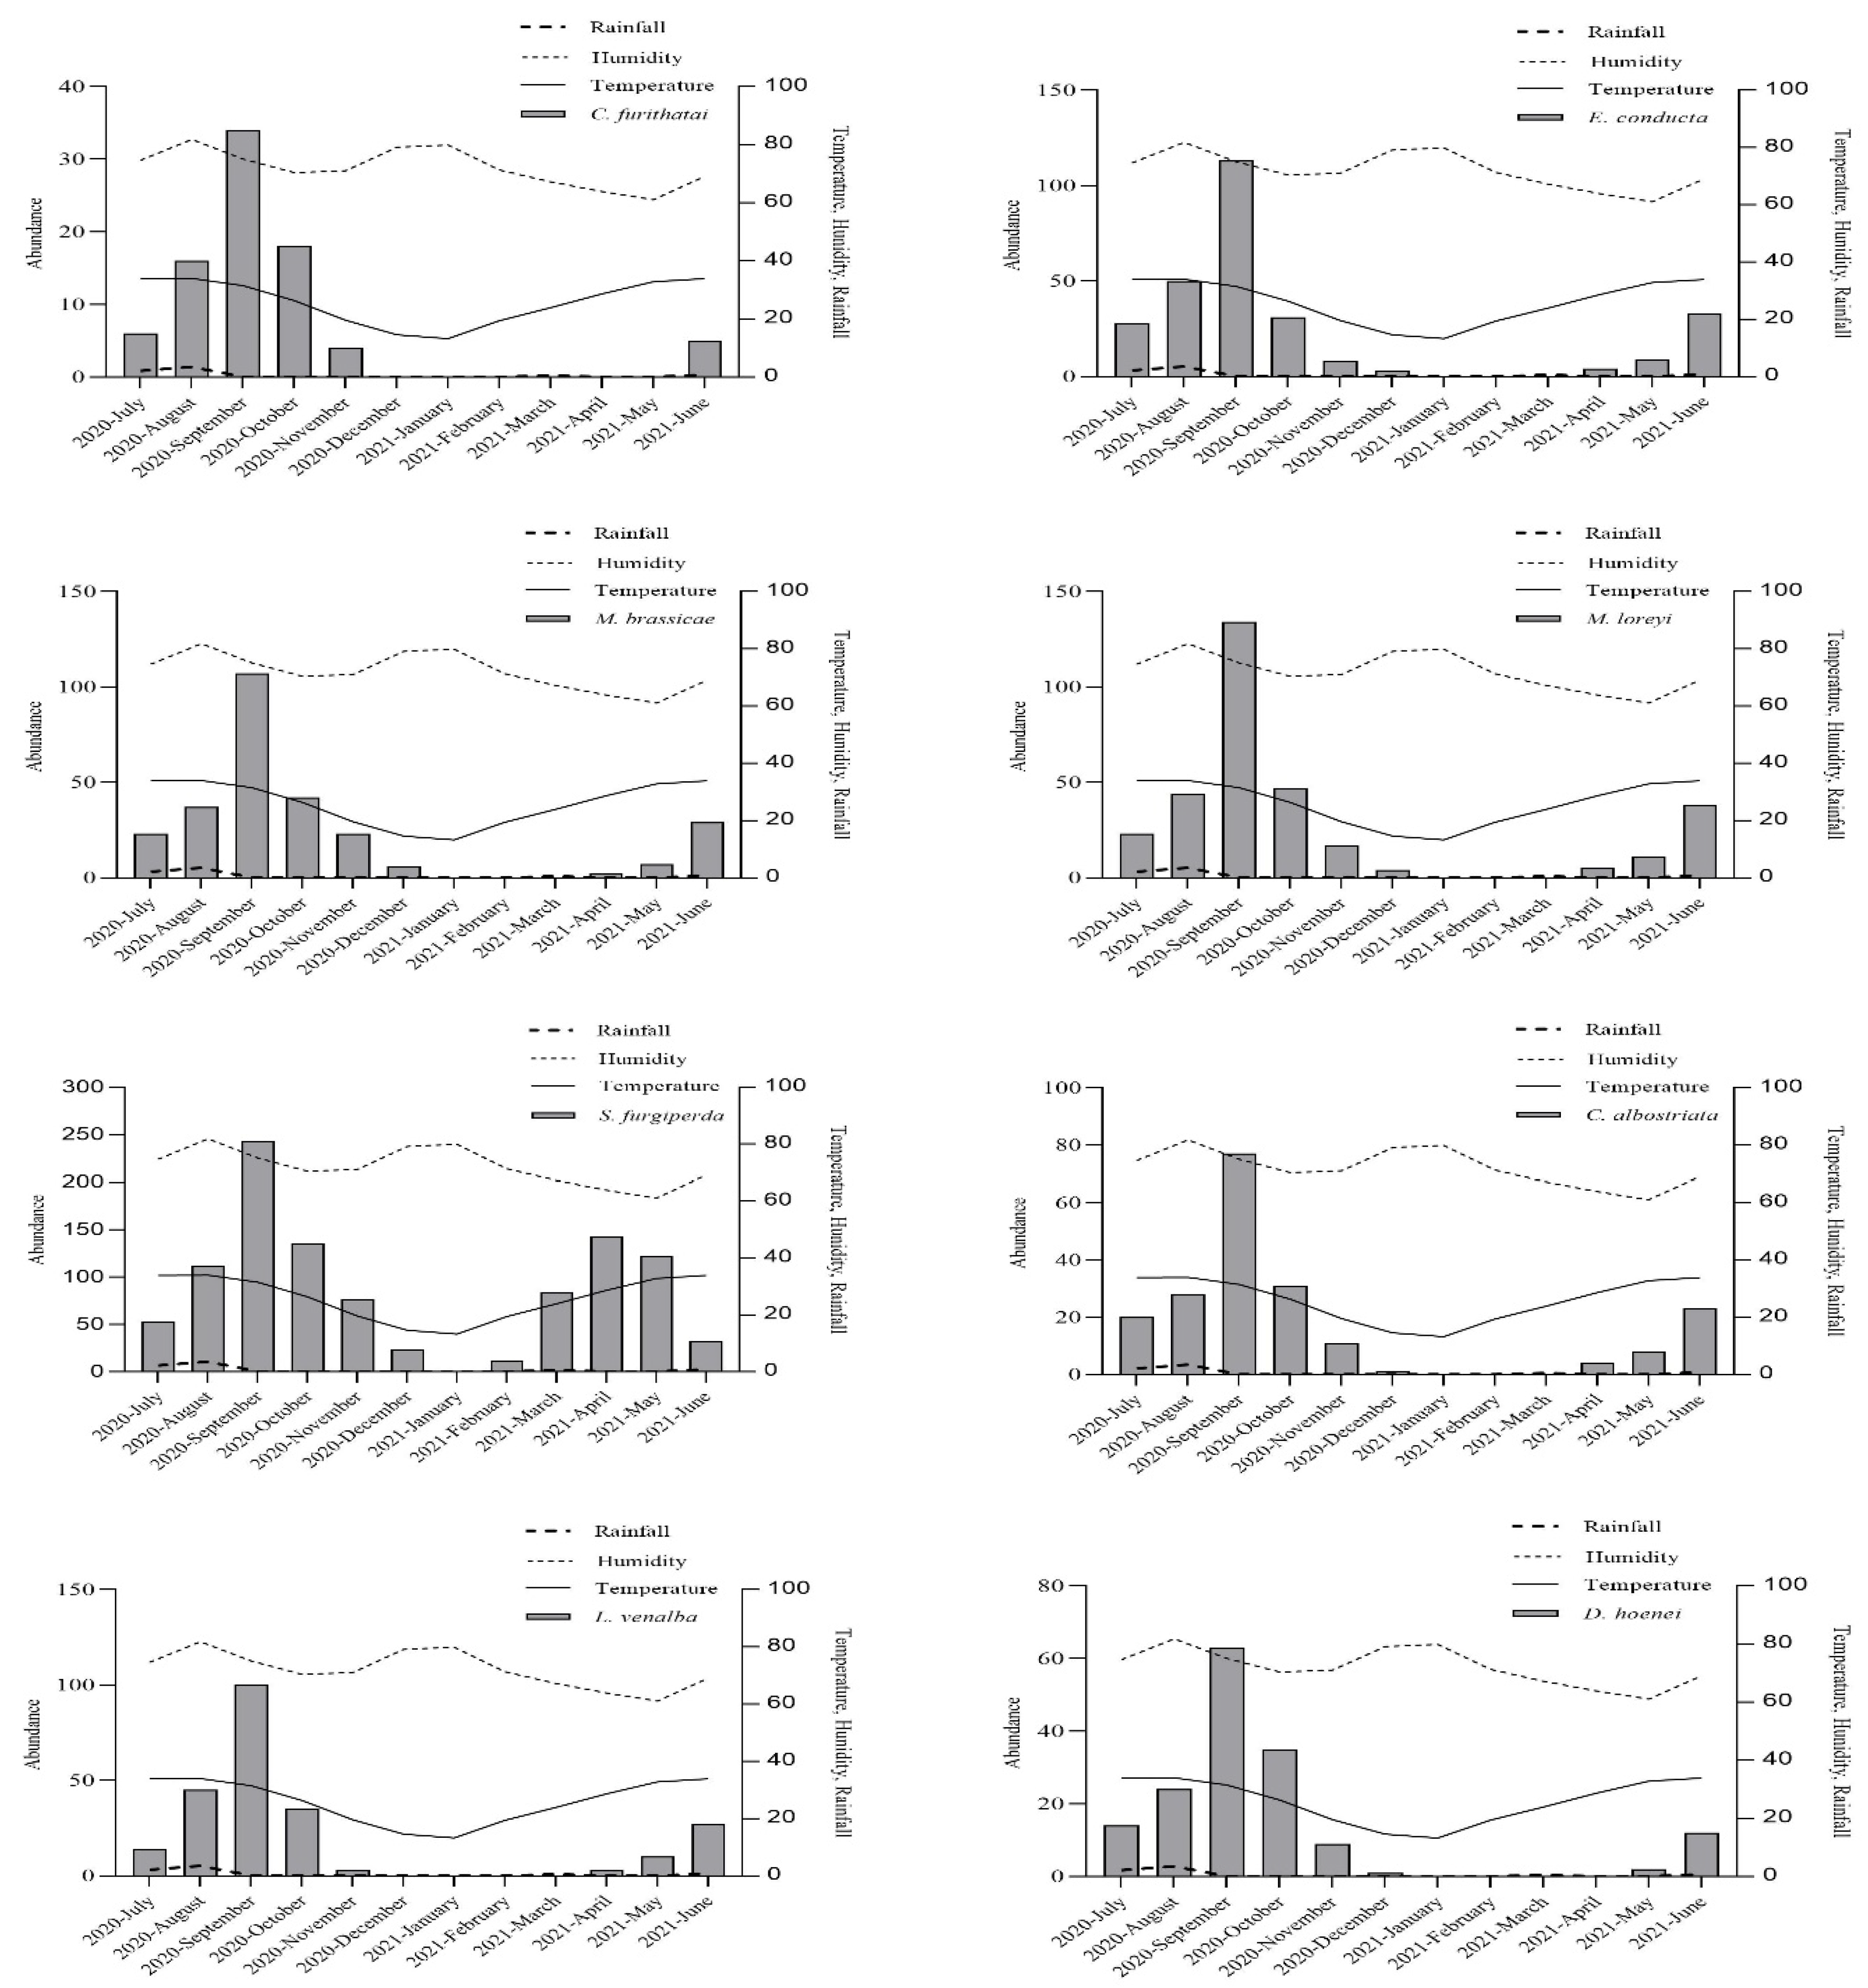
3.2. Effect of Meteorological Factors on Species Abundance

The factors, i.e., temperature, humidity, and rainfall had a significant effect on all species captured. The temperature and humidity showed a positive correlation, while the humidity negatively correlated with all described species abundance. The F-test value showed the overall significance of these meteorological factors (Table 3).

3.3. Temporal Distribution

The maximum abundance (199) of H. stigmosa was recorded in September 2020 and declined to zero in January 2021. The species H. trifoli was observed at its maximum (585) in September 2020 and declined to zero in January and February 2021; then, it started to increase from March with a gradual increase in temperature. The maximum abundance of H. jahangiri (460) and S. litura (826) was recorded in September 2020 and declined to zero in January and February 2021. The population of both species increased gradually with the temperature increase from February to June 2021. The maximum abundance of H. armigera (493) and H. punctigera (93) was recorded in September 2020 and declined to zero in January and February 2021. The population of both species increased gradually with the temperature increase from February to June 2021. The maximum abundance of C. repleta (161) was recorded in September 2020 and declined to zero in January and February 2021. The specie C. placodoides was recorded at its maximum (194) in September 2020 and declined to zero in January, February, March, and April 2021. The maximum abundance of A. ipsilon (195) was recorded in September 2020 and declined to zero in January, February, and March 2021. The specie A. cinerea was recorded at its maximum (164) in September 2020 and declined to zero in February, March, and April 2021. The maximum abundance of A. album (206) and E. insulana (165) was recorded in September 2020 and declined to zero in January, February, and March 2021. The maximum abundance of A. decisissima (59) and E. vitella (133) was recorded in September 2020, and A. decisissima declined to zero in January and February 2021, while E. vitella remained absent from January to April 2021. The maximum abundance of L. oleracea (112) and S. exigua (380) was recorded in September 2020, and L. oleracea declined to zero in January and February 2021, while S. exigua was recorded at zero in January. The specie C. furthatai was recorded at its maximum (of 34) in September 2020 and declined to zero in December, January, February, March, April, and May 2021. The specie E. conducta was recorded at its maximum (113) in September 2020 and declined to zero in January, February, and March 2021. The maximum abundance of M. brassicae (107) and M. loreyi (134) was recorded in September 2020 and declined to zero from January to March 2021. The specie S. furgiperda showed maximum abundance (243) in September 2020 and declined to zero in January 2021. The specie C. albostriata showed maximum abundance (77) in September 2020 and declined to zero from January to March 2021. The maximum abundance of L. venalba (113) and D. hoenei (63) was recorded in September 2020, and the abundance of D. hoenei declined to zero in January, February, March, and April 2021. The abundance of L venalba was not recorded from December 2020 to March 2021 (Figure 2).

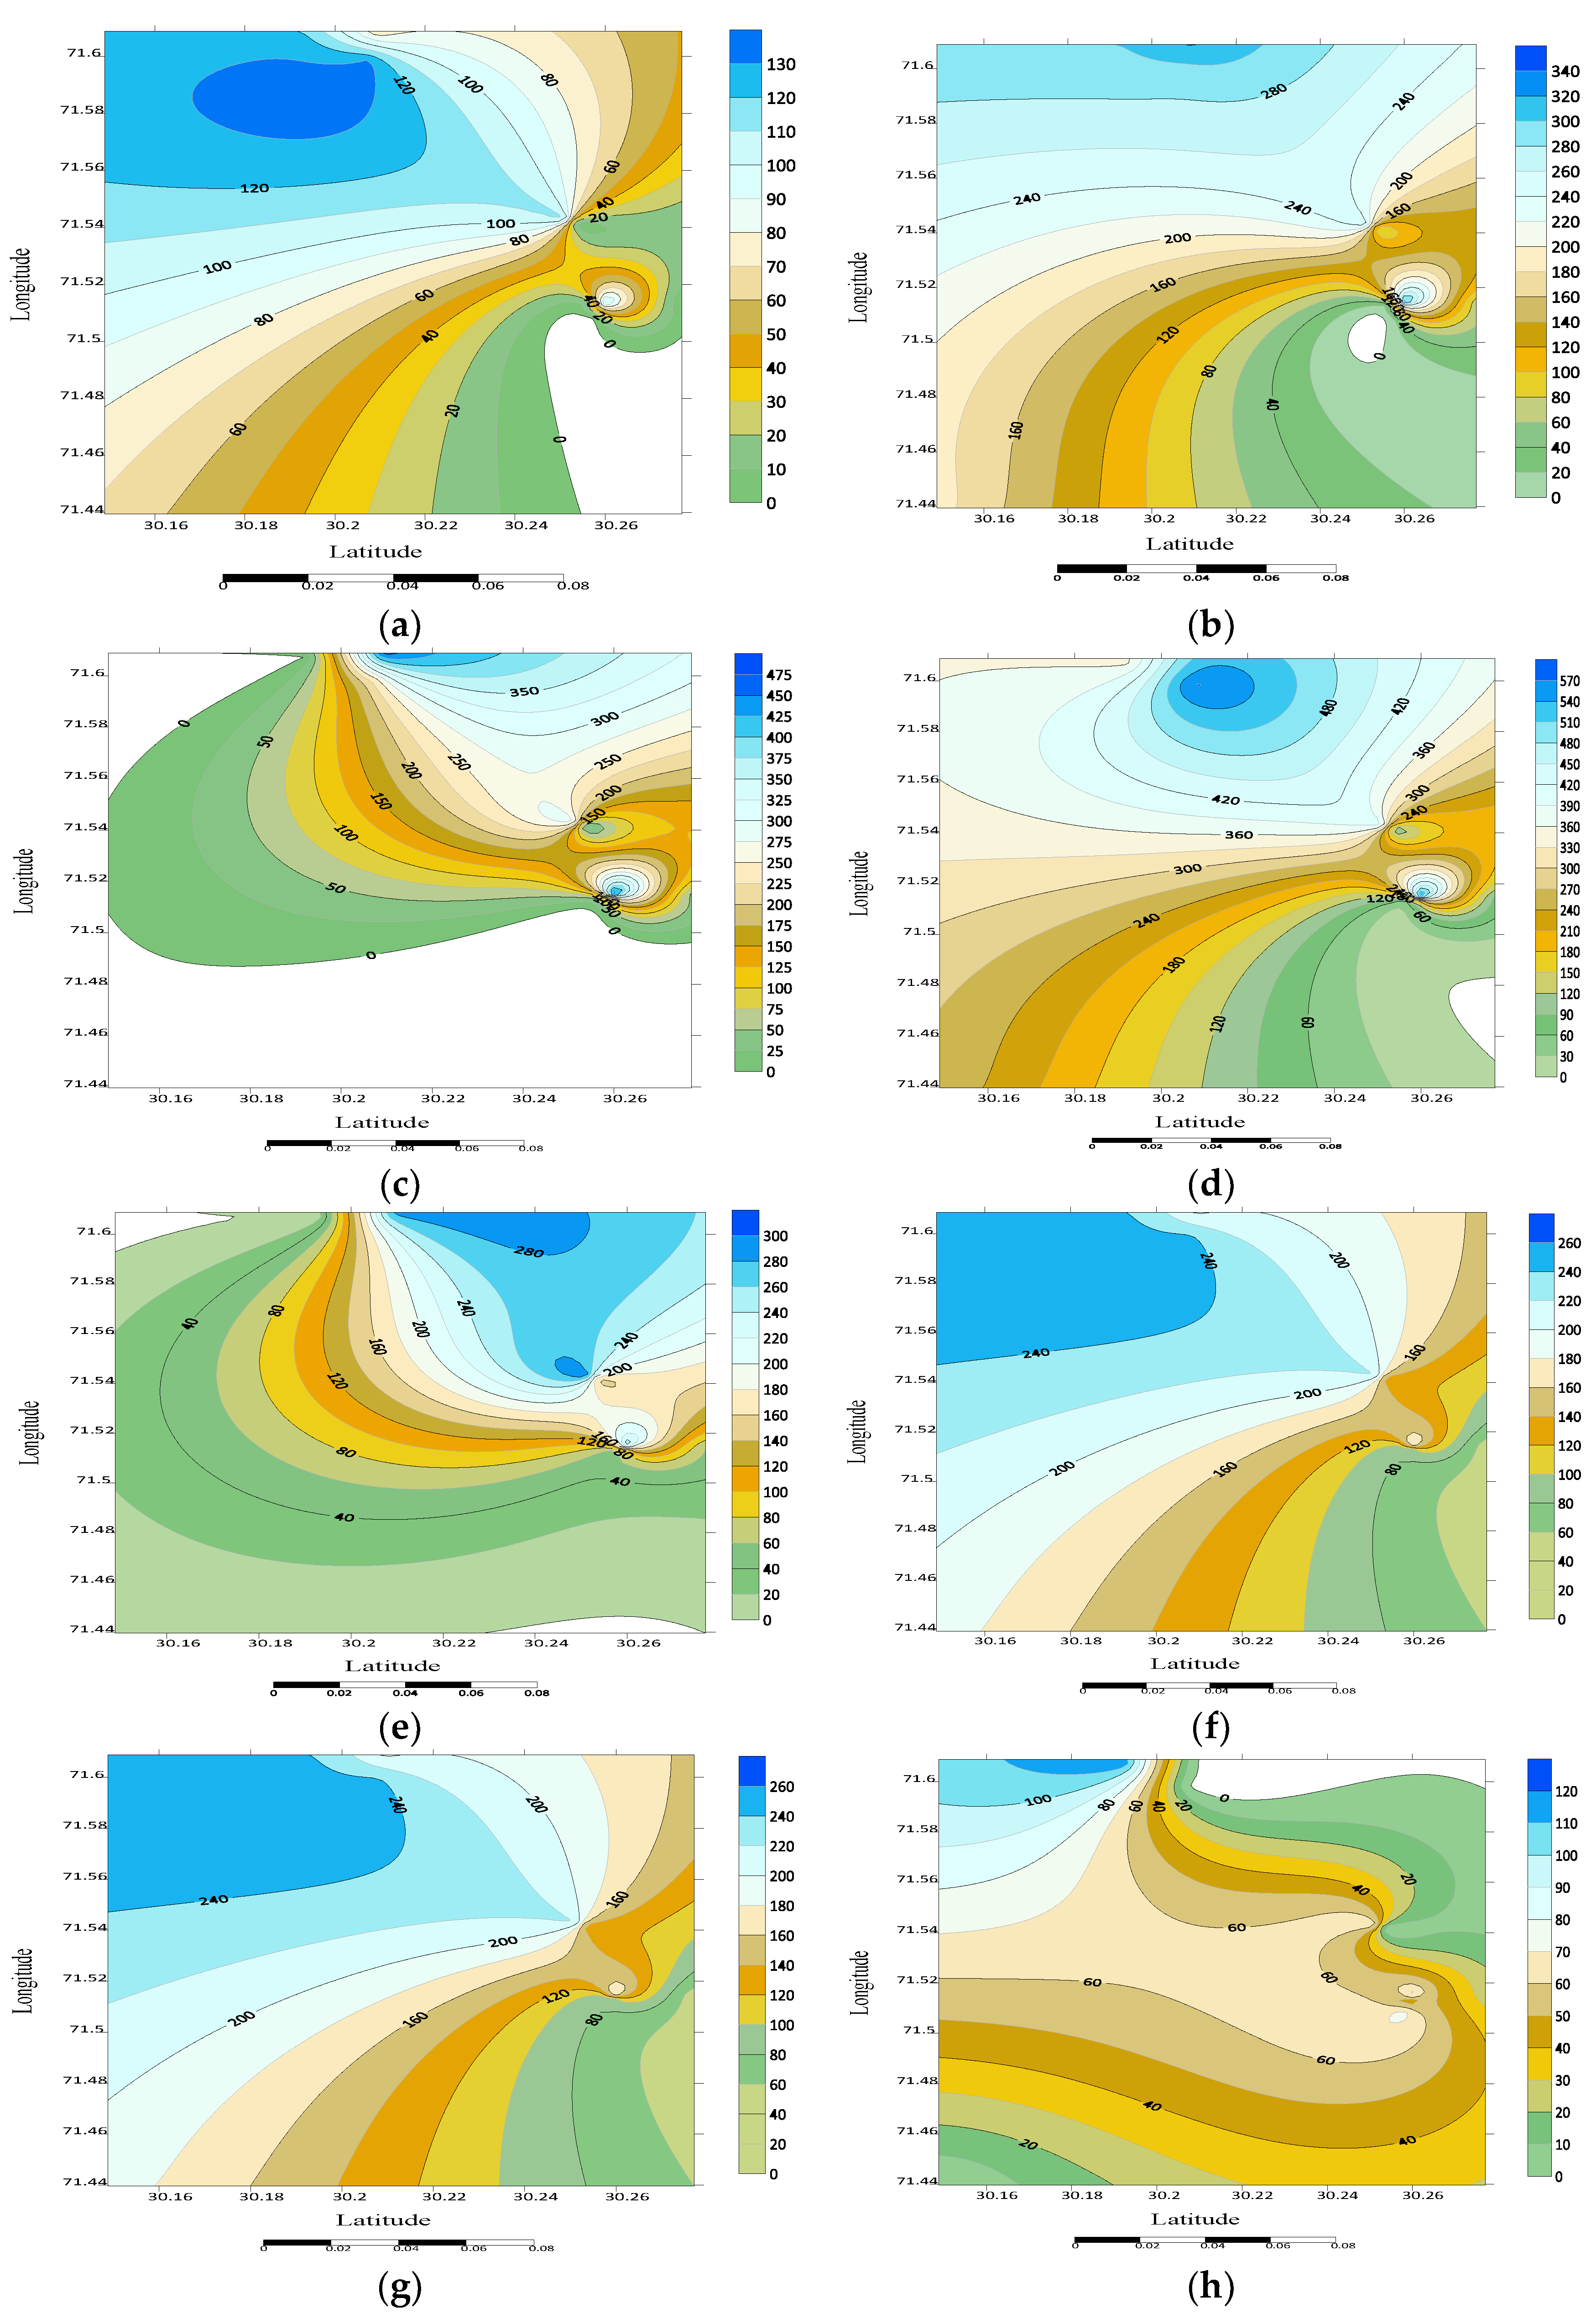
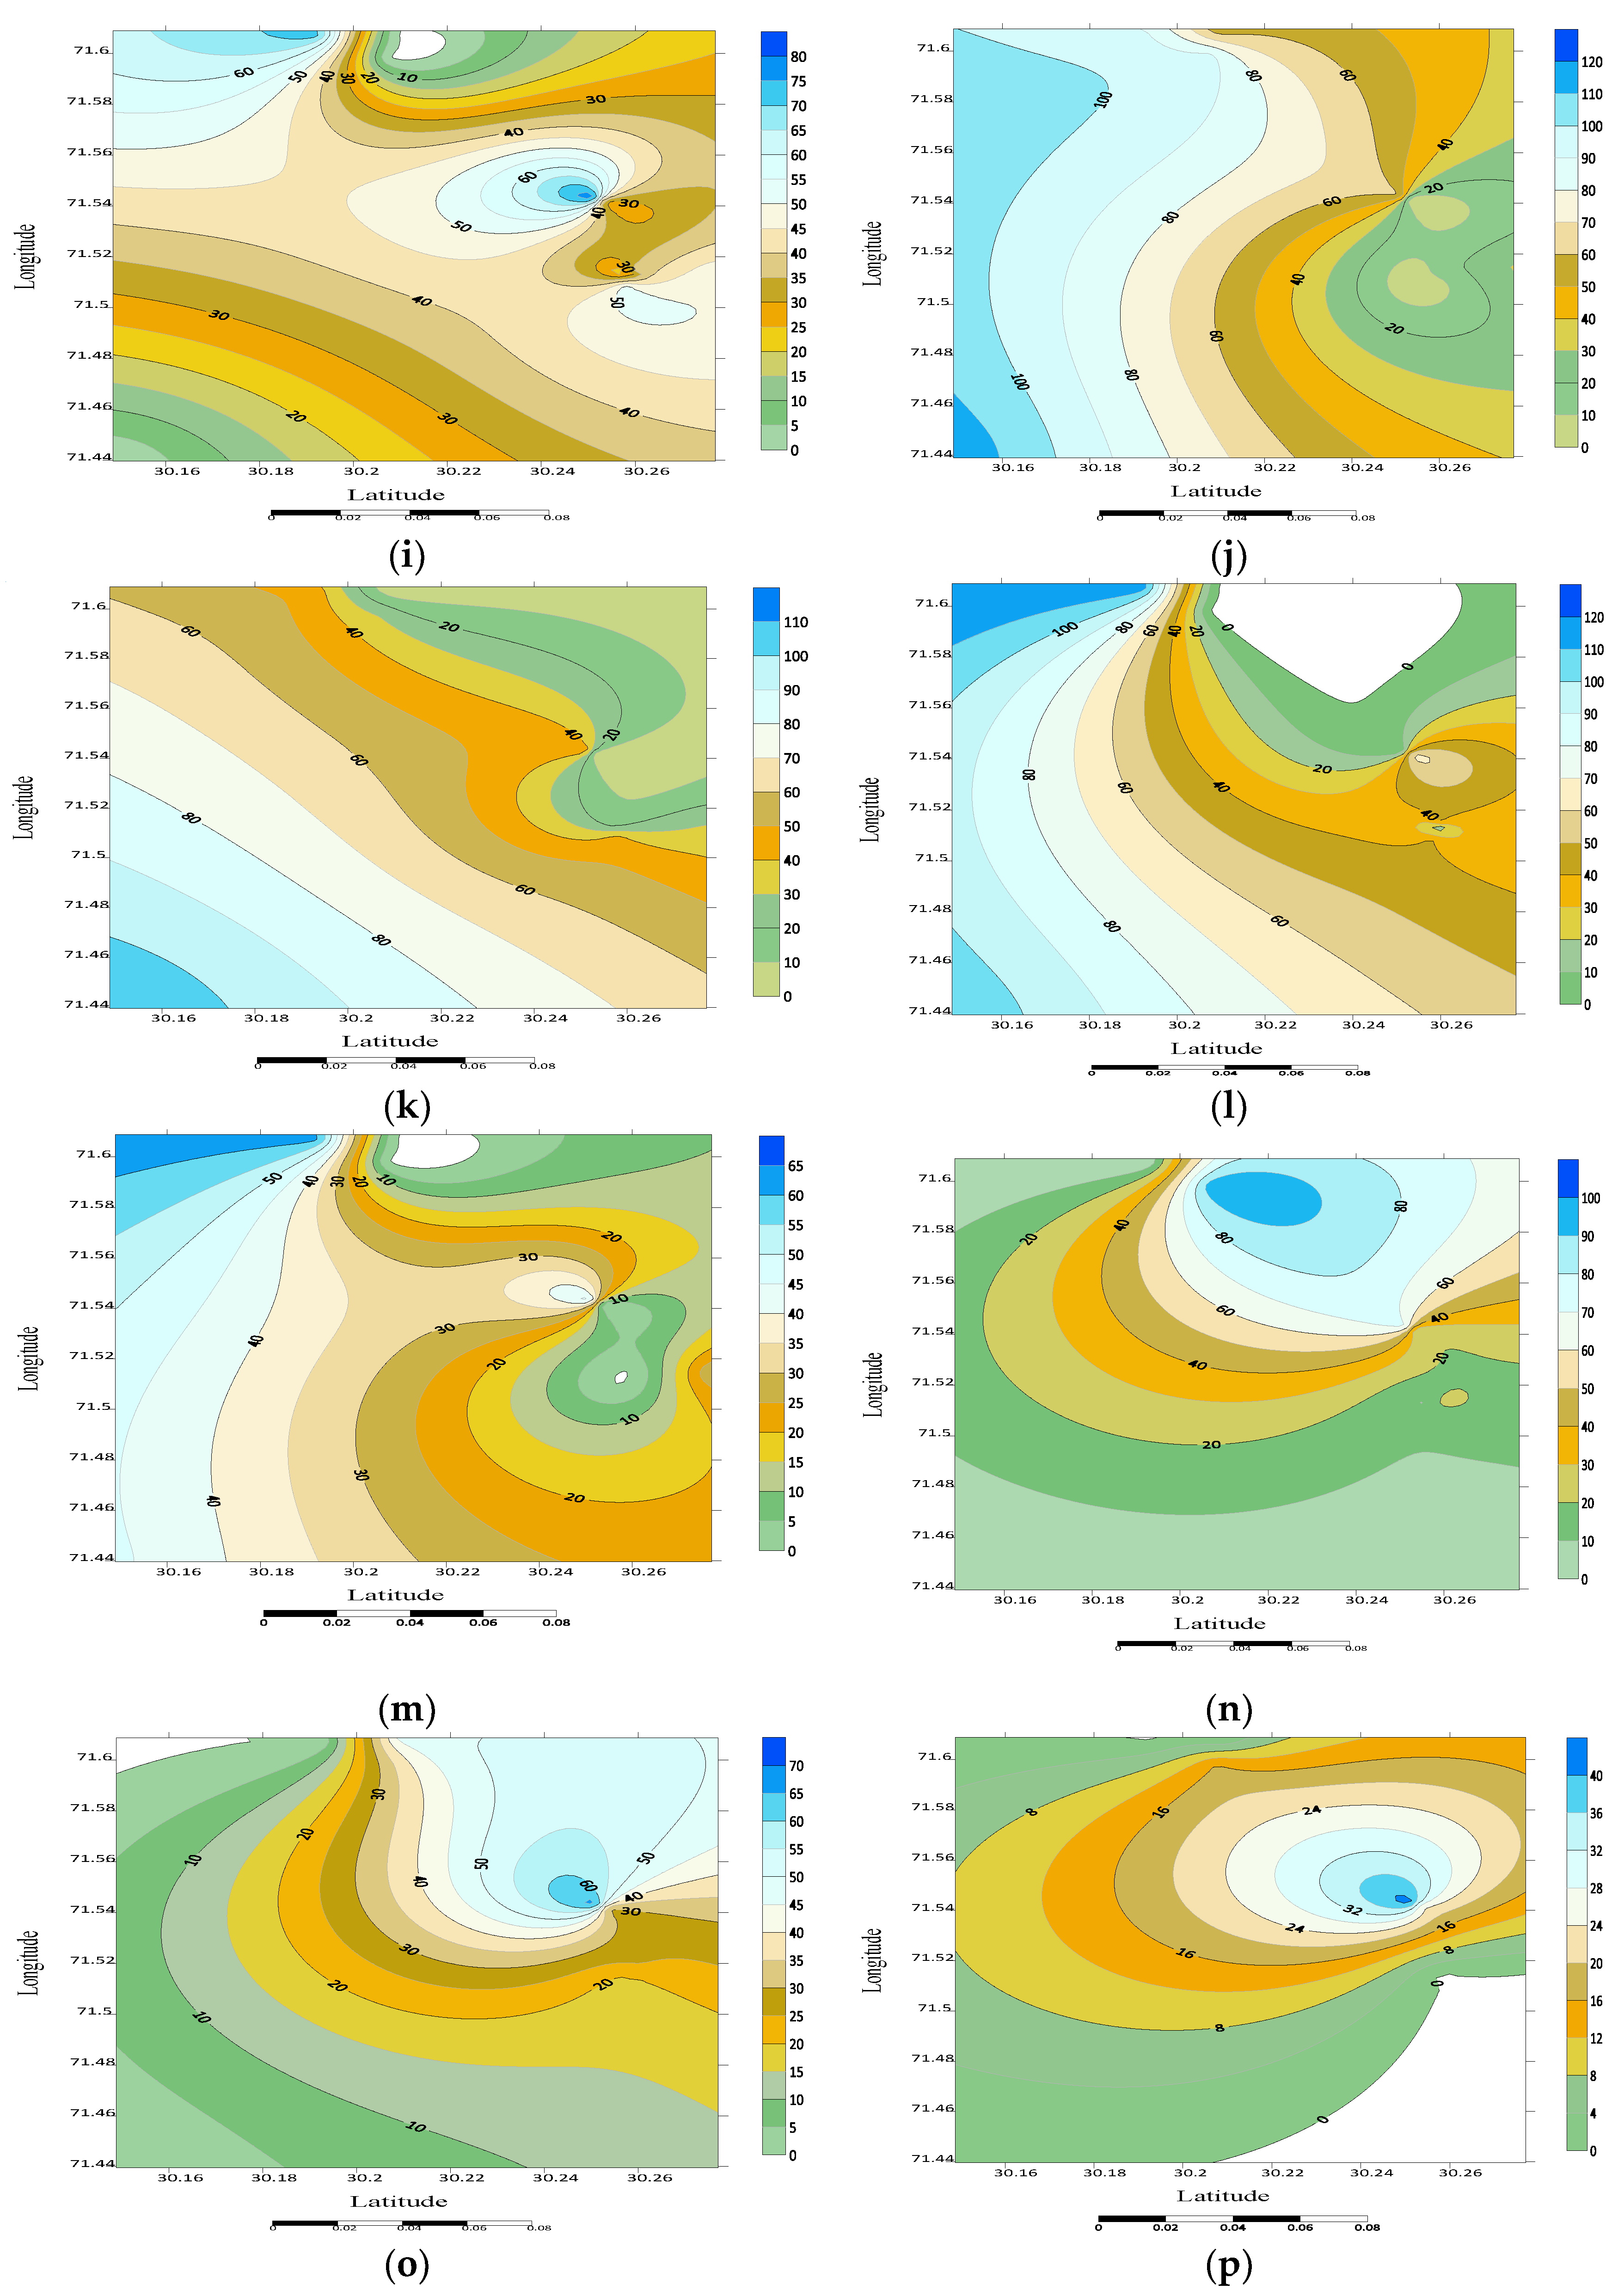
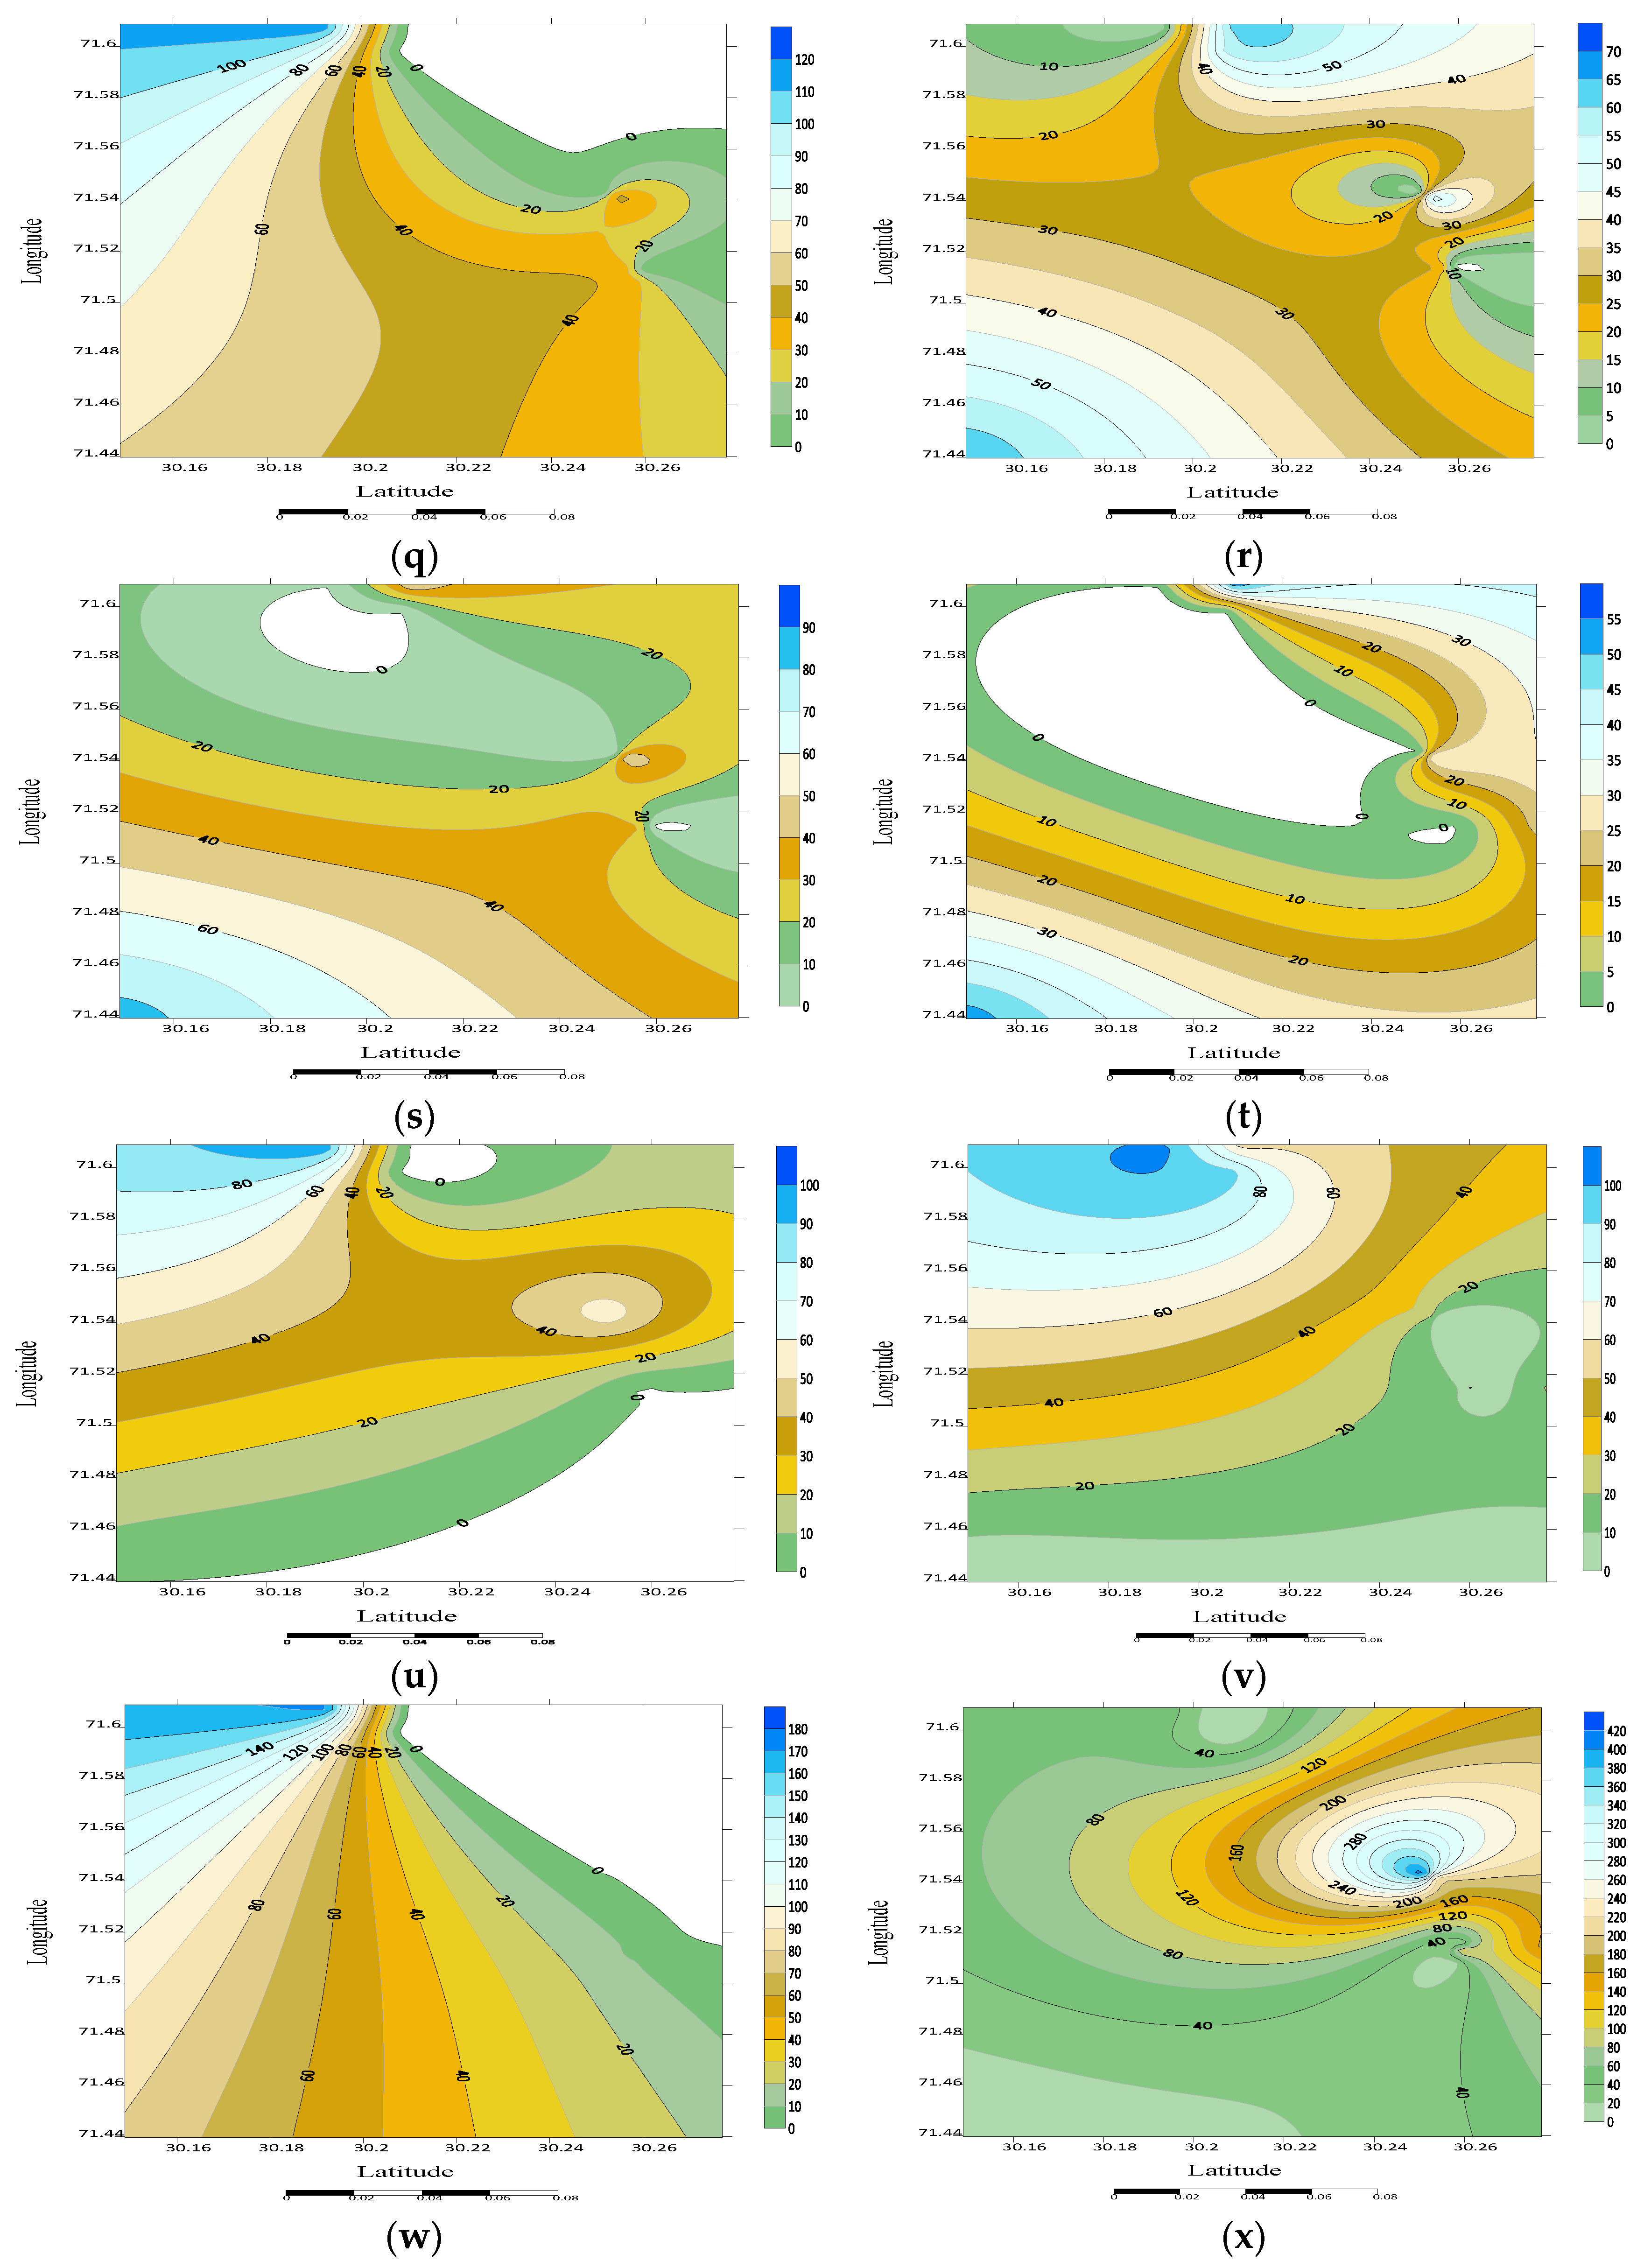
3.4. Spatial Distribution

The contour maps interpolated the expected population abundance data at individual locations from an entire area. In the maps, contour lines were used to differentiate the abundance values. The area between two contour lines represented the species abundance. All the species showed aggregation in areas of their favorite host plants and dispersal in other areas (Figure 3).

3.5. Noctuid Moth Abundance from Different Habitats

Recorded noctuid moth populations from different habitats showed a significant (p < 0.05) difference. The maximum abundance was recorded from crop areas 5 km away from urban areas, followed by crop areas near the urban area. The minimum population of insects was found in forested areas (Figure 4).

4. Discussion

This study provides an effective pipeline for a large-scale sampling of noctuid moths and spatial and temporal fluctuations in abundance of field sampling using a light trap. The light traps proved to be successful at collecting a large number of nocturnal moths and evaluating the spatiotemporal abundance of different species of the family Noctuidae that cause damage to economically important crops [12]. The climatological factors such as temperature and humidity had a significantly positive correlation, while rainfall indicated a significantly negative correlation, with the species composition. The maximum species abundance was recorded in cropping areas as compared to woodland areas. Overall, we propose that our methodological channel be extensively applied in ecological studies, to improve our understanding of the trends in nocturnal moth communities and to complement studies based on spatiotemporal distribution patterns, through the yellow light traps that were so efficient in capturing nocturnal moths. To enhance the potential of this pipeline in ecological studies, efforts are needed to test its effectiveness and potential biases across habitat types.
The maximum abundance of noctuid moths was observed from Trap 7, 9, 1,11, and 10 installed in complex cropping habitats of cotton, maize, wheat, rice, and vegetables. Previous studies have described that insect abundance is influenced by landscape complexity and host diversity. The maximum abundance of H. armigera was recorded from complex crop systems compared with simple crop systems [12].
The temporal and spatial patterns of these 24 species belonging to the family Noctuidae have been studied from different localities within the Multan district. Our results indicated that the meteorological factors of temperature, humidity, and rainfall had a significant effect on the species’ population dynamics. Temperature and humidity showed a positive correlation, while rainfall was negatively correlated with species abundance. Similar results were described previously, as meteorological factors significantly influence the population dynamics of noctuid species [21]. The resulting map provided an extremely effective aid for visualizing the spatial distribution of the target population. All the species showed different spatial distribution patterns that might be due to the favorable host plant distribution or latitudinal differences. Previous studies have recorded that the population abundance of arthropods is affected by the agricultural landscape, latitude, longitude, and climatic factors [22].
Understanding the temporal behavior of noctuid moths is fundamental for developing management programs to control these pests. It can provide important information to demonstrate when and where noctuid pests should be controlled to elude economic losses by formulating timely control measures. In the present study, the maximum population of nocturnal moths occurred in moth of September, while January and February were less favorable. Previous studies have described that the maximum population was observed in early spring in March and April, while the summer and winter were less favorable. These observations suggest that the temporal fluctuation of moth populations is related to different climatic variables, such as temperature, rainfall, and relative humidity [23].
Information on the spatial dispersal is the initial step in the decision-making process to manage the diverse insect pests with an integrated pest management strategy when mandatory in specific crop or field areas. In addition to this study, future research should be conducted for other damaging pests in the agroecosystem, as well as monitoring the population of these pests in other host plants and native vegetation, aiming to understand the farmscape ecology of destructive pests in time and space, and improving approaches to the population control of phytophagous noctuid pests. In the present study, all the species showed aggregation in areas of their favorable host plants and dispersal in other areas. This study was in agreement with Xiong et al. [24], who reported a distribution contour map that indicated an aggregation of P. xylostella in the agricultural landscape, mostly in the area with the availability of food, especially cruciferous vegetables, and the dispersal pattern of P. xylostella population dynamics was associated with the shortage of favorable food.
The maximum abundance of the collected species was recorded in the crop areas that were away from urban areas, as compared to the crop areas that were near urban areas. In contrast, the minimum population abundance was recorded in the forest areas. In seminatural habitats, the population abundance of pests was low due to natural enemies [13]. The artificial lighting in urban areas has conspicuous ecological consequences on the nocturnal moths, leading to a lower moth population [24].
Significant attention in recent years has been paid to the impact of agroecosystem land on integrated pest management [25,26,27]. The distribution of Spodoptera litura in our study was increased in the area of agricultural and horticultural crops, especially the cultivation of cotton crops. S. litura captures were highly influenced by the cropping systems in the locality, and the spatial trend of dispersion was consistent with the cotton field. In forest ecosystems, S. litura showed a distinctive spatial distribution pattern among patches, and the layout of the host plant patches is one of the drivers that affects this distribution pattern, Sciarretta [28].

5. Conclusions

This study characterized the temporal dynamics and spatial distribution of S. litura, H. tripoli, H. Jahangiri, H. armigera, S. exigua, S. furgiperda, H. stigmosa, A. ipsilon, C. placodoides, A. album, C. repleta, A. cinerea, E. insulana, M. loreyi, L. oleracea, E. vitella, E. conducta, M. brassicae, H. platigera, L. venalba, C. albostriata, A. decisissima, D. hoenei, and C. furthatai in an agricultural landscape and demonstrated that the climatic factors of temperature, humidity, and rainfall had a strong impact on the distribution of species. The results advance our understanding of the temporal and spatial distribution of the noctuid species on a diversified fauna in the Multan district that will help forecast the population dynamics and implement an integrated pest management program.

Author Contributions

Conceptualization, Z.M.S. and A.A.; methodology, Z.M.S.; software, A.A. and N.A validation, S.K.A., P.A. and A.A.A.; formal analysis, Z.M.S., A.A. and N.A.; investigation, Z.H.; resources, Z.M.S., A.A. and N.B.J.; data curation, Z.M.S., A.A. and F.Z.; writing—original draft preparation, Z.M.S. and N.A; writing—review and editing, Z.M.S., N.A., S.K.A., P.A., A.A.A., F.Z. and N.B.J.; visualization, P.A., A.A.A., F.Z. and N.B.J.; supervision, Z.M.S.; project administration, Z.M.S.; funding acquisition, S.K.A. and F.Z. All authors have read and agreed to the published version of the manuscript.

Funding

The author extends his appreciation to the Deanship of Scientific Research at King Khalid University for funding this work through the General Research Project under Grant number (RGP. 1/289/43).

Data Availability Statement

The datasets used and analyzed during the current study are available from the corresponding author upon reasonable request.

Conflicts of Interest

The authors disclose no conflicts of interest of any kind associated with this manuscript.

References

  1. Resh, V.H.; Cardé, R.T. (Eds.) Encyclopedia of Insects; Academic Press: Cambridge, MA, USA, 2009; pp. 501–502. [Google Scholar]
  2. Sivasankaran, K.; Ignacimuthu, S.; Paulraj, M.G.; Prabakaran, S. A checklist of Noctuidae (Insecta: Lepidoptera: Noctuoidea) of India. Rec. Zool. Surv. India 2011, 111, 79–101. [Google Scholar] [CrossRef]
  3. Maruthadurai, R.; Ramesh, R. Occurrence, damage pattern and biology of fall armyworm, Spodoptera frugiperda (JE smith) (Lepidoptera: Noctuidae) on fodder crops and green amaranth in Goa, India. Phytoparasitica 2020, 48, 15–23. [Google Scholar] [CrossRef]
  4. Stacke, R.F.; Arnemann, J.A.; Rogers, J.; Stacke, R.S.; Strahl, T.T.; Perini, C.R.; Dossin, M.F.; Pozebon, H.; De-Arruda-Cavallin, L.; Guedes, J.V. Damage assessment of Helicoverpa armigera (Lepidoptera: Noctuidae) in soybean reproductive stages. Crop Protect. 2018, 112, 10–17. [Google Scholar] [CrossRef]
  5. Yang, Xi.; Song, Yi.; Sun, Xi.; Shen, Xi.; Wu, Qi.; Zhang, Ha.; Zhang, Da.; Zhao, Sh.; Liang, Ge.; Wu, Ko. Population occurrence of the fall armyworm, Spodoptera frugiperda (Lepidoptera: Noctuidae), in the winter season of China. J. Integr. Agric. 2021, 20, 772–782. [Google Scholar] [CrossRef]
  6. Luttrell, R.G.; Wan, L.; Knighten, K. Variation in susceptibility of noctuid (Lepidoptera) larvae attacking cotton and soybean to purified endotoxin proteins and commercial formulations of Bacillus thuringiensis. J. Econ. Entomol. 1999, 92, 21–32. [Google Scholar] [CrossRef]
  7. Kalleshwaraswamy, C.; Asokan, R.; Mahadevaswamy, H.; Sharanabasappa, C. First record of invasive fall armyworm, Spodoptera frugiperda (JE Smith) (Lepidoptera: Noctuidae) on rice (Oryza sativa) from India. J. Entomol. Zool. 2019, 7, 332–337. [Google Scholar]
  8. Paula-Moraes, S.V.; Silva, F.D.A.; Specht, A.; Rapisarda, C.; Cocuzza, G.E.M. Options and challenges for pest control in intensive cropping systems in tropical regions. J. Integr. Pest Manag. Tropical. 2017, 1, 18–32. [Google Scholar]
  9. Allstadt, A.J.; Liebhold, A.M.; Johnson, D.M.; Davis, R.E.; Haynes, K.J. Temporal variation in the synchrony of weather and its consequences for spatiotemporal population dynamics. Ecology 2015, 96, 2935–2946. [Google Scholar] [CrossRef] [Green Version]
  10. Colinet, H.; Sinclair, B.J.; Vernon, P.; Renault, D. Insects in fluctuating thermal environments. Annu. Rev. Entomol. 2015, 60, 123–140. [Google Scholar] [CrossRef] [Green Version]
  11. Robinet, C.; Roques, A. Direct impacts of recent climate warming on insect populations. Integer. Zool. 2010, 5, 132–142. [Google Scholar] [CrossRef]
  12. Lu, Z.Z.; Baker, G. Spatial and temporal dynamics of Helicoverpa armigera (Lepidoptera, Noctuidae) in contrasting agricultural landscapes in northwestern China. Int. J. Pest Manag. 2013, 59, 25–34. [Google Scholar] [CrossRef]
  13. Bianchi, F.J.; Booij, C.; Tscharntke, T. Sustainable pest regulation in agricultural landscapes: A review on landscape composition, biodiversity and natural pest control. Proc. Biol. Sci. 2006, 273, 1715–1727. [Google Scholar] [CrossRef]
  14. Vinatier, F.; Tixier, P.; Duyck, P.F.; Lescourret, F. Factors and mechanisms explaining spatial heterogeneity: A review of methods for insect populations. Methods Ecol. Evol. 2011, 2, 11–22. [Google Scholar] [CrossRef]
  15. Da-Silva, R.S.; Kumar, L.; Shabani, F.; Da Silva, E.M.; da Silva Galdino, T.V.; Picanço, M.C. Spatio-temporal dynamic climate model for Neoleucinodes elegantalis using CLIMEX. Int. J. Biometeorol. 2017, 61, 785–795. [Google Scholar] [CrossRef]
  16. Milonas, P.; Gogou, C.; Papadopoulou, A.; Fountas, S.; Liakos, V.; Papadopoulos, N.T. Spatio-temporal distribution of Helicoverpa armigera (Hubner) (Lepidoptera: Noctuidae) and Pectinophora gossypiella (Saunders) (Lepidoptera: Gelechiidae) in a cotton production area. Neo. Entomol. 2016, 45, 240–251. [Google Scholar] [CrossRef]
  17. Hernandez-Mendoza, J.L.; López-Barbosa, E.C.; Garza-González, E.; Mayek-Perez, N. Spatial distribution of Spodoptera frugiperda (Lepidoptera: Noctuidae) in maize landraces grown in Colima, México. Int. J. Trop. Insect Sci. 2008, 28, 126–129. [Google Scholar] [CrossRef]
  18. Merkl, M.E.; Pfrilllmcr, T.R. Light·trap investigations at Stoncville. J. Econ. Entomol. 1995, 48, 740–743. [Google Scholar] [CrossRef]
  19. Sajjad, M.; Sarwar, Z.M.; Binyameen, M.; Qasim, M.; Bashir, M.H. A New Species of Genus Agrotis Ochsenheimer (Lepidoptera: Noctuidae) in Pakistan. J. Anim. Plant Sci. 2020, 30, 685–692. [Google Scholar]
  20. Khan, M.R.; Rafi, M.A.; Nazir, N.; Khan, M.R.; Khan, I.A.; Hayat, A.; Ghaffar, A.; Rahim, J.; Perveen, F. Biodiversity of butterflies from poonch division of Azad Kashmir, Pakistan. J. Agric. Technol. 2014, 10, 885–898. [Google Scholar]
  21. Fonseca-Medrano, M.; Specht, A.; Silva, F.A.M.; Otanásio, P.N.; Malaquias, J.V. The population dynamics of three polyphagous owlet moths (Lepidoptera: Noctuidae) and the influence of meteorological factors and ENSO on them. Rev. Bras. Entomol. 2020, 63, 308–315. [Google Scholar] [CrossRef]
  22. Santos, S.R.D.; Specht, A.; Carneiro, E.; Casagrande, M.M. The influence of agricultural occupation and climate on the spatial distribution of Plusiinae (Lepidoptera: Noctuidae) on a latitudinal gradient in Brazil. Rev. Bras. Entomol. 2021, 65. [Google Scholar] [CrossRef]
  23. Jian-Yu, L.; Yan-Ting, C.; Meng-Zhu, S.; Jian-Wei, L.; Rui-Bin, X.; Gabor, P.; Shen, M. Spatio-temporal distribution patterns of Plutella xylostella (Lepidoptera: Plutellidae) in a fine-scale agricultural landscape based on geostatistical analysis. Sci. Rep. 2021, 11, 13622. [Google Scholar]
  24. Xiong, L.G.; Wu, Q.J.; Wang, S.L.; Xu, B.Y.; Zhu, G.R.; Zhang, Y.J. Biological characteristic of overwintering in the diamondback moth, Plutella xylostella. Plant Prot. 2010, 36, 90–93. [Google Scholar]
  25. Frank, K.D.; Rich, C.; Longcore, T. Effects of artificial night lighting on moths. In Ecological Consequences of Artificial Night Lighting; Island Press: Washington, DC, USA, 2006; pp. 305–344. [Google Scholar]
  26. Zhao, Z.H.; Hui, C.; He, D.H.; Ge, F. Effects of position within wheat field and adjacent habitats on the density and diversity of cereal aphids and their natural enemies. Biocontrol 2013, 58, 765–776. [Google Scholar] [CrossRef]
  27. Sciarretta, A.; Trematerra, P. Geostatistical tools for the study of insect spatial distribution: Practical implications in the integrated management of orchard and vineyard pests. Plant Prot. Sci. 2014, 50, 97–110. [Google Scholar] [CrossRef] [Green Version]
  28. Furlong, M.J.; Wright, D.J.; Dosdall, L.M. Diamondback moth ecology and management: Problems, progress, and prospects. Annu. Rev. Entomol. 2013, 58, 517–541. [Google Scholar] [CrossRef]
Figure 1. Geographical location map of traps, installed at different sites in the Multan district, Punjab, Pakistan.
Agriculture 12 02003 g001
Figure 2. Temporal distribution patterns of S. litura, H. tripoli, H. Jahangiri, H. armigera, S. exigua, S. furgiperda, H. stigmosa, A. ipsilon, C. placodoides, A. album, C. repleta, A. cinerea, E. insulana, M. loreyi, L. oleracea, E. vitella, E. conducta, M. brassicae, H. platigera, L. venalba, C. albostriata, A. decisissima, D. hoenei, and C. furthatai recorded every month from July 2020 to June 2021 in different localities of Multan. Average temperature, humidity, and rainfall were measured for each month.
Agriculture 12 02003 g002aAgriculture 12 02003 g002bAgriculture 12 02003 g002c
Figure 3. Spatial contour maps of H. stigmosa (a), H. tripoli (b), H. Jahangiri (c), S. litura (d), S. exigua (e), H. armigera (f), H. platigera (g), C. placodoides (h), C. repleta (i), A. ipsilon (j), A. cinerea (k), A. album (l), A. decisissima (m), E. insulana (n), E. vitella (o), C. furthatai (p), L. oleracea (q), E. conducta (r), L. venalba (s), D. hoenei (t), C. albostriata (u), M. loreyi (v), M. brassicae (w), and S. furgiperda (x).
Agriculture 12 02003 g003aAgriculture 12 02003 g003bAgriculture 12 02003 g003c
Figure 4. Noctuid moth abundance in different type of habitats in Multan. Different letters indicate significant differences at (p < 0.05).
Agriculture 12 02003 g004
Table 1. The coordinates i.e., latitude and longitude of the traps, installed in different habitats.
TrapsCoordinatesHabitatLocation
T129.7591 N; 71.3203 ECotton, Rice, Maize, TomatoCrop area/Near urban
T229.8255 N; 71.5593 EMaize, Rice, Mung beanCrop area/Near urban
T329.9017 N; 71.2915 EForestForest area/Near urban
T430.0468 N; 71.5044 EForestForest area/Near urban
T530.1491 N; 71.4387 EForestForest area/Near urban
T630.0960 N; 71.6275 ERice, Maize, SugarcaneCrop area/Near urban
T730.2497 N; 71.7916 EMaize, Cotton, Cabbage, Tomato, OkraCrop area/Away urban
T830.3138 N; 71.4565 ECotton, Cabbage, Okra, GrassesCrop area/Away urban
T930.3440 N; 71.6446 ECotton, MaizeCrop area/Away urban
T1030.0080 N; 71.3404 ECotton, Maize, tomato, SorghumCrop area/Away urban
T1130.2646 N; 71.5526 EMaize, Cotton, Cabbage, OkraCrop area/Away urban
Table 2. The collective rank list and abundance of all species from all traps in the region of Multan, Punjab-Pakistan.
RankSpecies NameAbundanceRelative Abundance (%)T1T2T3T4T5T6T7T8T9T10T11
1S. litura317118.6%59518743728084401262522574351
2H. Tripoli207412.2%32521217266974253188322289299
3H. jahangiri181310.6%484219195942029204642340
4H. armigera172410.1%18798818748127221189197246243
5S. exigua14808.7%2679359666015129702862010
6S. furgiperda10346.1%24121112816421241400060
7H. stigmosa7214.2%96104015001126872132122
8A. ipsilon4862.8%17180431061118539391
9C. placodoides4492.6%7739744925067000118
10A. album4422.6%421141253265010900117
11C. replete3662.1%3728522148278000073
12A. cinerea3522.1%151943152904711002846
13E. insulana3482%2124129152273074980
14M. loreyi3231.9%0010152102605693102
15L. oleracea2931.7%80343104505900116
16E. vitella2811.6%24191819242967047340
17E. conducta2791.6%00162405506563560
18M. brassicae2761.6%501190007800173
19H. platigera2401.4%241116100128000087
20L. venalba2371.4%0022320480855000
21C. albostriata2031.2%00000505600097
22A. decisissima1851.1%000030047460062
23D. hoenei1600.9%000022300535500
24C. furthatai830.5%00000254200160
Total IndividualsN = 17020ΣN = 100%N1 = 2248N2 = 1203N3 = 579N4 = 616N5 = 740N6 = 1056N7 = 2636N8 = 1430N9 = 2261N10 = 2094N11 = 2157
Table 3. The effect of meteorological factors on the species distribution. Fixed effect model (LSDV) for species abundance data. ‘‘*” Probability value significant at p < 0.05, SE = Standard error of regression.
SpeciesTemperature (°C)Humidity (%)Rainfall (mm)SEPooled OLS (F-Test) Value
Coefficientp ValueCoefficientp ValueCoefficientp Value
H. stigmosa1.08 *<0.00010.90 *<0.0001−6.14 *<0.00016.399.28× 1014
H. trifoli3.11 *<0.00012.40 *<0.0001−16.68 *<0.000112.121.40 × 1023
H. jahangiri2.43 *<0.00011.70 *<0.0001−13.18 *<0.000114.274.67 × 1021
S. litura4.37 *<0.00013.12 *<0.0001−22.38 *<0.000117.233.51× 1026
S. exigua2.13 *<0.00011.47 *<0.0001−11.21 *<0.00019.833.78× 1022
H. armigera2.83 *<0.00012.17 *<0.0001−14.69 *<0.00018.536.22× 1029
H. platigera0.48 *<0.00010.46 *<0.0001−2.78 *<0.00013.501.14× 1012
C. placodoides1.02 *<0.00010.96 *<0.0001−6.24 *<0.00015.743.31× 1013
C. repleta0.85 *<0.00010.78 *<0.0001−4.92 *<0.00013.861.55 × 1017
A. ipsilon0.95 *<0.00010.92 *<0.0001−5.40 *<0.00015.311.39 × 1014
A. cinerea0.78 *<0.00010.82 *<0.0001−4.57 *<0.00013.981.77 × 1016
A. album1.03 *<0.00011.01 *<0.0001−5.83 *<0.00015.463.97 × 1015
A. decisissima0.32 *<0.00010.26 *<0.0001−1.73 *<0.00012.702.72 × 1011
E. insulana0.77 *<0.00010.79 *<0.0001−4.20 *<0.00014.092.15 × 1016
E. vitelli0.64 *<0.00010.67 *<0.0001−3.33 *<0.00013.071.56 × 1016
C. furithatai0.17 *<0.00010.18 *<0.00010.90 *0.00181.933.38 × 1007
L. oleracea0.58 *<0.00010.52 *<0.0001−2.84 *<0.00014.497.14 × 1011
E. conducta0.57 *<0.00010.56 *<0.0001−2.86 *<0.00013.701.48 × 1012
L. venalba0.51 *<0.00010.50 *<0.0001−2.67 *<0.00013.723.35 × 1011
D. hoenei0.32 *<0.00010.32 *<0.0001−1.79 *<0.00012.972.05 × 1008
C. albostriata0.39 *<0.00010.37 *<0.0001−2.12 *0.00023.772.33 × 1010
M. loreyi0.67 *<0.00010.66 *<0.0001−3.83 *<0.00014.161.47 × 1014
M. brassicae0.52 *<0.00010.53 *<0.0001−2.99 *0.00035.542.62 × 1011
S. furgiperda0.84 *<0.00010.51 *0.0036−3.91 *0.00077.649.35 × 1025
Publisher’s Note: MDPI stays neutral with regard to jurisdictional claims in published maps and institutional affiliations.

