
The Application of Humic Acid Urea Improves Nitrogen Use Efficiency and Crop Yield by Reducing the Nitrogen Loss Compared with Urea

 ,
,
Abstract
1. Introduction
2. Materials and Methods
2.1. Materials
2.2. Leaching Experiment
2.3. Incubation Experiment
2.3.1. Ammonium Volatilization
2.3.2. N2O Emission
2.3.3. Cumulative N-Gas Emissions and N Losses from Fertilizer
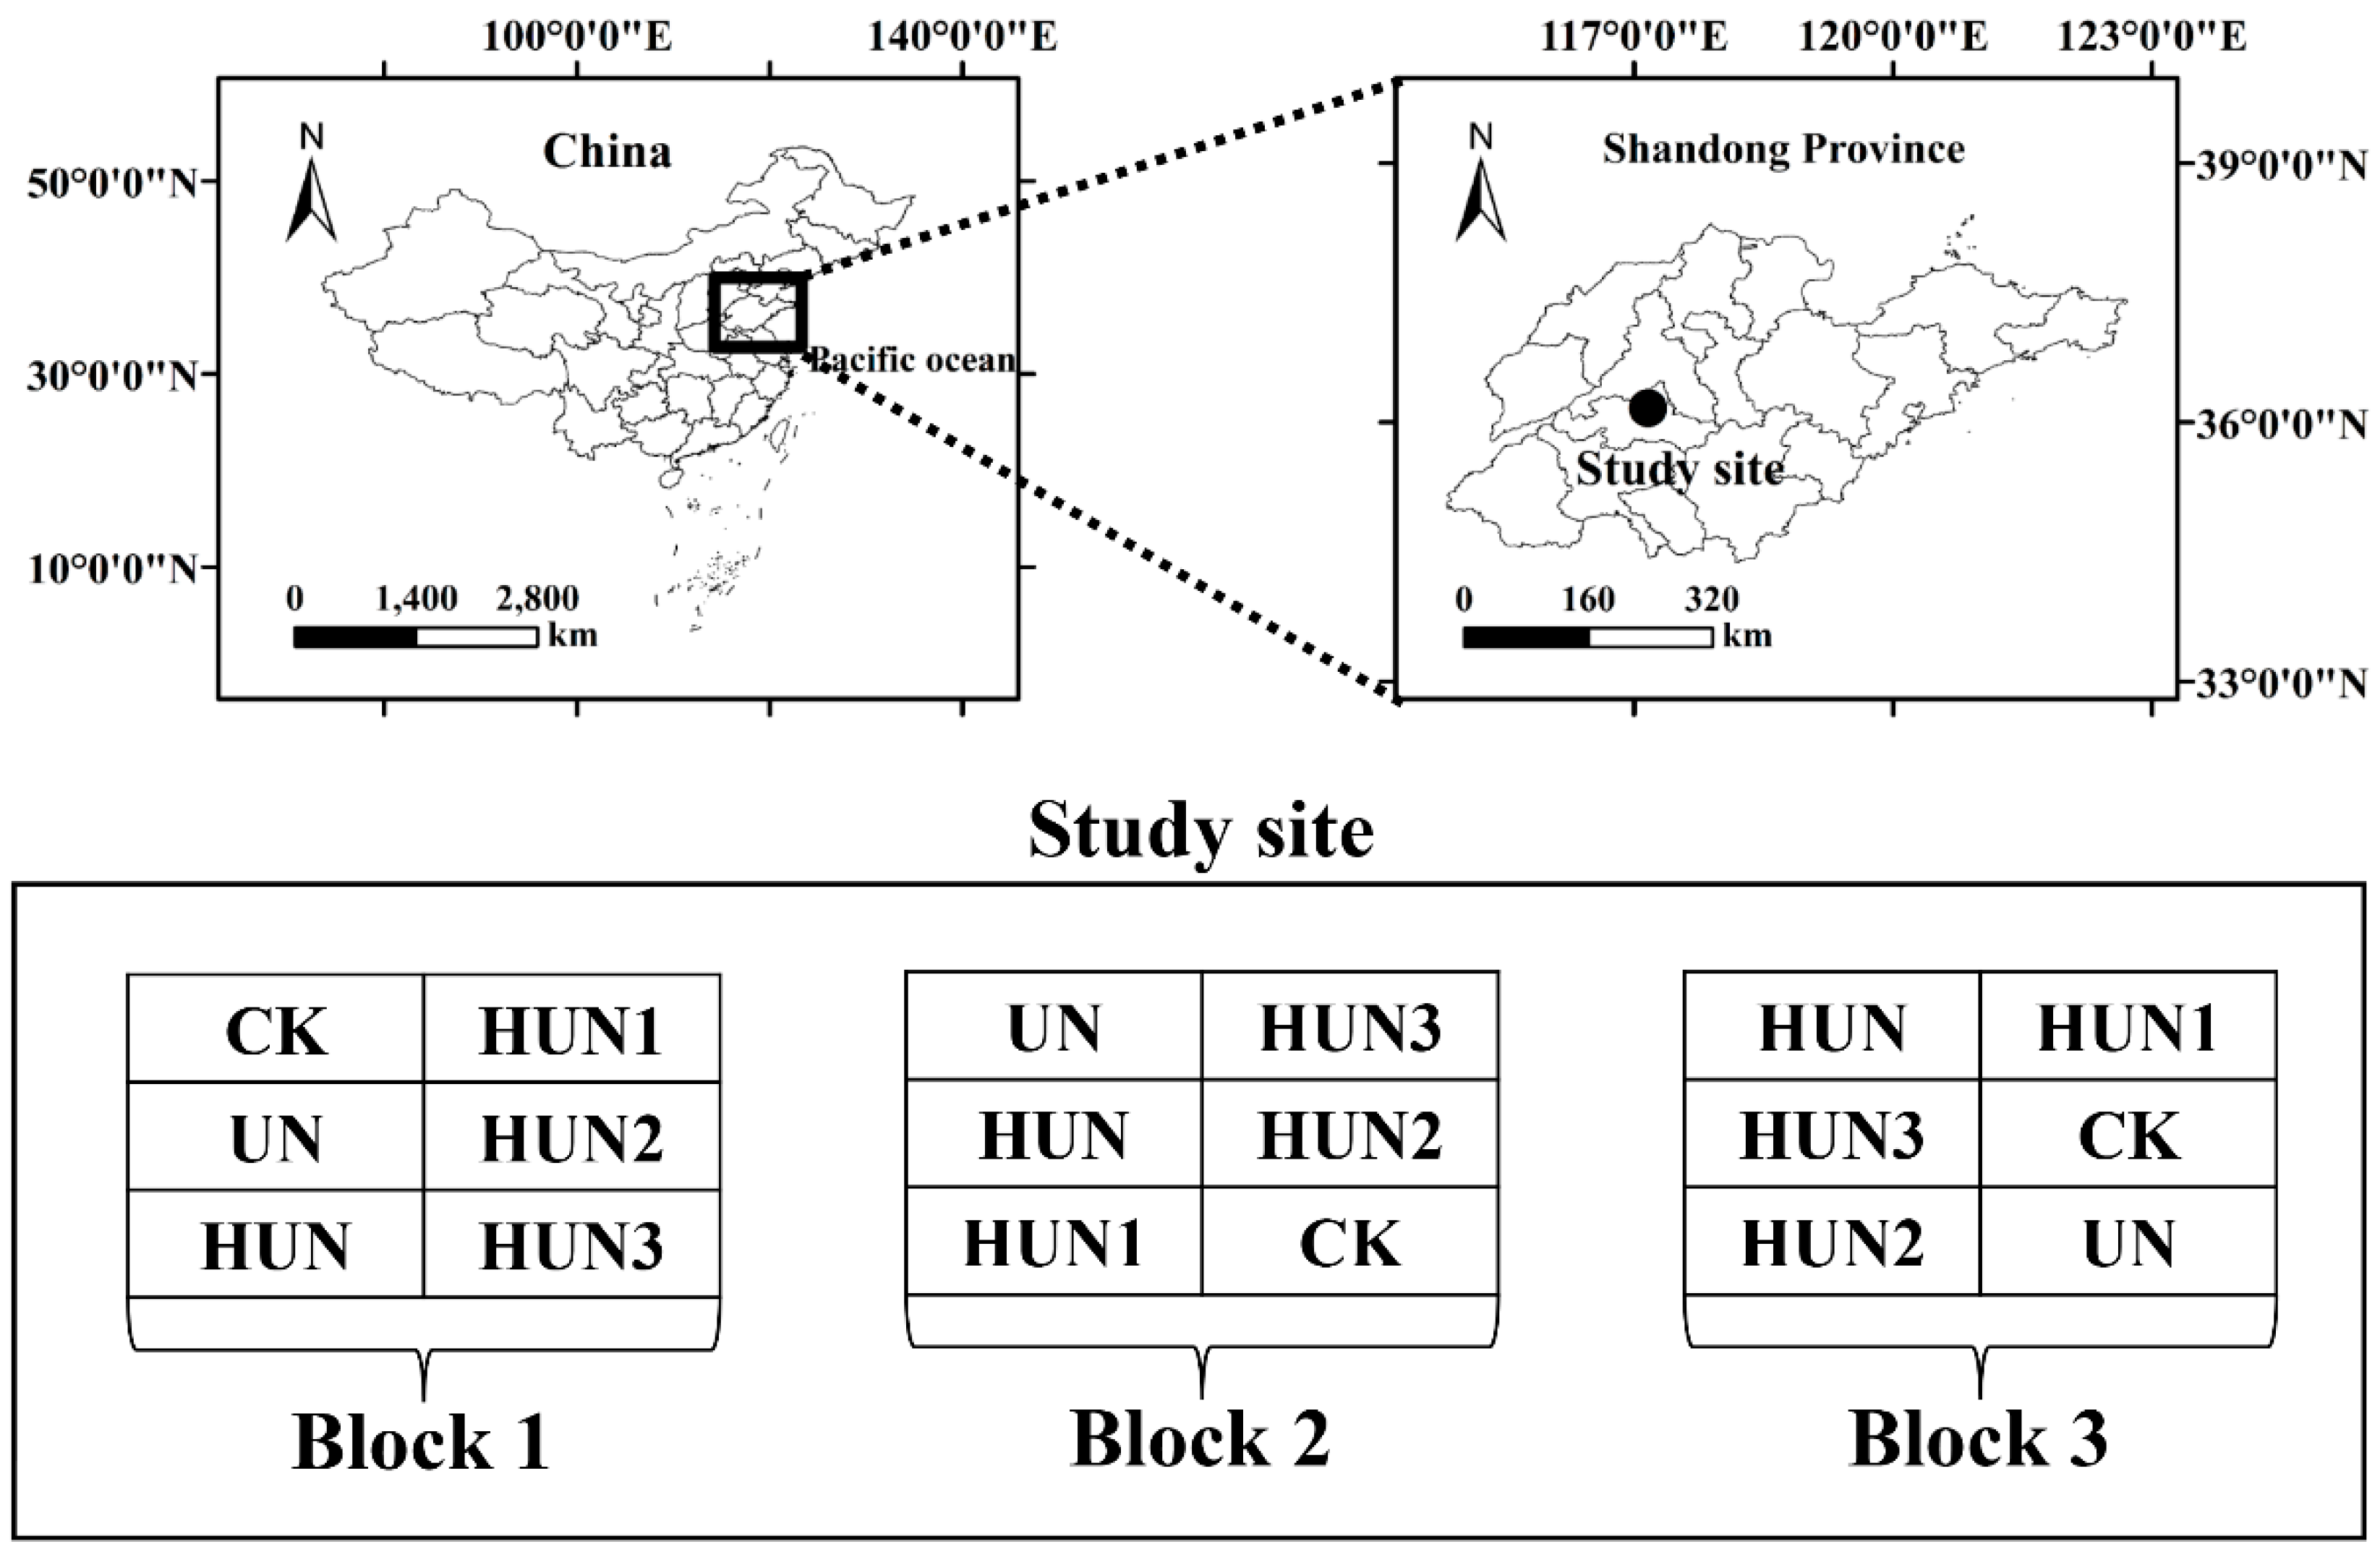
2.4. Field Experiment of Maize-Wheat Rotation
2.4.1. Experiment Site and Method
2.4.2. Soil Sampling and Analysis
2.4.3. Plant Sampling and Analysis
2.4.4. Calculation of Yield and Nitrogen Use Efficiency
2.5. Statistical Analysis
3. Results
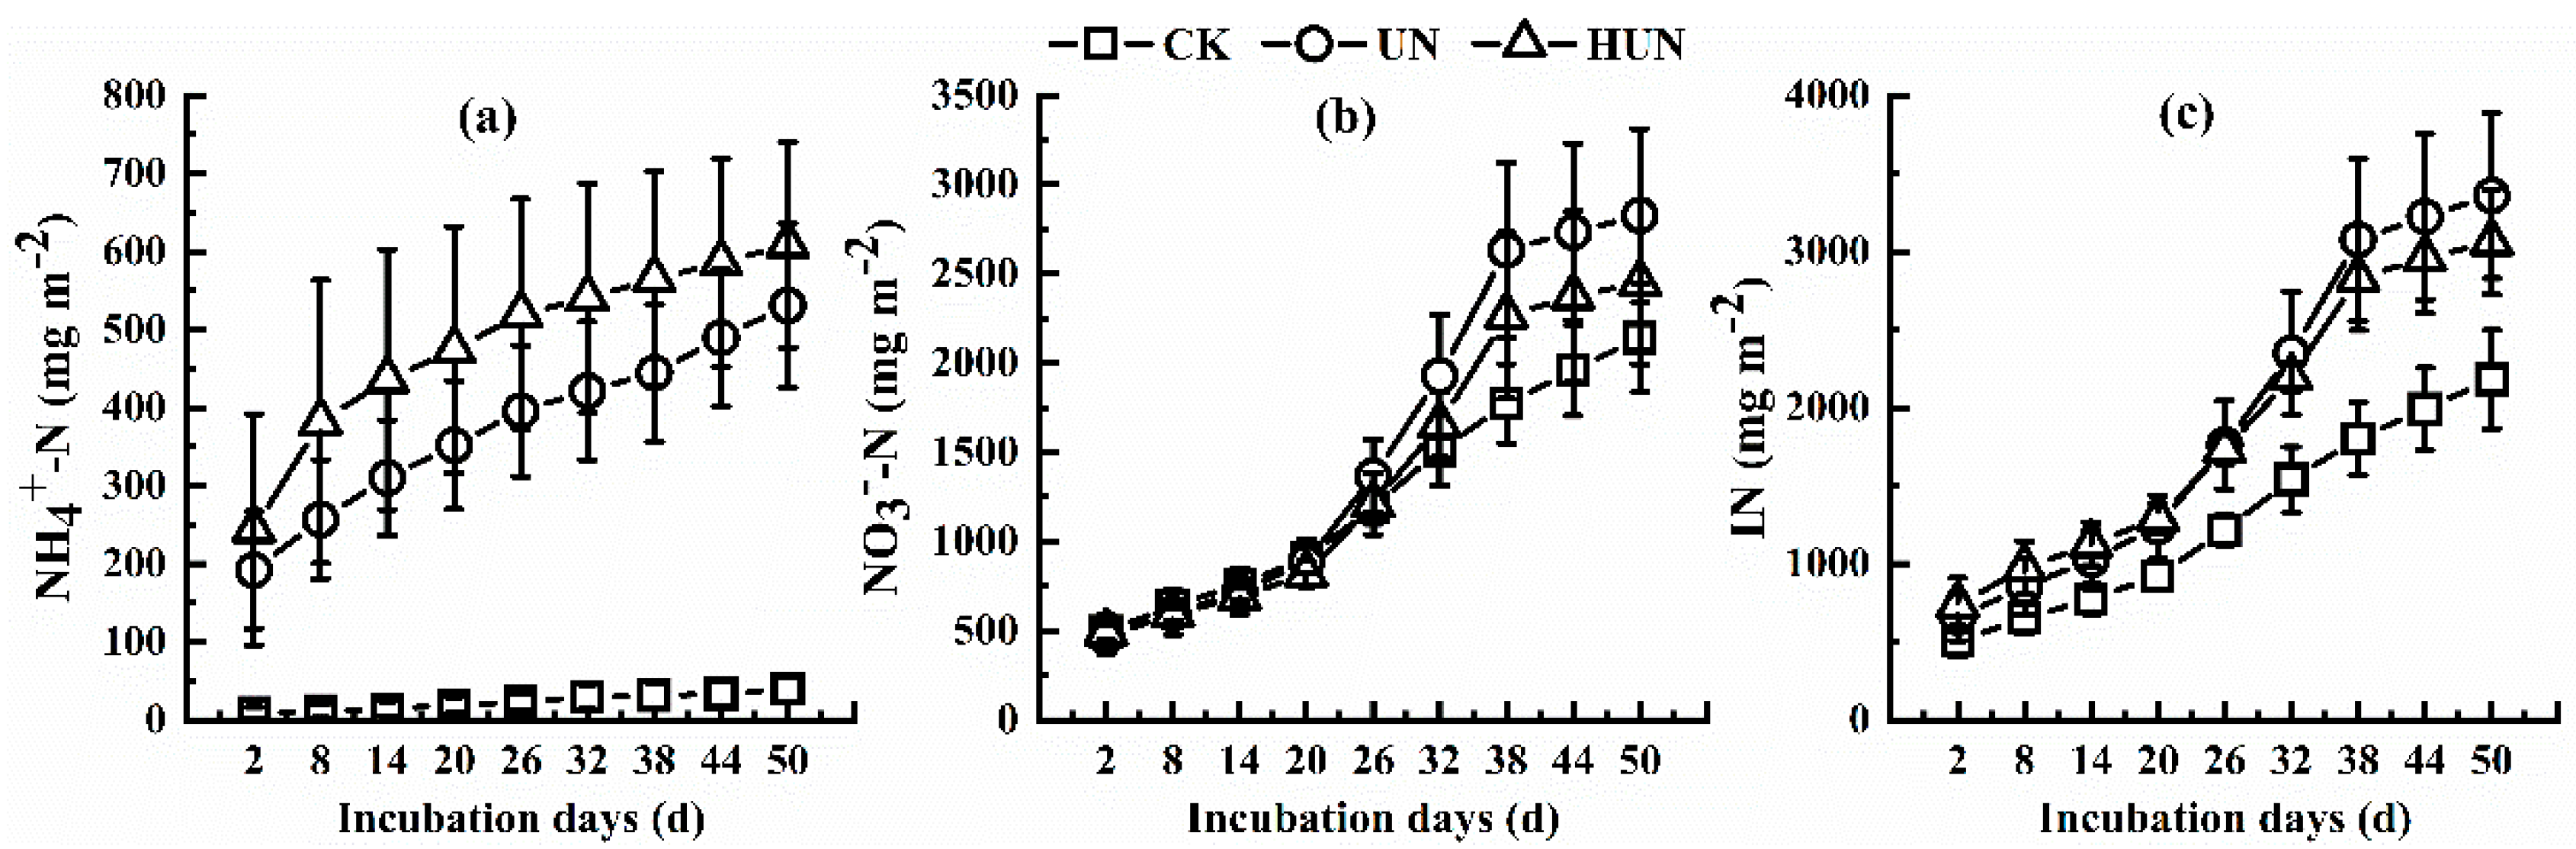
3.1. Effect of Humic Acid Urea on Nitrogen Leaching in the Leaching Experiment
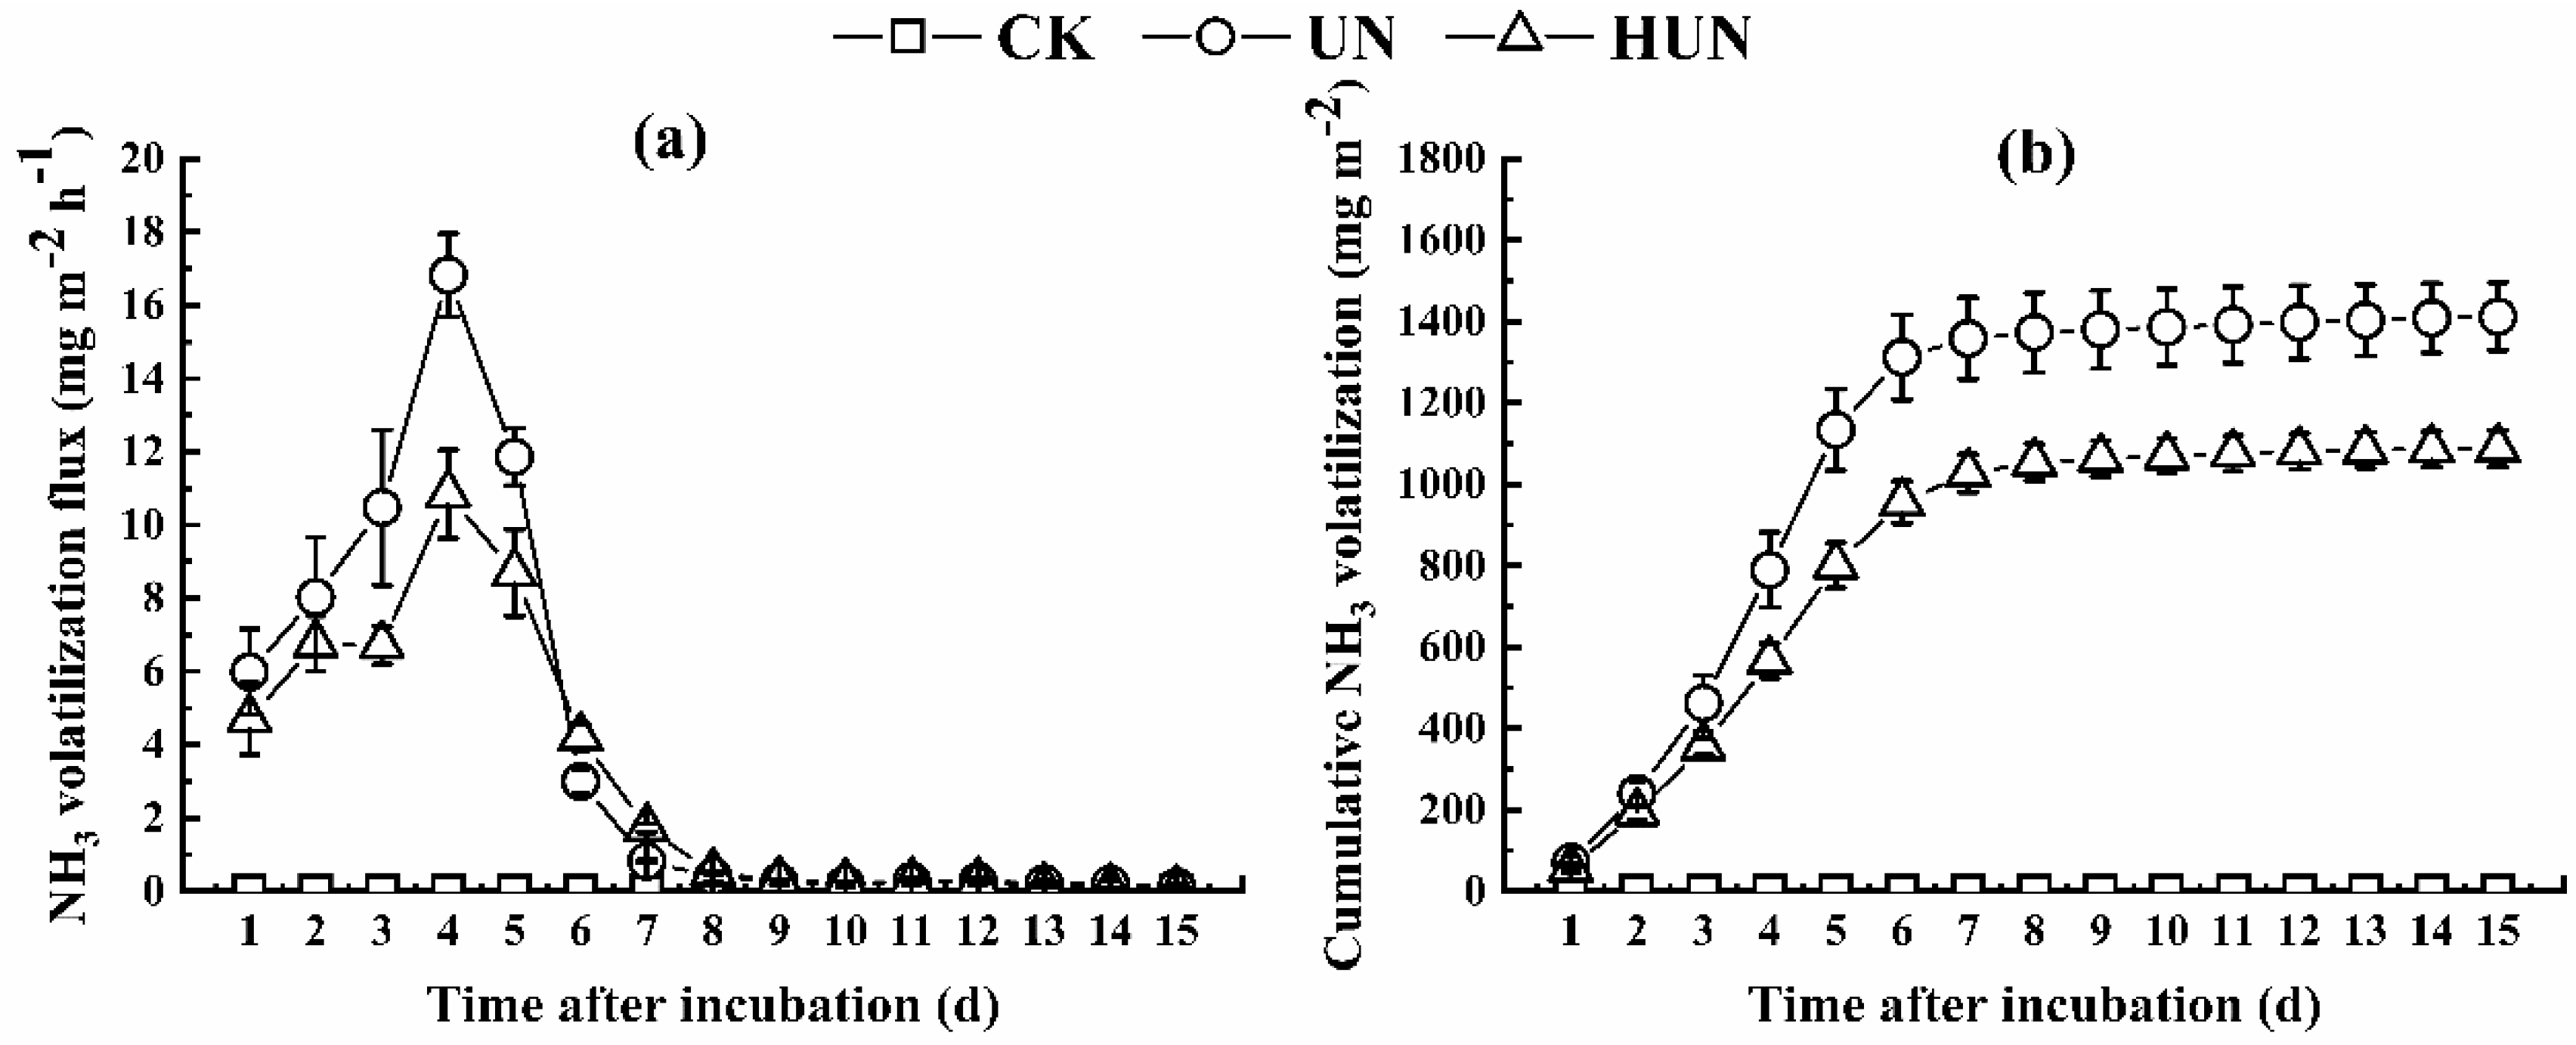
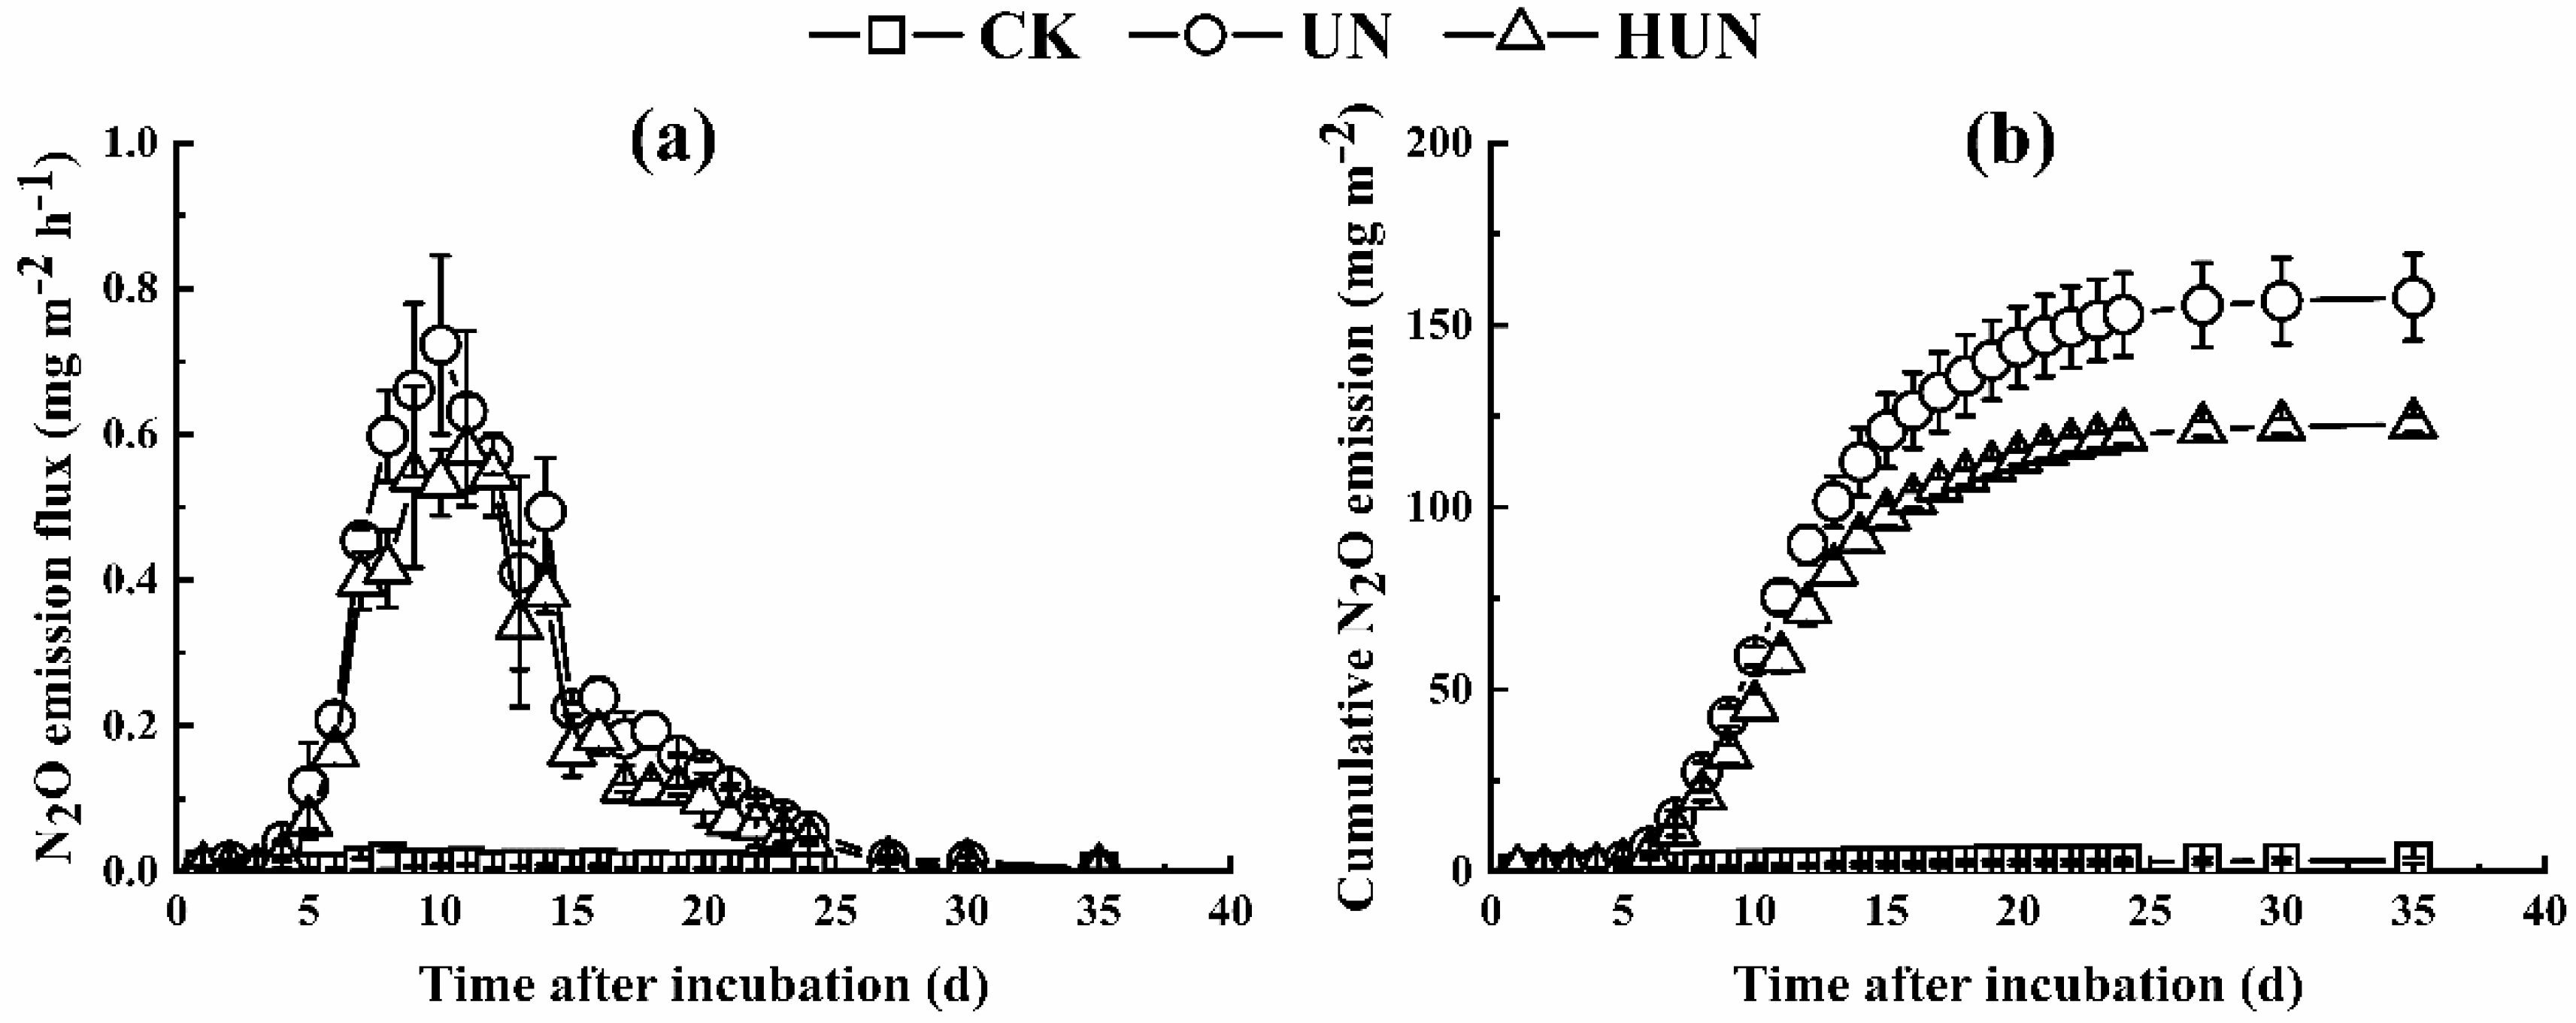
3.2. Effects of Humic Acid Urea on NH3 Volatilization and N2O Emission in the Incubation Experiment
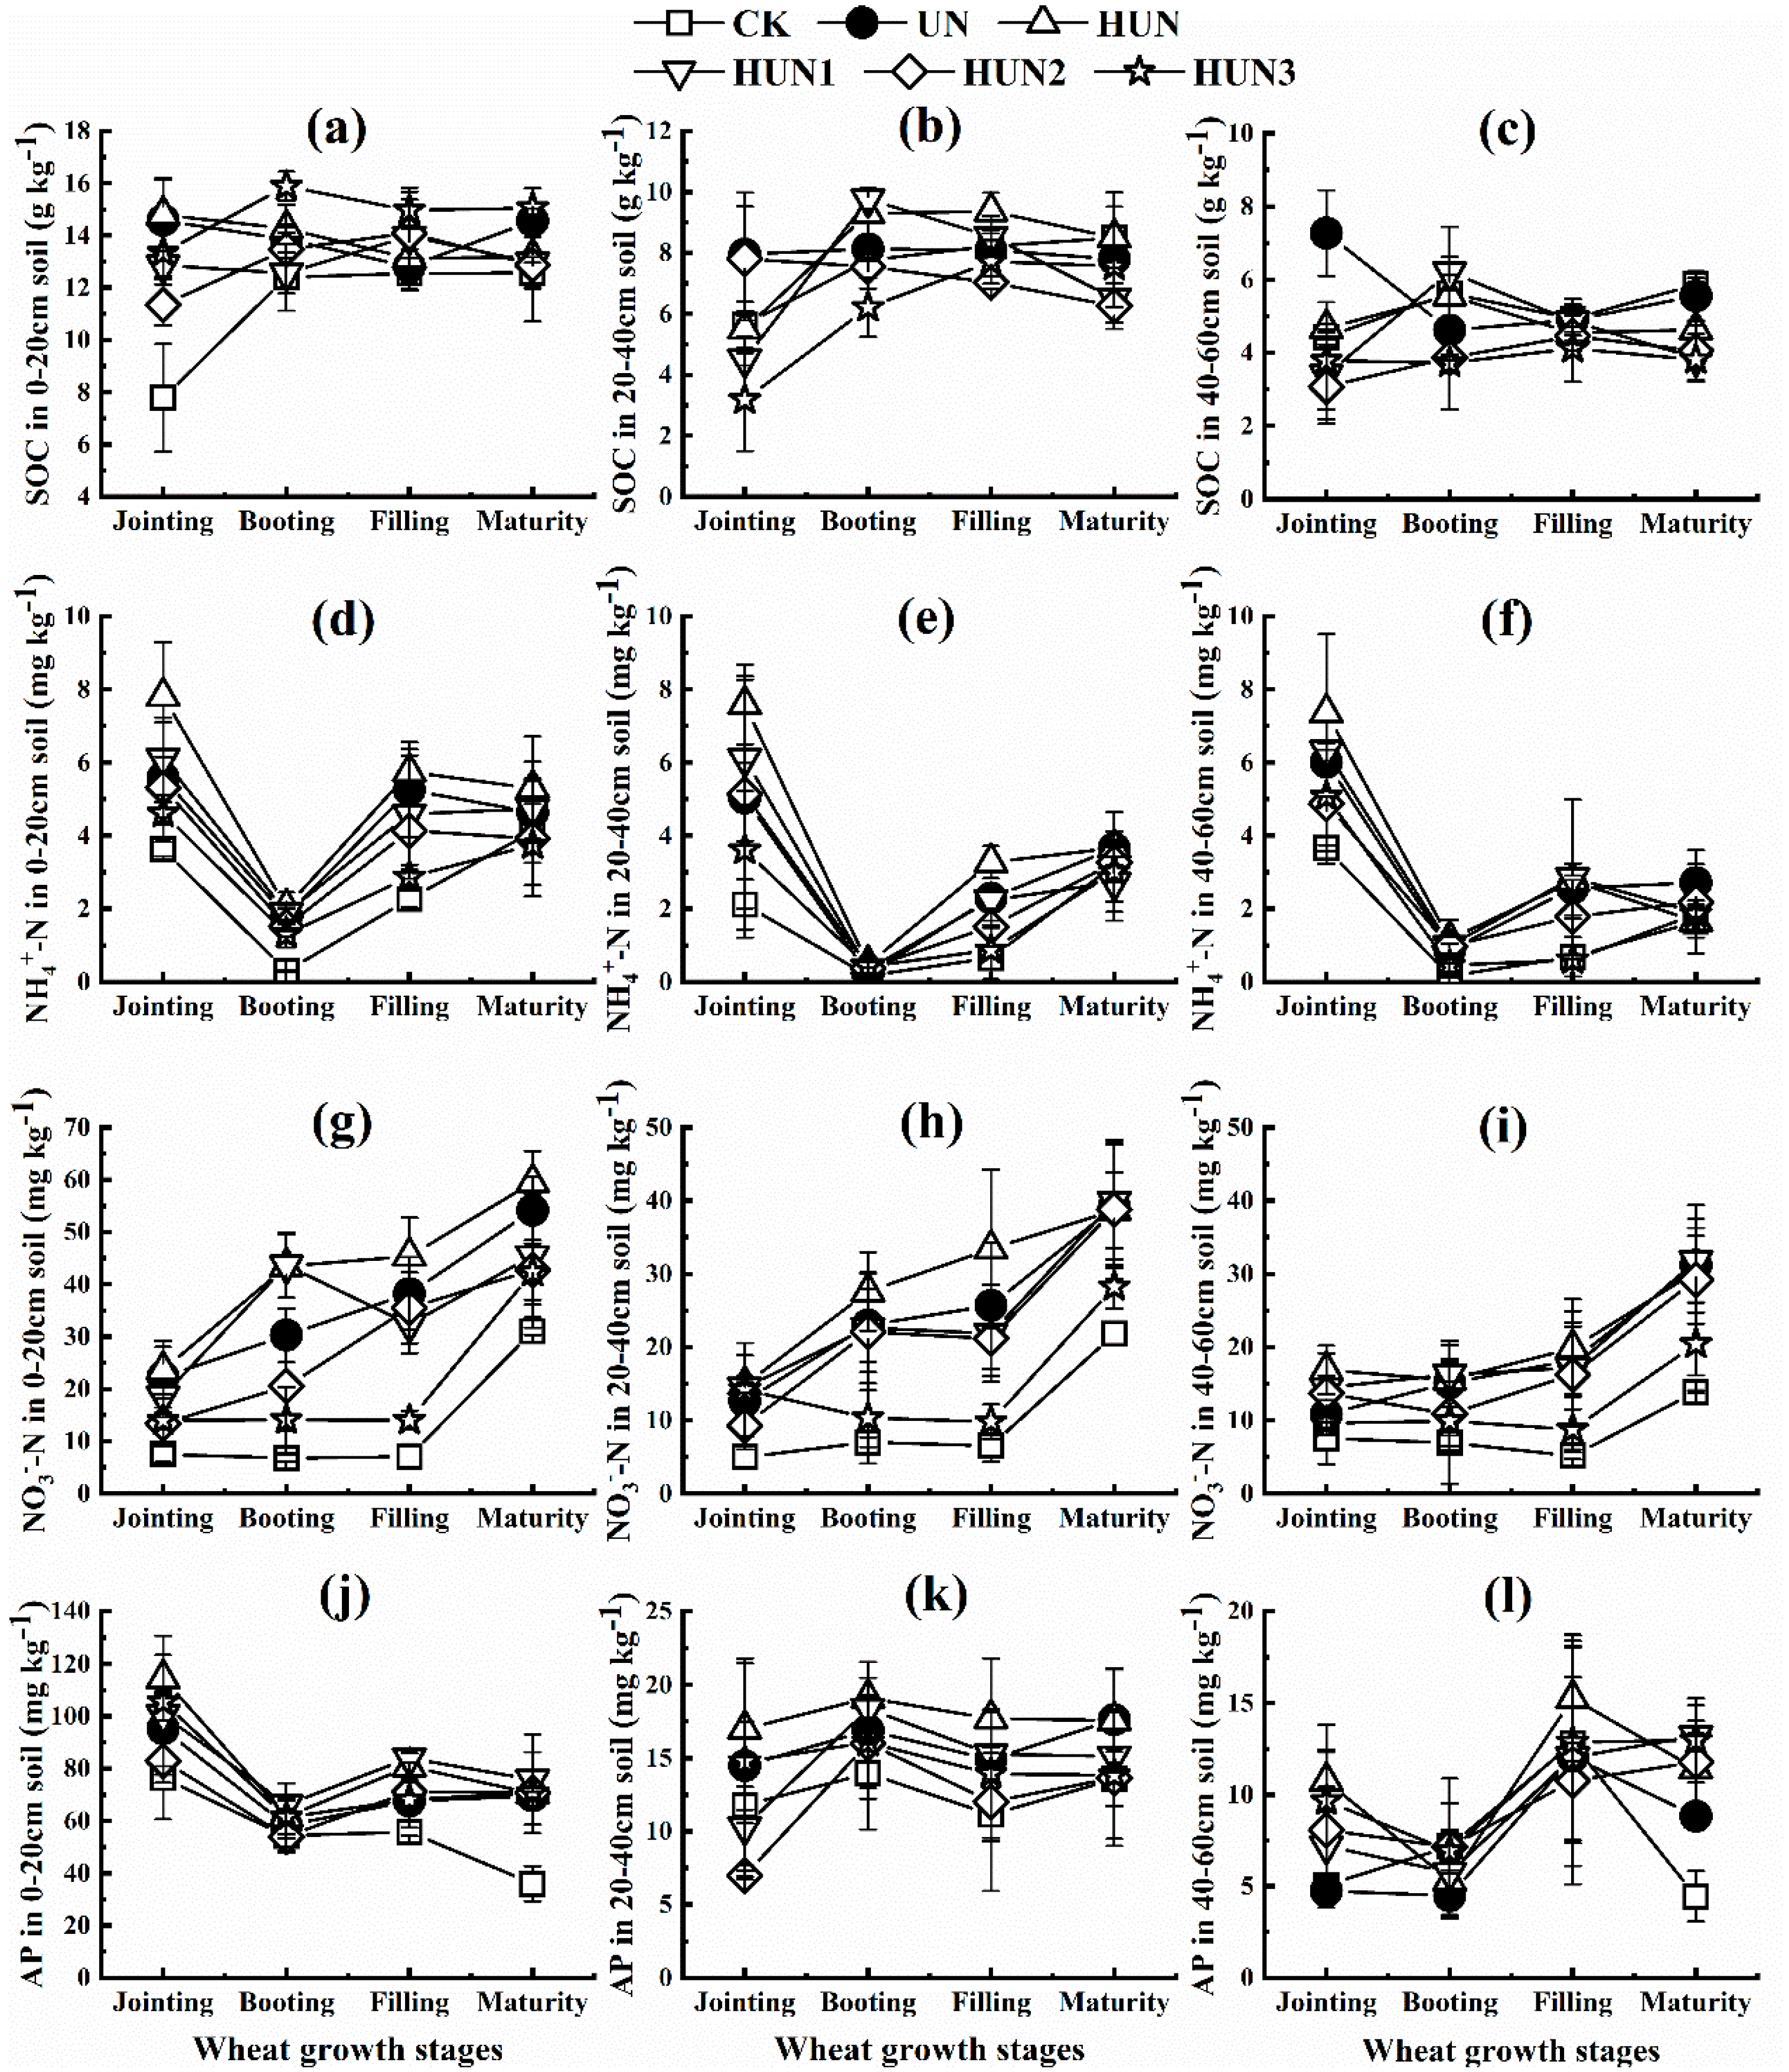
3.3. Effect of Humic Acid Urea on Soil Nutrient Content in the Field Experiment of Maize-Wheat Rotation
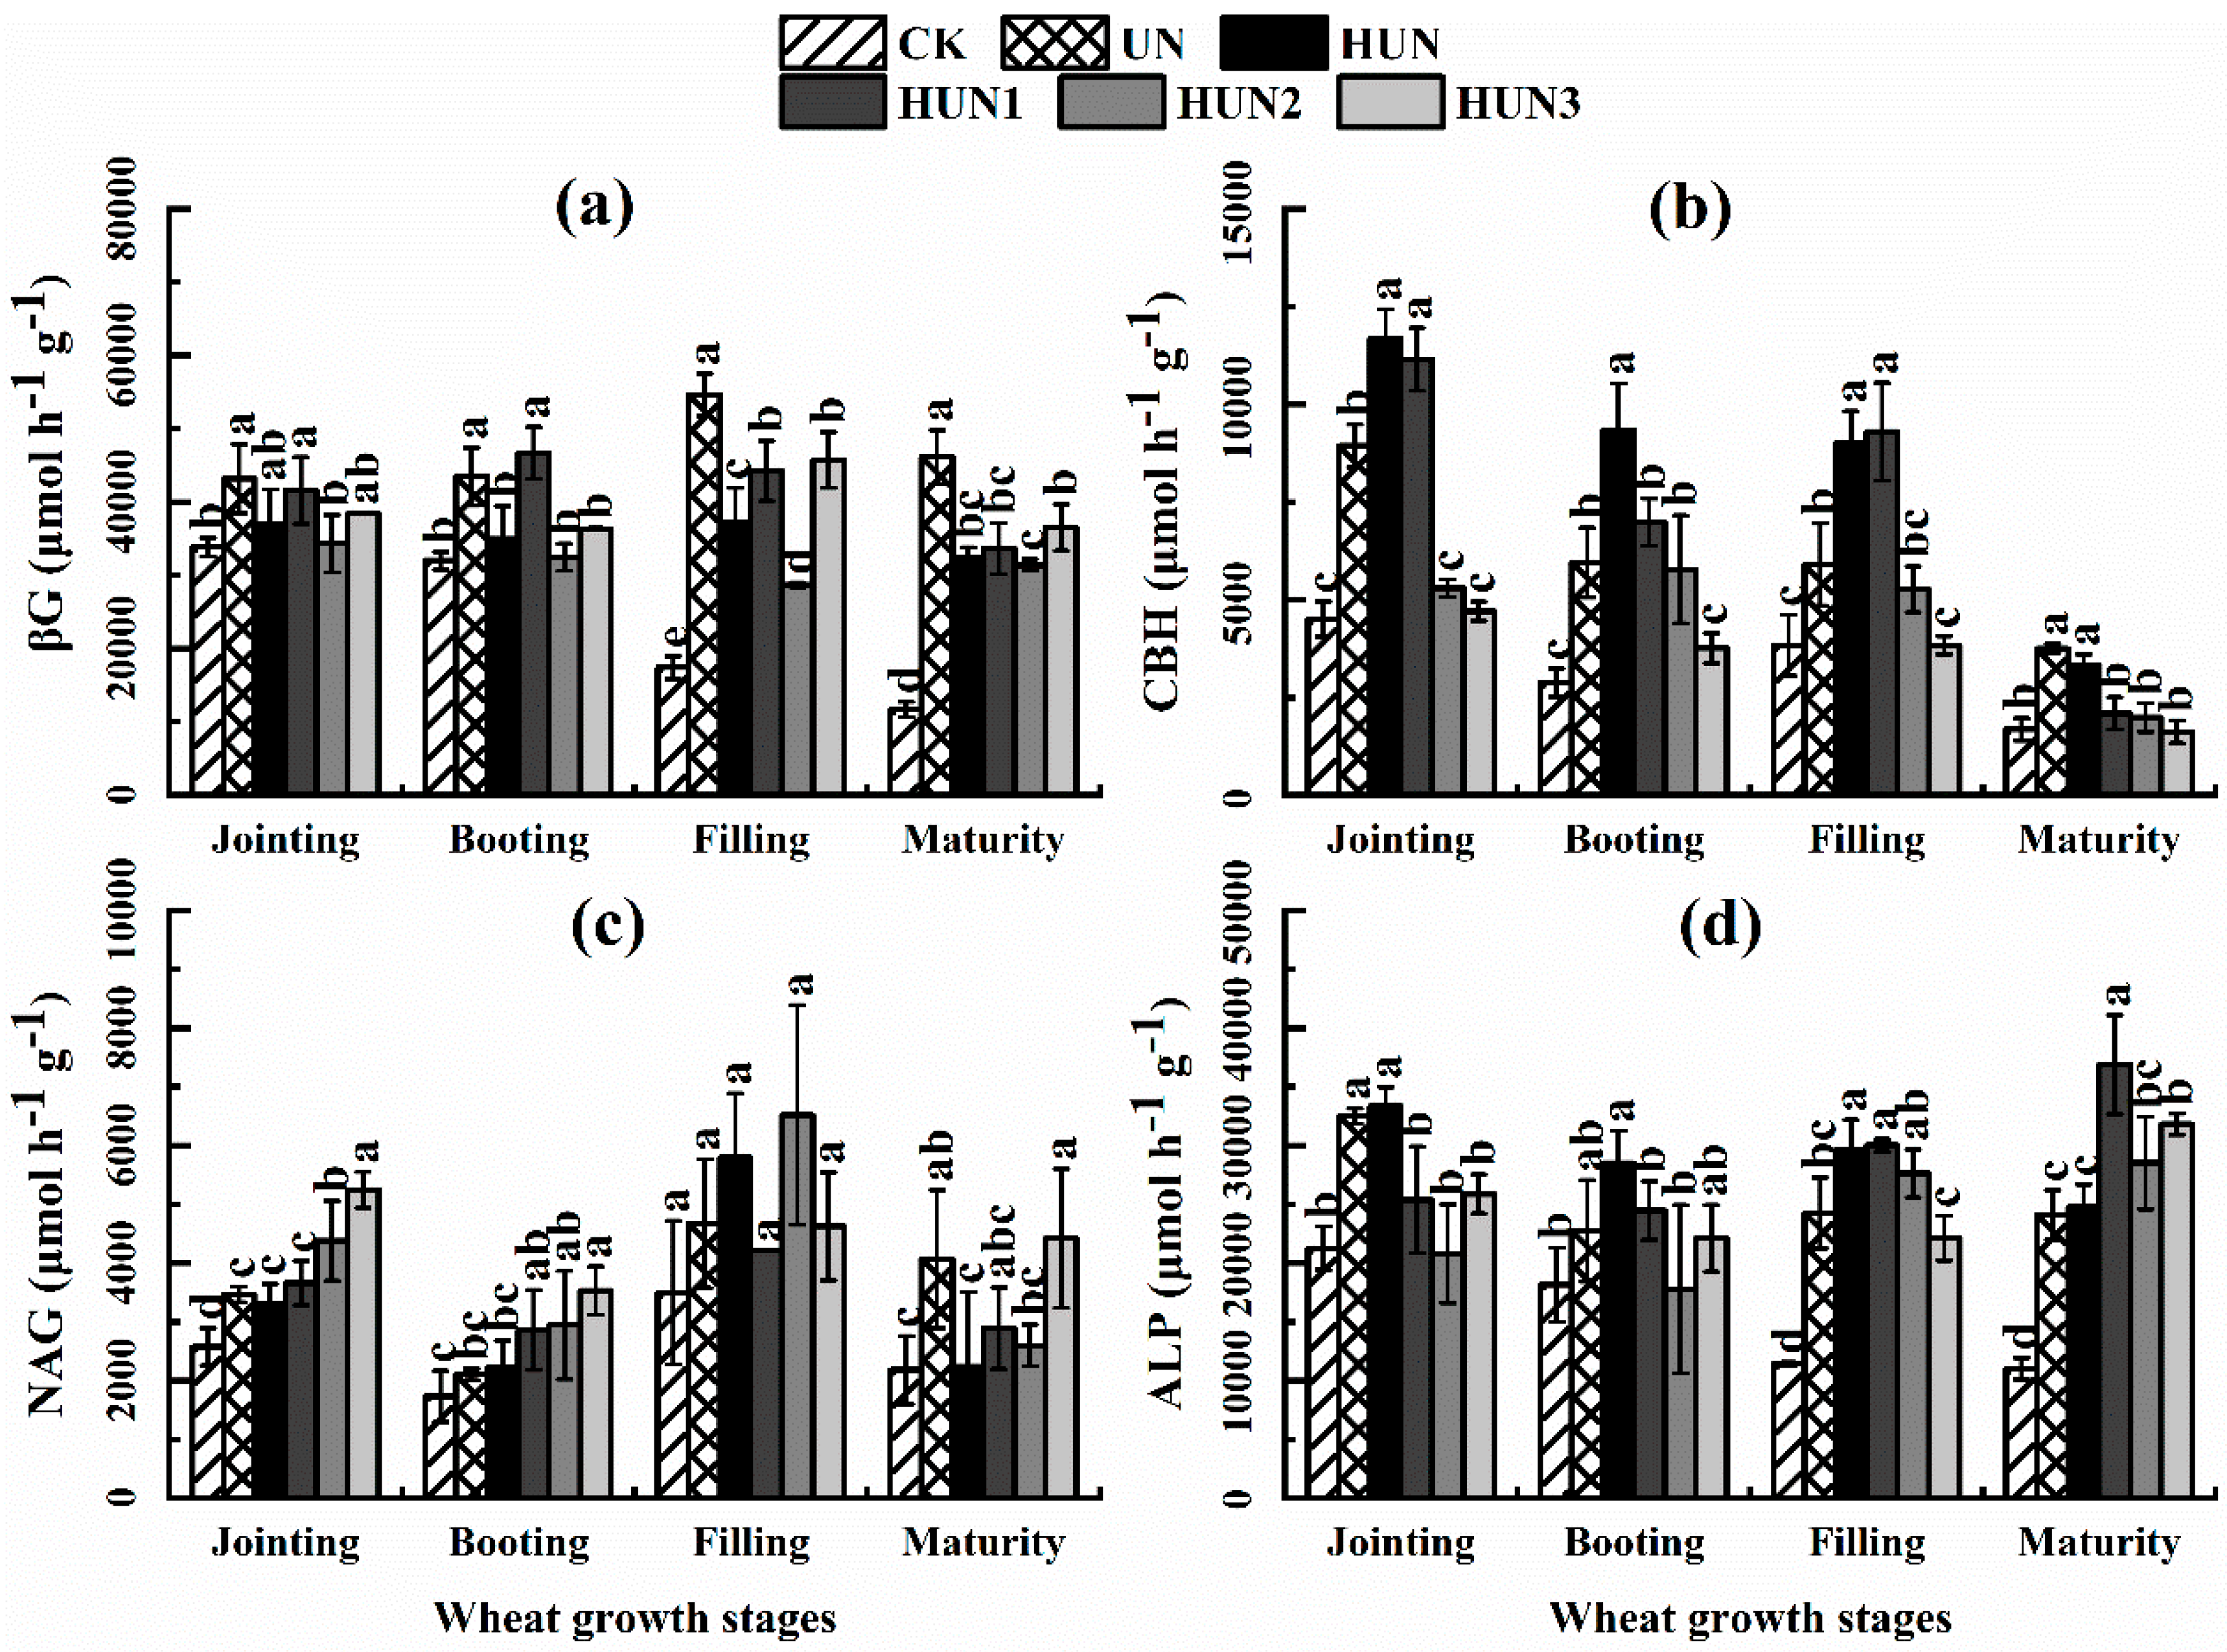
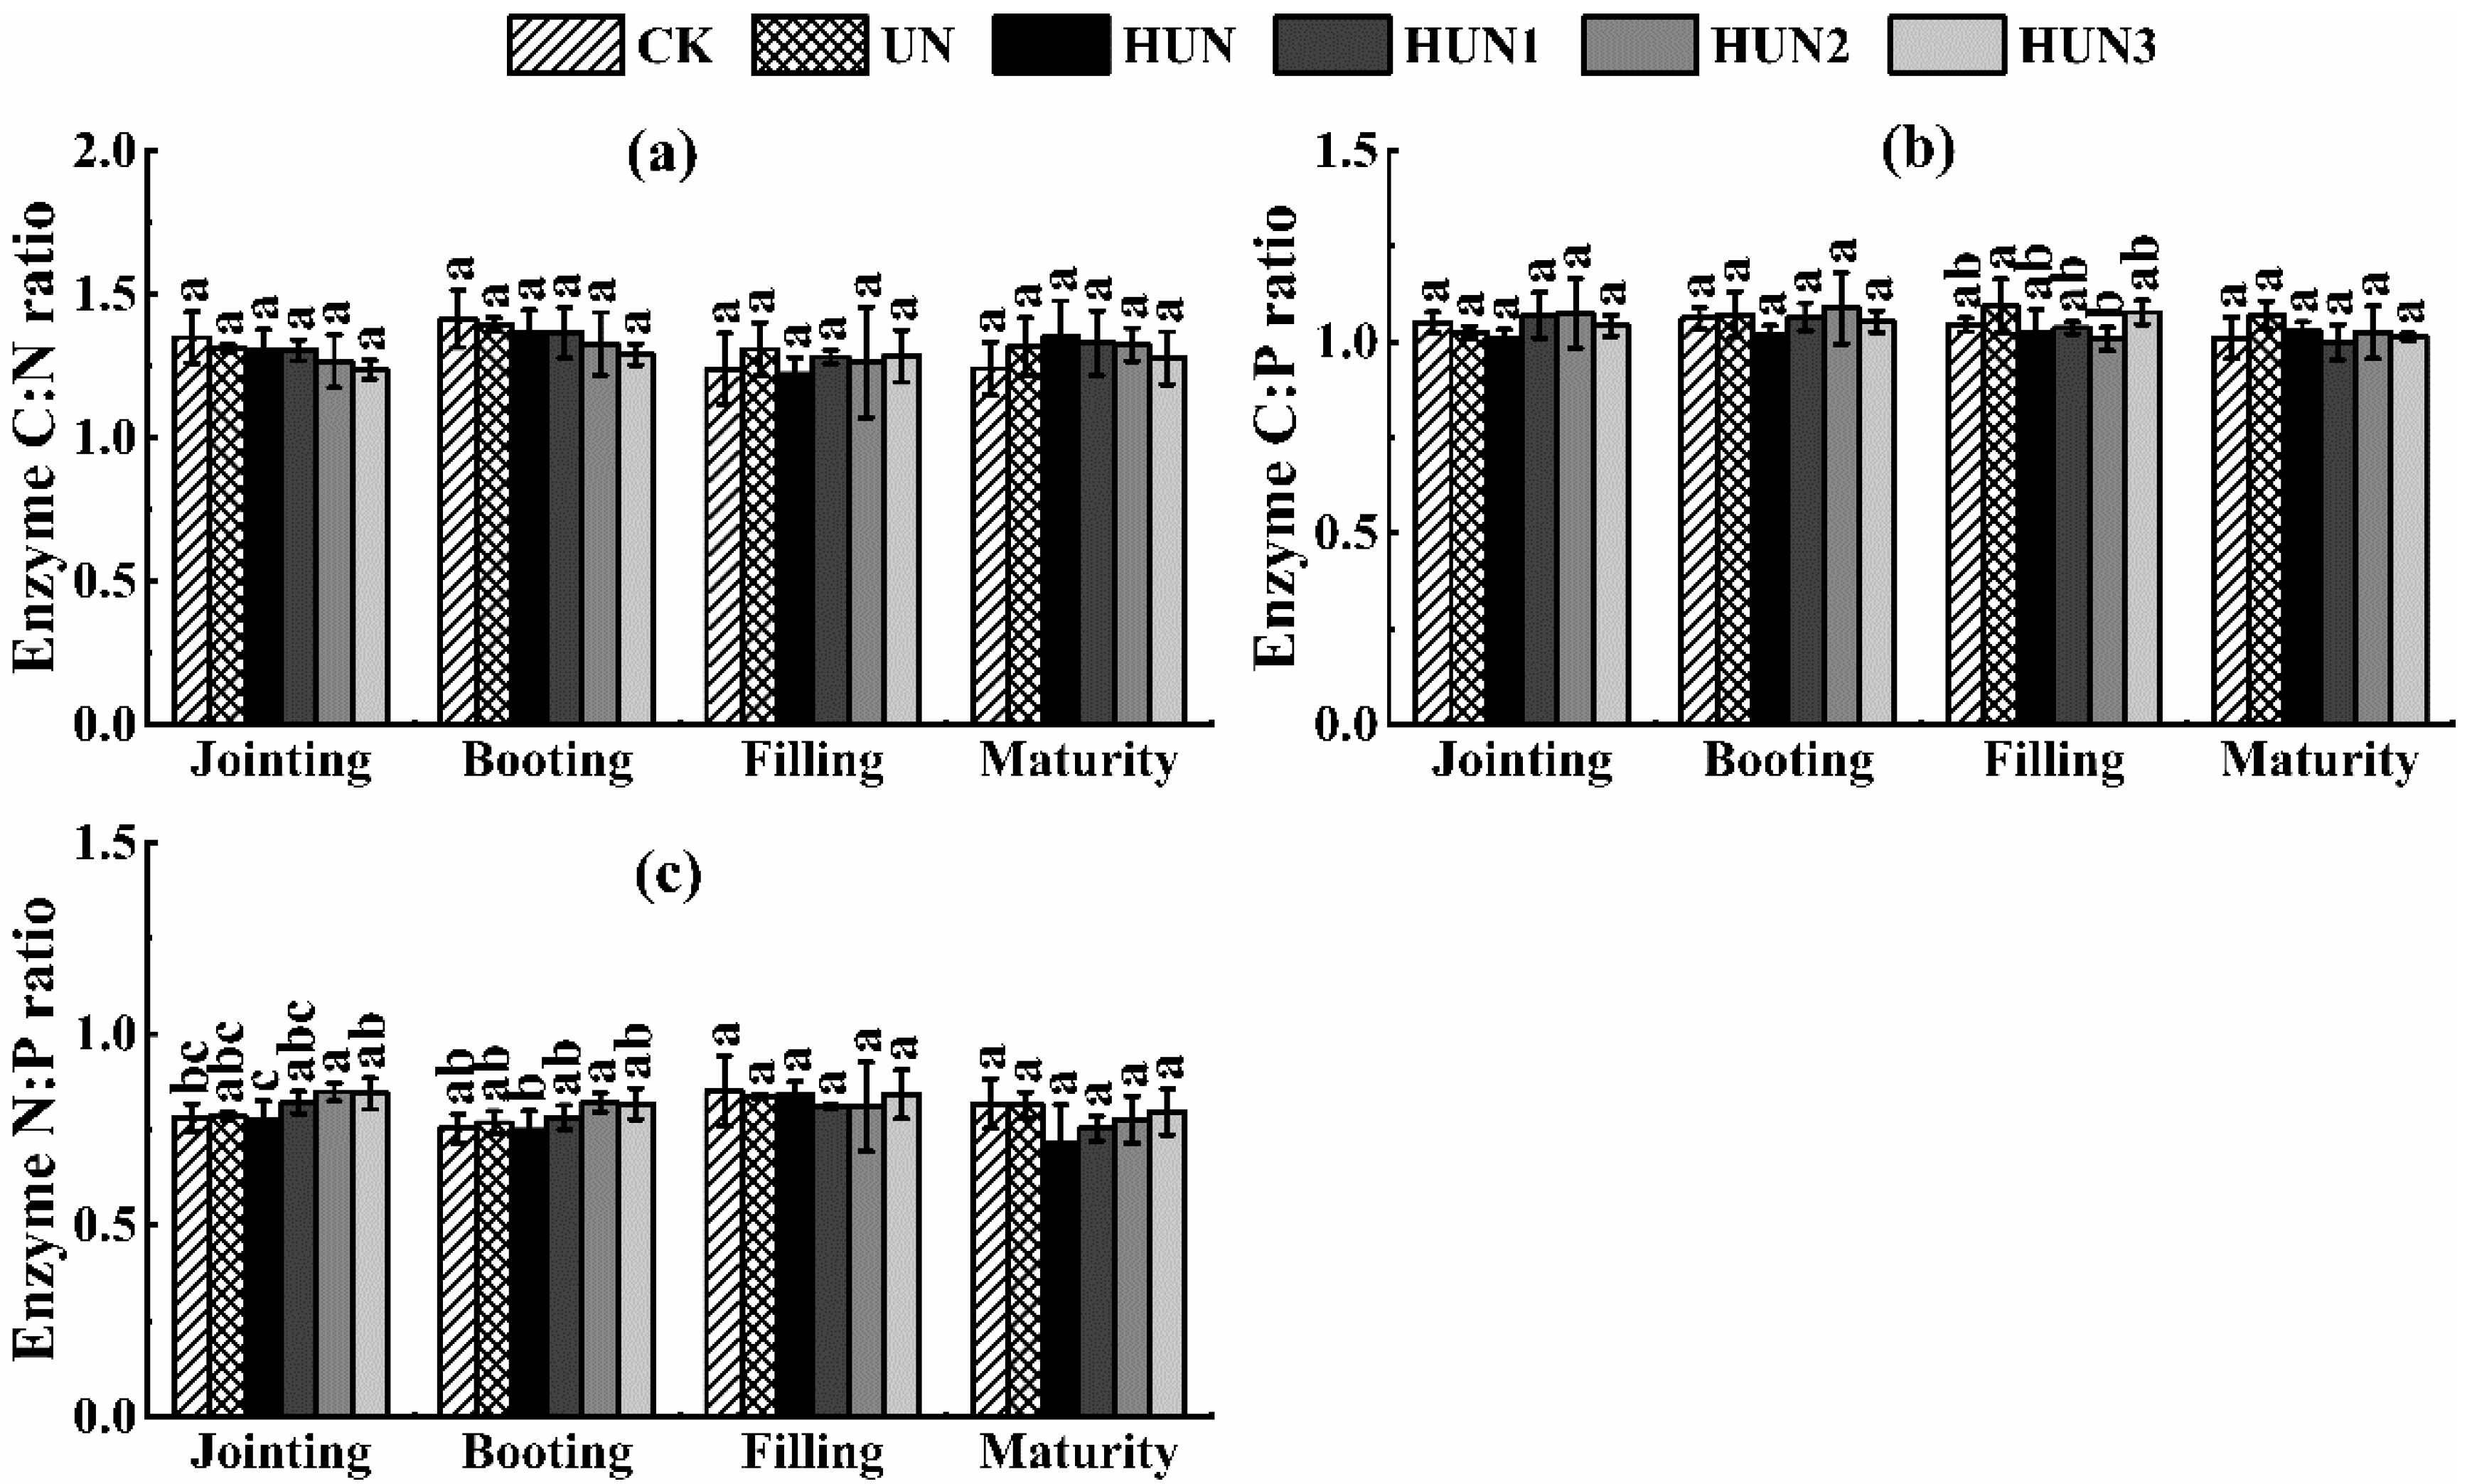
3.4. Effect of Humic Acid Urea on Soil Enzyme Activity and Enzyme Stoichiometry in the Field Experiment of Maize-Wheat Rotation
3.5. Effect of Humic Acid Urea on Yield, NUE and NEP in the Field Experiment of Maize-Wheat Rotation
4. Discussion
4.1. Effect of Humic Acid Urea on Nitrogen Loss
4.2. Effect of Humic Acid Urea on Soil Nutrients and Enzyme Stoichiometry
4.3. Effect of Humic Acid Urea on Yield and NUE
5. Conclusions
Supplementary Materials
Author Contributions
Funding
Institutional Review Board Statement
Informed Consent Statement
Data Availability Statement
Conflicts of Interest
References
- Li, R.C.; Gao, Y.X.; Chen, Q.; Li, Z.L.; Gao, F.; Meng, Q.M.; Li, T.G.; Liu, A.R.; Wang, Q.; Wu, L.; et al. Blended controlled-release nitrogen fertilizer with straw returning improved soil nitrogen availability, soil microbial community, and root morphology of wheat. Soil Tillage Res. 2021, 212, 105045. [Google Scholar] [CrossRef]
- Gao, Y.X.; Song, X.; Liu, K.X.; Li, T.G.; Zheng, W.K.; Wang, Y.; Liu, Z.G.; Zhang, M.; Chen, Q.; Li, Z.L.; et al. Mixture of controlled-release and conventional urea fertilizer application changed soil aggregate stability, soil humic acid molecular composition, and nitrogen uptake. Sci. Total Environ. 2021, 789, 147778. [Google Scholar] [CrossRef] [PubMed]
- Ju, X.T.; Xing, G.X.; Chen, X.P.; Zhang, S.L.; Zhang, L.J.; Liu, X.J.; Cui, Z.L.; Yin, B.; Christie, P.; Zhu, Z.L.; et al. Reducing environmental risk by improving N management in intensive Chinese agricultural systems. PNAS 2009, 106, 3041–3046. [Google Scholar] [CrossRef]
- Saha, B.K.; Rose, M.T.; Wong, V.N.L.; Cavagnaro, T.R.; Patti, A.F. ; Patti, A.F. A slow release brown coal-urea fertiliser reduced gaseous N loss from soil and increased silver beet yield and N uptake. Sci. Total Environ. 2019, 649, 793–800. [Google Scholar] [CrossRef] [PubMed]
- UNECE. 2018. Available online: https://www.unece.org/env/lrtap/taskforce/tfrn/welcome.html (accessed on 15 October 2019).
- Wang, Y.L.; Li, M.N.; Yan, H.J. Ammonia volatilization from urea in alfalfa field with different nitrogen application rates, methods and timing. Agric. Ecosyst. Environ. 2021, 312, 107344. [Google Scholar] [CrossRef]
- Wang, H.T.; Oertelt, L.; Dittert, K. The addition of magnesium sulfate and borax to urea reduced soil NH3 emissions but increased N2O emissions from soil with grass. Sci. Total Environ. 2022, 803, 149902. [Google Scholar] [CrossRef]
- Meng, X.P.; Guo, Z.Y.; Yang, X.N.; Su, W.N.; Li, Z.M.; Wu, X.R.; Ahmad, I.; Cai, T.; Han, Q.F. Straw incorporation helps inhibit nitrogen leaching in maize season to increase yield and efficiency in the Loess Plateau of China. Soil Tillage Res. 2021, 211, 105006. [Google Scholar] [CrossRef]
- Wu, P.; Liu, F.; Li, H.; Cai, T.; Zhang, P.; Jia, Z.K. Suitable fertilizer application depth can increase nitrogen use efficiency and maize yield by reducing gaseous nitrogen losses. Sci. Total Environ. 2021, 781, 146787. [Google Scholar] [CrossRef]
- Kira, O.; Shaviv, A.; Dubowski, Y. Concomitant tracking of NH3, N2O and soil mineral-N using steady-state incubation cells to enhance sustainability of urea fertilization approaches. Geoderma 2021, 404, 115305. [Google Scholar] [CrossRef]
- Wang, H.T.; Ma, S.T.; Shao, G.D.; Dittert, K. Use of urease and nitrification inhibitors to decrease yield-scaled N2O emissions from winter wheat and oilseed rape fields: A two-year field experiment. Agric. Ecosyst. Environ. 2021, 319, 107552. [Google Scholar] [CrossRef]
- Araújo, B.R.; Romao, L.P.C.; Doumer, M.E.; Mangrich, A.S. Evaluation of the interactions between chitosan and humics in media for the controlled release of nitrogen fertilizer. J. Environ. Manag. 2017, 190, 122–131. [Google Scholar] [CrossRef] [PubMed]
- Silva, M.S.R.D.A.D.; Tavares, O.C.H.; Ribeiro, T.G.; Baldani, V.L.D.; Berbara, R.L.L.; Jesus, E.D.C. Humic acids enrich the plant microbiota with bacterial candidates for the suppression of pathogens. Appl. Soil Ecol. 2021, 168, 104146. [Google Scholar] [CrossRef]
- Mora, V.; Bacaicoa, E.; Zamarreño, A.M.; Aguirre, E.; Garnica, M.; Fuentes, M. Action of humic acid on promotion of cucumber shoot growth involves nitrate-related changes associated with the root-to-shoot distribution of cytokinins, polyamines and mineral nutrients. J. Plant Physiol. 2010, 167, 633–642. [Google Scholar] [CrossRef]
- Liu, M.L.; Wang, C.; Liu, X.L.; Lu, Y.C.; Wang, Y.F. Saline-alkali soil applied with vermicompost and humic acid fertilizer improved macroaggregate microstructure to enhance salt leaching and inhibit nitrogen losses. Appl. Soil Ecol. 2020, 156, 103705. [Google Scholar] [CrossRef]
- Dong, L.H.; Yuan, Q.; Yuan, L.H. Changes of chemical properties of humic acids from crude and fungal transformed lignite. Fuel 2006, 85, 2402–2407. [Google Scholar] [CrossRef]
- Deng, A.N.; Wu, X.F.; Su, C.L.; Zhao, M.; Wu, B.; Luo, J.H. Enhancement of soil microstructural stability and alleviation of aluminium toxicity in acidic latosols via alkaline humic acid fertiliser amendment. Chem. Geol. 2021, 583, 120473. [Google Scholar] [CrossRef]
- Yang, F.; Sui, L.; Tang, C.Y.; Li, J.S.; Cheng, K.; Xue, Q. Sustainable advances on phosphorus utilization in soil via addition of biochar and humic substances. Sci. Total Environ. 2021, 768, 145106. [Google Scholar] [CrossRef]
- Walling, E.; Vaneeckhaute, C. Greenhouse gas emissions from inorganic and organic fertilizer production and use: A review of emission factors and their variability. J. Environ. Manag. 2020, 276, 111211. [Google Scholar] [CrossRef]
- Zhao, J.; Ni, T.; Li, J.; Lu, Q.; Fang, Z.Y.; Huang, Q.W.; Zhang, R.F.; Li, R.; Shen, B.; Shen, Q.R. Effects of organic–inorganic compound fertilizer with reduced chemical fertilizer application on crop yields, soil biological activity and bacterial community structure in a rice–wheat cropping system. Appl. Soil Ecol. 2016, 99, 1–12. [Google Scholar] [CrossRef]
- Shen, Y.W.; Lin, H.T.; Gao, W.S.; Li, M.L. The effects of humic acid urea and polyaspartic acid urea on reducing nitrogen loss compared with urea. J. Sci. Food Agric. 2020, 100, 4425–4432. [Google Scholar] [CrossRef]
- Zhang, S.Q.; Yuan, L.; Li, W.; Lin, Z.A.; Li, Y.T.; Hu, S.W.; Zhao, B.Q. Effects of urea enhanced with different weathered coal-derived humic acid components on maize yield and fate of fertilizer nitrogen. J. Integr. Agric. 2019, 18, 656–666. [Google Scholar] [CrossRef]
- Liu, M.L.; Wang, C.; Wang, F.Y.; Xie, Y.J. Maize (Zea mays) growth and nutrient uptake following integrated improvement of vermicompost and humic acid fertilizer on coastal saline soil. Appl. Soil Ecol. 2019, 142, 147–154. [Google Scholar] [CrossRef]
- Staff, S.S. Keys to Soil Taxonomy, 12th ed.; Government Printing Office: Washington, DC, USA, 2014. [Google Scholar]
- Zhang, C.; Huang, X.; Zhang, X.W.; Wan, L.; Wang, Z.H. Effects of biochar application on soil nitrogen and phosphorous leaching loss and oil peony growth. Agric. Water Manag. 2021, 255, 107022. [Google Scholar] [CrossRef]
- Long, G.Q.; Li, L.H.; Wang, D.; Zhao, P.; Tang, L.; Zhou, Y.L.; Yin, X.H. Nitrogen levels regulate intercropping-related mitigation of potential nitrate leaching. Agric. Ecosyst. Environ. 2021, 319, 107540. [Google Scholar] [CrossRef]
- Xiao, Q.Y.; Dong, Z.X.; Han, Y.; Hu, L.; Hu, D.N.; Zhu, B. Impact of soil thickness on productivity and nitrate leaching from sloping cropland in the upper Yangtze River Basin. Agric. Ecosyst. Environ. 2021, 311, 107266. [Google Scholar] [CrossRef]
- Zhu, H.; Yang, J.S.; Yao, R.J.; Wang, X.P.; Xie, W.P.; Zhu, W.; Liu, X.Y.; Cao, Y.F.; Tao, J.Y. Interactive effects of soil amendments (biochar and gypsum) and salinity on ammonia volatilization in coastal saline soil. Catena 2020, 190, 104527. [Google Scholar] [CrossRef]
- Sá, M.M.F.; Schaefer, C.E.G.R.; Loureiro, D.C.; Simas, F.N.B.; Alves, B.J.R.; Mendonça, E.D.S.; Figueiredo, E.B.D.; Panosso, A.R. Fluxes of CO2, CH4, and N2O in tundra-covered and Nothofagus forest soils in the Argentinian Patagonia. Sci. Total Environ. 2019, 659, 401–409. [Google Scholar] [CrossRef]
- Zhang, Y.; Liu, D.H.; Jia, Z.K.; Zhang, P. Ridge and furrow rainfall harvesting can significantly reduce N2O emissions from spring maize fields in semiarid regions of China. Soil Tillage Res. 2021, 209, 104971. [Google Scholar] [CrossRef]
- Deforest, J.L. The influence of time, storage temperature, and substrate age on potential soil enzyme activity in acidic forest soils using MUB-linked substrates and l -DOPA. Soil Biol. Biochem. 2009, 41, 1180–1186. [Google Scholar] [CrossRef]
- Bai, X.J.; Dippold, M.A.; An, S.S.; Wang, B.R.; Zhang, H.X.; Loeppmann, S. Extracellular enzyme activity and stoichiometry: The effect of soil microbial element limitation during leaf litter decomposition. Ecol. Indic. 2021, 121, 107200. [Google Scholar] [CrossRef]
- Zhang, W.; Xu, Y.D.; Gao, D.X.; Wang, X.; Liu, W.C.; Deng, J.; Han, X.H.; Yang, G.H.; Feng, Y.Z.; Ren, G.X. Ecoenzymatic stoichiometry and nutrient dynamics along a revegetation chronosequence in the soils of abandoned land and Robinia pseudoacacia plantation on the Loess Plateau, China. Soil Biol. Biochem. 2019, 134, 1–14. [Google Scholar] [CrossRef]
- Li, Z.L.; Liu, Z.G.; Zhang, M.; Chen, Q.; Zheng, L.; Li, Y.C.; Sun, L.L. The combined application of controlled-release urea and fulvic acid improved the soil nutrient supply and maize yield. Arch. Agron. Soil Sci. 2020, 67, 633–646. [Google Scholar] [CrossRef]
- Lu, M.M.; Zhang, Y.B.; Su, Z.J.; Jiang, T. The NMR and spectral study on the structure of molecular size-fractionated lignite humic acid. Resour. Environ. Sustain. 2020, 2, 100004. [Google Scholar] [CrossRef]
- Guo, J.J.; Fan, J.L.; Zhang, F.C.; Yan, S.C.; Zhang, J.; Wu, Y.; Li, J.; Wang, Y.L.; Sun, X.; Liu, X.Q.; et al. Blending urea and slow-release nitrogen fertilizer increases dryland maize yield and nitrogen use efficiency while mitigating ammonia volatilization. Sci. Total Environ. 2021, 790, 148058. [Google Scholar] [CrossRef] [PubMed]
- Yam, K.G.; Upendra, S.; Wendie, D.B.; Job, F.J.; Joaquin, S. Mitigating N2O and NO Emissions from Direct-Seeded Rice with Nitrification Inhibitor and Urea Deep Placement. Rice Sci. 2020, 27, 434–444. [Google Scholar] [CrossRef]
- Liu, X.; Zhang, M.; Li, Z.W.; Zhang, C.; Wan, C.L.; Zhang, Y.; Lee, D.J. Inhibition of urease activity by humic acid extracted from sludge fermentation liquid. Bioresour. Technol. 2019, 290, 121767. [Google Scholar] [CrossRef]
- Sun, X.; Zhong, T.; Zhang, L.; Zhang, K.S.; Wu, W.X. Reducing ammonia volatilization from paddy field with rice straw derived biochar. Sci. Total Environ. 2019, 660, 512–518. [Google Scholar] [CrossRef]
- Yang, Y.; Liang, C.; Wang, Y.Q.; Cheng, H.; An, S.S.; Chang, S.X. Soil extracellular enzyme stoichiometry reflects the shift from P- to N-limitation of microorganisms with grassland restoration. Soil Biol. Biochem. 2020, 149, 107928. [Google Scholar] [CrossRef]
- Zhou, L.; Monreal, C.M.; Xu, S.T.; Mclaughlin, N.B.; Zhang, H.Y.; Hao, G.C.; Liu, J.H. Effect of bentonite-humic acid application on the improvement of soil structure and maize yield in a sandy soil of a semi-arid region. Geoderma 2019, 338, 269–280. [Google Scholar] [CrossRef]
- Wu, S.S.; Liu, C.S.; Li, X.G.; Xiao, B.H.; Hu, Q.Y. Freeze-thaw controlled aggregation mechanism of humic acid-coated goethite: Implications for organic carbon preservation. Geoderma 2021, 406, 115514. [Google Scholar] [CrossRef]
- Bhattacharyya, R.; Rabbi, S.M.F.; Zhang, Y.Q.; Young, I.M.; Jones, A.R.; Dennis, P.G.; Menzies, N.W.; Kopittke, P.M.; Dalal, R.C. Soil organic carbon is significantly associated with the pore geometry, microbial diversity and enzyme activity of the macro-aggregates under different land uses. Sci. Total Environ. 2021, 778, 146286. [Google Scholar] [CrossRef] [PubMed]
- Sinsabaugh, R.L.; Lauber, C.L.; Weintraub, M.N.; Ahmed, B.; Zeglin, L.H. Stoichiometry of soil enzyme activity at global scale. Ecol. Lett. 2008, 11, 1252–1264. [Google Scholar] [CrossRef] [PubMed]
- Saiya-Cork, K.R.; Sinsabaugh, R.L.; Zak, D.R. The effects of long term nitrogen deposition on extracellular enzyme activity in an Acer saccharum forest soil. Soil Biol. Biochem. 2002, 34, 1309–1315. [Google Scholar] [CrossRef]
- Xiao, L.; Liu, G.B.; Li, P.; Li, Q.; Xue, S. Ecoenzymatic stoichiometry and microbial nutrient limitation during secondary succession of natural grassland on the Loess Plateau, China. Soil Tillage Res. 2020, 200, 104605. [Google Scholar] [CrossRef]
- Dong, L.H.; Córdova-Kreylos, A.L.; Yang, J.S.; Yuan, H.L.; Scow, K.M. Humic acids buffer the effects of urea on soil ammonia oxidizers and potential nitrification. Soil Biol. Biochem. 2009, 41, 1612–1621. [Google Scholar] [CrossRef] [PubMed]
- Leptin, A.; Whitehead, D.; Anderson, C.R.; Cameron, K.C.; Lehto, N.J. Increased soil nitrogen supply enhances root-derived available soil carbon leading to reduced potential nitrification activity. Appl. Soil Ecol. 2021, 159, 103842. [Google Scholar] [CrossRef]
- Zhang, S.S.; Du, Q.; Cheng, K.; Antonietti, M.; Yang, F. Efficient Phosphorus Recycling and Heavy Metal Removal from Wastewater Sludge by a Novel Hydrothermal Humification-Technique. Chem. Eng. J. 2020, 394, 124832. [Google Scholar] [CrossRef]
- Li, Y.; Fang, F.; Wei, J.L.; Wu, X.B.; Cui, R.Z.; Li, G.S.; Zheng, F.L.; Tan, D.S. Humic Acid Fertilizer Improved Soil Properties and Soil Microbial Diversity of Continuous Cropping Peanut: A Three-Year Experiment. Sci. Rep. 2019, 9, 12014. [Google Scholar] [CrossRef]
- Zhang, Y.J.; Zhang, W.; Wu, M.; Liu, G.S.; Zhang, Z.J.; Yang, J.C. Effects of irrigation schedules and phosphorus fertilizer rates on grain yield and quality of upland rice and paddy rice. Environ. Exp. Bot. 2021, 186, 104465. [Google Scholar] [CrossRef]
- Ma, Q.; Wang, M.Y.; Zheng, G.L.; Yao, Y.; Tao, R.R.; Zhu, M.; Ding, J.F.; Li, C.Y.; Guo, W.S.; Zhu, X.K. Twice-split application of controlled-release nitrogen fertilizer met the nitrogen demand of winter wheat. Field Crops Res. 2021, 267, 108163. [Google Scholar] [CrossRef]
- Fan, H.M.; Wang, X.W.; Xia, S.; Li, Y.Y.; Sun, X.Z.; Zheng, C.S. Effects of humic acid derived from sediments on growth, photosynthesis and chloroplast ultrastructure in chrysanthemum. Sci. Hortic. 2014, 177, 118–123. [Google Scholar] [CrossRef]
- Castro, T.A.V.T.D.; Berbara, R.L.L.; Tavares, O.C.H.T.; Mello, D.F.D.G.; Pereira, E.G.; Souza, C.D.C.B.D.; Espinosa, L.M. Humic Acids Induce a Eustress State Via Photosynthesis and Nitrogen Metabolism Leading to a Root Growth Improvement in Rice Plants. Plant Physiol. Biochem. 2021, 162, 171–184. [Google Scholar] [CrossRef] [PubMed]


| Treatment | N Loss Pathway | Total N Loss (%) | ||
|---|---|---|---|---|
| IN Leaching (%) | NH3 Volatilization (%) | N2O Emission (%) | ||
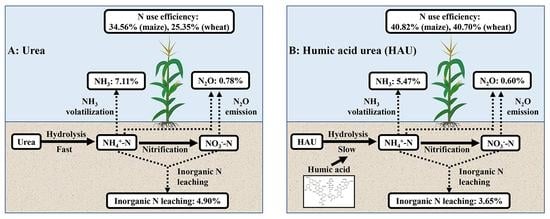
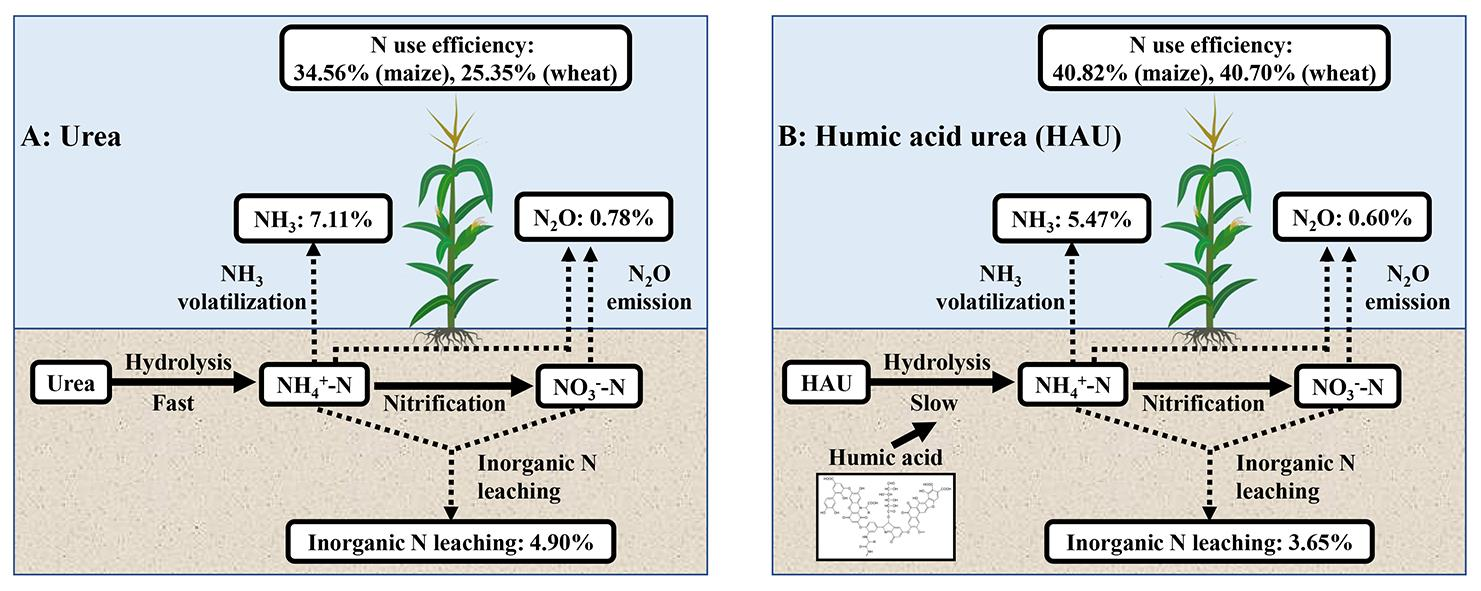
| UN | 4.90 ± 2.20a | 7.11 ± 0.59a | 0.78 ± 0.06a | 12.80 ± 2.26a |
| HUN | 3.65 ± 1.39a | 5.47 ± 0.31b | 0.60 ± 0.01b | 10.02 ± 1.41a |
| Treatment | Maize | Wheat | ||||
|---|---|---|---|---|---|---|
| Yield (kg·hm−2) | N Accumulation (kg·hm−2) | NUE (%) | Yield (kg·hm−2) | N Accumulation (kg·hm−2) | NUE (%) | |
| CK | 5355.85 ± 266.43c | 112.93 ± 12.18d | 7612.61 ± 470.30d | 68.57 ± 3.74c | ||
| UN | 7465.38 ± 236.77b | 195.89 ± 13.04a | 34.56 ± 5.43bc | 8078.30 ± 517.01cd | 129.40 ± 9.62b | 25.35 ± 4.01c |
| HUN | 8058.45 ± 228.73ab | 210.91 ± 3.19a | 40.82 ± 1.33ab | 10,750.33 ± 504.24a | 166.25 ± 16.80a | 40.70 ± 7.00ab |
| HUN1 | 8527.90 ± 59.05a | 213.96 ± 15.67a | 46.77 ± 7.25a | 9335.90 ± 275.83b | 165.76 ± 6.56a | 45.00 ± 3.04a |
| HUN2 | 7828.41 ± 442.62ab | 175.01 ± 6.08b | 32.33 ± 3.17c | 8860.89 ± 727.78bc | 129.51 ± 16.75b | 31.74 ± 8.72bc |
| HUN3 | 7381.10 ± 762.17b | 140.44 ± 2.46c | 16.37 ± 1.46d | 8619.59 ± 370.33bc | 121.70 ± 7.89b | 31.63 ± 4.70bc |
| Treatment | Maize | Wheat | ||
|---|---|---|---|---|
| TEP ($ hm−2) | NEP ($ hm−2) | TEP ($ hm−2) | NEP ($ hm−2) | |
| CK | 2058.79 ± 102.42c | 1704.3 ± 102.42c | 2907.41 ± 359.24b | 2536.83 ± 359.24b |
| UN | 2869.69 ± 91.01b | 2392.08 ± 91.01b | 3085.26 ± 394.91b | 2583.35 ± 394.91b |
| HUN | 3097.67 ± 87.92ab | 2592.01 ± 87.92ab | 4105.77 ± 385.16a | 3573.94 ± 385.16a |
| HUN1 | 3278.12 ± 22.7a | 2787.58 ± 22.7a | 3565.57 ± 210.69ab | 3049.86 ± 210.69ab |
| HUN2 | 3009.24 ± 170.14ab | 2533.81 ± 170.14ab | 3384.15 ± 555.91b | 2884.57 ± 555.91ab |
| HUN3 | 2837.29 ± 292.98b | 2376.98 ± 292.98b | 3291.99 ± 282.87b | 2808.54 ± 282.87b |
Publisher’s Note: MDPI stays neutral with regard to jurisdictional claims in published maps and institutional affiliations. |
© 2022 by the authors. Licensee MDPI, Basel, Switzerland. This article is an open access article distributed under the terms and conditions of the Creative Commons Attribution (CC BY) license (https://creativecommons.org/licenses/by/4.0/).
Share and Cite
Kong, B.; Wu, Q.; Li, Y.; Zhu, T.; Ming, Y.; Li, C.; Li, C.; Wang, F.; Jiao, S.; Shi, L.; et al. The Application of Humic Acid Urea Improves Nitrogen Use Efficiency and Crop Yield by Reducing the Nitrogen Loss Compared with Urea. Agriculture 2022, 12, 1996. https://doi.org/10.3390/agriculture12121996
Kong B, Wu Q, Li Y, Zhu T, Ming Y, Li C, Li C, Wang F, Jiao S, Shi L, et al. The Application of Humic Acid Urea Improves Nitrogen Use Efficiency and Crop Yield by Reducing the Nitrogen Loss Compared with Urea. Agriculture. 2022; 12(12):1996. https://doi.org/10.3390/agriculture12121996
Chicago/Turabian StyleKong, Baishu, Qicong Wu, Yongqiang Li, Taochuan Zhu, Yufei Ming, Chuanfu Li, Chuanrong Li, Fenghua Wang, Shuying Jiao, Lianhui Shi, and et al. 2022. "The Application of Humic Acid Urea Improves Nitrogen Use Efficiency and Crop Yield by Reducing the Nitrogen Loss Compared with Urea" Agriculture 12, no. 12: 1996. https://doi.org/10.3390/agriculture12121996
APA StyleKong, B., Wu, Q., Li, Y., Zhu, T., Ming, Y., Li, C., Li, C., Wang, F., Jiao, S., Shi, L., & Dong, Z. (2022). The Application of Humic Acid Urea Improves Nitrogen Use Efficiency and Crop Yield by Reducing the Nitrogen Loss Compared with Urea. Agriculture, 12(12), 1996. https://doi.org/10.3390/agriculture12121996