1. Introduction
Up until present, the application of scientific and technological developments through increased mechanization and precision farming have provided several opportunities in agricultural production and within forage handling operations. Some promising engineering developments in the 20th century with regard to forage handling include forage harvesters, balers, and the automated wrapping equipment of balers using stretch films 25 µm thick to reduce the risks of dust, molds, spores, and mycotoxin respiratory allergenic disorders in livestock and humans. Baler machines have made it possible to trade silage (harvest and storage of moist grass using fermentation) in portable packages between farms, which typically weigh 600–800 kg freshly cut per bales and are more popular on smaller farms with limited labor and financial resources to construct silos [
1,
2].
Bales made up of hay or silage formed by hay are usually too heavy to be picked up by humans alone. Thus, they are picked up from fields using conventional utility vehicles such as tractors or loaders operated by a human. These kinds of operations are labor intensive and associated with health and accident risks [
3]. There is also a potential to further improve the efficiency and environmental impact since most decisions are made by humans and thus limited to human capacities in terms of sensing, multitasking, planning, consequence analysis, etc.
Therefore, in this study, the possibility of using a new autonomous agricultural vehicle with the neighborhood pick-up capabilities concept (AVN) was investigated. The research focused on off-board path planning, which is a critical task within the complete automation process of the bale pick-up operation.
Research in the route or path planning of agricultural field tasks can be broadly categorized into two groups based on the similarity of operations: coverage path planning (CCP) and point-to-point path planning (P2P). It has been observed by [
4] that agricultural operations that required coverage path planning have been slightly more investigated. Most solutions for the path planning of agricultural field operations are based on optimization methods utilizing heuristic approaches or metaheuristic approaches depending upon the size and context of the problem [
5]. In situations where vehicle routes must be planned over large areas with high economical risk, methods such as metaheuristics perform an extensive search for a solution and should thus be preferred [
6].
Route planning for agricultural field operations (AFOs) involving the use of vehicles is referred to as vehicle route planning (VRP), which is a well-studied problem in the field of operational planning. Recently, VRP solutions have been applied to the planning and execution of various agricultural field tasks by researchers for the scheduling of the transportation of livestock [
7,
8] mission planning for coverage operation such as grass mowing and seedling [
9], biomass operation scheduling [
10], farm-to-farm path determination for scheduling crop harvesting [
11], and route planning for fertilizer application [
12]. Recently, a decision tool to support farmers in the operational planning of field operations was proposed by [
13] to assist in field partitioning, route generation, and evaluation.
Significant improvements have been shown for AFOs in research by the automation of the AFOs. A study [
14] on field coverage operations for an autonomous tractor using a mission planner showed a 50% reduction in non-working distance. Coverage operations were then further studied for irregular shaped fields with obstacles [
15,
16]. In another implementation by [
17], the optimal covering route and feasible positions for grain transfer between the combine harvesters and tractors were generated using VRP and the minimum cost network flow.
The application and comparability of metaheuristics for AFOs have been widely studied and is still ongoing. Recently, a hybrid genetic algorithm (GA) was tested by [
18] for a capacitive vehicle route problem (CVRP) by utilizing Gillett and Miller, Downhill, and nearest neighbor heuristics to generate the initial population and refine solutions of GA. Experimental results showed that the hybrid approach generated good solutions for CVRP with low computational cost. In another research by [
19] with regard to capacitated coverage path planning problem for arable field, two popular metaheuristics—simulated annealing optimization (SAO) and ant colony optimization (ACO) techniques—were evaluated and it was found that SAO performed better than ACO. Aside from AFOs, a multi-objective optimal solution to priority-based waste collection and transportation was proposed by [
20] using particle swarm optimization, local search, and simulated annealing (SAO). The optimized solution resulted in a 42.3% reduction in the negative effects of greenhouse gas emissions compared to traditional waste management.
So far, few studies have investigated the bale management in fields. There exists few published studies on the sequence optimization of the bale collection operation using wagons or loaders. The intended bale field operation was described as a bale collection problem (BCP) and was solved as a traveling salesman problem using GA by [
21]. While in another study on BCP in [
22], a heuristic-based approach based on K-mean clustering and nearest neighbor techniques to optimize the bale collection route were tested in simulation. Comparative results from both studies showed significant improvement in the final generated route. However, no other research studies were found on the route optimization of bale collection and no single study was found on the bale collection on fields, especially with the prerequisite of neighborhood pick-up possibilities.
1.1. Objective
The objective of the research presented in this paper was to optimize the bale collection operation by means of travelled distance using notion of an autonomous articulated vehicle with neighborhood collection capability (AVN) and compare that with traditional collection methods.
1.2. Scope
The research focused on the development of a global route plan for bale collection operations in simulation for notion of using AVN. For a global route plan, a static and known environment was considered since bale positions and fields are static entities. Bale positions were assumed to been known from a previous baling operation.
The following additional general assumptions were made:
- -
Only bale collection operation was studied;
- -
A notion of new type of agricultural vehicle (AVN) was considered for the application;
- -
The AVN was considered to be a nonholonomic point like robot for the path generation;
- -
Kinetic constraints of the vehicle were excluded;
- -
Feasibility is measured only by total travelled distance.
2. Research Methodology
To investigate the effects of different bale collection strategies, a simulation approach was chosen. Path planning is typically performed in computer environments, which further makes feasibility evaluation easy compared to real life experimental strategies (i.e., to measure the feasibility on path suggestions on an actual field).
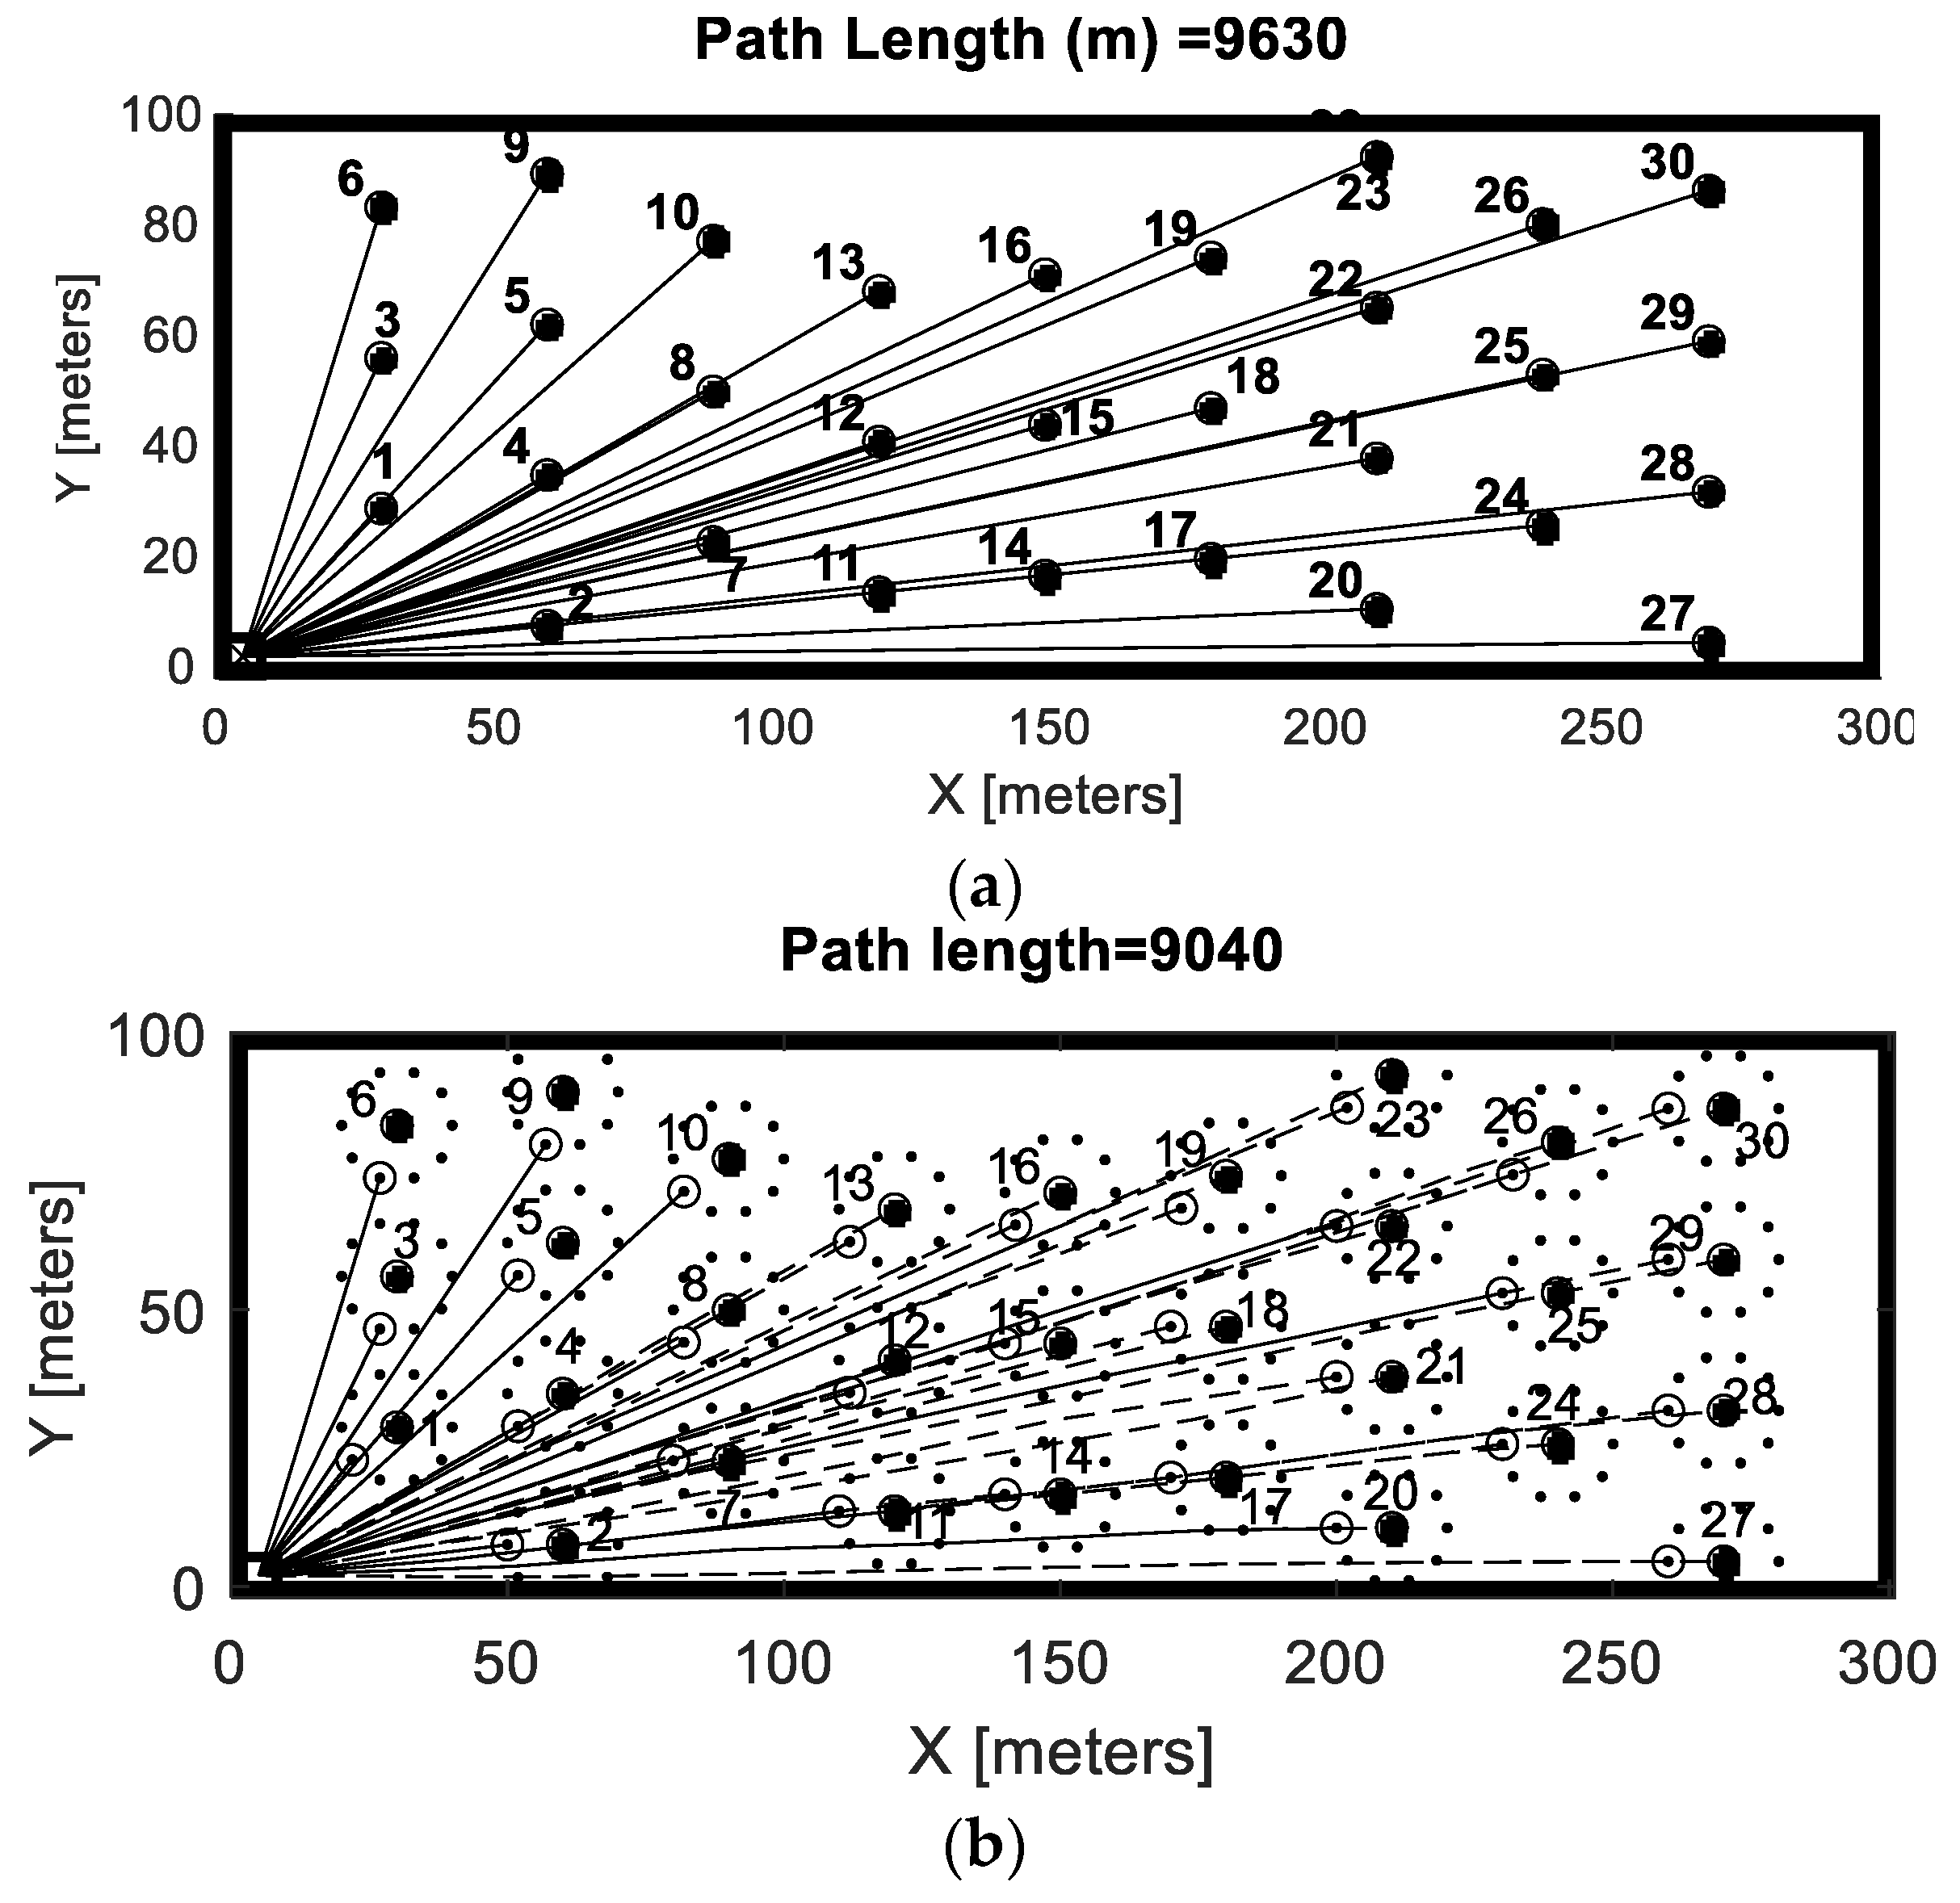
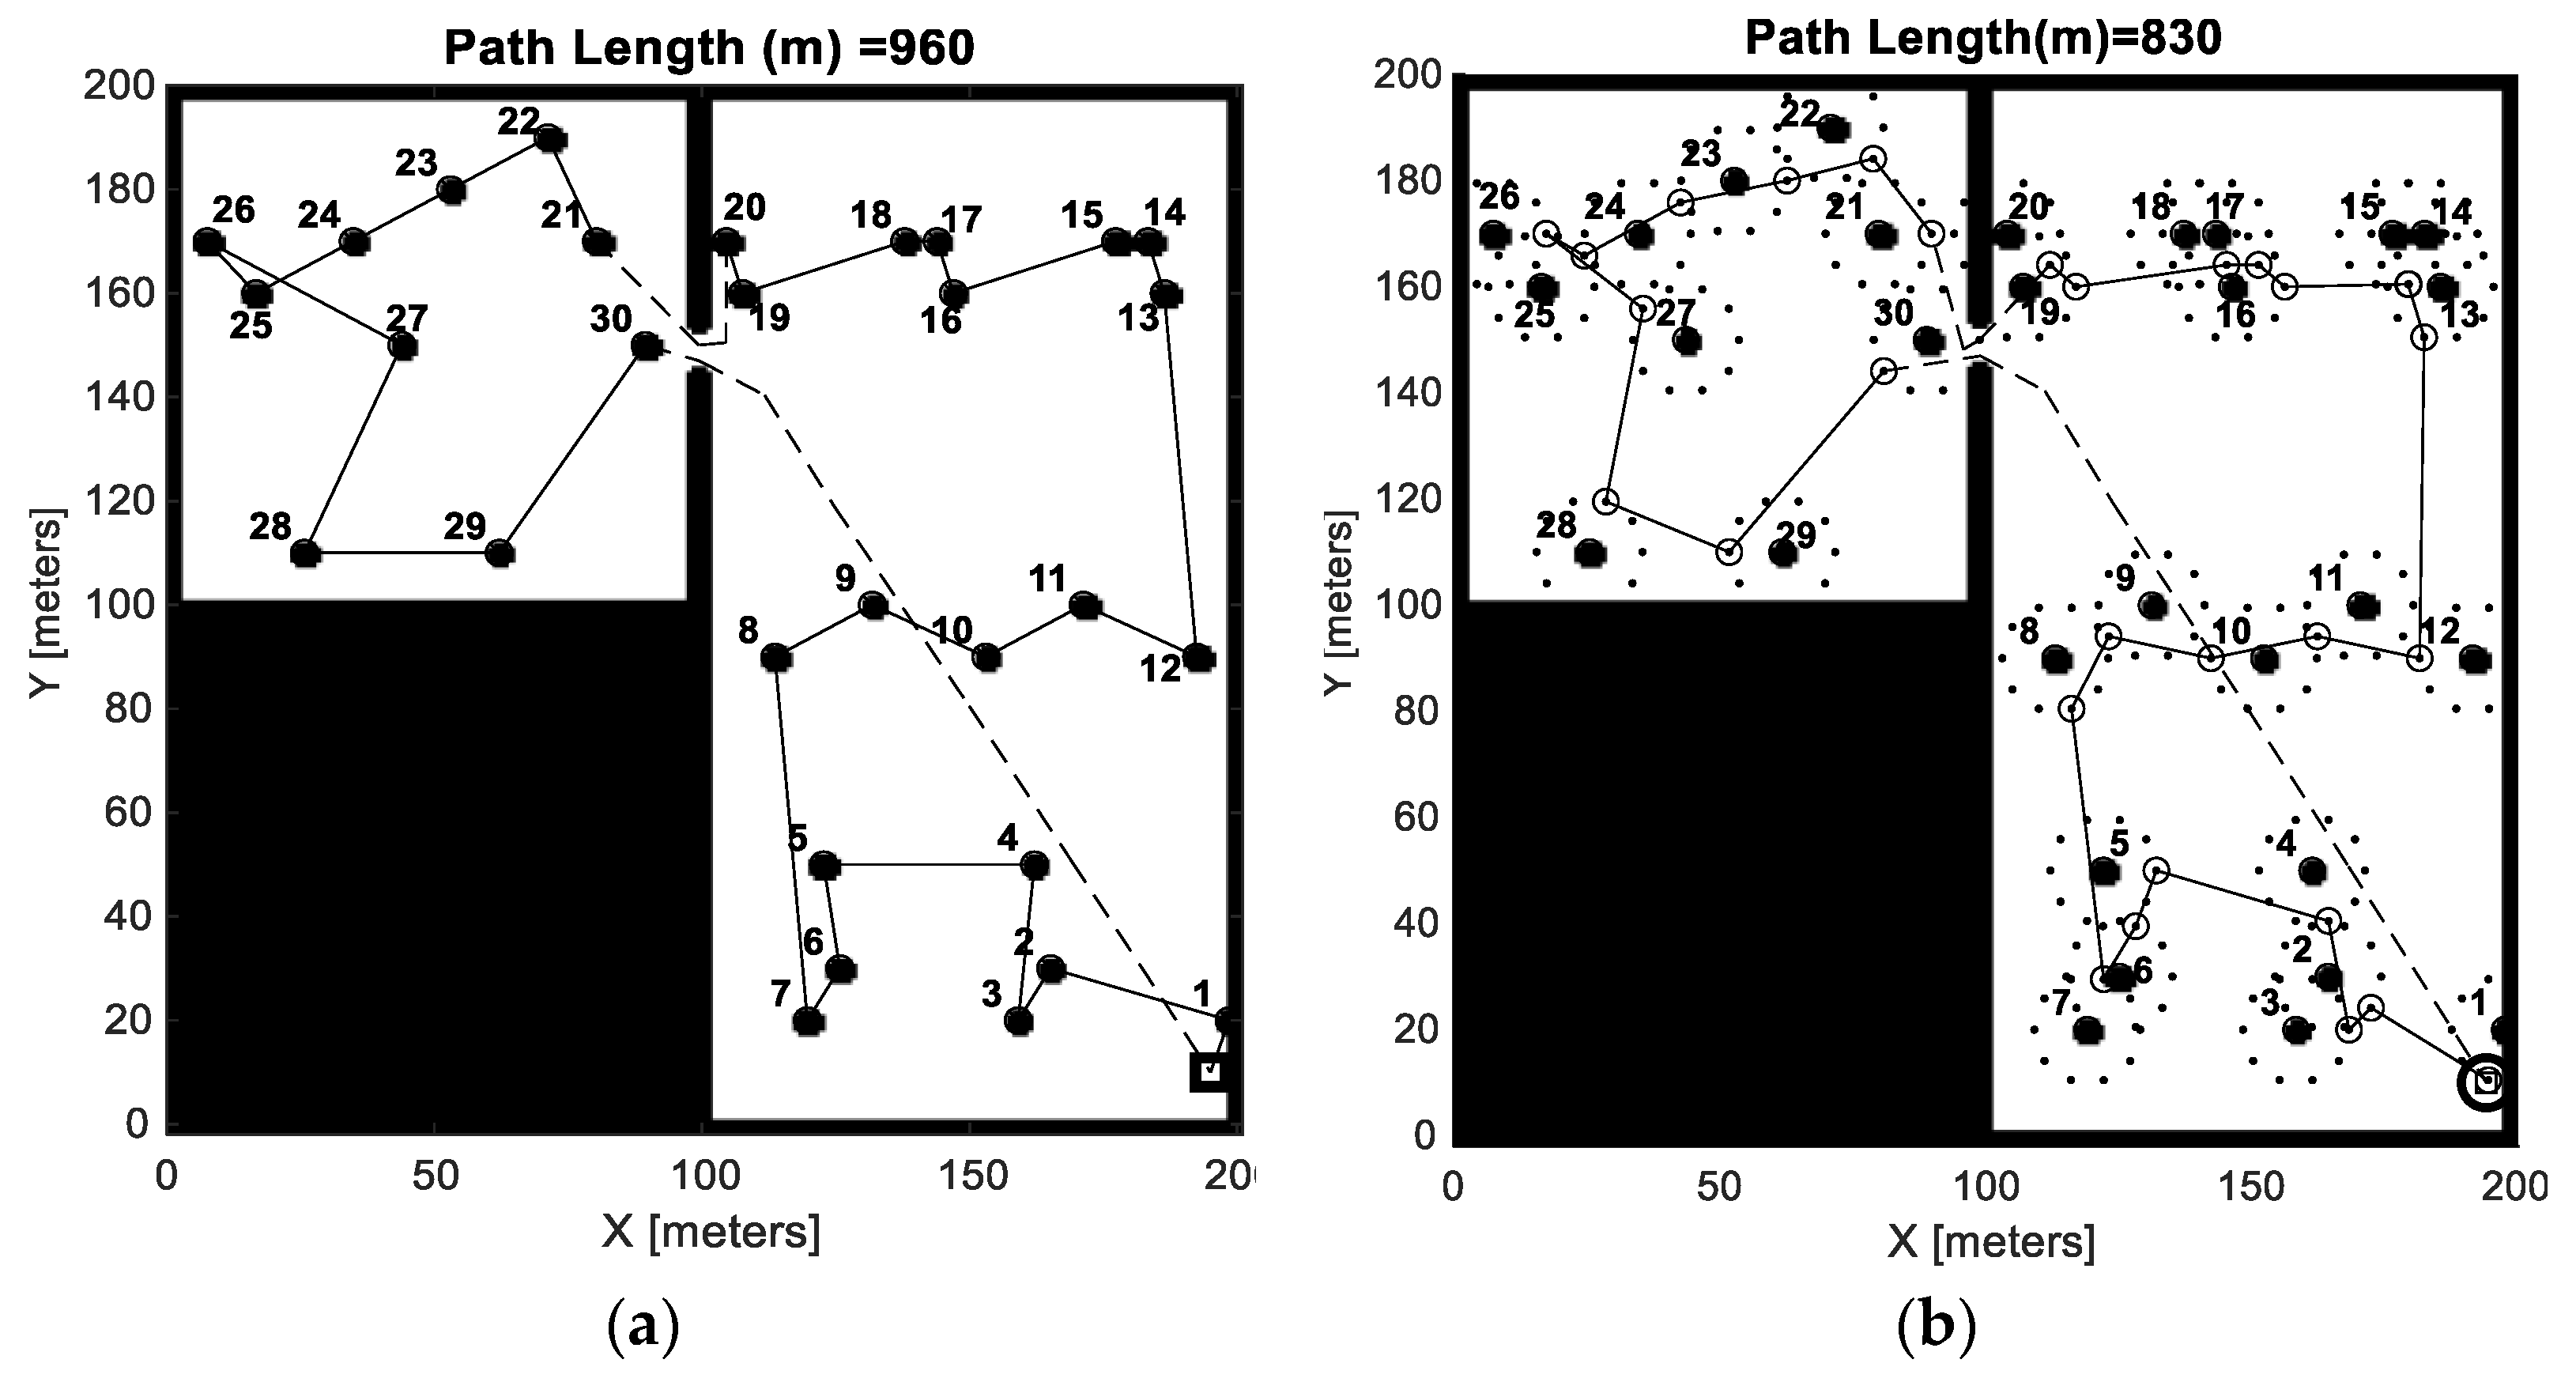
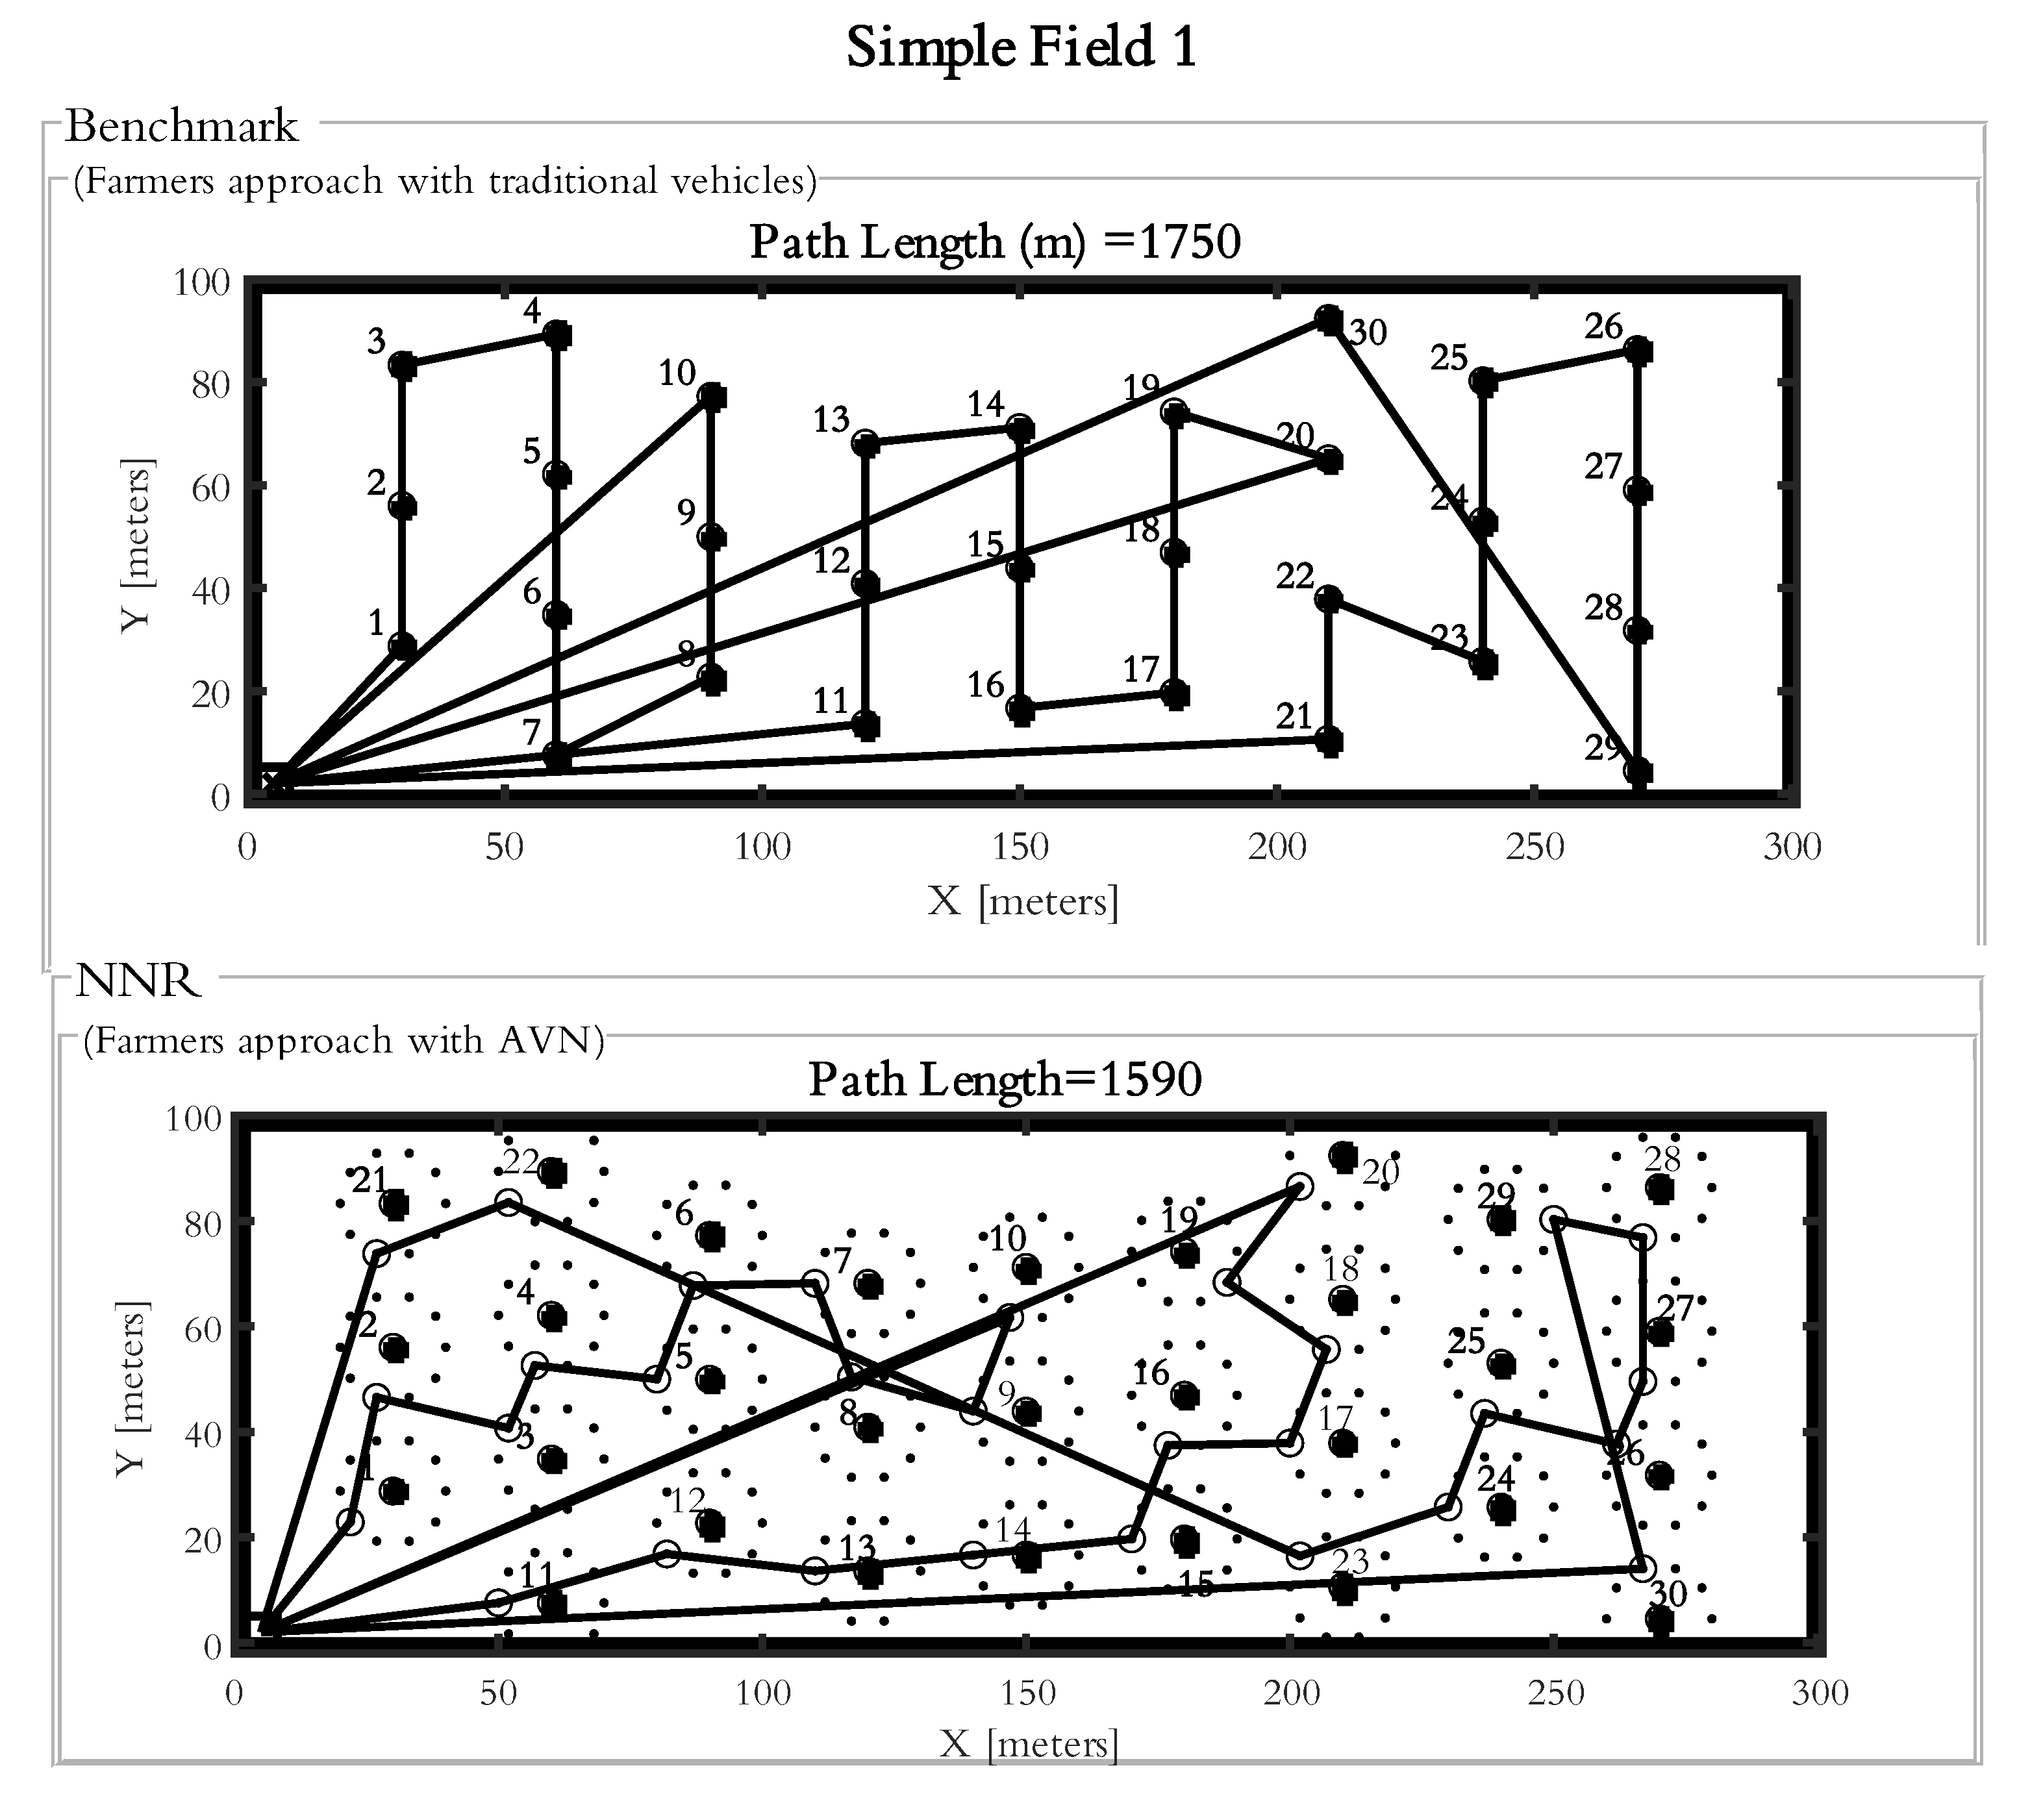
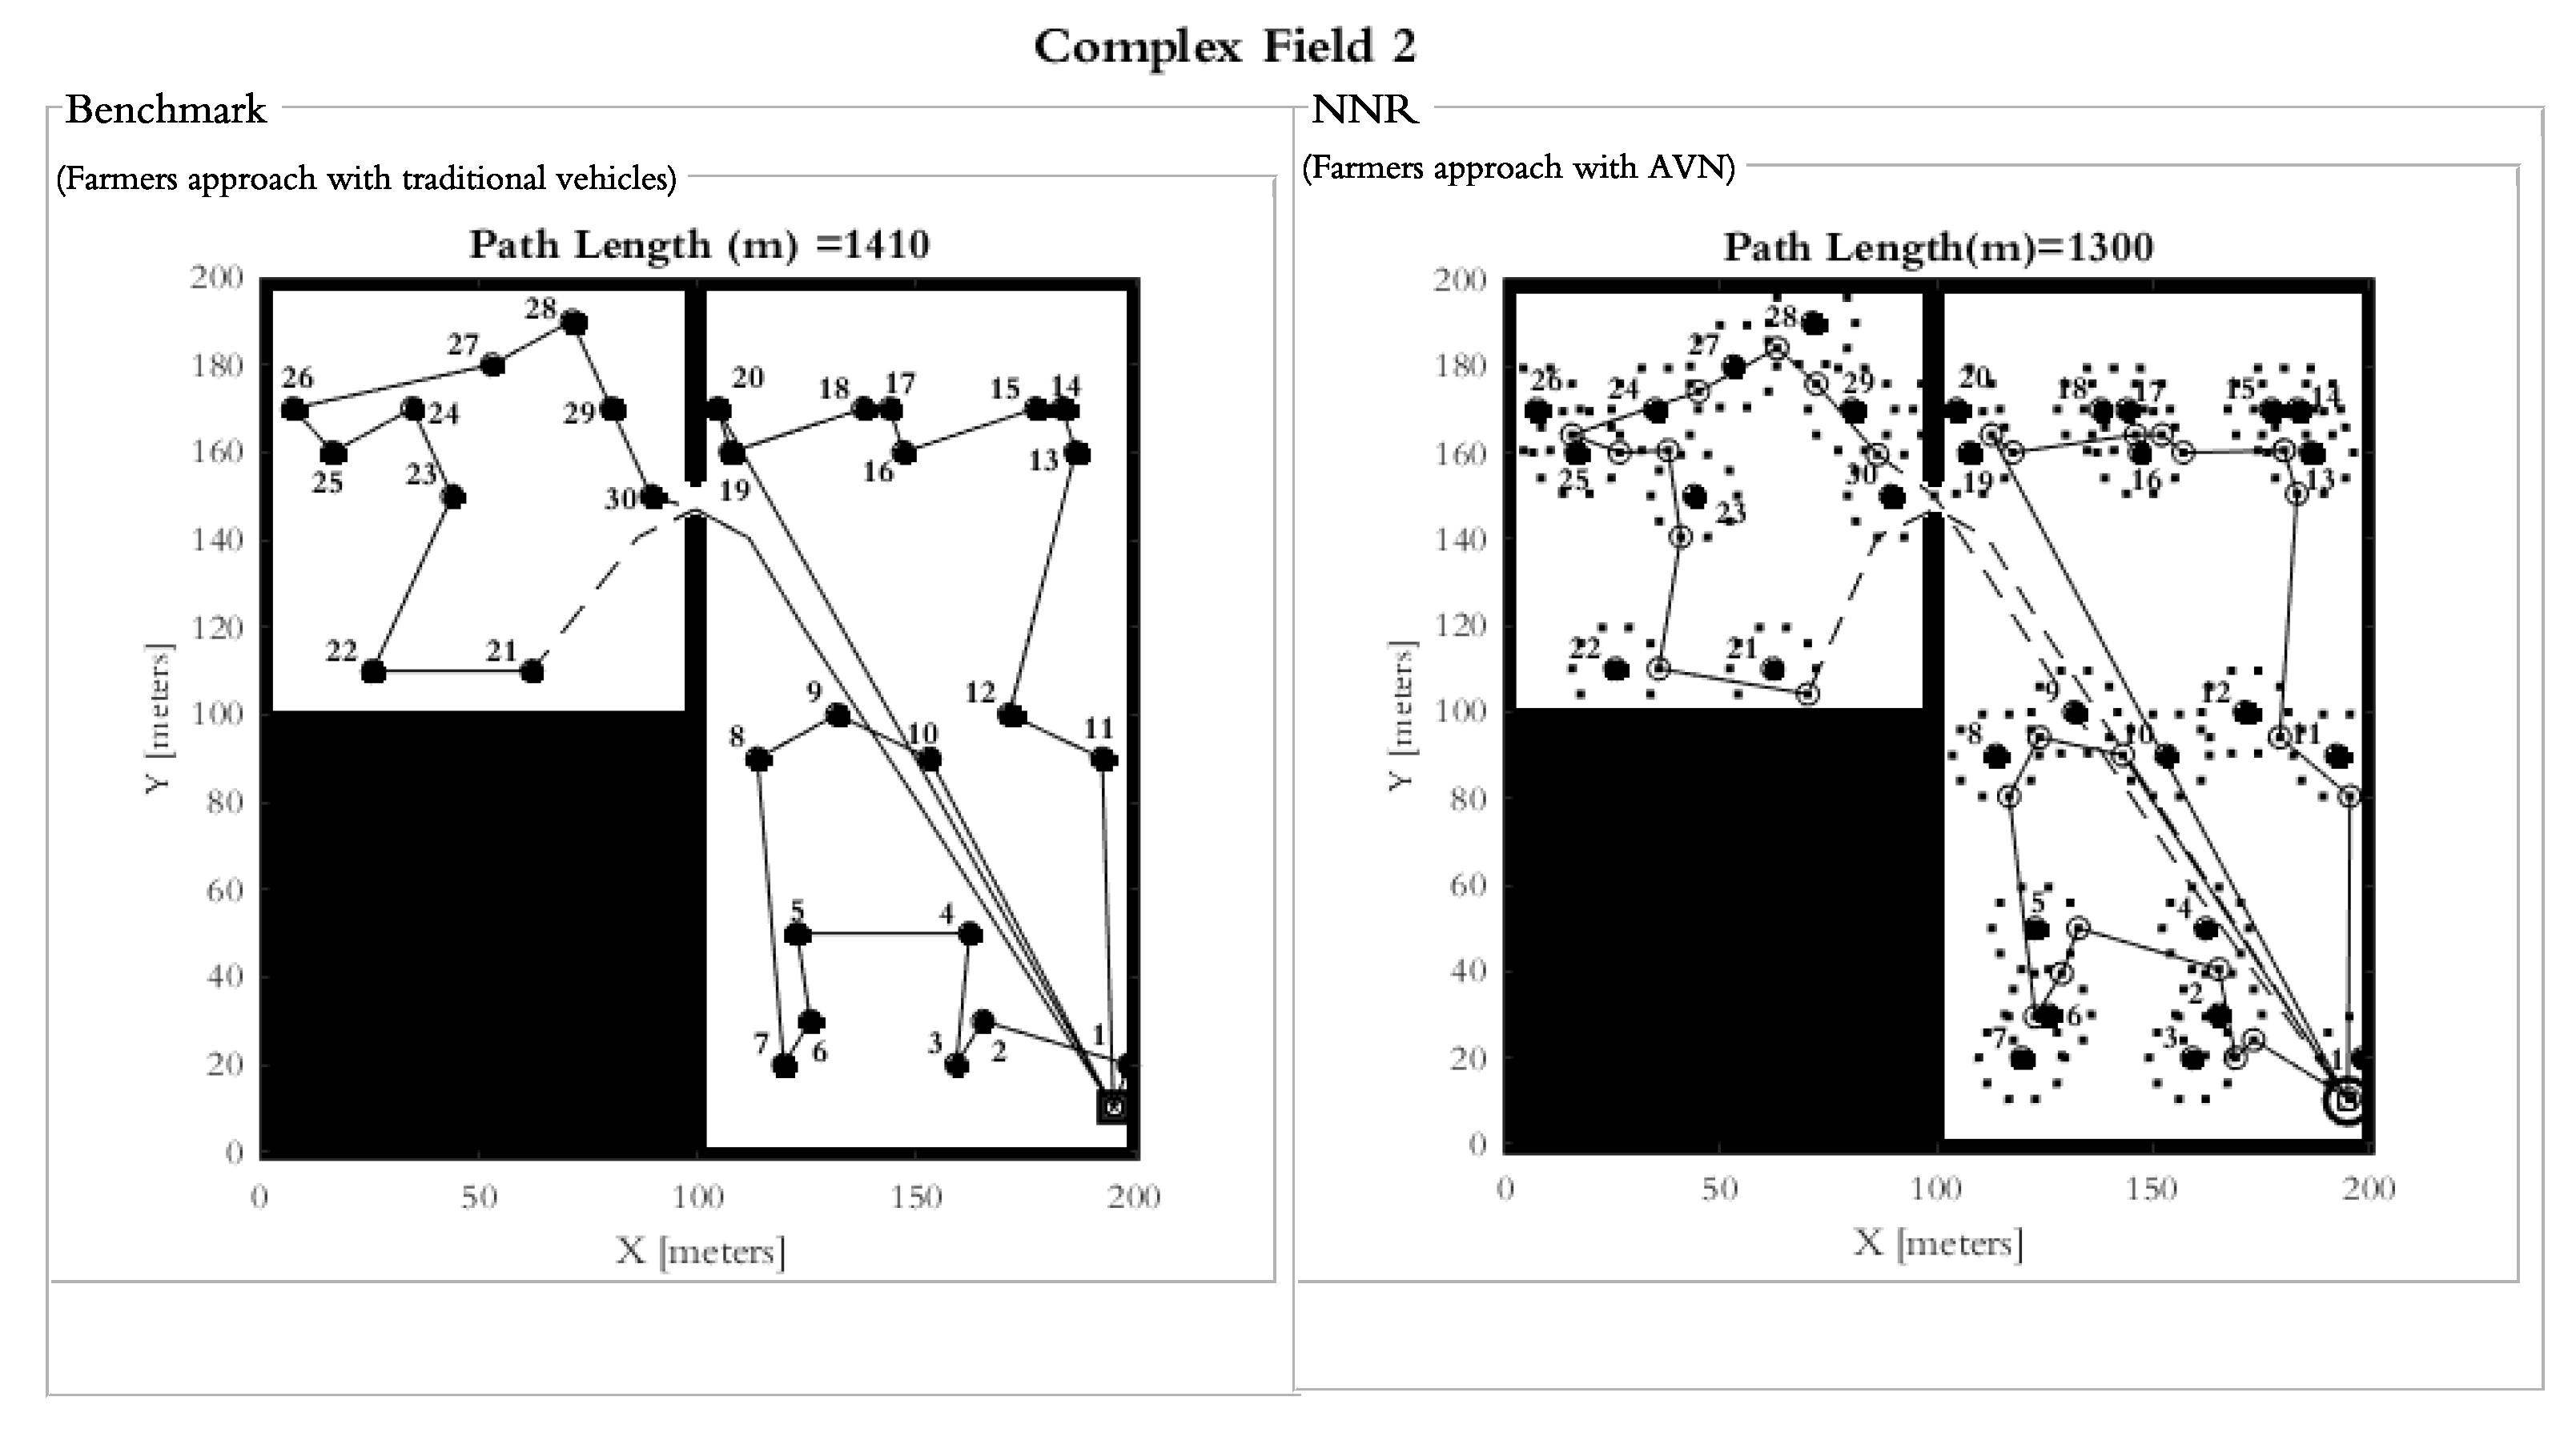
Two different approaches were studied and verified through the testing of situations with outcome pre-knowledge. The first approach imitates the bale collection strategy of farmers by always choosing the closest bales from the current position. The other approach instead uses a GA to optimize the collection order and position within a radius from which the AVN can reach. To investigate the differences in travelled distance (i.e., chosen feasibility) between a traditional and proposed collection approach, two different fields of the same size and with the same number of bales with a pre-determined distribution was studied. One was a simple rectangular field (field 1) and the other was a L-shaped field with more geometrical constraints (field 2). This enables investigations of possible dependencies on field complexity. With the fields selected, some simulation parameters could be set (e.g., grid size, inflation length, number of possible pick-up positions etc.) by conducting verifying tests to find a trade-off between the computational time and accuracy. Then, the experiments were designed by choosing which parameters to vary and thus which simulations to run. To enable comparison, the results from these simulations were then compiled into tables and some paths were also visualized, enabling the analysis of collection order as well as verification on the feasibility.
The traditional approach was generated by considering how humans would operate in a typical agricultural environment for bale collection operation. Generally, a human operator would pick-up the next visible bales closest to the present location. Such a heuristic approach could be programmed by using the nearest neighbor algorithm. Through this approach, two different cases were studied: one with a traditional pick-up vehicle which always has to go to the nearest bales and another with the AVN.
In addition, an optimization approach based on commonly used GA was further developed, thus enabling a comparison to the traditional approach. Here, two different strategies for initial population generation were used to show the effects on convergence.
Verification of the simulations were conducted by running a test simulation on configurations where the results were pre-known. In addition, the results from all simulations were analyzed manually to make sure that the paths were consistent.
2.1. Model Description
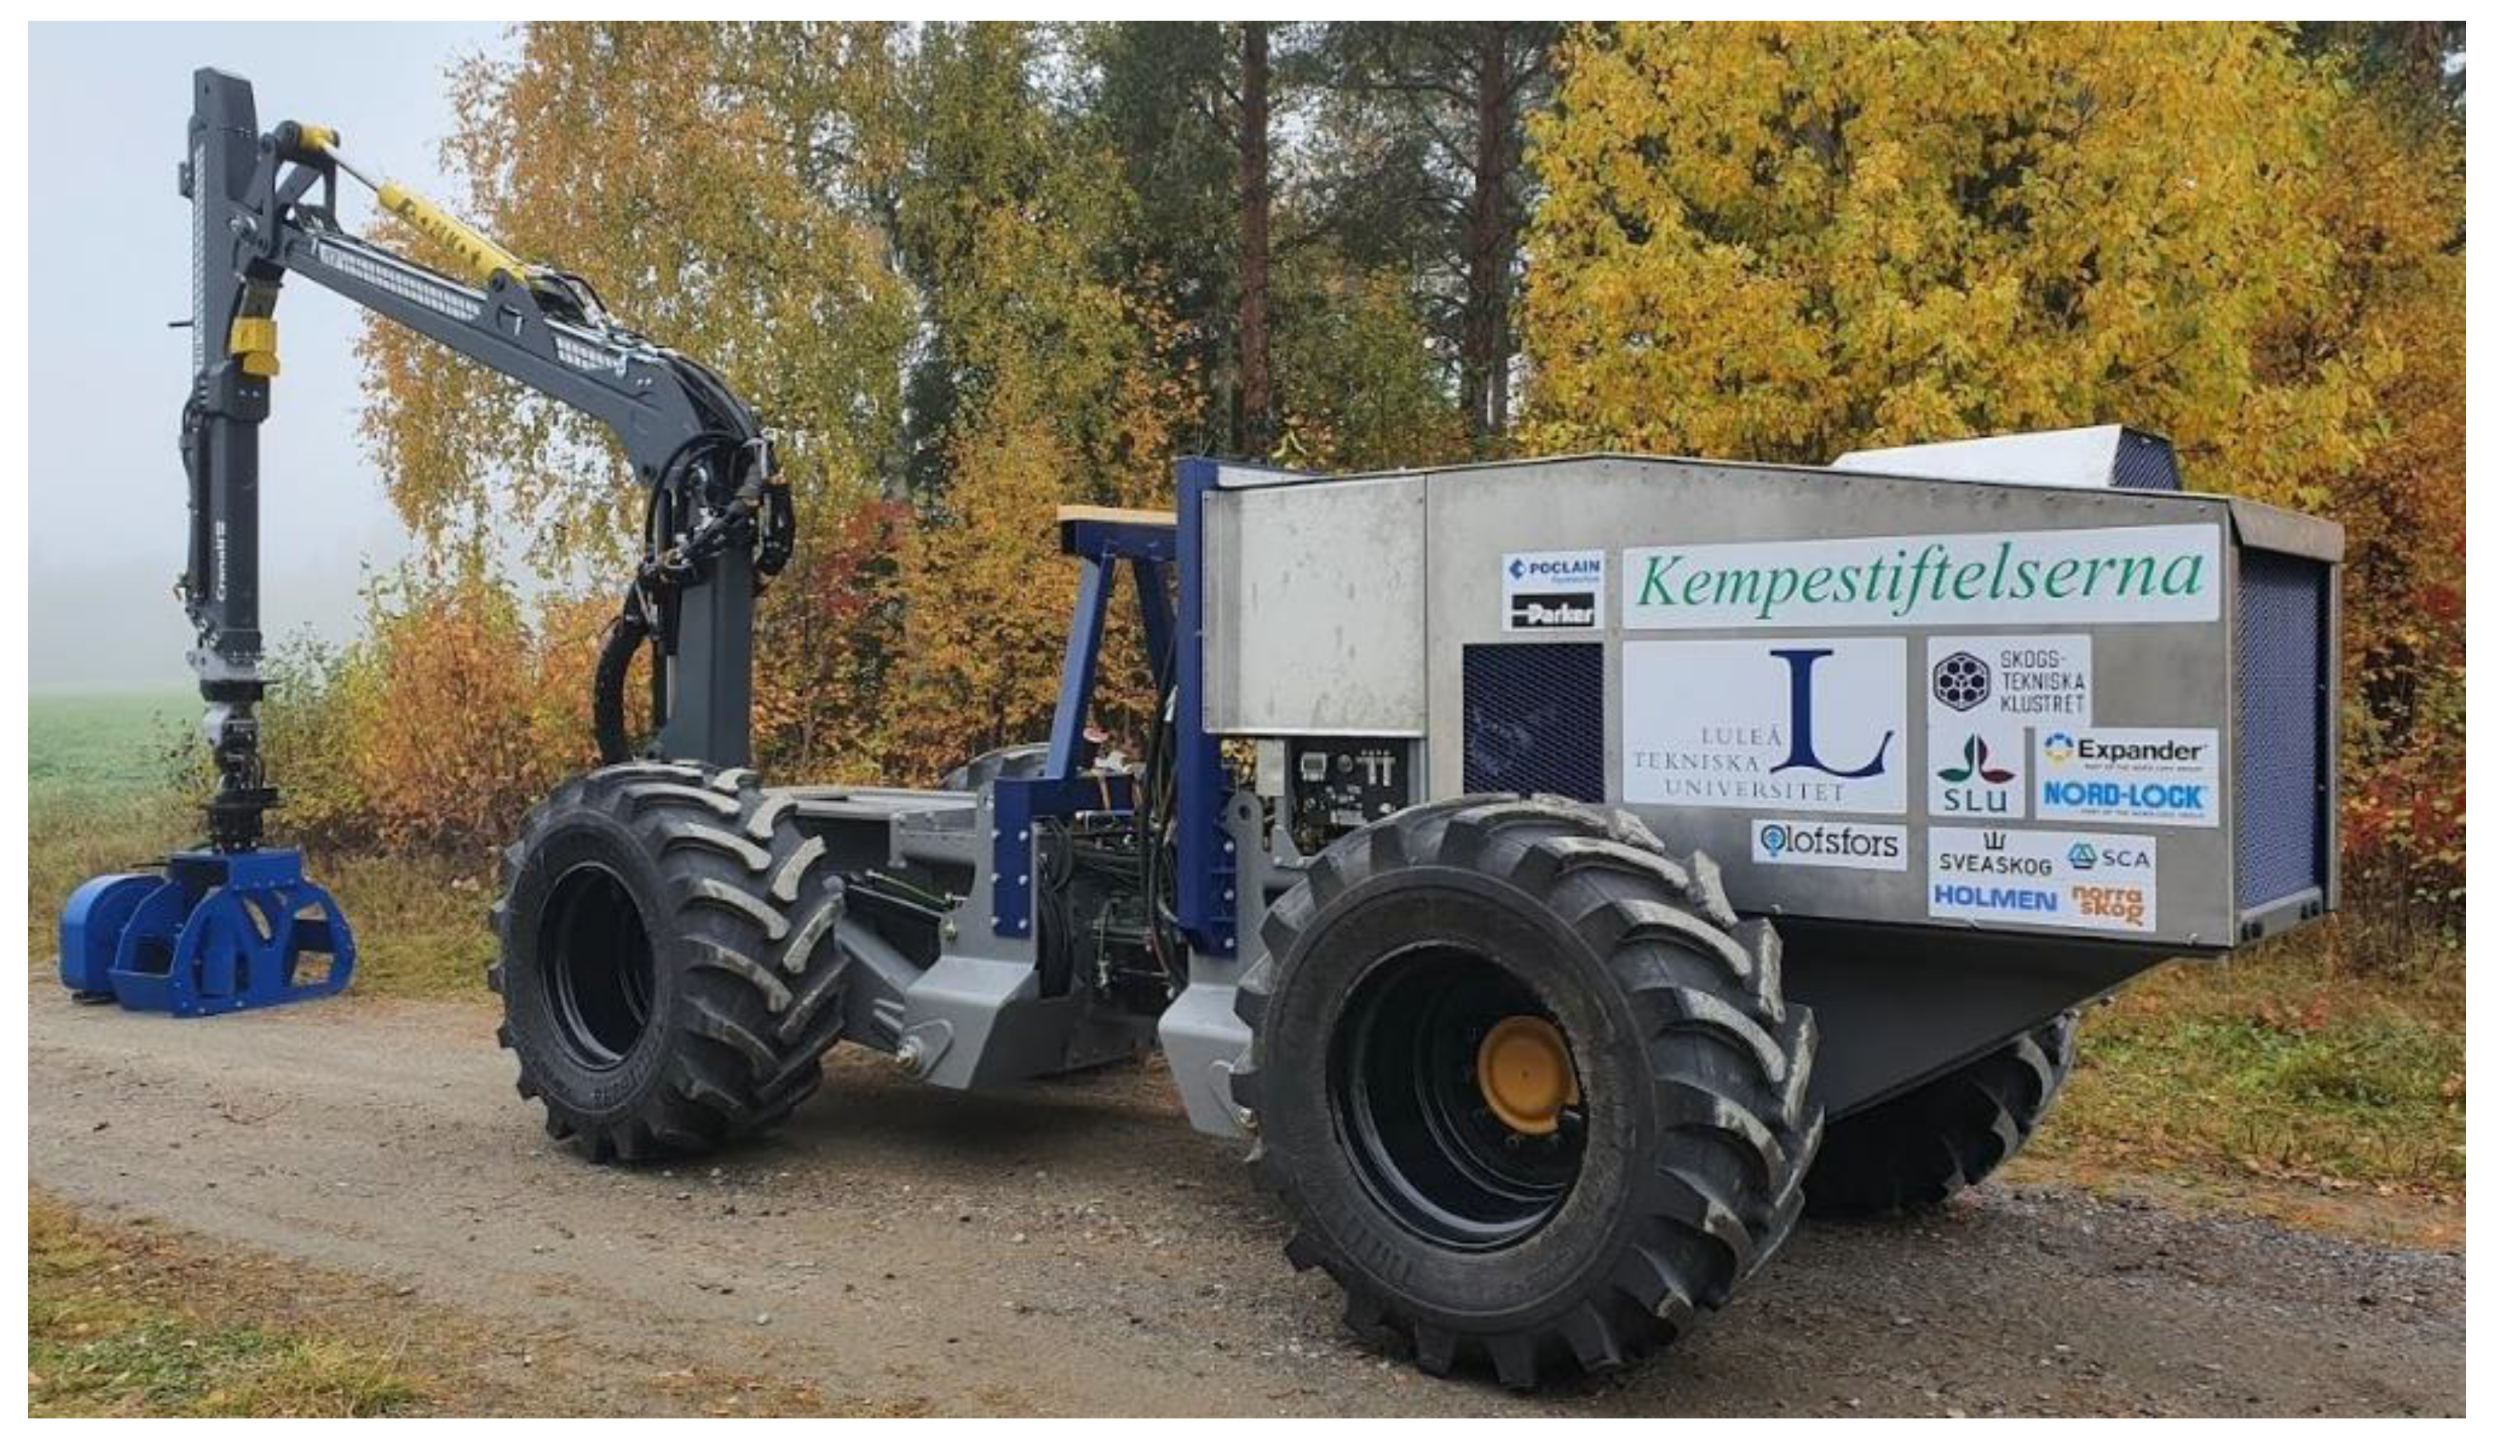
In this study, a notion of an AVN (see
Figure 1) with a regular forwarder crane of 10 m long was used for the modeling. For comparison, traditional agricultural vehicles (e.g., tractors or loaders) were also modeled. These traditional vehicles are typically equipped with front loaders requiring additional traveling for the loading of each bale (i.e., they cannot load bales onto themselves). This effect is excluded in the traditional vehicle models in this study, leading to underestimation of the travelled distance.
The problem formulation for the bale collection operation with a crane makes it somewhat unique. The AVN can collect bales at a radius R, which makes the situation a close enough traveling salesman problem (CETSP) [
23]. The CETSP is a NP hard, combinatorial problem, and some recent solutions for CETSP have been proposed based on the discrete gravitation search algorithm and self-organizing maps [
24,
25]. However, the vehicle can have different carrying capacities, thus leading to a close enough traveling salesman problem with a capacity constraint. In this study, the collection sequence and collection positions minimizing the total travelled distance was searched for and thus the CETSP is defined as
where
is the bale pick up sequence; CP is the desired collection position at radius R (specified by AVN reach radius) around the bale positions (BP);
is a function that calculates the minimum length tour at collection positions around each bale.
Agricultural Field Models
The agricultural fields were modeled in two steps. To represent “go” and “no go” areas (obstacles), binary occupancy maps (BOM) [
26] were used and to find non-collision paths within the “go” areas, probability roadmaps (PRM) [
27] were used.
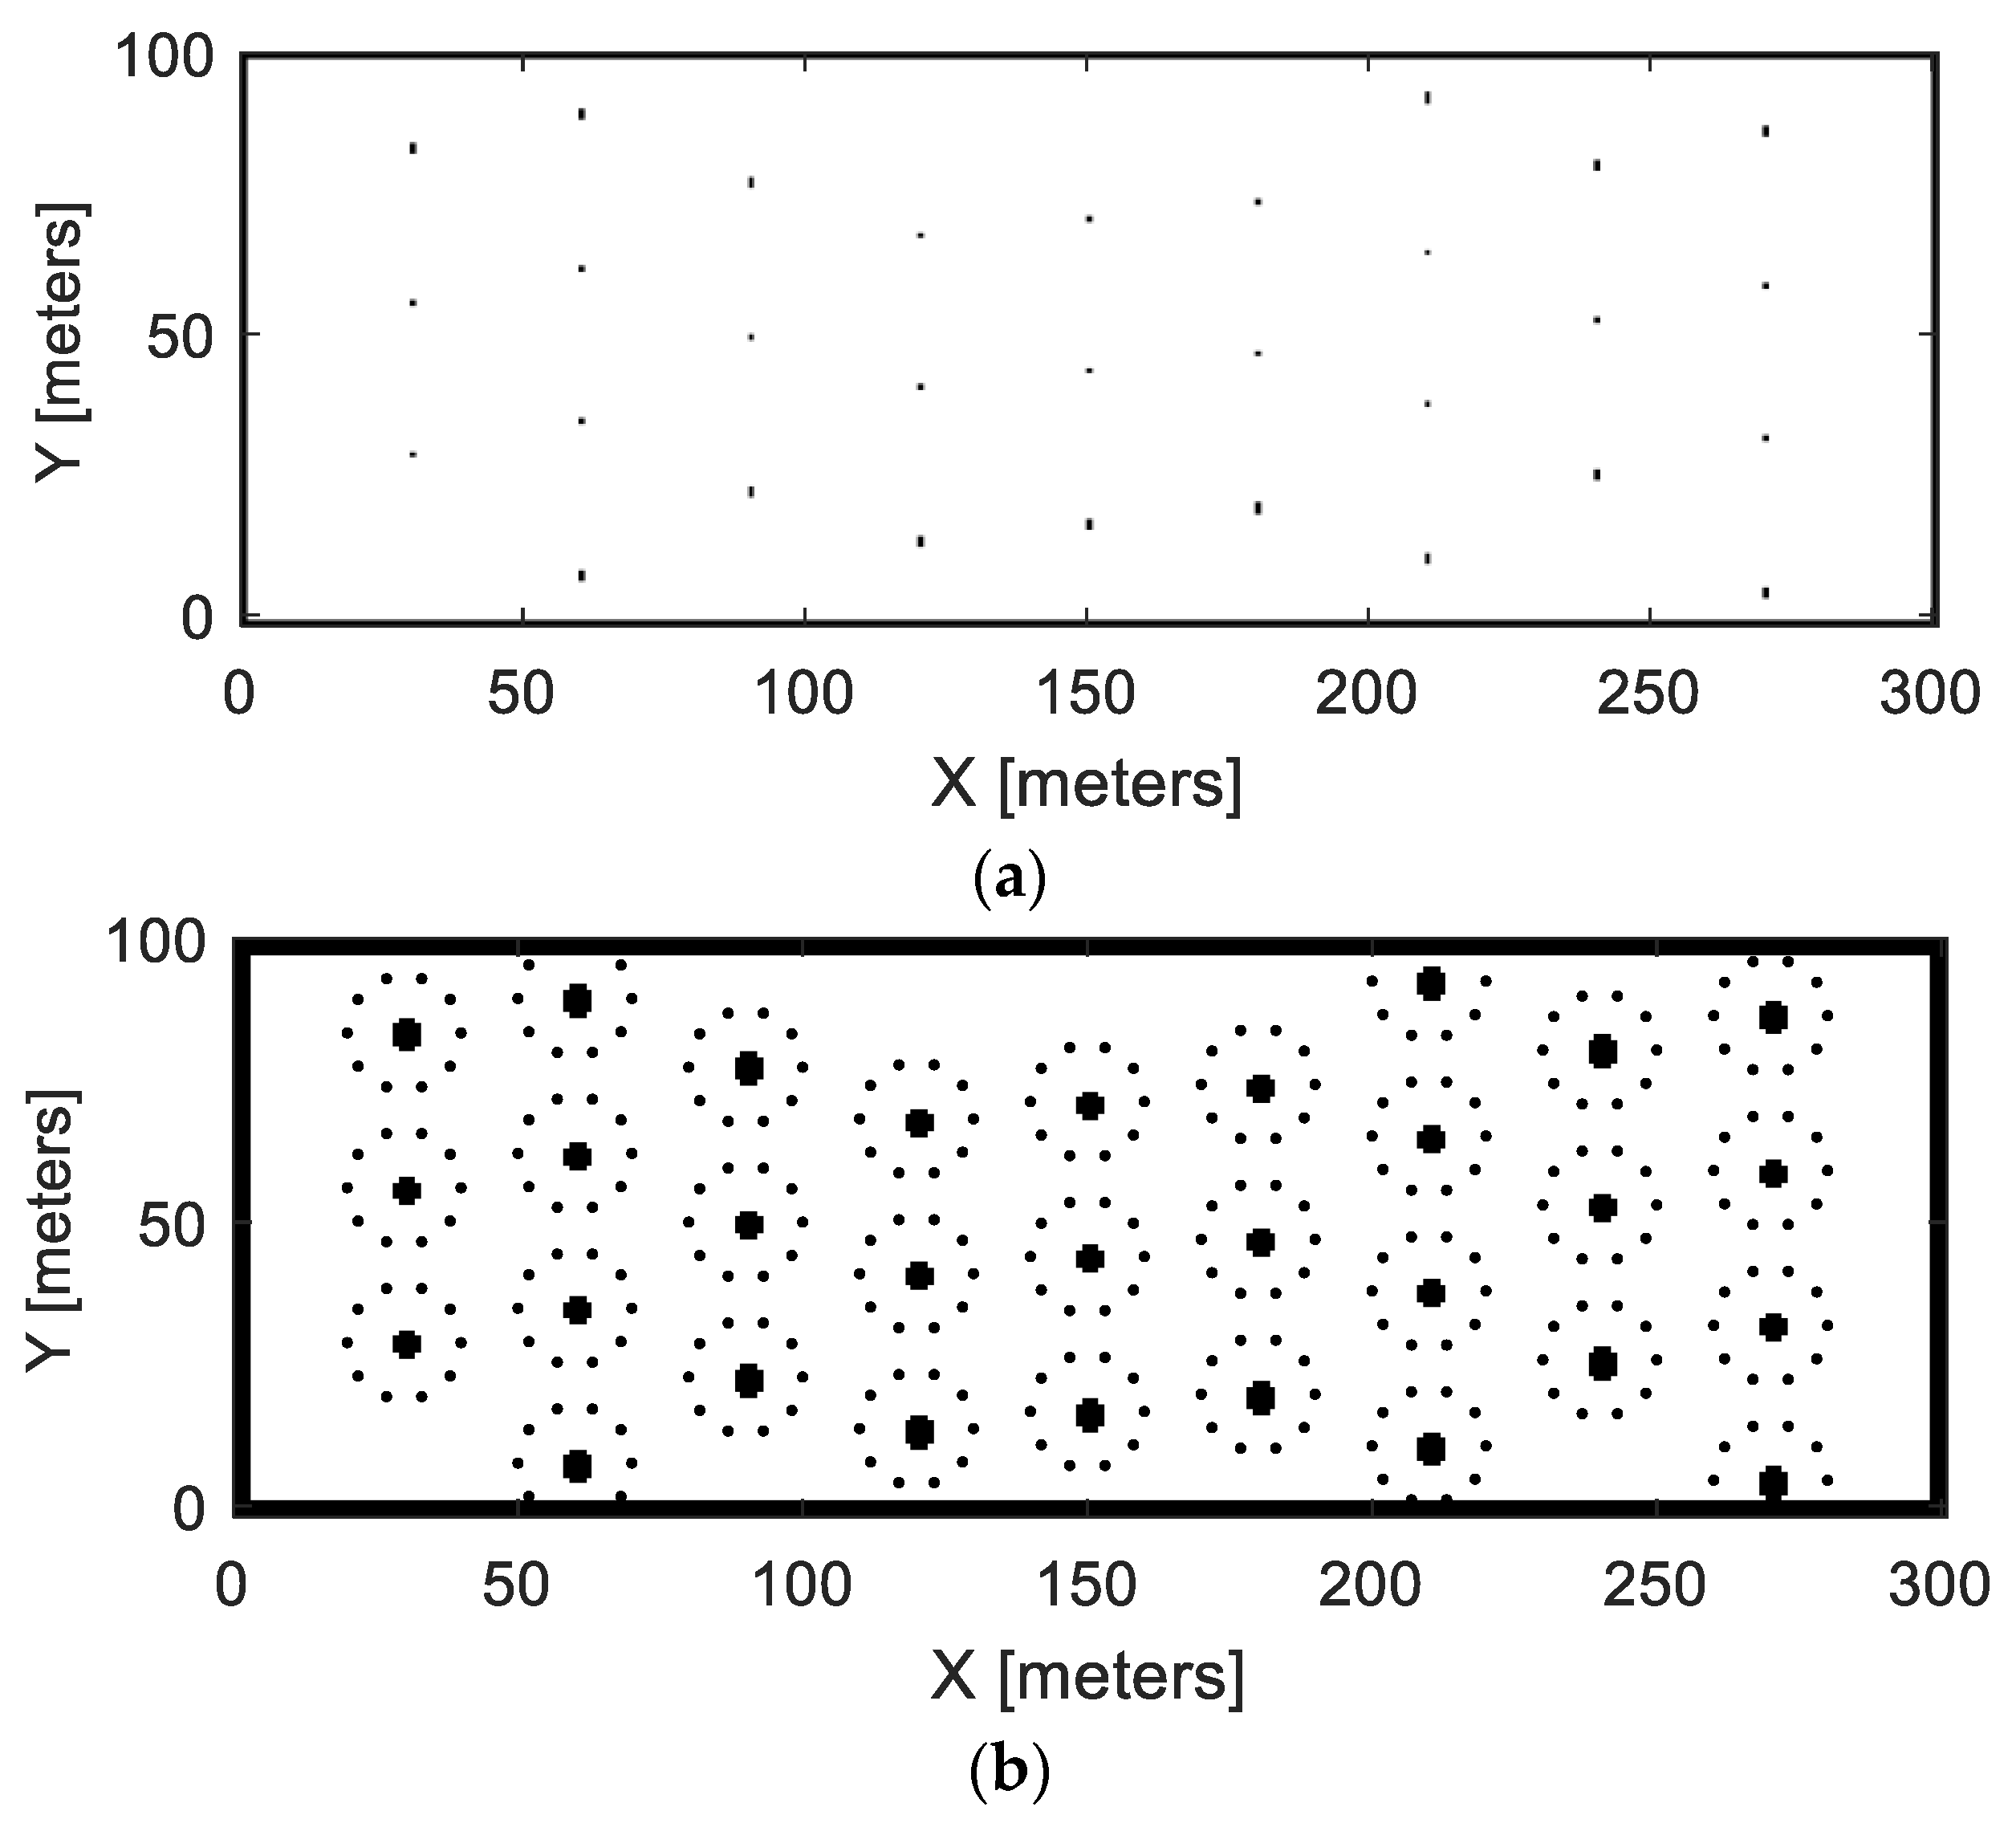
In this research, to investigate the possible effects of field complexity, two different fields were studied. Field 1 (see
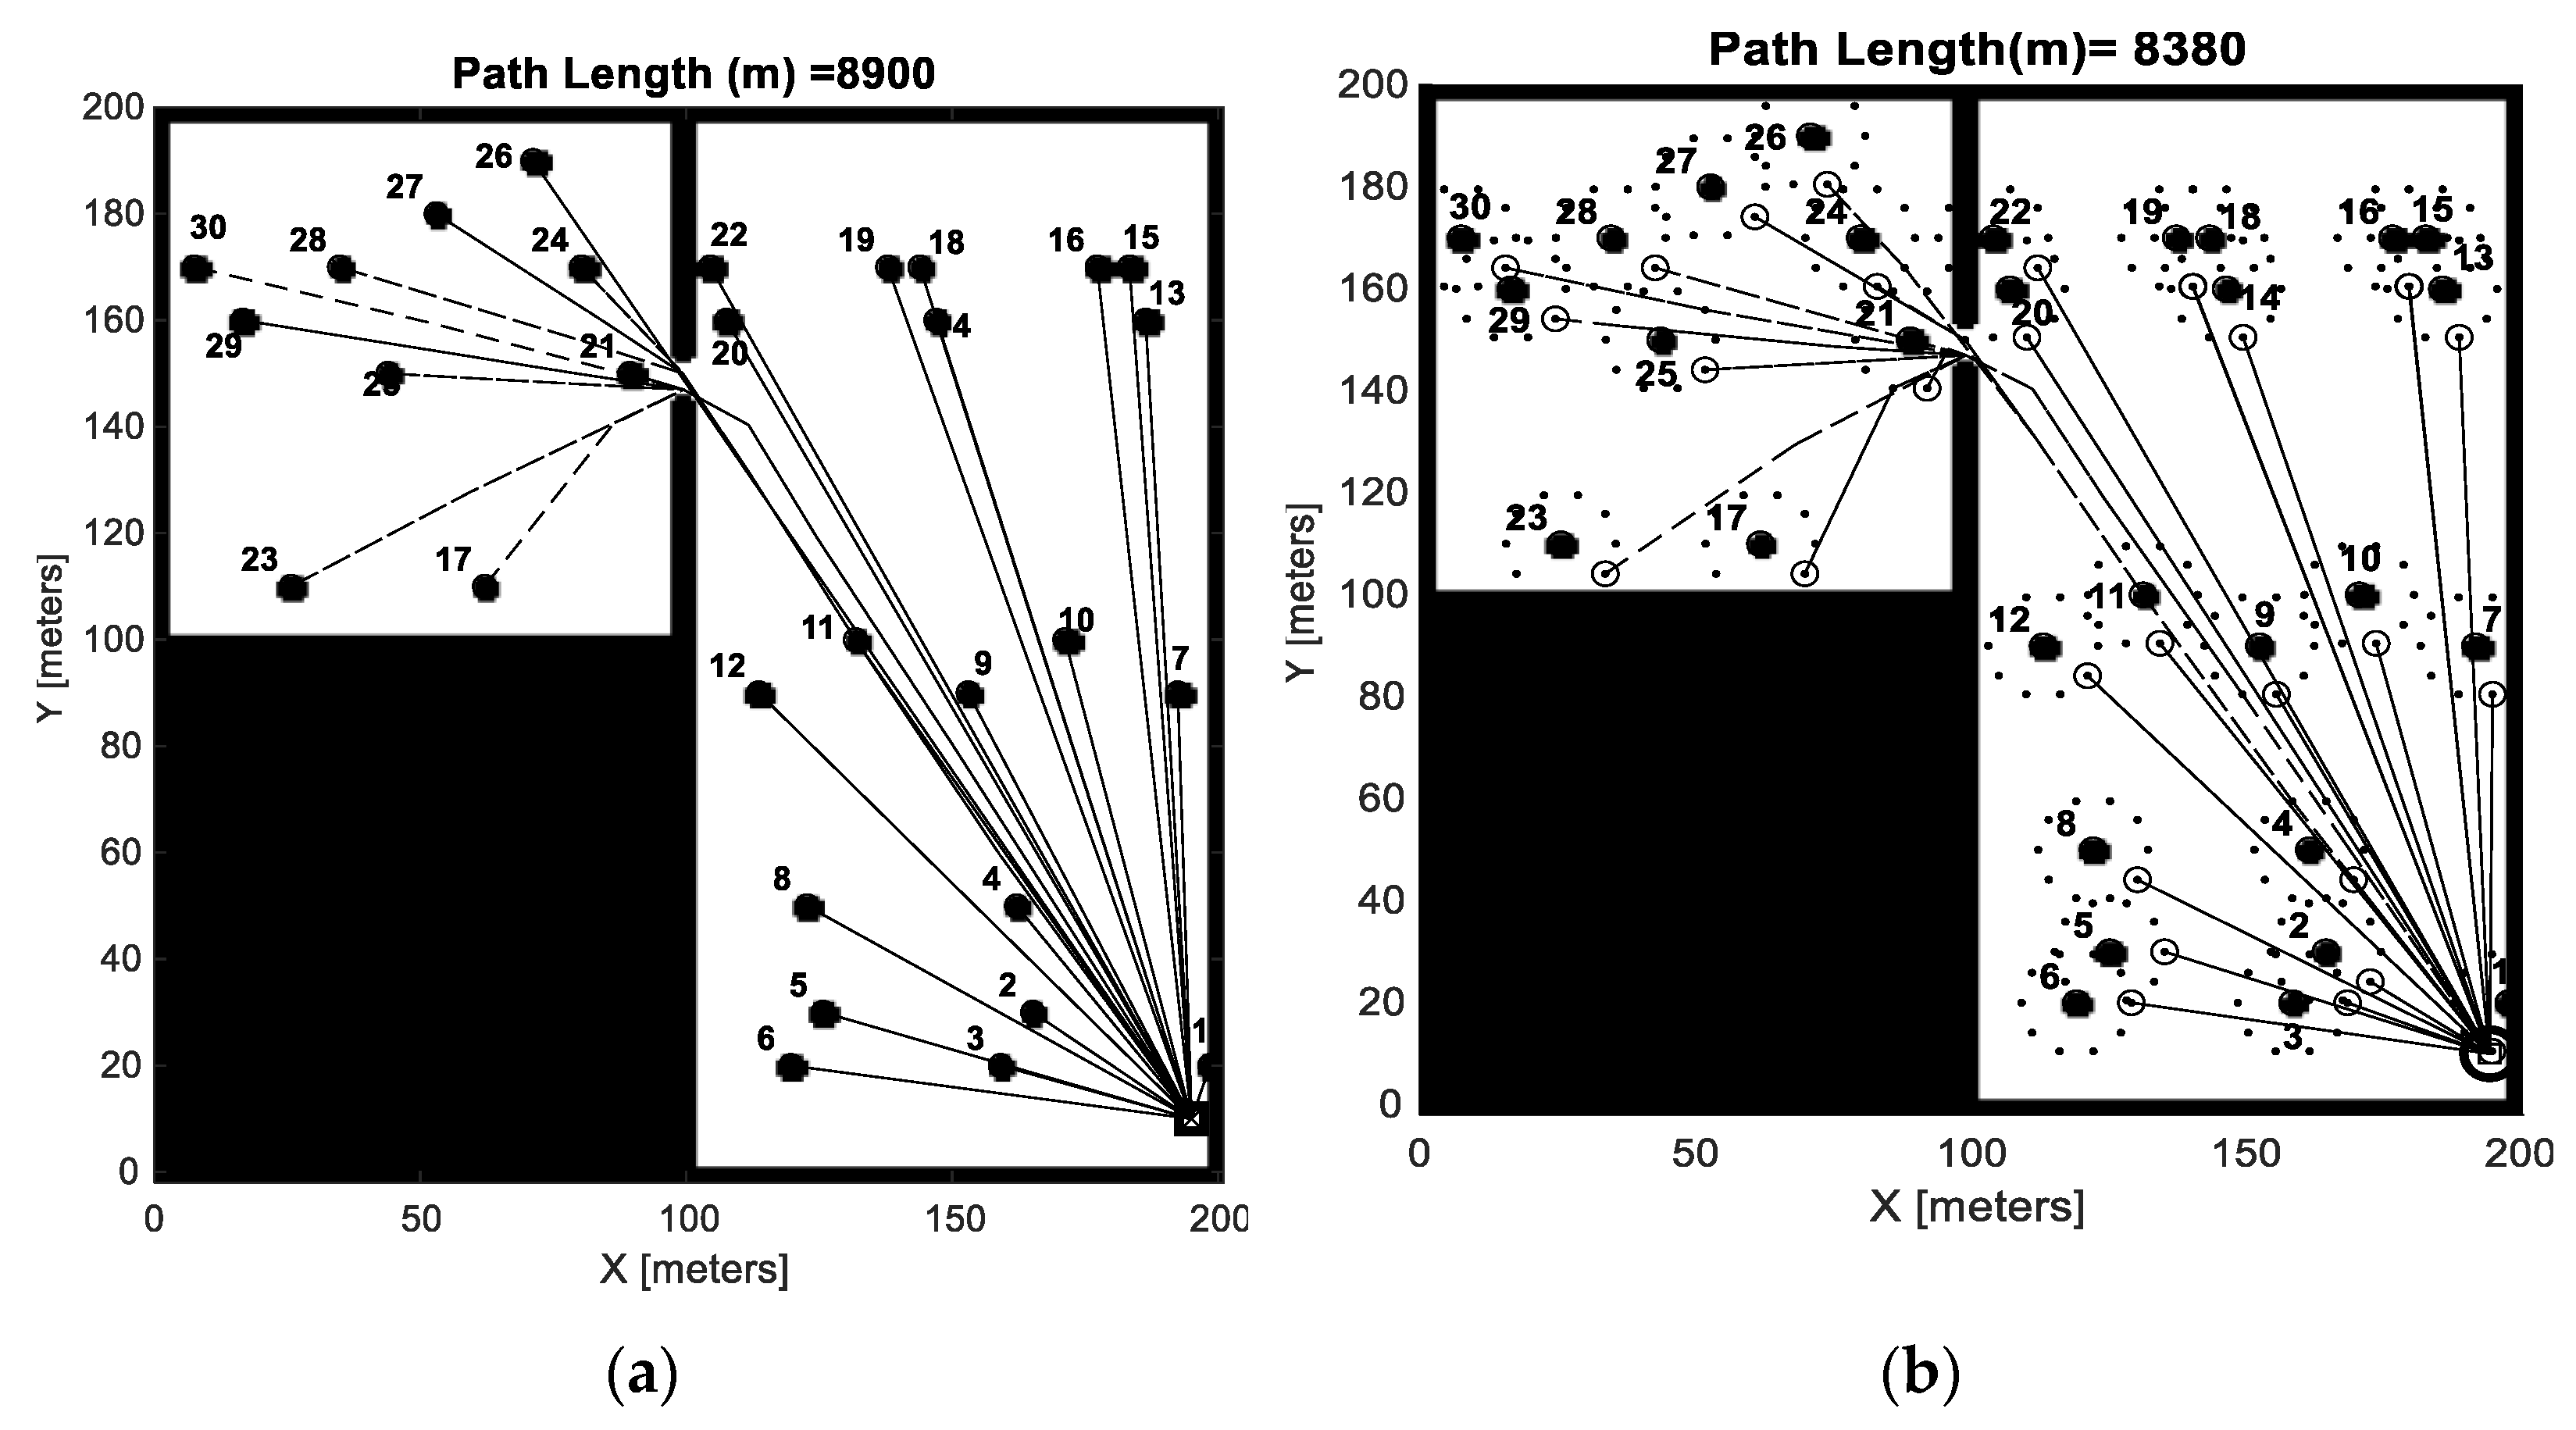
Figure 2) is a rectangular field without any obstacle areas imitating a quite typical environment for bale collection operations. Field 2 (see
Figure 3) on the other hand, is a representation of an irregular more complex agricultural field with obstacle or intrusion areas. For both fields, bales were positioned by calculating the distance, going in straight lines from one end to the other until the whole field was covered, and the harvesting vehicle had collected enough material to form a bale based on the average yield, etc. given in
Table 1.
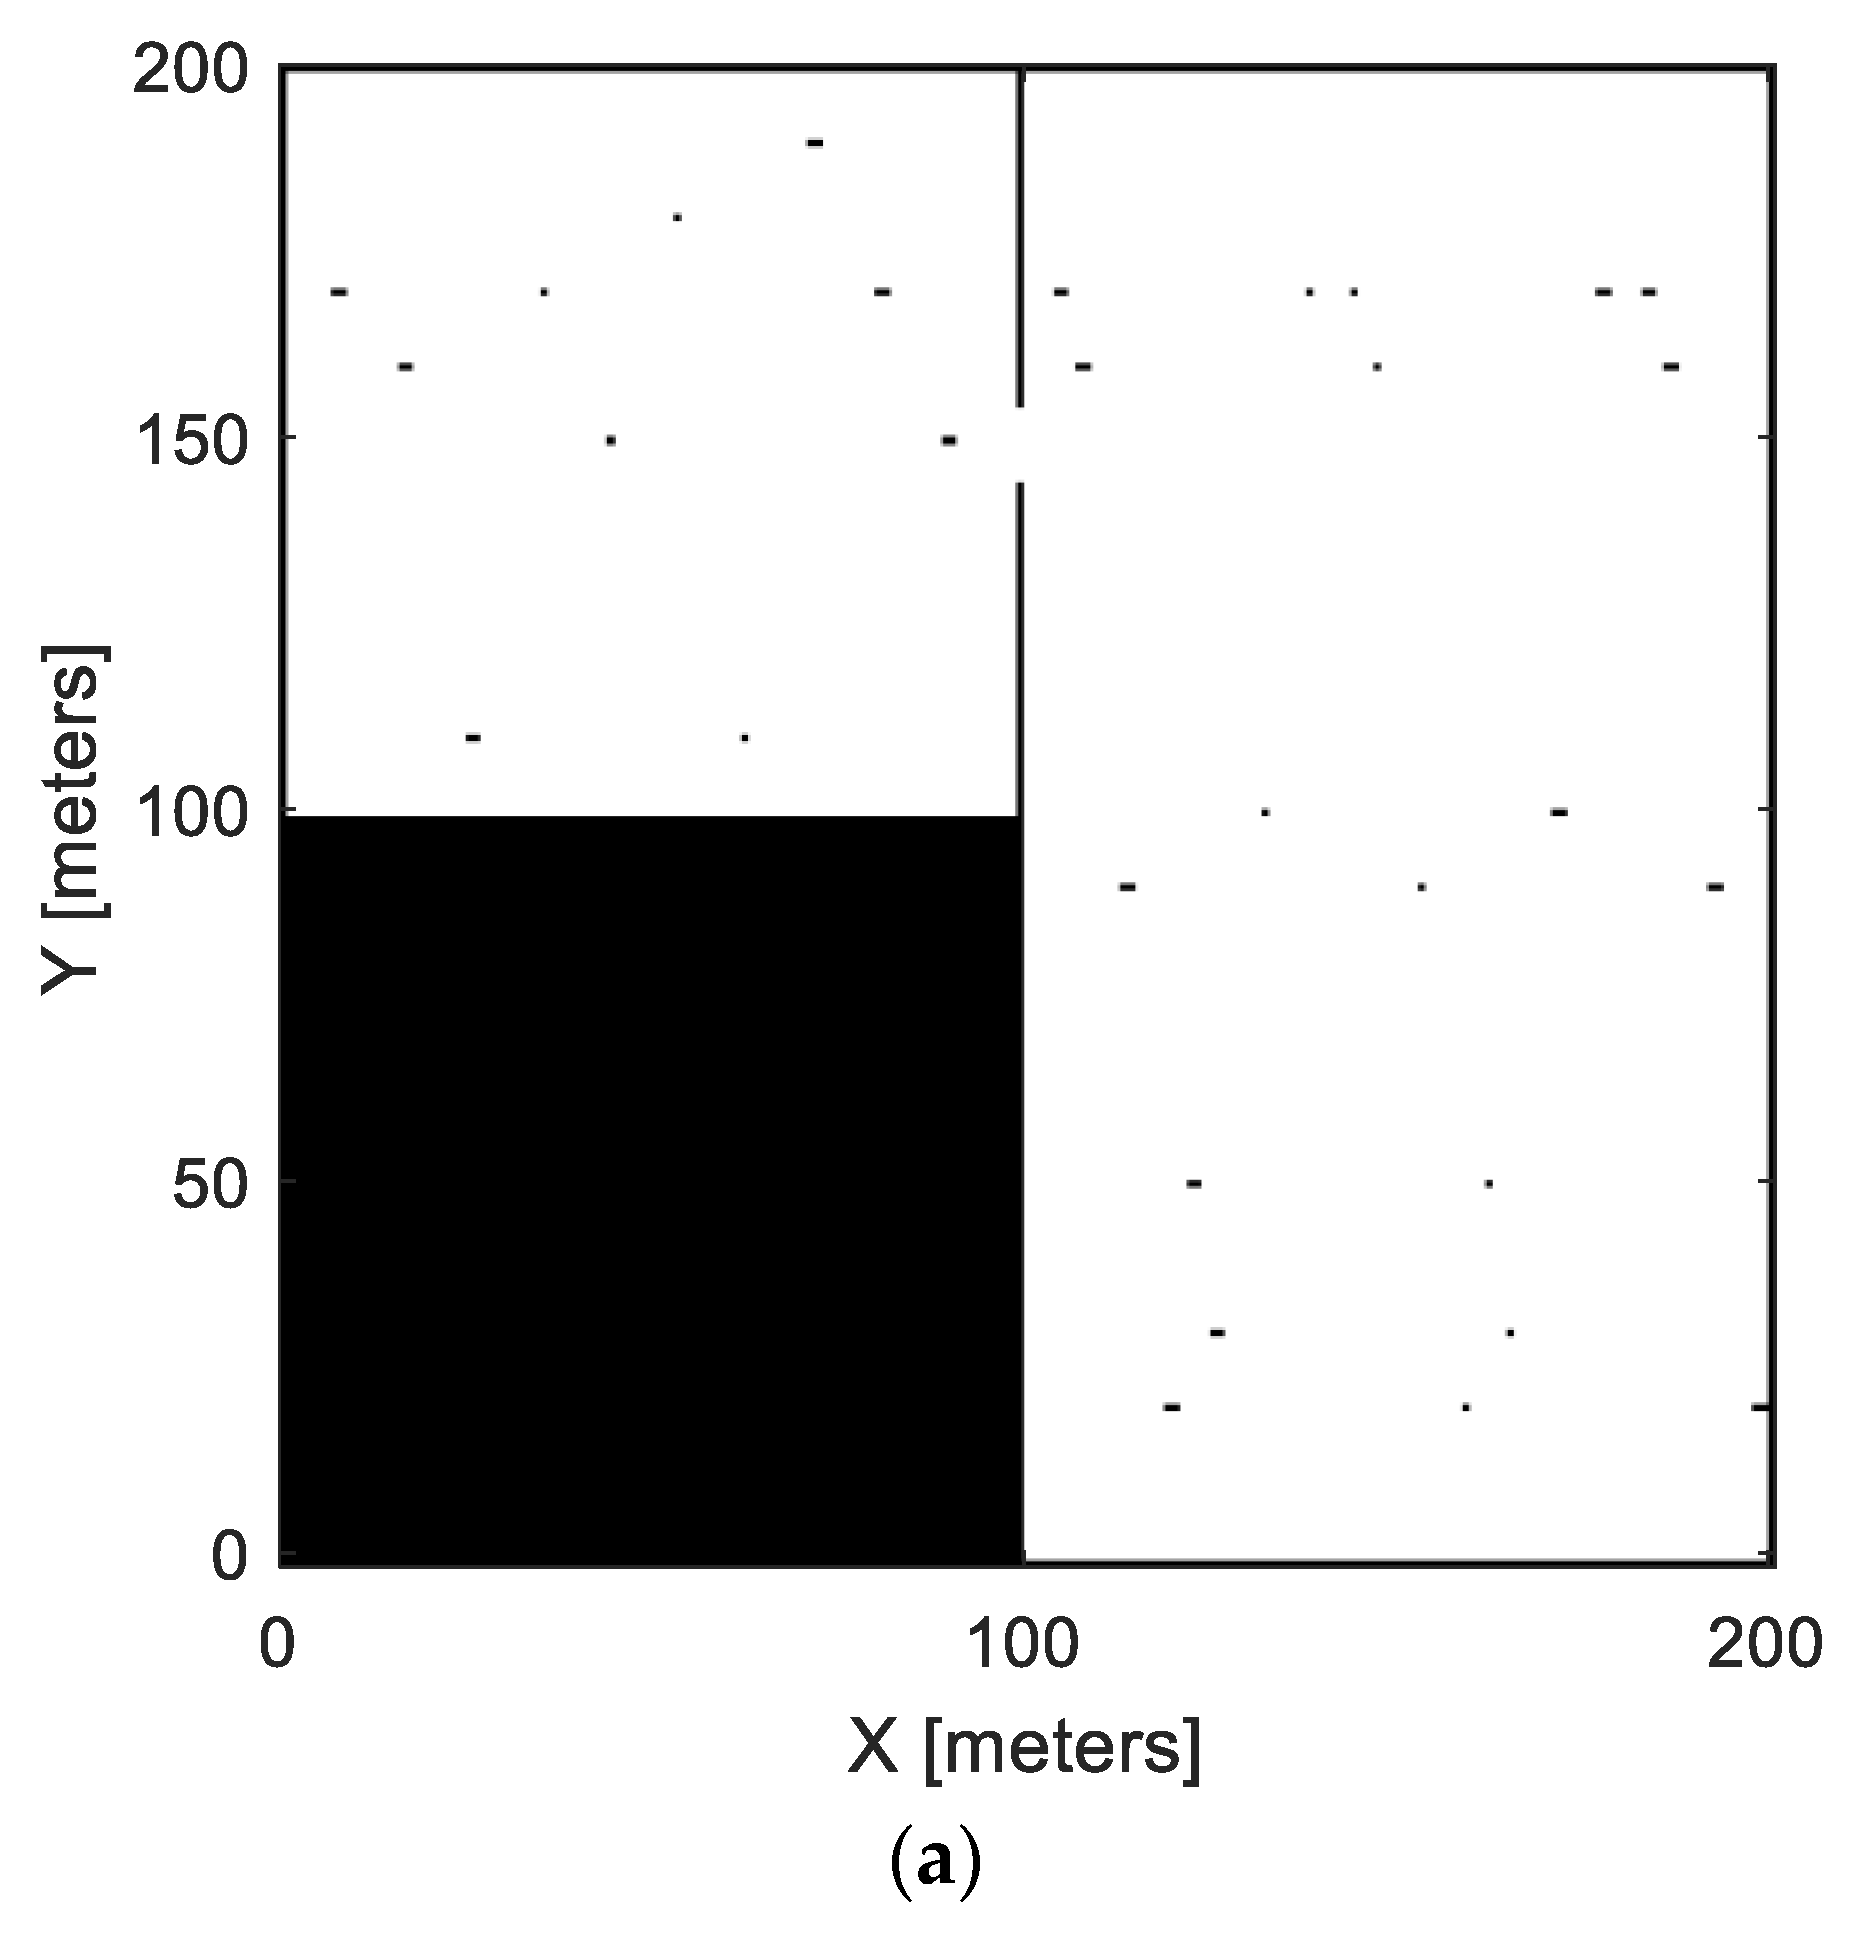
Figure 2a shows the BOM of field 1 where black dots indicates bales occupancy and
Figure 2b shows the inflated BOM of field 1. To reduce the calculation intensity for simulations, only 10 discrete points on each bale collection radius were used, which are represented as black dots surrounding the inflated bales in
Figure 2b.
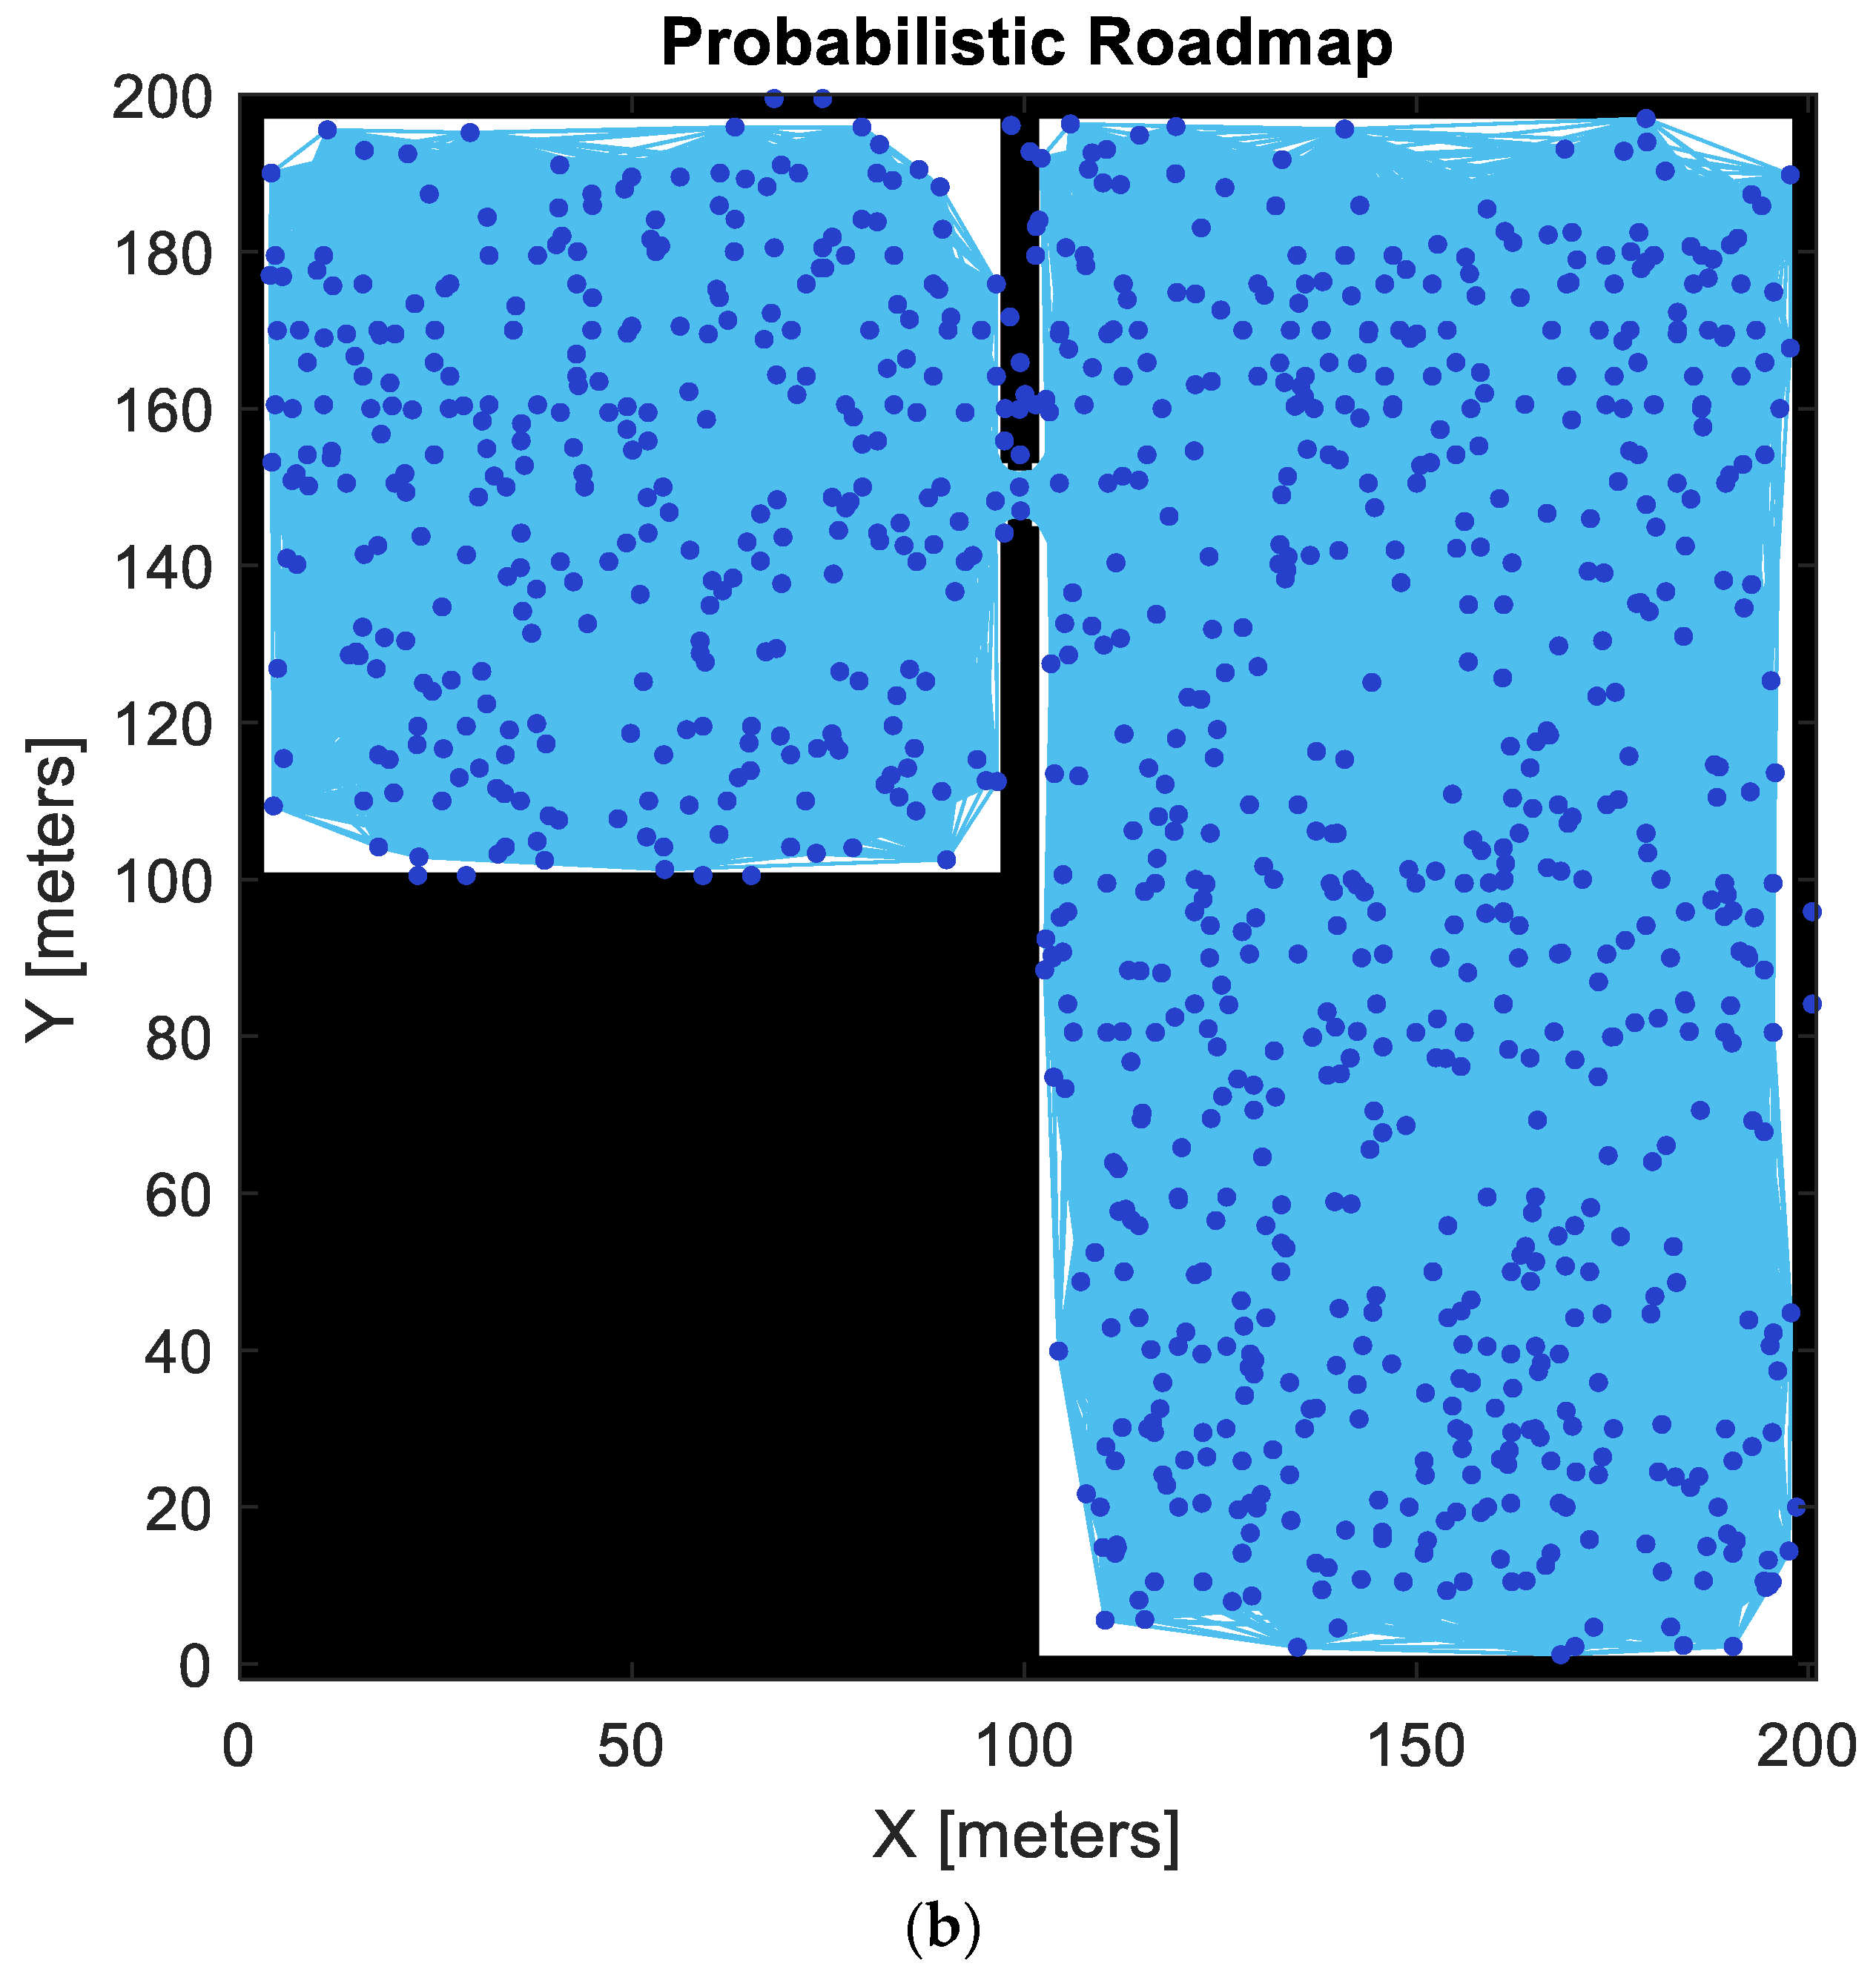
Figure 3a shows the BOM of field 2 where black dots indicates bales occupancy and
Figure 3b shows the inflated BOM of field 2 including the discretized collection points at AVN’s reach radius.
The distance traveled to release a bale can then be calculated through
where
d is the distance required to make one bale by harvester;
HW is the harvester width;
is the average weight of one bale; and
is the average grass yield in a typical season.
represents multiplication operator. Based on the parameters in
Table 1 and Equation (2), bales were released after a travelled distance of around 330 m (some minor adjustments were made if the release position coincided with the boundary of the field).
Binary Occupancy Maps for Field 1 and Field 2
A typical agricultural environment for the bale collection operation was modeled in 2D using binary occupancy maps. Bales are represented as occupied circle areas and once a bale is picked up, it is removed from the BOM. To take the collection vehicle size into consideration, the occupied areas were further inflated in the BOM. In
Table 2, all BOM settings for both fields (simple and complex) are summarized.
Probabilistic Roadmaps
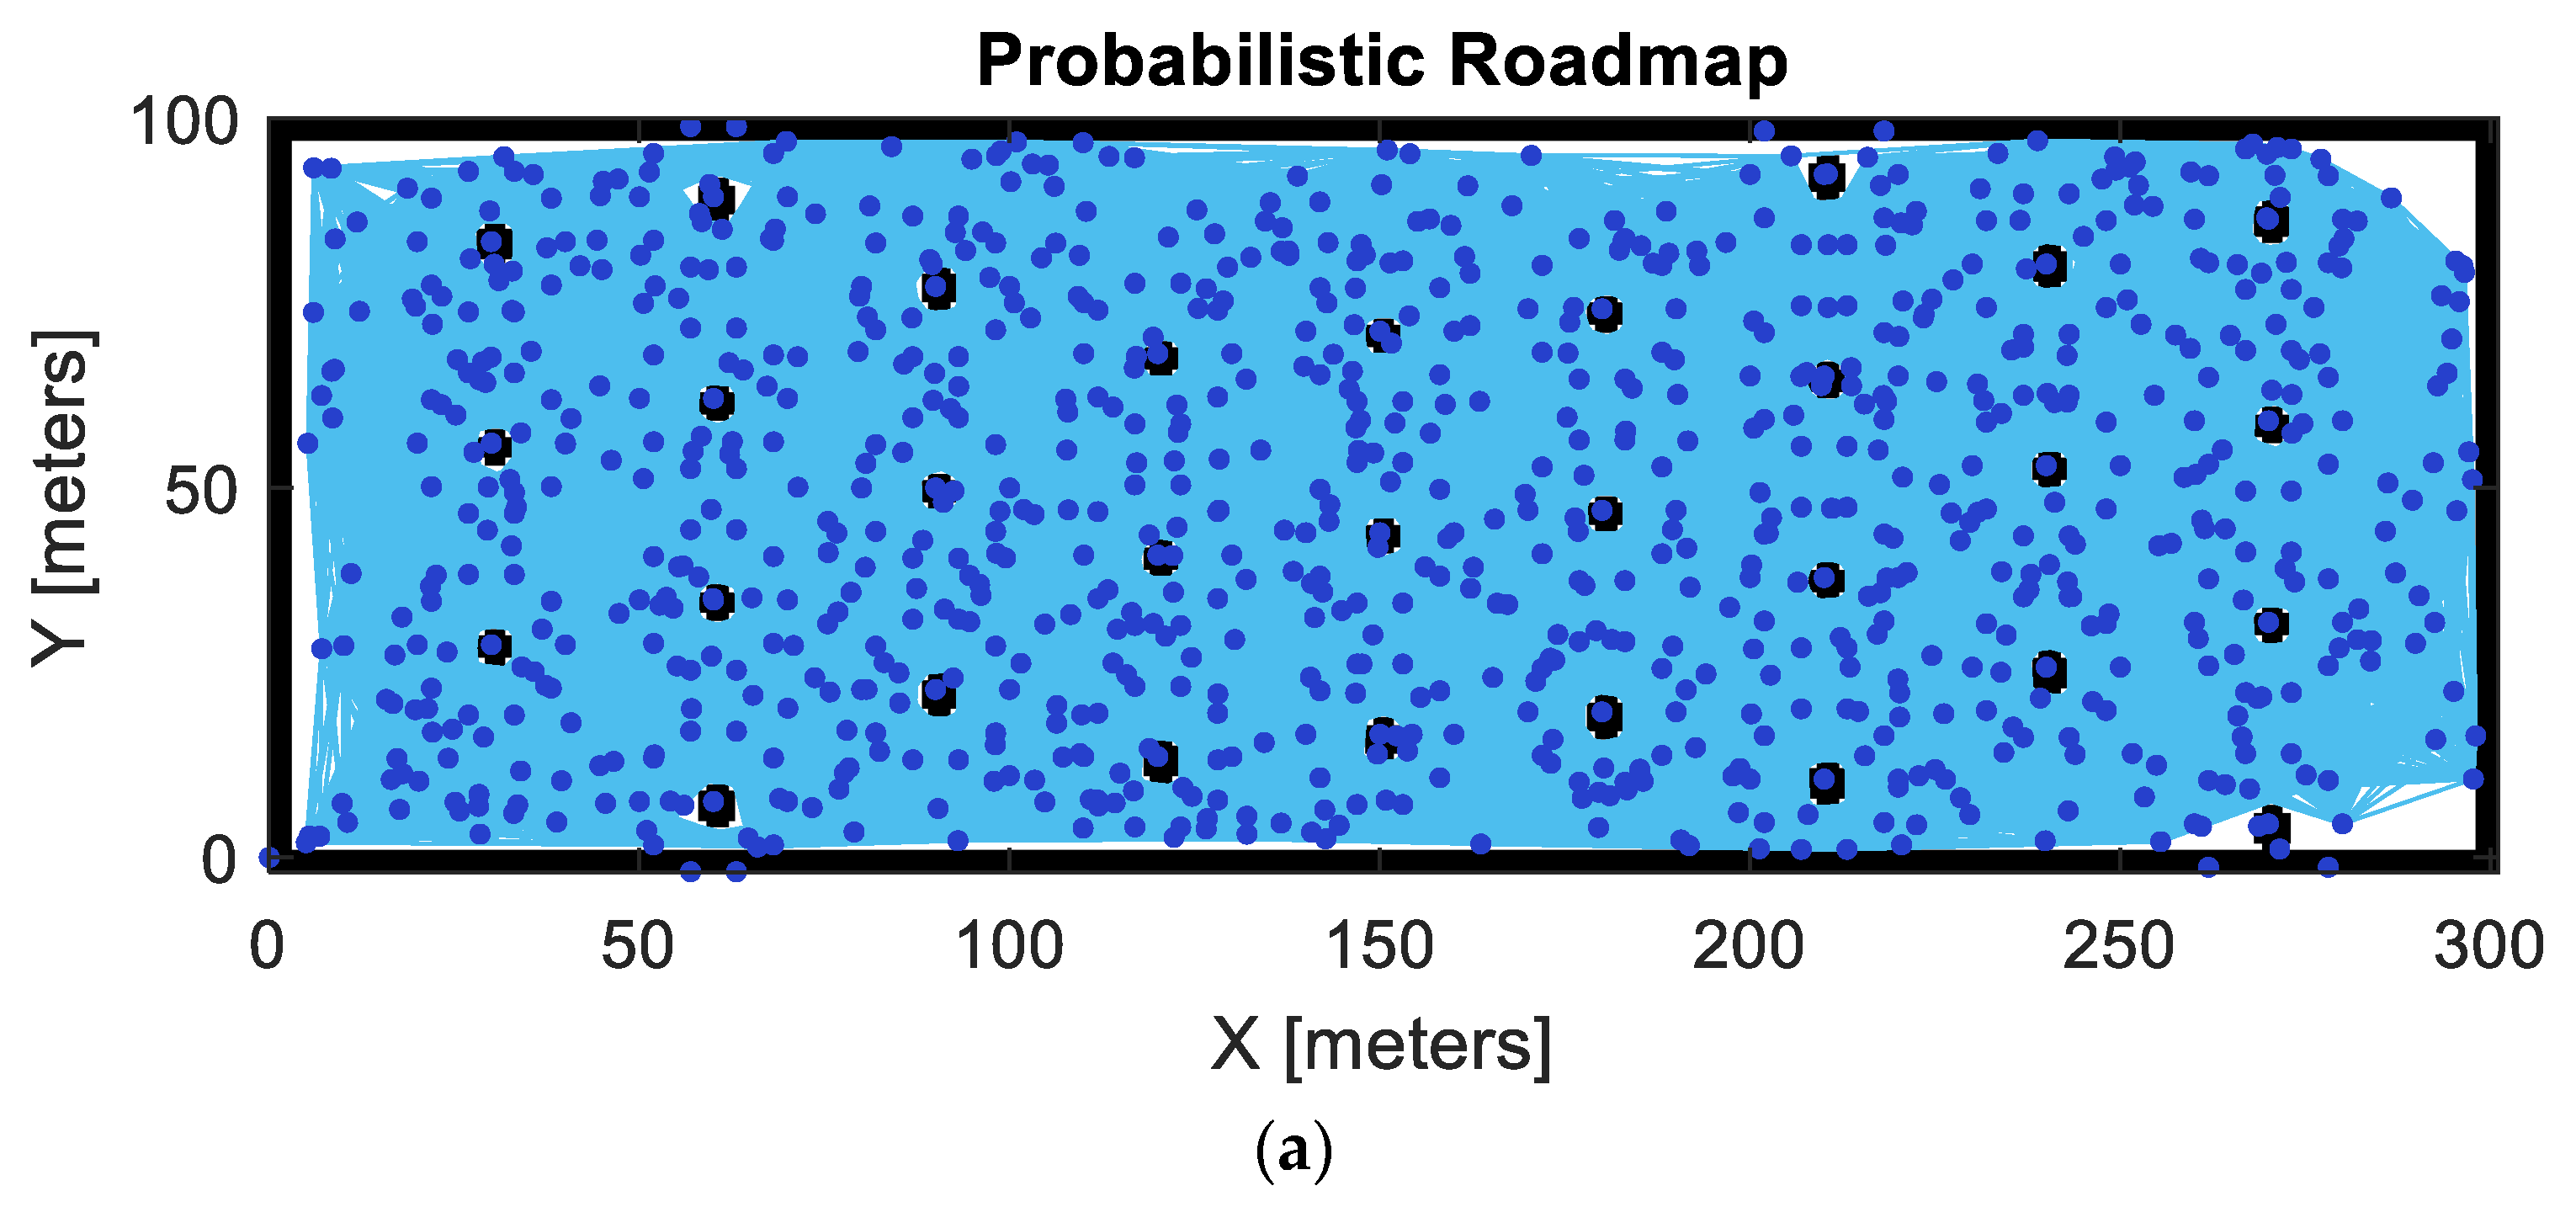
To further reduce the calculation intensity for the GA-simulations, static PRM was used (stationary nodes and connection lines) to generate the collision free paths. The same number of nodes and connection distance was used for both fields and the chosen PRM parameters are given in
Table 3.
The quality of the PRM depends on the number of nodes and connection distance and also impacts the calculation intensity. For this study, 1000 nodes and 50 m in connection distance was evaluated as a suitable trade-off.
The “bale storage position, pick-up positions (also bale positions for traditional pick-up vehicle), start- and end position of the vehicle” were pre-defined nodes and then another 1000 randomly generated nodes were added. PRMs for both fields were kept fixed, despite the changes in map (e.g., when bales are picked up) to speed up the computation. However, PRM connection lines did not cross the bale areas even after being removed.
Figure 4 shows the PRM for field 1 (a) and field 2 (b).
2.2. Bales Collection Path Approaches
Two approaches to generate the bale collection paths were studied. The idea was to imitate the bale collection approach of a farmer and compare it to a bale collection approach based on optimization.
2.2.1. Nearest Neighbor Approach
One way of imitating how farmers collect bales, which was used for this study, is through the nearest neighbor approach. It was here assumed that a farmer will choose the nearest bales from its current position and then continue collecting one by one based on proximity. In the case of a traditional collection vehicle, the bale center is used as the collection position. On the other hand, for the AVN, the nearest bale is first derived and then the collection point around the bale that is closest to the Euclidian vector from the previous collection position to the current nearest bale center is derived. A straight-line path is used if no obstacles are intersected, otherwise a collision free path based on PRM is derived. This approach uses the MATLAB© built-in nearest neighbor search algorithm based on Euclidean distance between the set of points in free space. In case when there are obstacles in the space, it may result in false positive in comparison to the farmers’ visual judgment in a real situation.
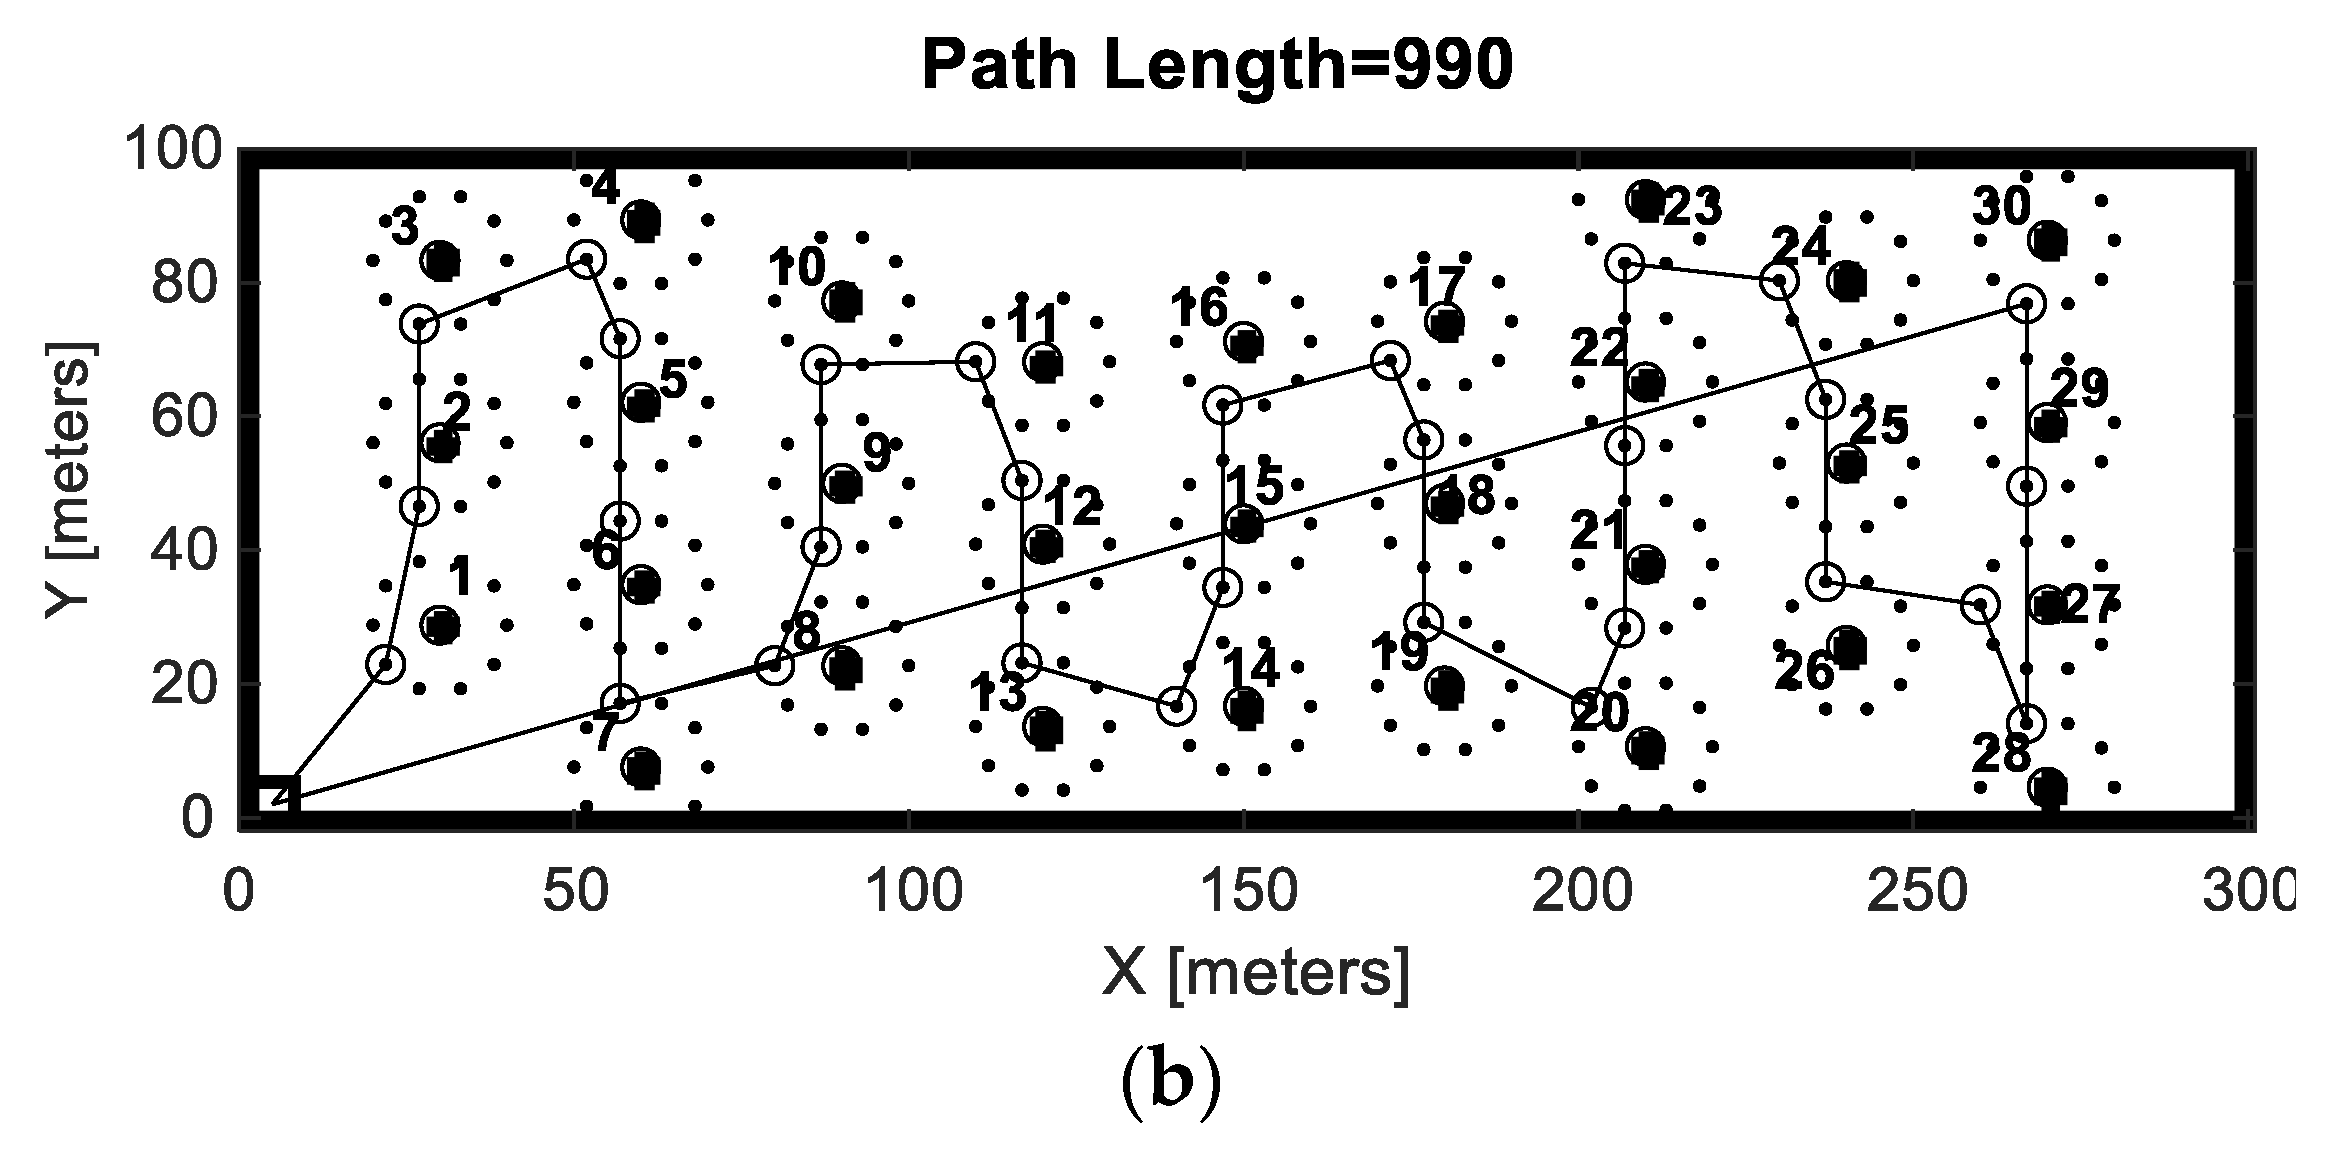
2.2.2. Optimization Approach
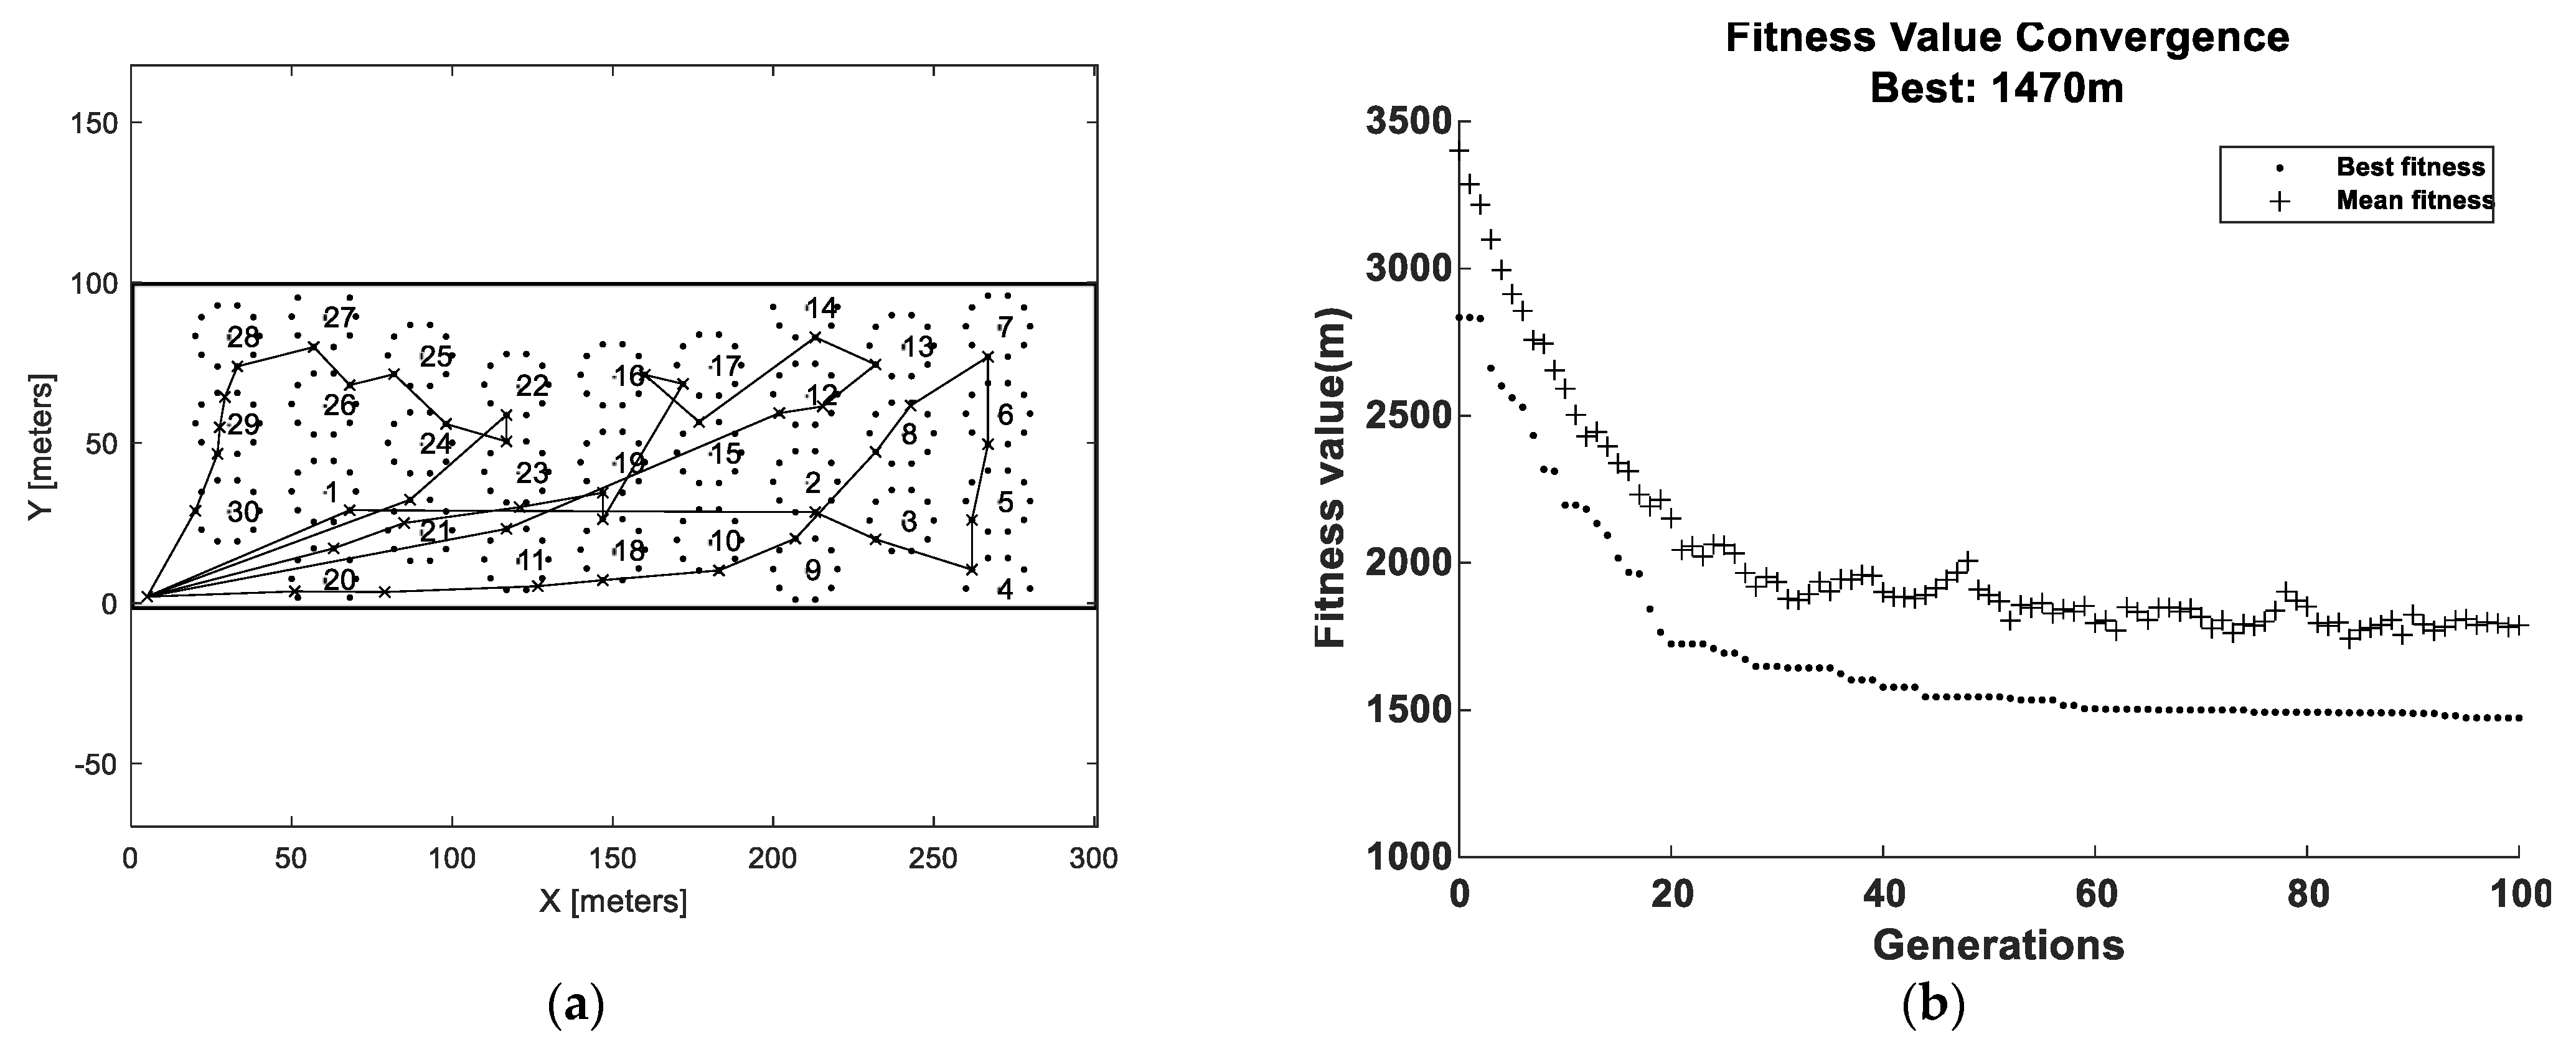
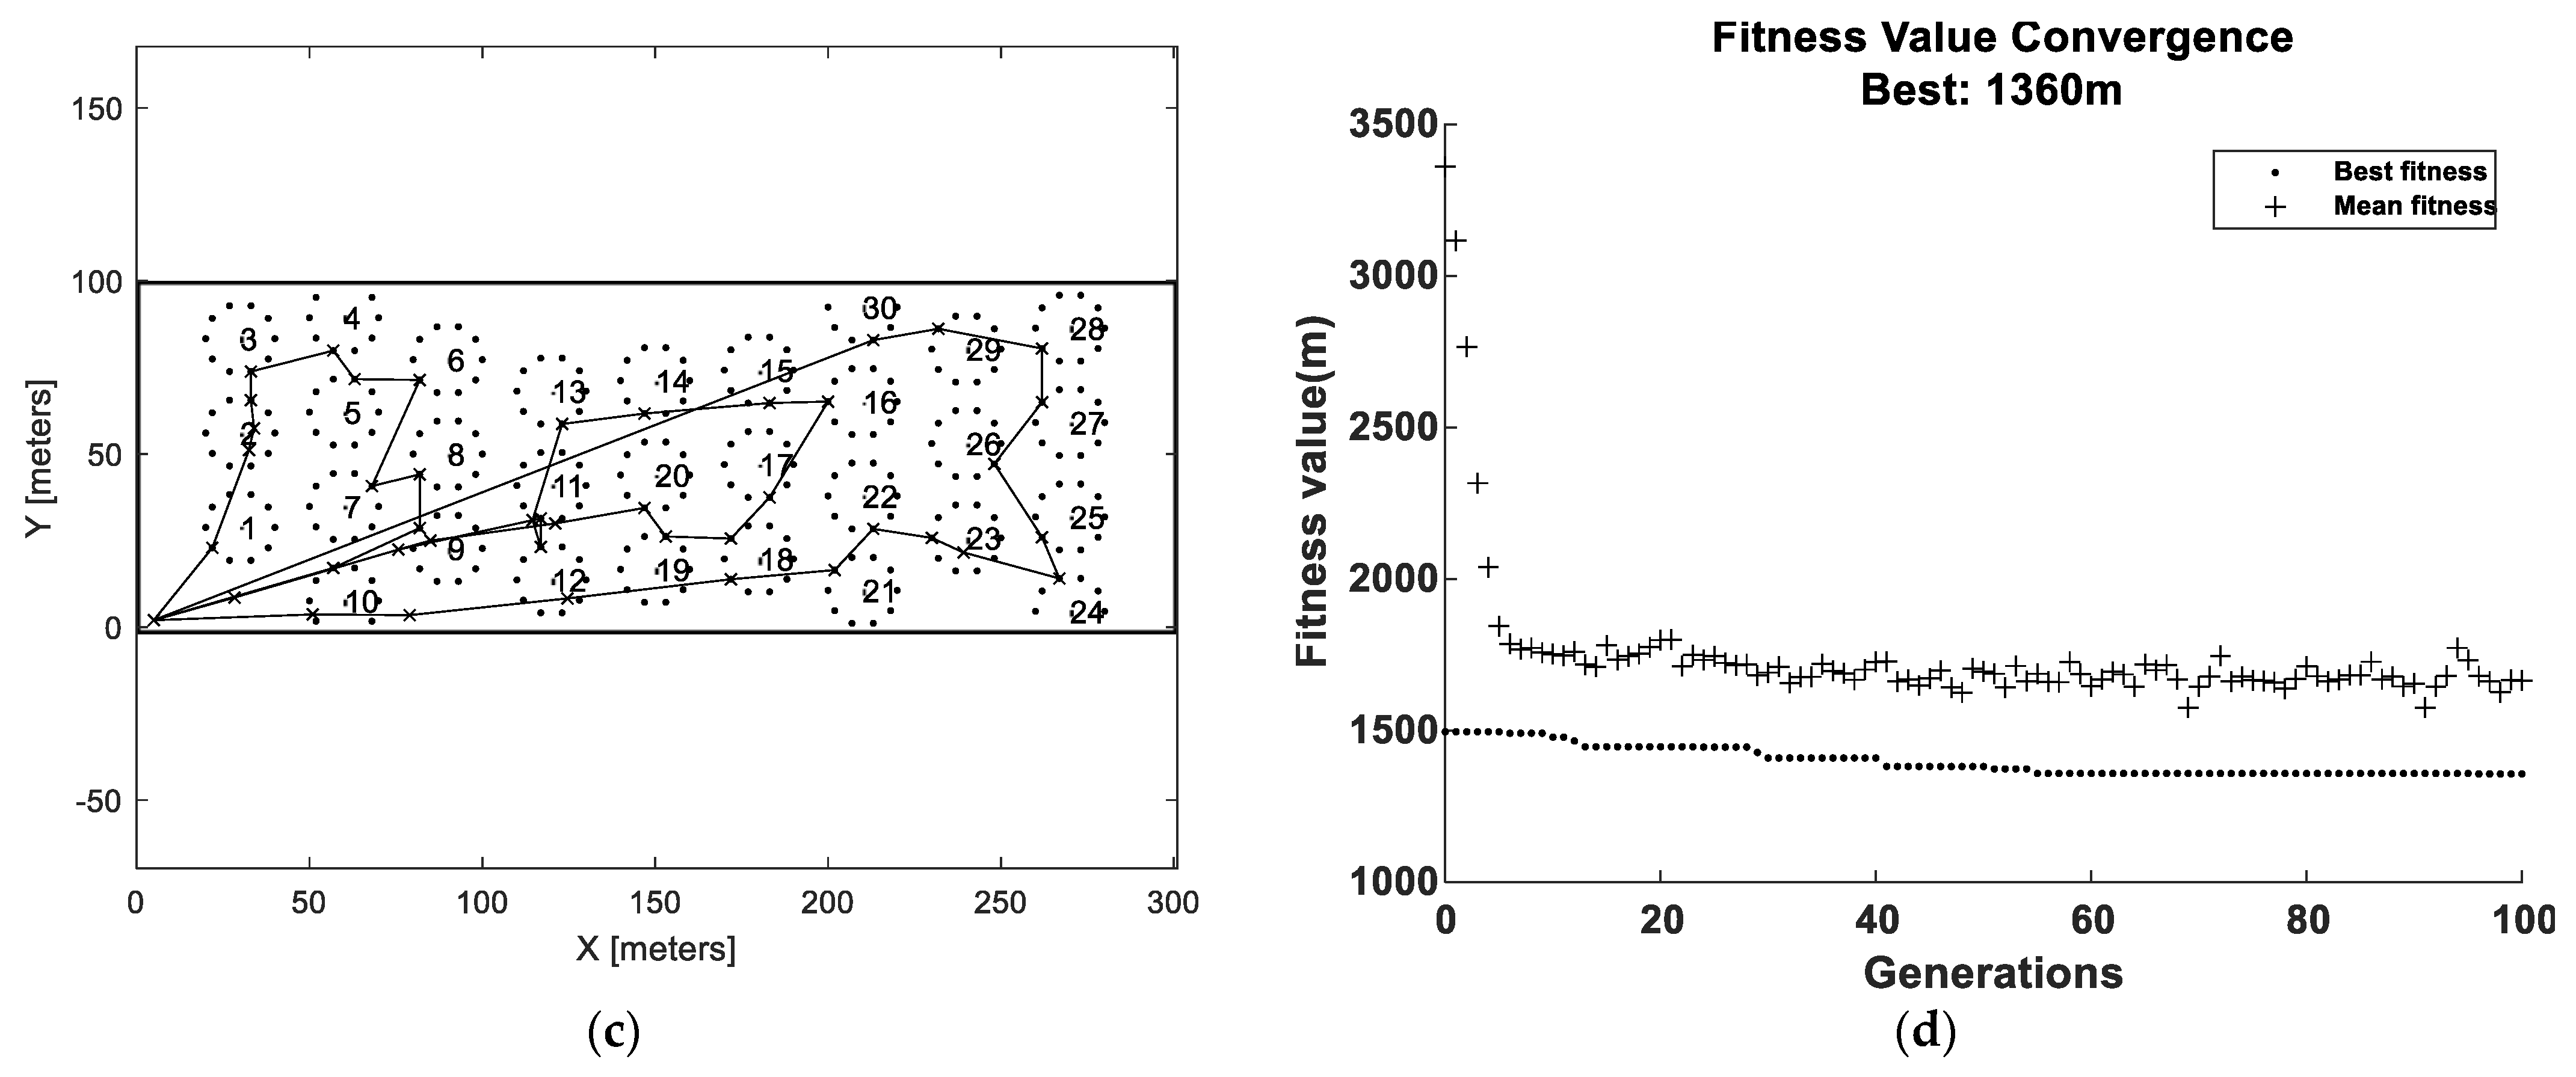
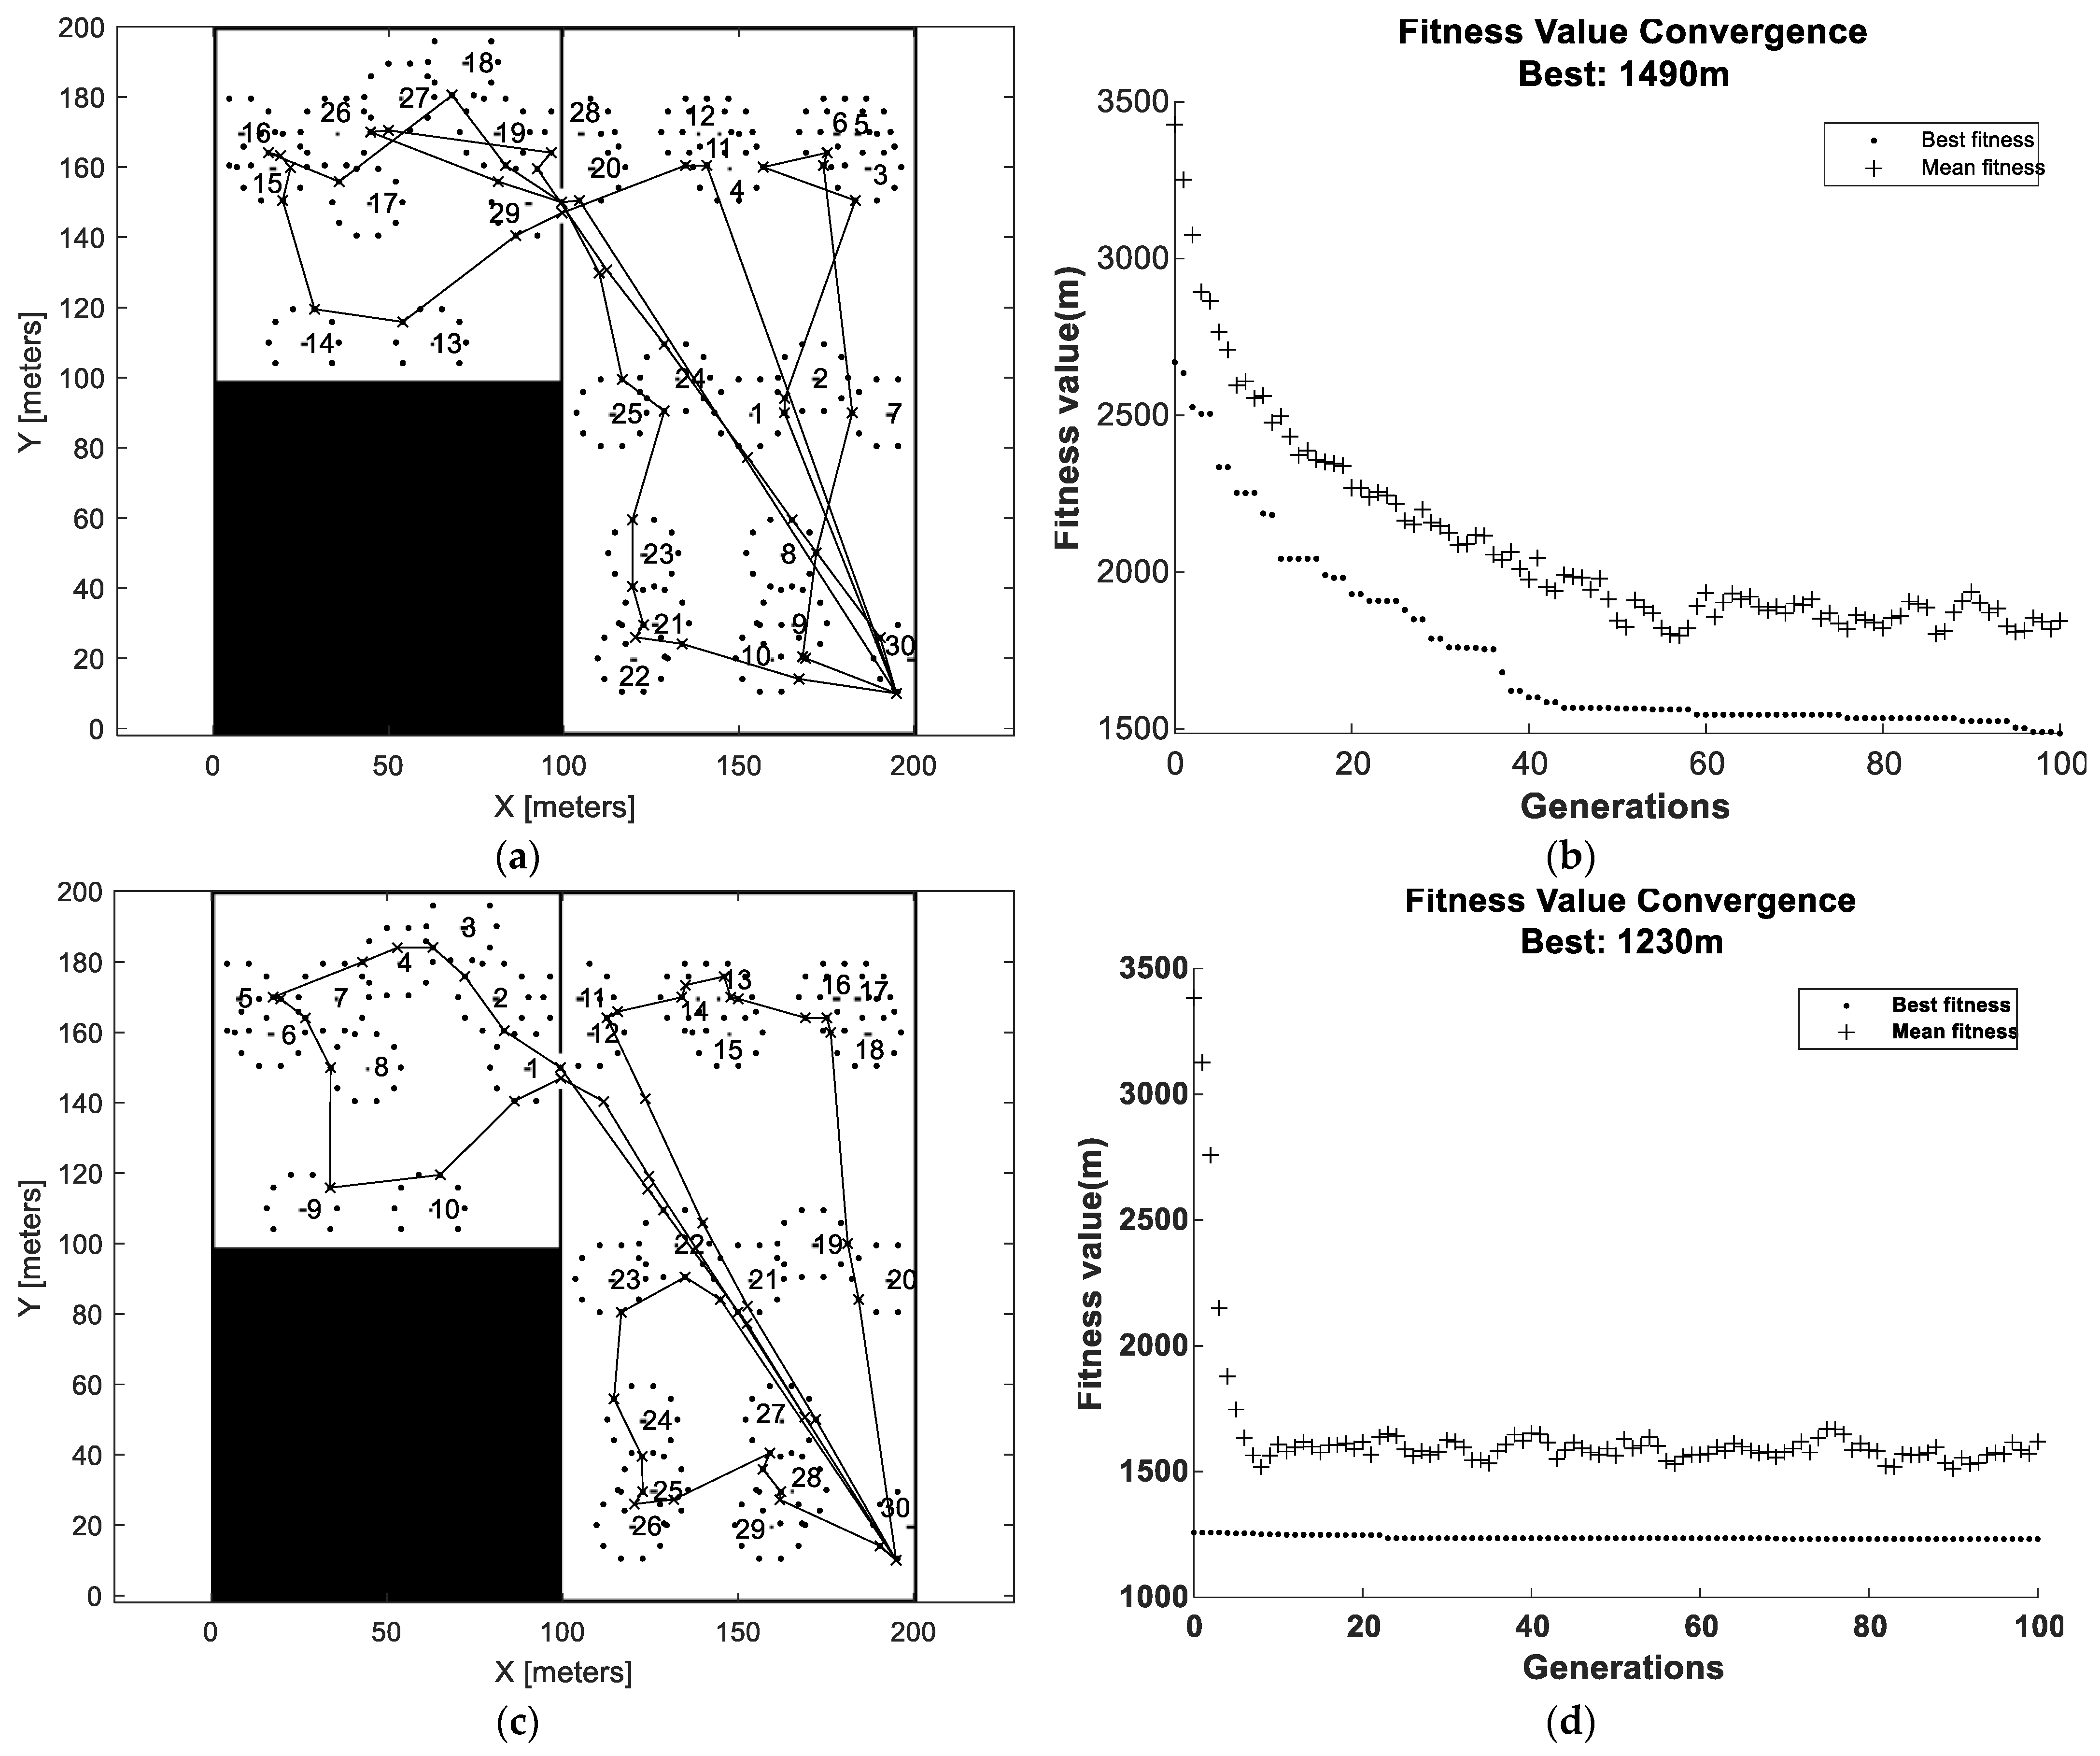
Optimization of the total distance travelled (fitness function) was carried out by use of a GA, which has good performance on finding the global optimum, has possibilities for parallelization, and can be applied to various types of problems. However, GA can become very calculation intensive and therefore, a lot of emphasis has been spent on simplifications, making each iteration as fast as possible.
Since the notion of an agricultural vehicle (see
Figure 1) with neighborhood collection capability is used for this study, bales were collected not only in a certain order, but also from a point on a circle with a certain radius (corresponding to the crane length) surrounding the bales. Thus, a traveling solution is defined by a collection order and a set of points on the collection circumference (i.e., collection angles). Since the collection order is a permutation while collection angles are a set of constrained real numbers between 0 and 2
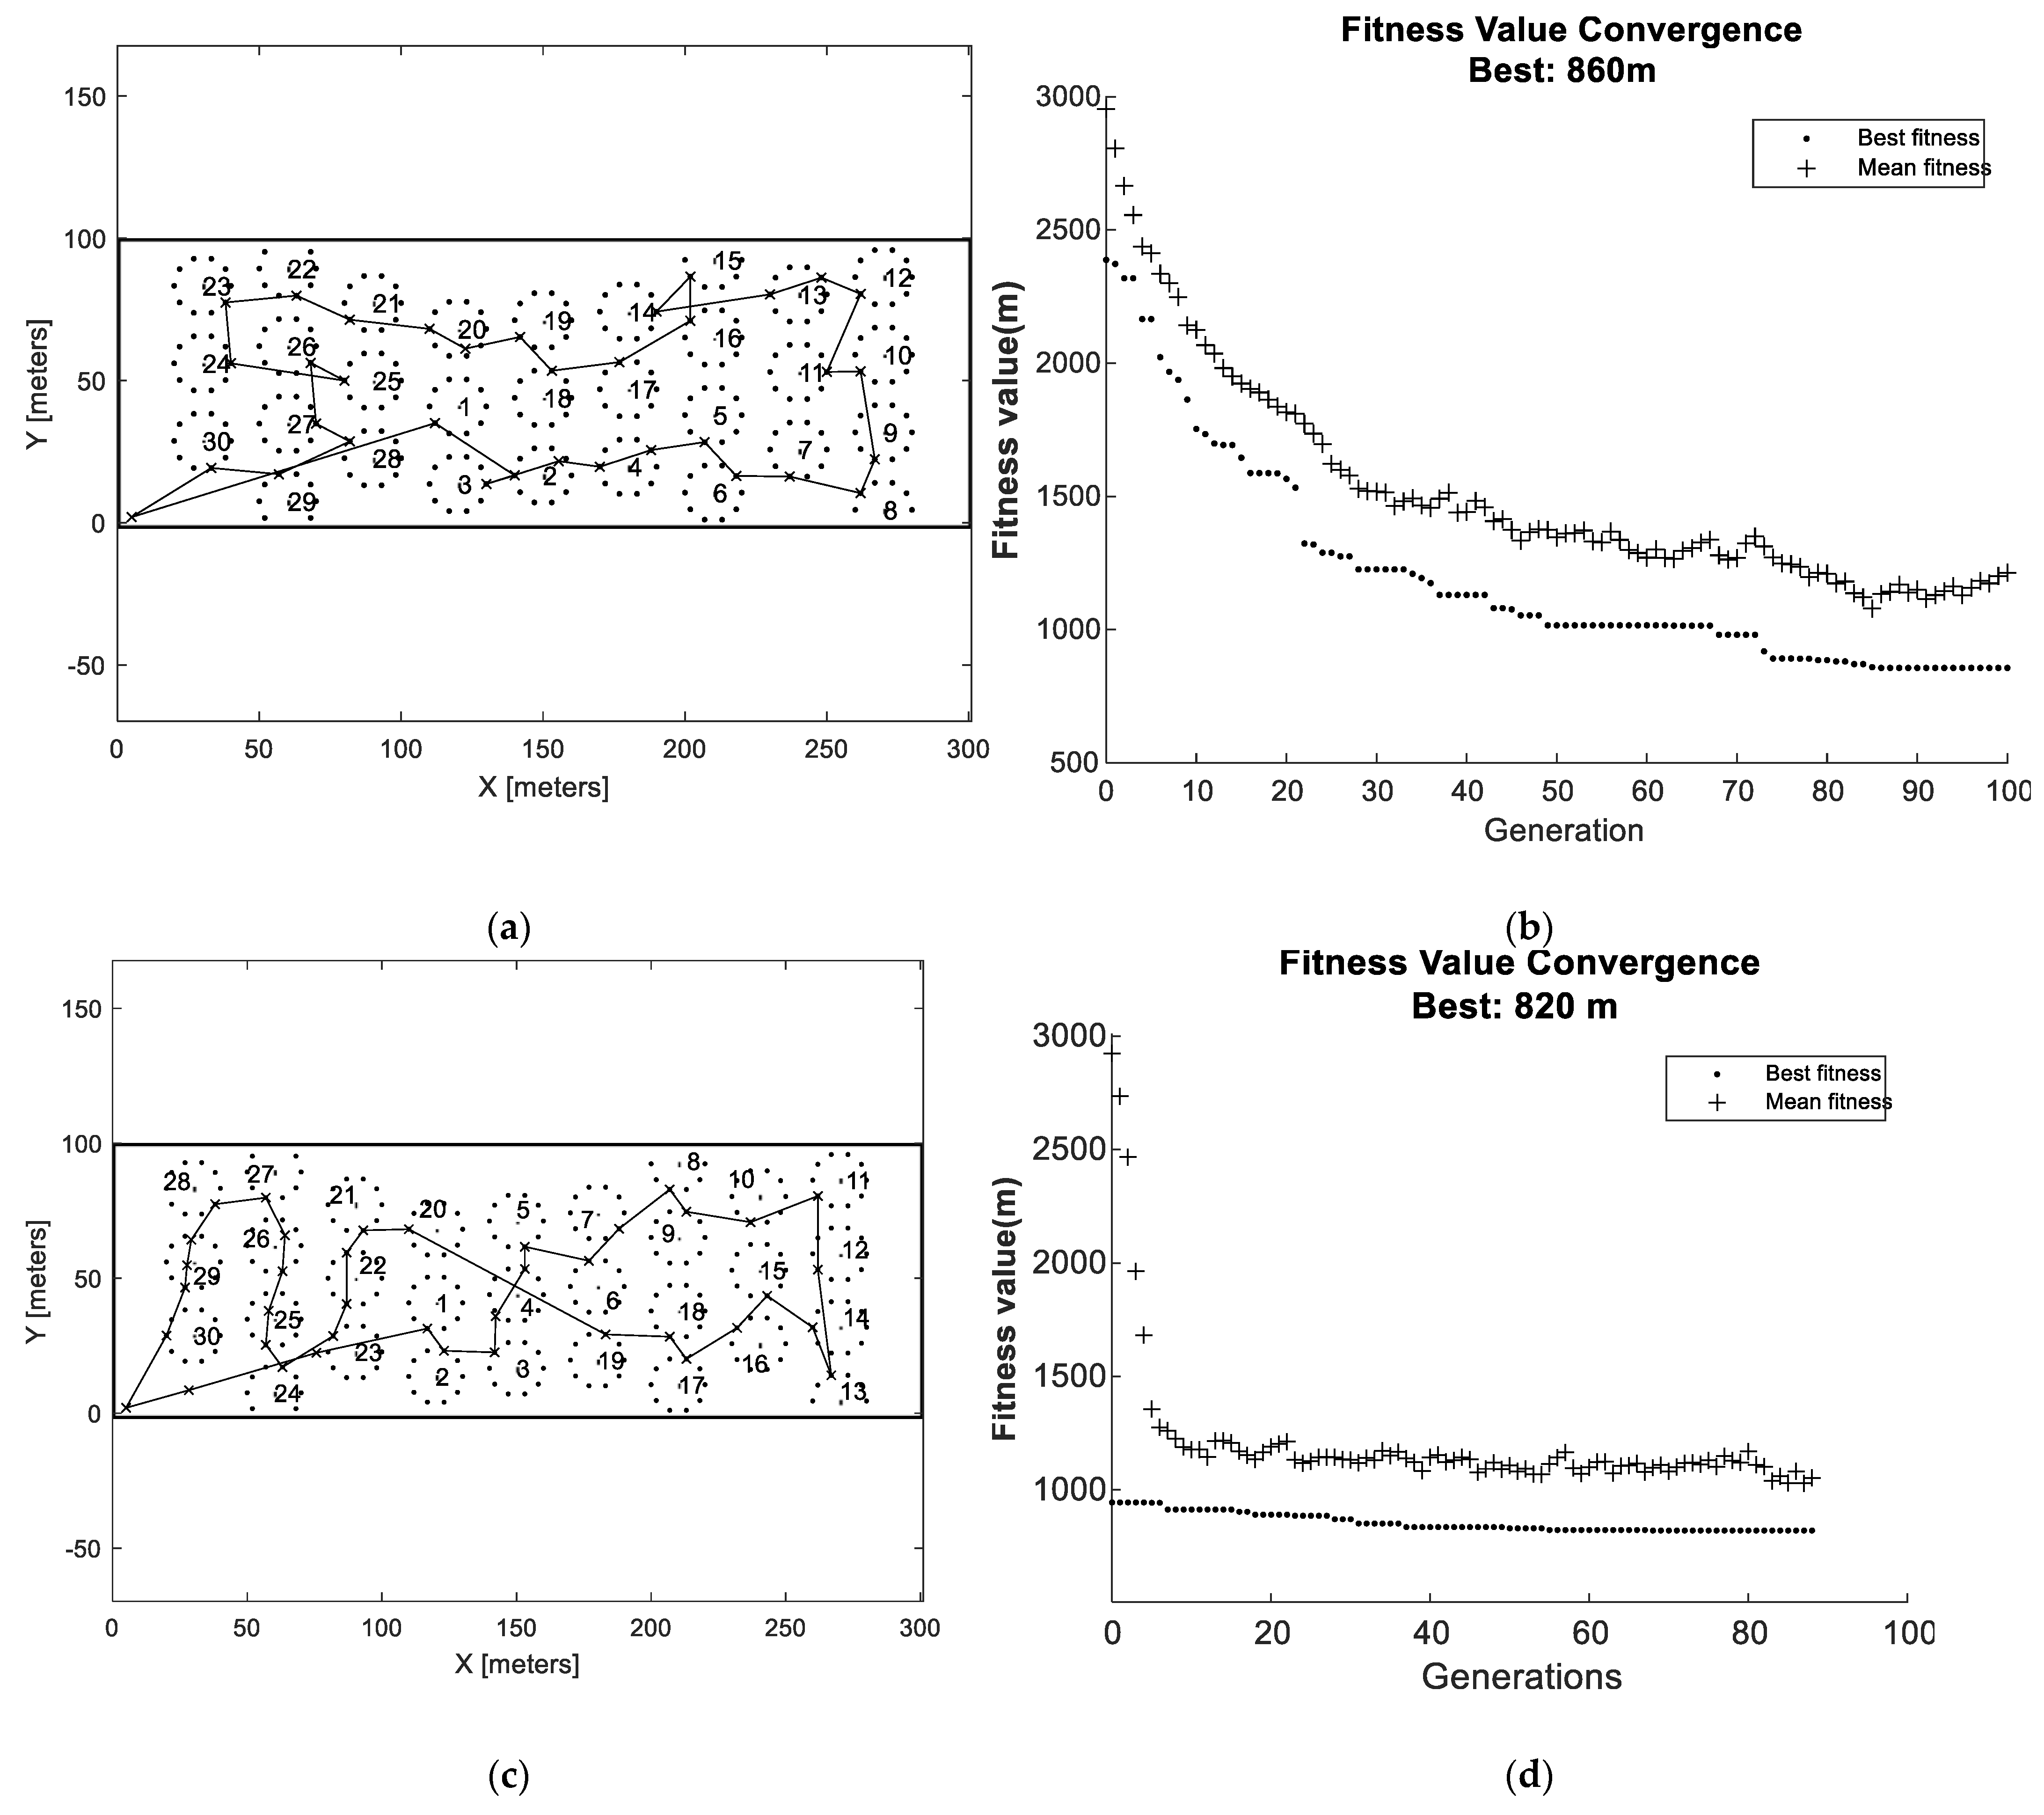
(not a permutation), it was decided to use two GAs. Hence, the first GA (GA1) was used to optimize the collection order represented as chromosome in the population of permutations of the bales’ identities. For each collection order proposed by the first GA, a second GA (GA2) was then used to optimize the collection positions for each bale. To speed up the calculations, a discrete number of collection positions were defined from which GA2 had to choose. In this way, the number of possible combinations were significantly decreased, and integer representation was used for the chromosomes, which also contributes to computational efficiency. For both GAs, the built in “ga”-solver in MATLAB© was used. However, since GA1 is based on permutation chromosomes, custom functions for the initial population, crossovers, and mutations were developed (for GA2, default settings for these properties were used). To enable a comparison of the initial conditions, two different cases of population initialization were tested (i.e., randomized initialization and nearest neighbor initialization). Crossovers were conducted by flipping a random sized part of the chromosomes while the mutations were carried out by swapping two elements in the chromosome. After evaluating the performance by means of computational time and accuracy, the following settings were used for both GAs:
Population size = 50
Crossover fraction = 50%
Function tolerance = 1 × 10⁻⁵
Elite count = 10
Maximum nr. of stalling generations = 50
Maximum nr. of generations = 100
For GA1, vectorization (i.e., working with the complete population for each iteration instead of sequentially working which each chromosome in sequence) and no parallelization was used, while the opposite was used for GA2, thus enabling GA2 to evaluate different sets of collection angles in parallel, which is possible since there exist no dependencies between those solutions.
At the lowest computational level (i.e., for a suggested collection order and set of collection angles), the total travelled distance can be calculated. Here, between two subsequent collection points, a straight line path was derived if no collision in the occupancy map occurred. Otherwise, the PRM was used to find the shortest collision free path (within the pre-generated PRM network). To further improve the computational efficiency, all simulated collection orders were stored together with the, for that order, optimized set of collection positions. For each new generation, this enabled an initial check of whether the suggested collection orders have already been optimized by means of collection angles or not. If not, a new optimization simulation is initiated, otherwise the already stored feasibility value is used.
A 20-core computer was used for the parallel computations, leading to a total simulation time for all set of parameters (field type, carrying capacities) of about 5 days.
4. Discussion
In order to simplify the computational intensity in optimizing the path planning task for the bale collection operations, there have been a number of approximations made in the modeling, as described in the scope and modeling part of the paper. This includes neglecting vehicle kinetics, considering bale collection only, keeping the PRM network static, discretization of the collection positions, etc. The GA is also significantly dependent on settings for the optimization algorithm, which effects both the accuracy and calculation time. Convergence to an optimal solution is, for instance, highly dependent on the size of the initial population and number of generations. Apart from CC = 1, the benchmark approach will always underestimate the travel distance since the loading stage is excluded from the distance calculation (i.e., relative improvements by the AVN will also be underestimated). Although these approximations will affect the output in an absolute manner, it is plausible that the relative behavior will remain, which was therefore focused on in making conclusions.
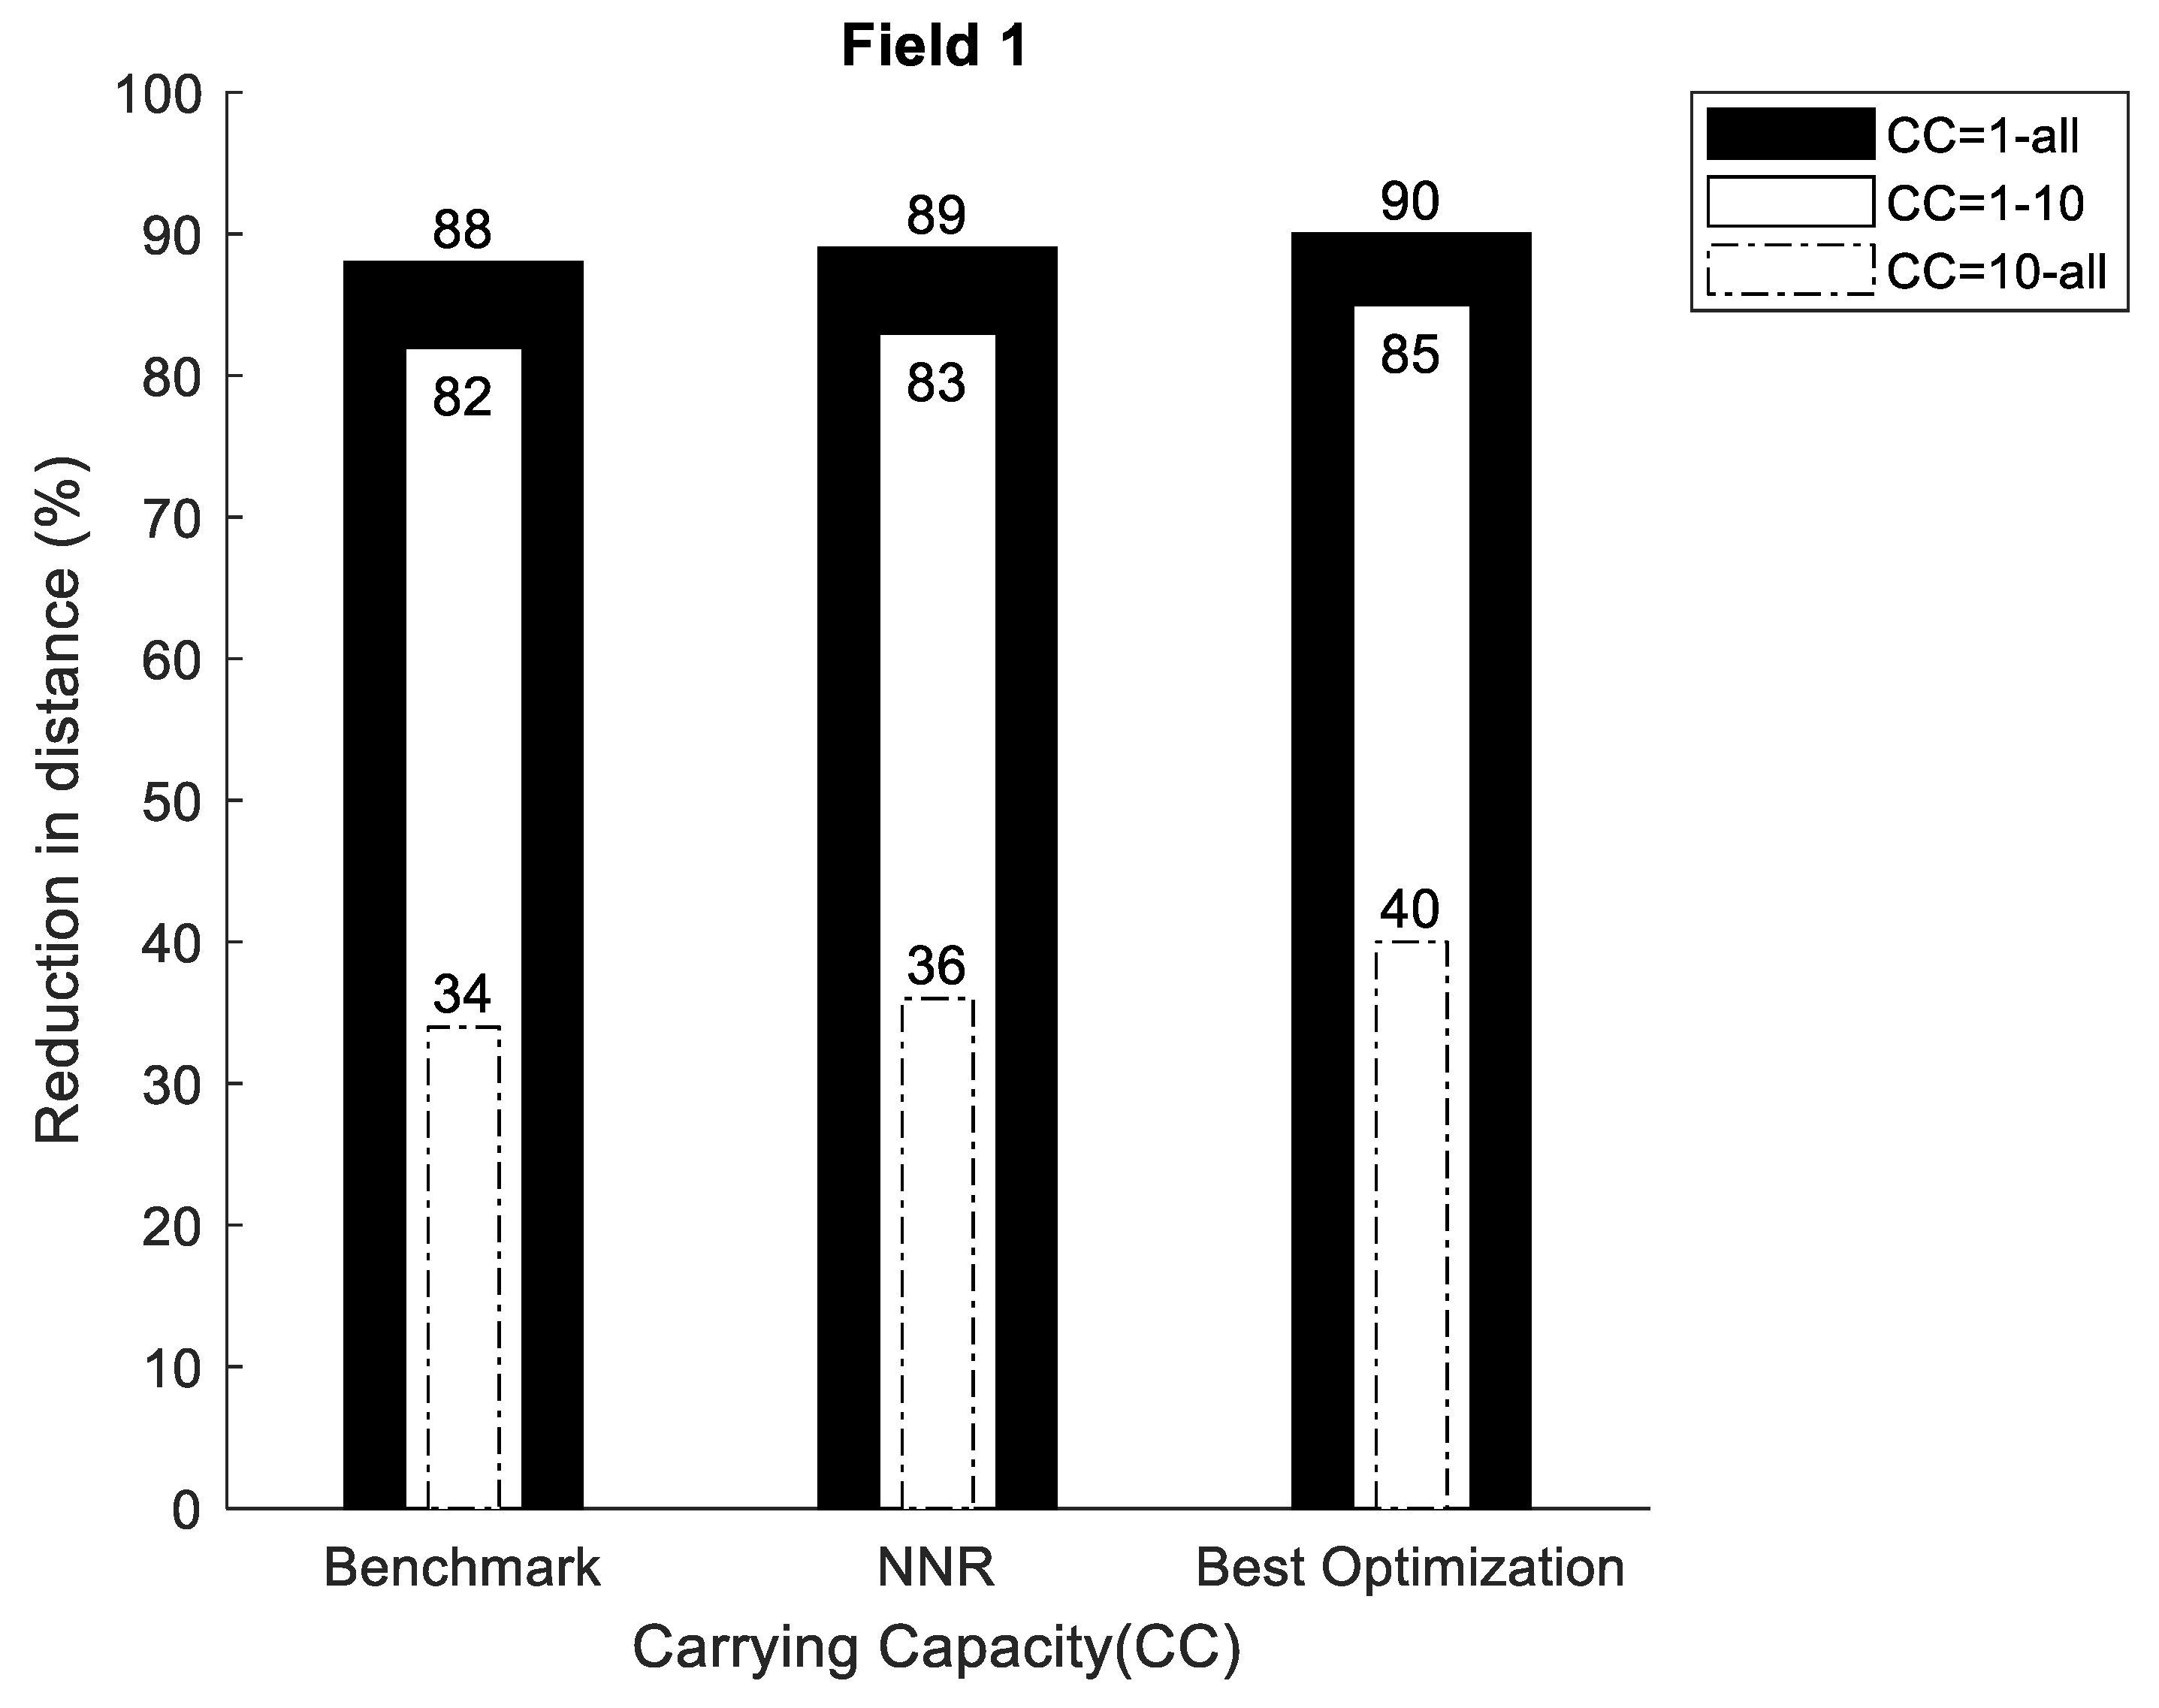
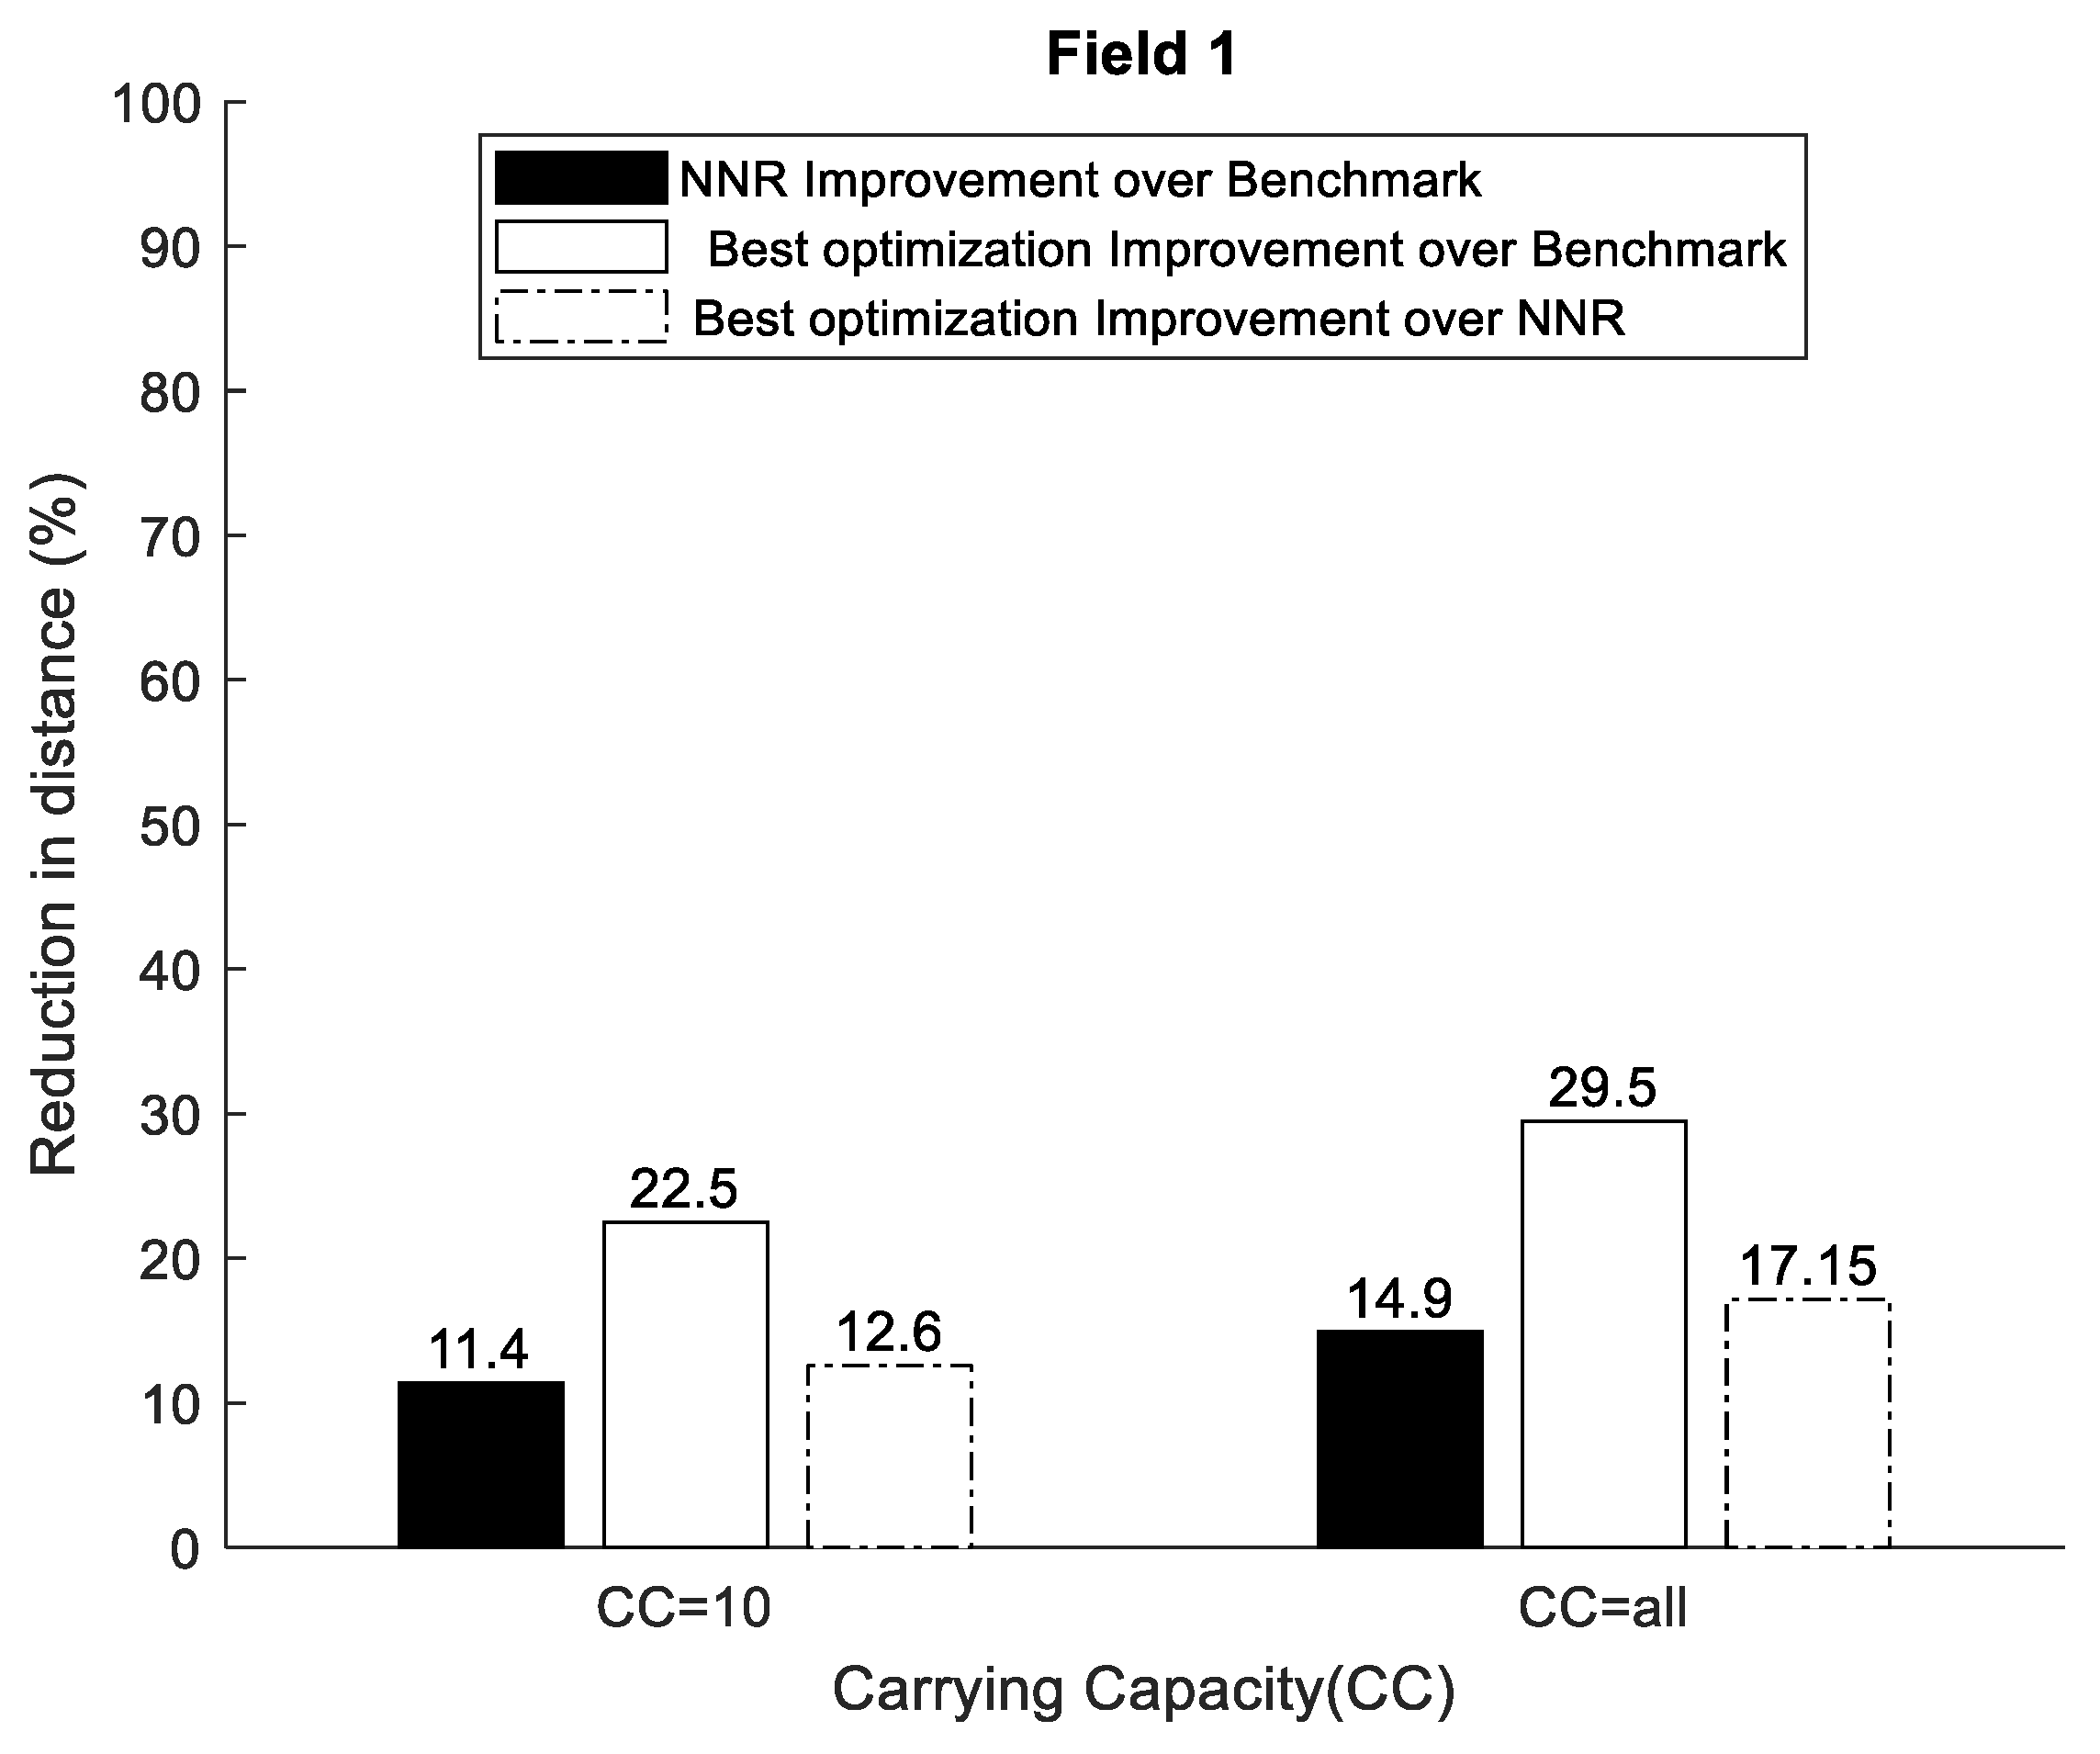
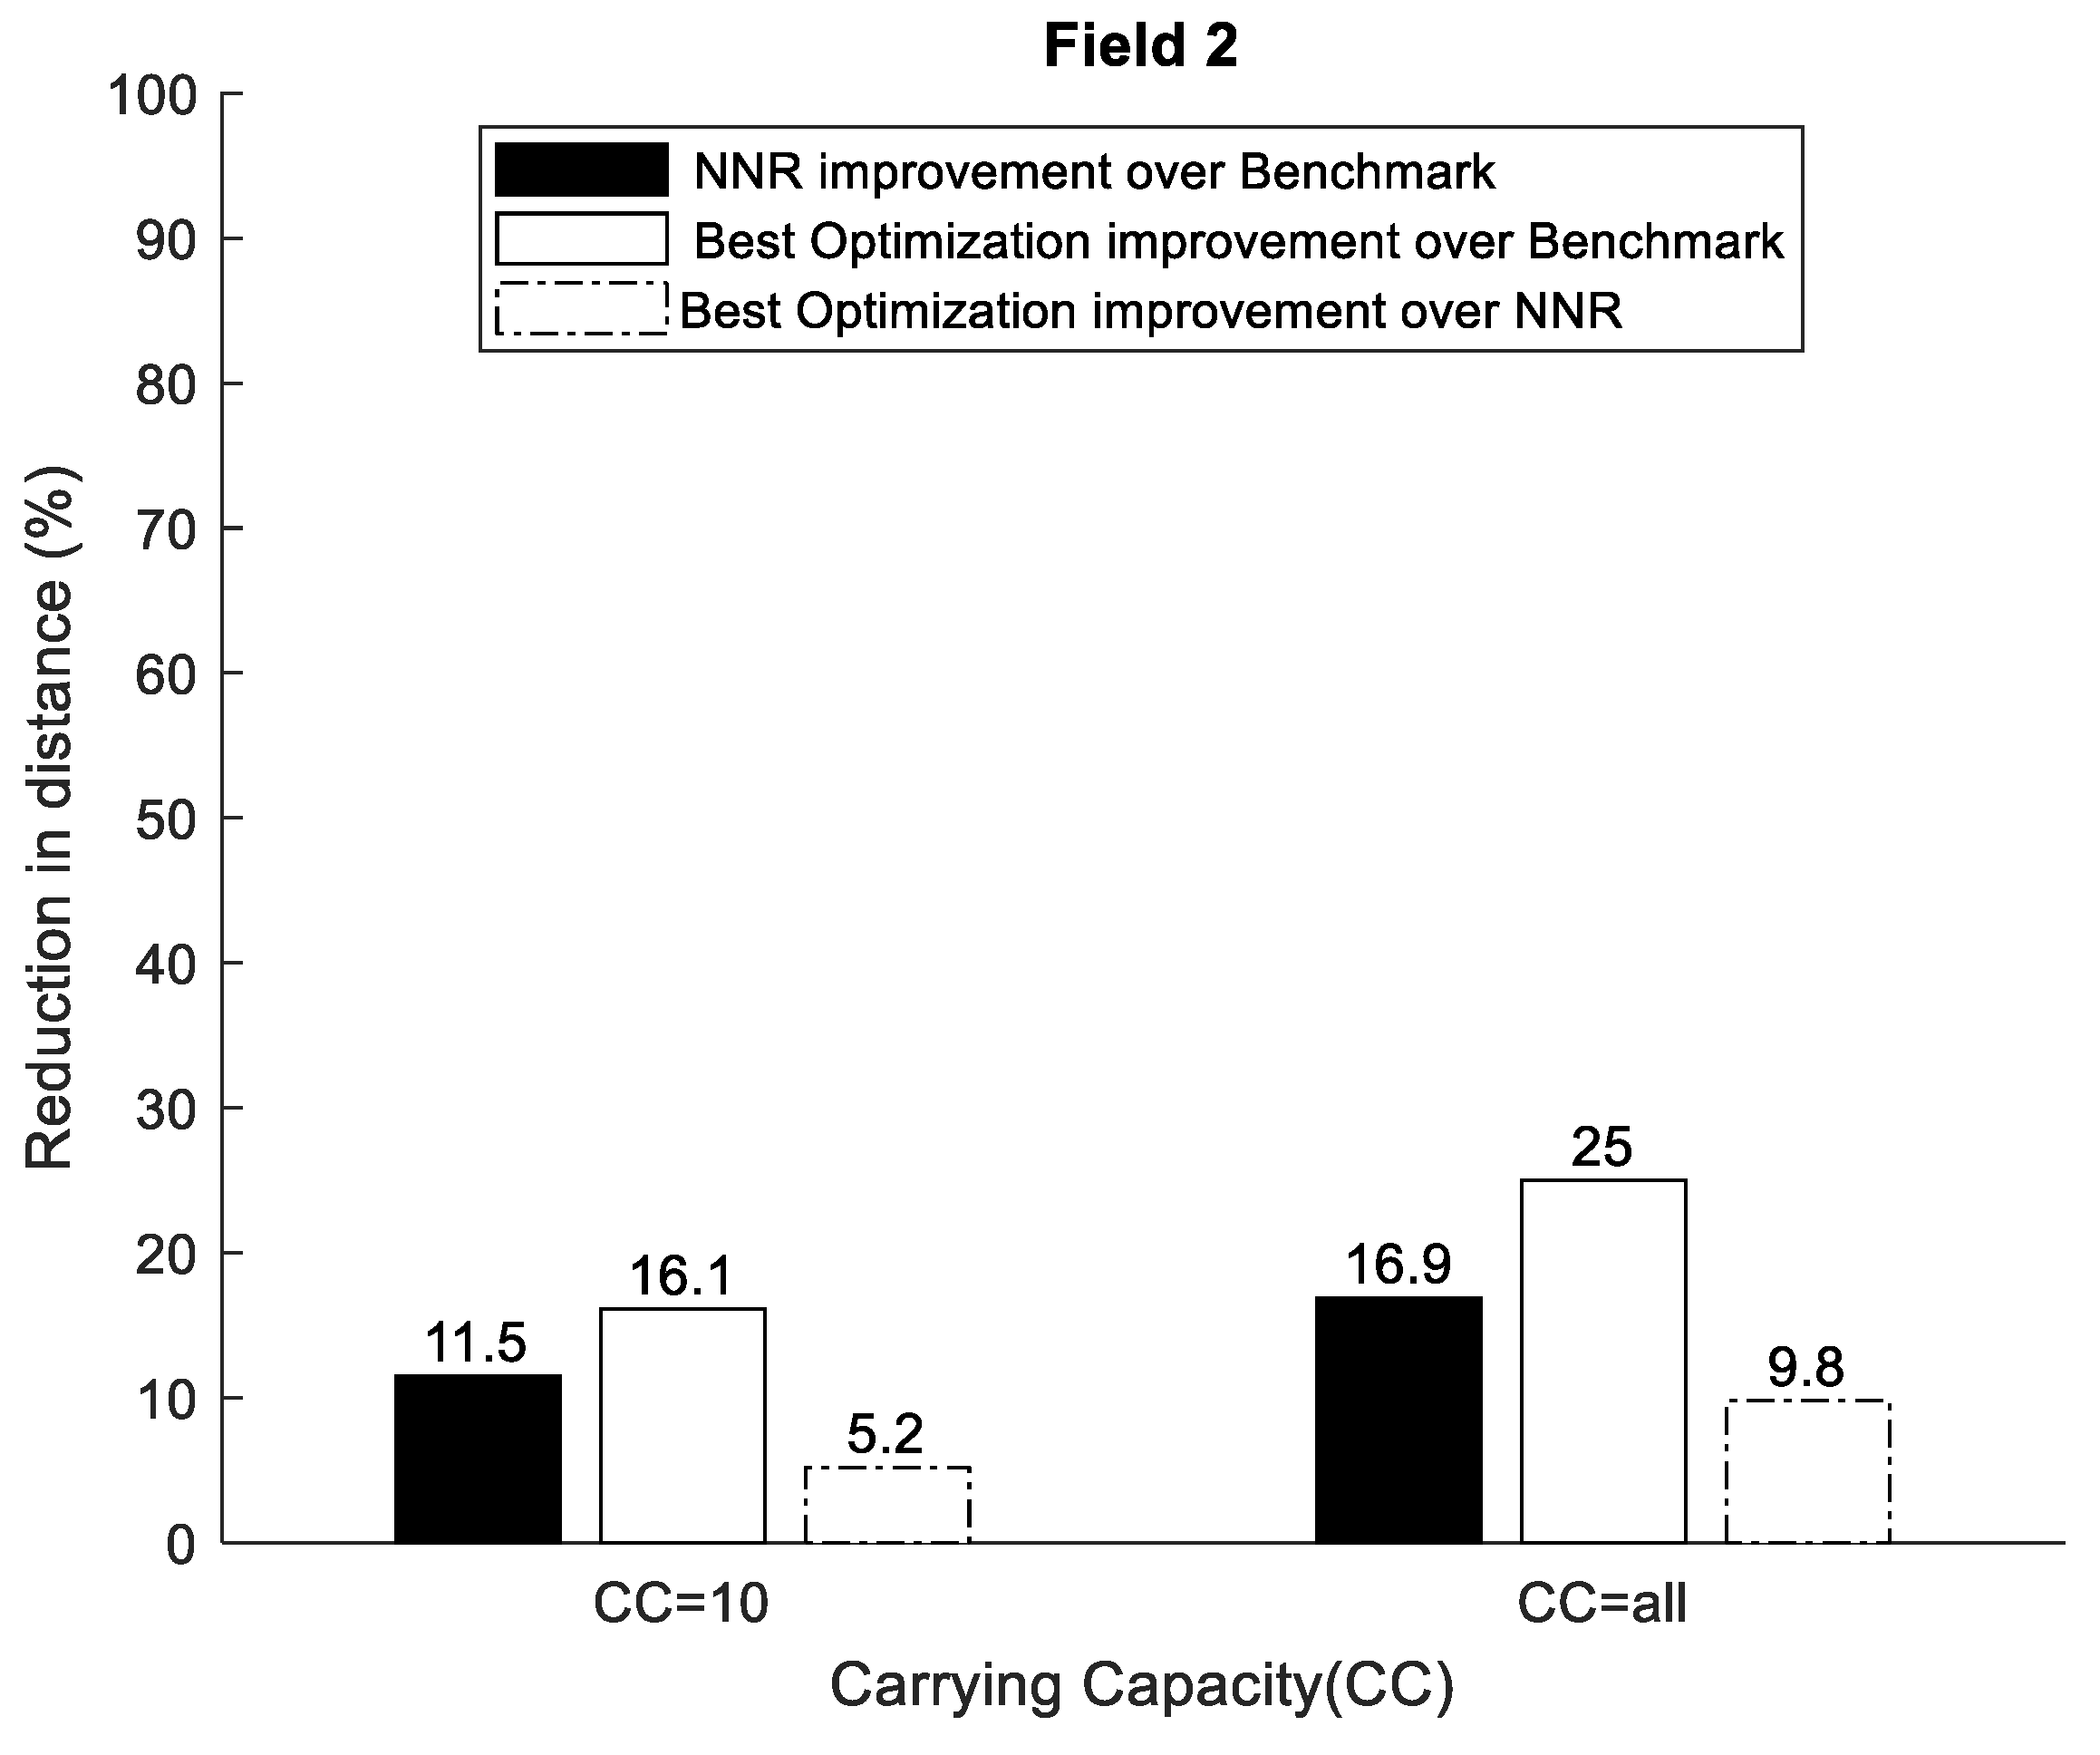
Taking the modeling limitations into consideration, some key insights were gained by analyzing the simulation results. It was found that adding carrying capacity significantly reduced the traveling distance for the bale collection operations. There was an exponential decaying trend in the distance reduction with respect to the carrying capacity. Hence, the bale collection procedure can be significantly improved, even with a small carrying capacity added. Comparing the benchmark with NNR showed that NNR reduced the travelled distance by about 10–20% (depending on field type and carrying capacity). Comparing the nearest neighbor strategy with optimization, the collection order may change for optimization (whether this is generally true or not cannot be concluded by the data presented in this paper). As would be expected, the simulations showed that the optimization approach reduced the travelled distance compared to the nearest neighbor approach. Compared to the benchmark, this reduction was about 20–30% for field 1 and 15–25% for field 2 and compared to NNR, this reduction was around 10–20% for field 1 and around 5–10% for field 2. Thus, the relative travelled distance reduction for the optimized solutions was slightly higher for the regular simple field (Field 1) compared to the complex field (Field 2). These travelled distance improvements can be compared to the similar studies by [
21,
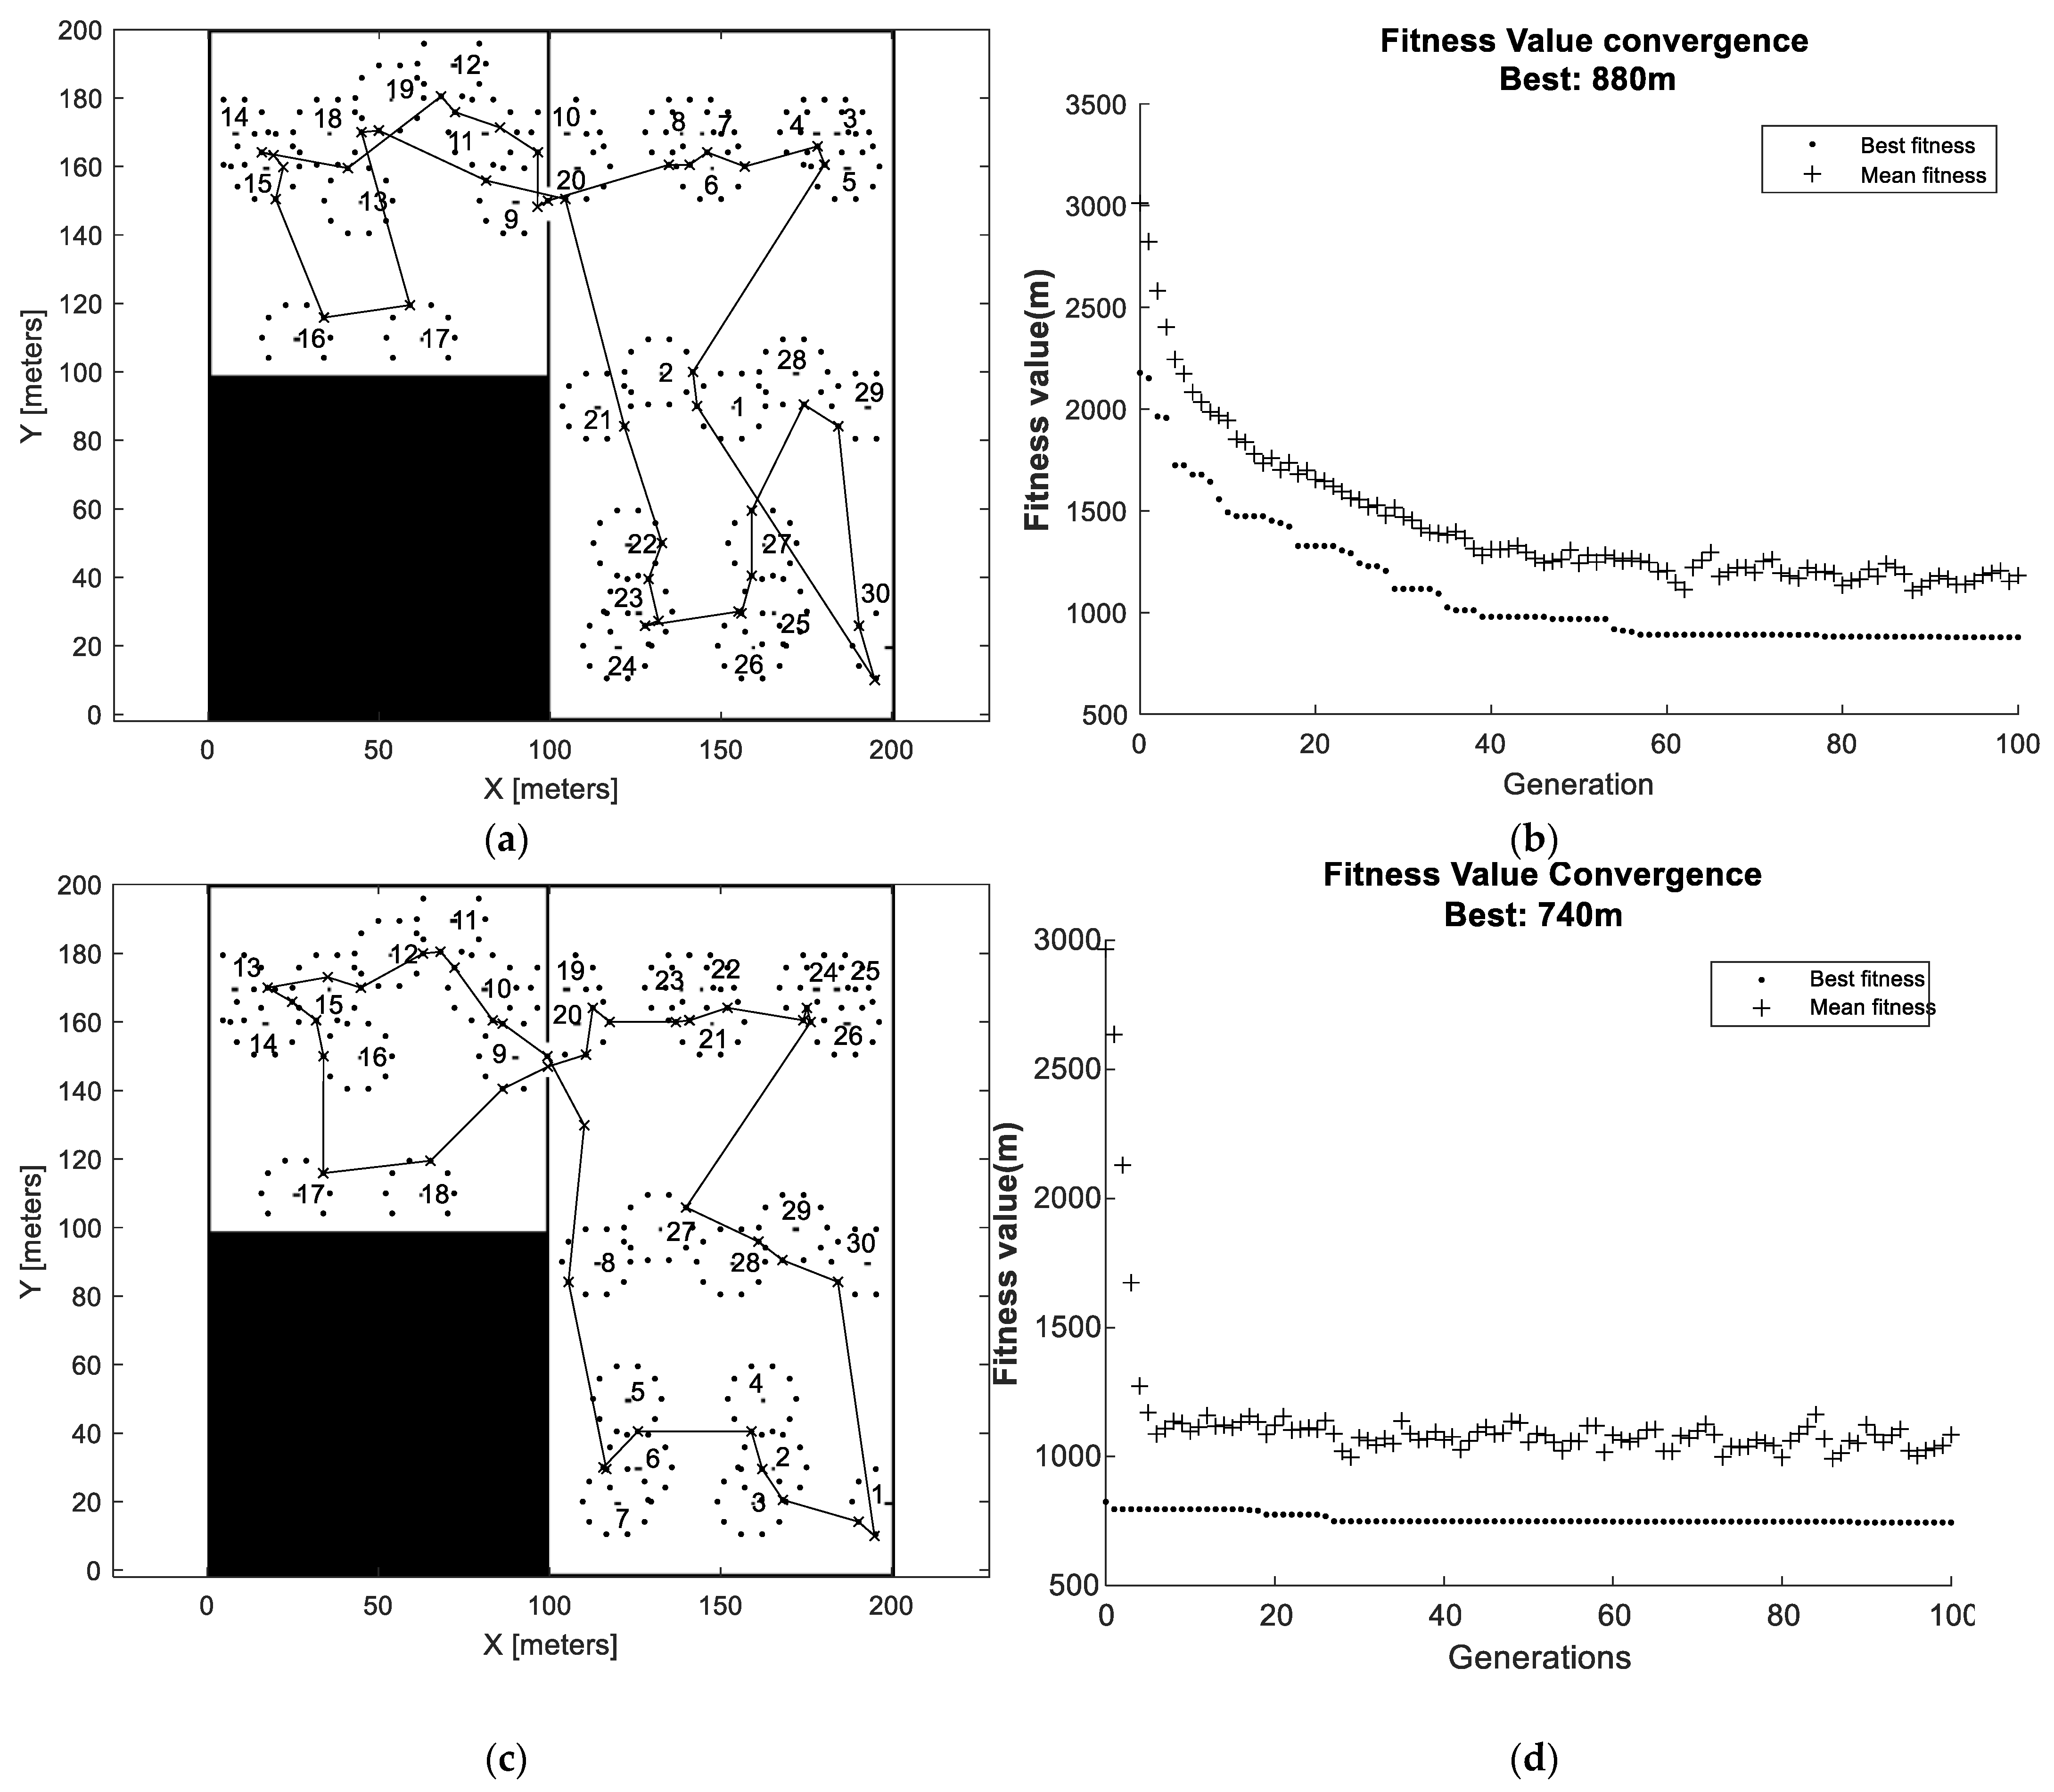
22], which showed a 6.0 and 6.8% reduction for similar cases, respectively. It should be noted that the convergence to optimal solution strongly depended on the choice of initial population. The results indicate that the nearest neighbor initialization is a better choice than randomly permutated initialization independent of carrying capacities and field complexity (similar results for both fields).


