Article

WG-3D: A Low-Cost Platform for High-Throughput Acquisition of 3D Information on Wheat Grain

1
Key Laboratory of Agricultural Blockchain Application, Ministry of Agriculture and Rural Affairs, Agricultural Information Institute, Chinese Academy of Agricultural Sciences, Beijing 100081, China
2
Jiangsu Key Laboratory of Crop Genetics and Physiology, Jiangsu Key Laboratory of Crop Cultivation and Physiology, Agricultural College of Yangzhou University, Yangzhou 225009, China
3
Jiangsu Co-Innovation Center for Modern Production Technology of Grain Crops, Yangzhou University, Yangzhou 225009, China
4
Lixiahe Institute of Agricultural Sciences of Jiangsu, Key Laboratory of Wheat Biology and Genetic Improvement for Low & Middle Yangtze Valley, Ministry of Agriculture and Rural Affairs, Yangzhou 225012, China
*
Authors to whom correspondence should be addressed.
Agriculture 2022, 12(11), 1861; https://doi.org/10.3390/agriculture12111861
Submission received: 7 August 2022 / Revised: 27 October 2022 / Accepted: 3 November 2022 / Published: 5 November 2022
(This article belongs to the Section Digital Agriculture)

Abstract

:
The three-dimensional (3D) morphological information of wheat grains is an important parameter for discriminating seed health, wheat yield, and wheat quality. High-throughput acquisition of 3D indicators of wheat grains is of great importance for wheat cultivation management, genetic breeding, and economic value. Currently, the 3D morphology of wheat grains still relies on manual investigation, which is subjective, inefficient, and poorly reproducible. The existing 3D acquisition equipment is complicated to operate and expensive, which cannot meet the requirements of high-throughput phenotype acquisition. In this paper, an automatic, economical, and efficient method for the 3D morphometry of wheat grain is proposed. A line laser binocular camera was used to obtain high-quality point-cloud data. A wheat grain 3D model was constructed by point-cloud segmentation, finding, clustering, projection, and reconstruction. Based on this, 3D morphological indicators of wheat grains were calculated. The results show that the root mean square error (RMSE) and mean absolute percentage error (MAPE) of the length were 0.2256 mm and 2.60%, the width, 0.2154 mm and 5.83%, the thickness, 0.2119 mm and 5.81%, and the volume, 1.7740 mm3 and 4.31%. The scanning time was around 12 s and the data processing time was around 3.18 s under a scanning speed of 25 mm/s. This method can achieve the high-throughput acquisition of the 3D information of wheat grains, and it provides a reference for in-depth study of the 3D morphological indicators of wheat and other grains.

1. Introduction

Wheat is one of the most important foods for humans and the most popular ingredient for bread. Wheat for bread alone accounts for 20% of the world’s calorie consumption [1]. As the “chip of agriculture”, the seed is the key to produce more and better food on limited arable land. A complete and healthy wheat grain can yield more and better flour, which in turn affects people’s consumption. The morphological characteristics of wheat grains are not only important evaluation indicators of grains’ morphological quality and important indicators of wheat processing quality but also important evaluation criteria for wheat-grain grading. Studies have shown that wheat-grain size and traits are closely related to wheat flour production and yield [2,3]. Wheat-grain morphological characteristics are important markers to distinguish different kinds of wheat, and they have become the preferred parameter to identify wheat quality. This is an important reference for wheat cultivation management, genetic breeding, and economic value determination.
The morphological traits of wheat grains include the size and shape of the grain, which are usually measured with vernier calipers. Farmers generally prefer to grow wheat varieties with larger grains, as larger grains are beneficial for vigor in the seedling stage of wheat and can promote yield growth [4]. At the same time, wheat grain morphology also affects milling quality. Stronger kernels result in more and better flour, which in turn affects people’s consumption. Hence, breeders have turned to very early wheat-grain characterization [5]. Many previous studies have shown that quantitative trait loci (QTL) for grain morphological traits are distributed on all 21 chromosomes in wheat [6]. The chromosomal locations of QTL for grain length, grain width, and grain thickness have also been identified [7,8,9,10]. Wheat grain weight is one of the yield components and a typical quantitative trait controlled by microeffective polygenes. The weight consists of basic elements such as grain length, grain width, and grain thickness [11]. Wheat-grain length, width, and thickness show a highly significant positive correlation with grain weight [12]. Wheat-grain morphology is not only an important factor in determining grain weight but also closely related to wheat quality [13], which determines the market grading and commercial value of wheat [14]. Therefore, mining stable QTL controlling wheat grain morphological traits in different genetic backgrounds is important for wheat yield and quality breeding and an important goal for wheat genetic improvement. Therefore, the rapid acquisition of high-throughput phenotypic morphological traits in wheat grains is particularly important.
Conventional methods for manual assessment of grain quality are challenging even for trained personnel because the effects of grain and environment cause changes in visual characteristics [15]. Moreover, these methods are highly subjective, inefficient, and poorly reproducible, with unreliable evaluation results and difficulty in obtaining accurate quantitative data [16]. Along with the increasing level of information technology, the advantages of rapid, nondestructive, and high-throughput measurement of grain morphology based on computer vision technology are becoming increasingly significant compared with the traditional manual measurement. Machine vision [17], near-infrared spectroscopy [18], electronic sensors [19], infrared spectroscopy [20], X-ray techniques [21], and hyperspectral imaging [22] are examples of such techniques. The associated studies usually target two-dimensional (2D) morphological information and are mostly applied in taxonomic classification (species classification) [23,24,25,26]. Compared with the 2D space, the three-dimensional (3D) space has more valuable parameters, and scientists have started to turn to the study of high-throughput phenotypic information acquisition methods for 3D models in recent years. For example, Qian et al. [27] used high-resolution 3D point-cloud data of rice obtained by laser scanning technology to reconstruct the 3D morphology of rice and obtained several morphological characteristics parameters, such as volume and surface area of rice. 3D technology was also applied to the classification of rice organs [28], panicle segmentation [29,30], and leaf-size measurement [31]. However, there are few studies on high-throughput acquisition methods for 3D morphological parameters of wheat grains. Sun et al. [32] used stereo vision techniques to find out the thickness of wheat grains and to detect the presence of wrinkles in wheat grain samples, but their measurement index is too single to meet the standard of high-throughput acquisition.
In this paper, we present an automatic, cost-effective, and efficient method for a 3D model of wheat grains (WG-3D). We made a high-quality point-cloud data acquisition device by combining laser and binocular camera. The point-cloud data were also acquired with the help of an automated operation platform. Point-cloud segmentation, finding, clustering, projection, and reconstruction methods were used to realize the construction of a 3D model of grains. The high-throughput morphological characteristics of wheat grains were obtained based on the 3D grain model. Indicators such as length, width, thickness, and volume were used to verify the accuracy of the 3D model.

2. Materials and Methods

2.1. Experimental Materials

The materials used in the experiment were the Yangmai series varieties developed and supplied by the Institute of Agricultural Science in Lixiahe, Jiangsu Province, China. The test materials were divided into two groups according to different experimental purposes. The first group was a validation experiment, which included three varieties, namely Zhenmai No. 9, Yangmai No. 23, and Ningmai No. 13, each with 100 randomly selected grains. The second group was a test experiment and comprised 26 varieties of Yangmai series (Table 1), and 40 grains from each variety were randomly selected. Figure 1 shows the images of the wheat grains of different Yangmai series varieties.

2.2. Experimental Device

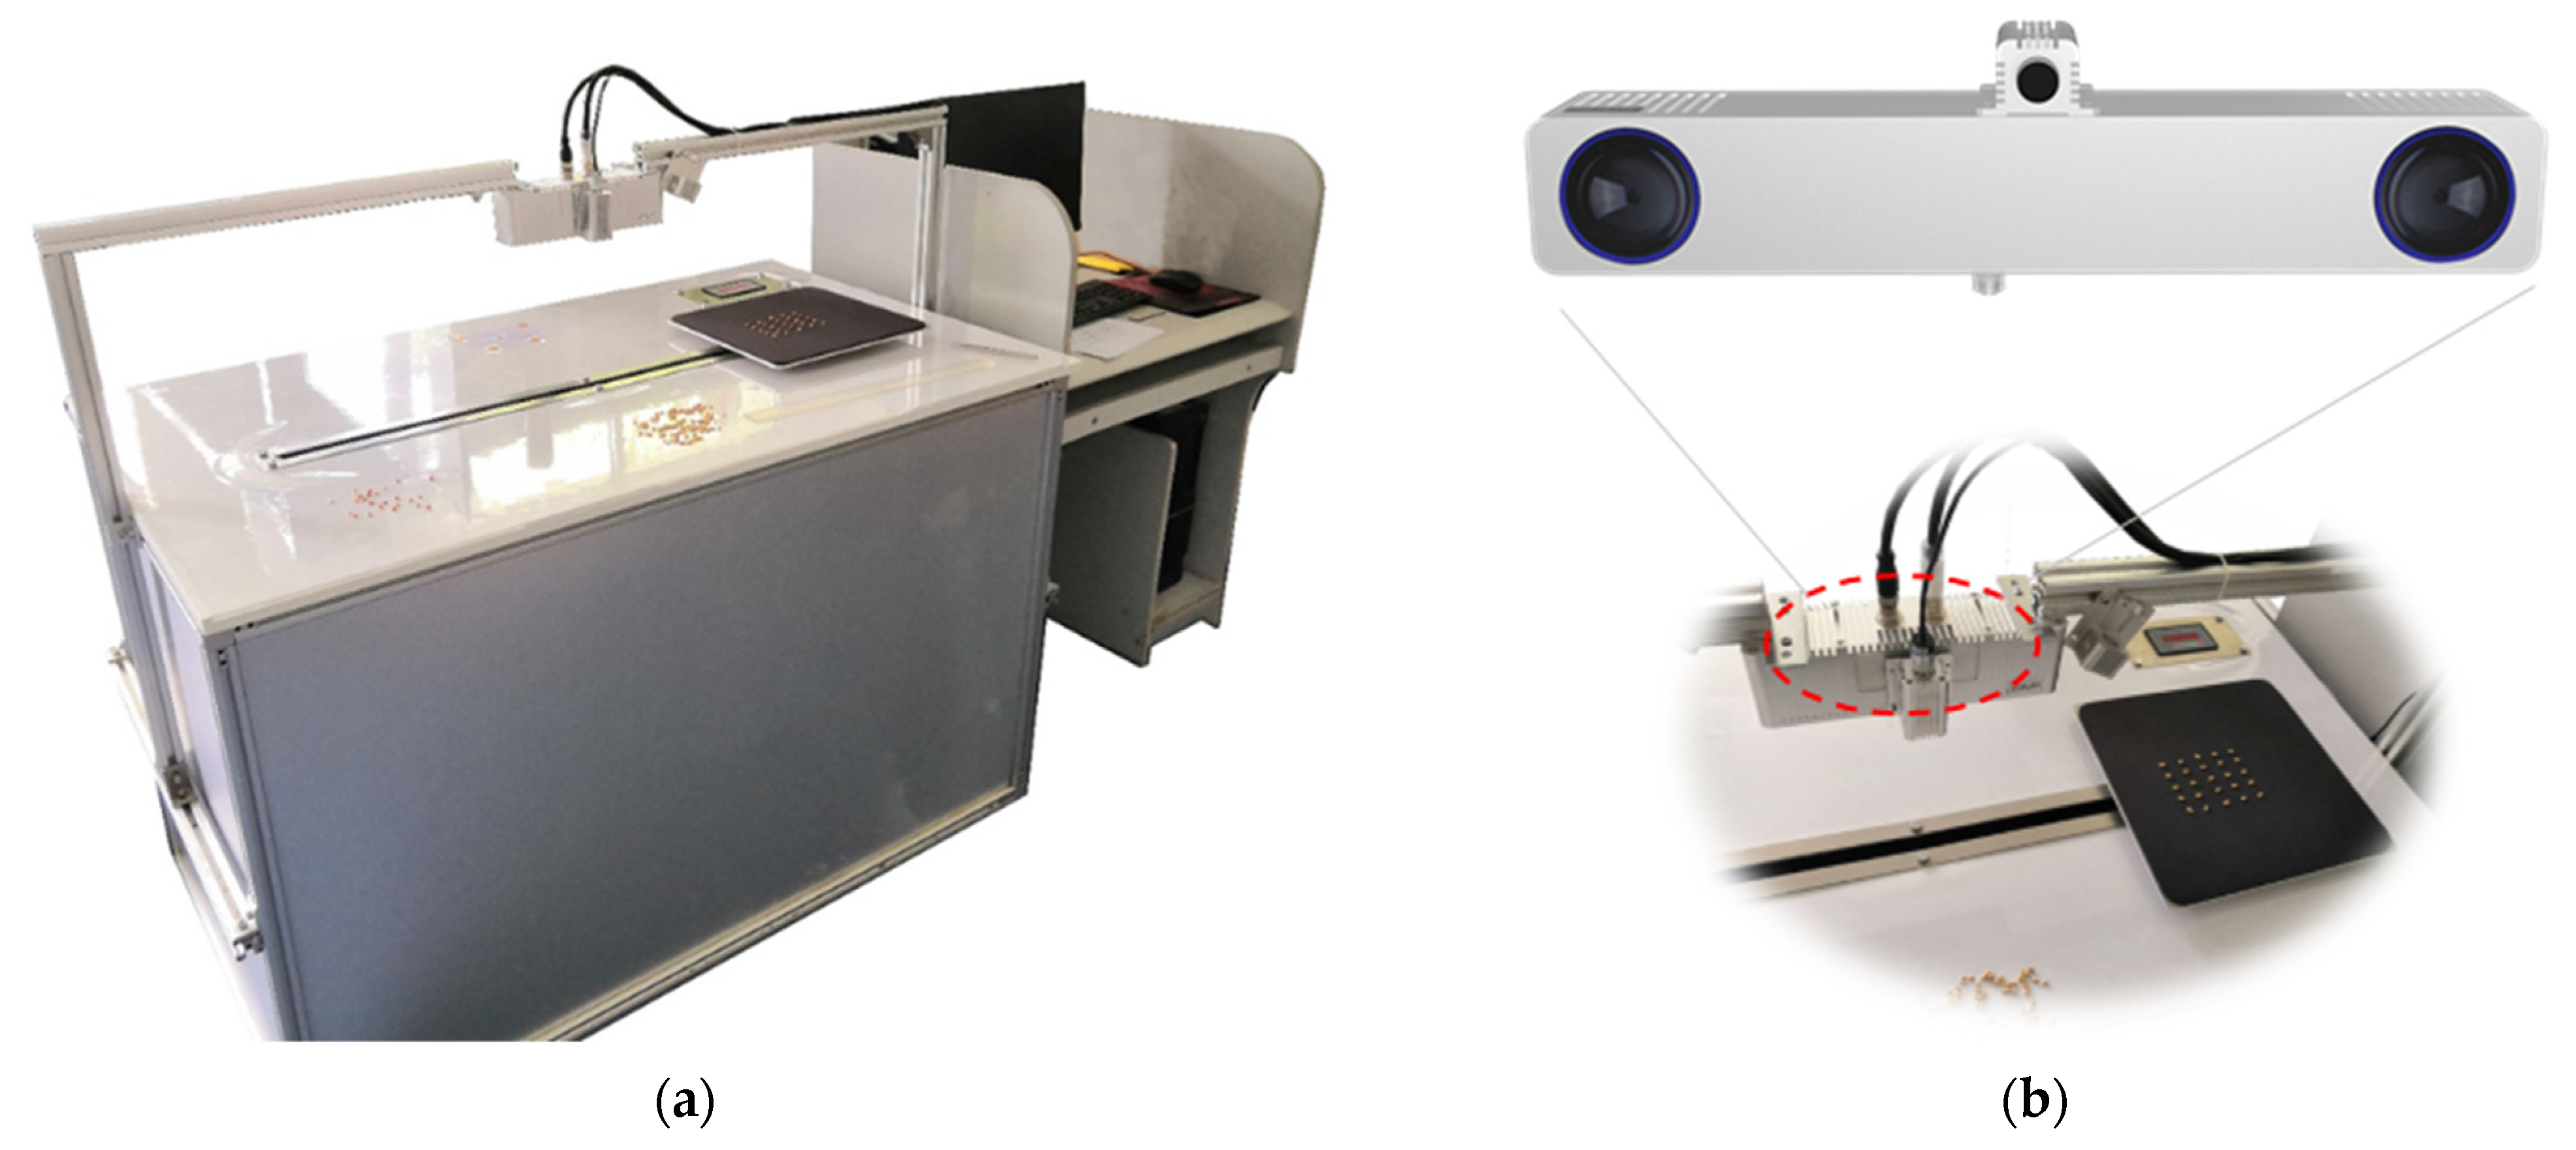
This study used a high-quality wide-field stereo camera (VZ-JGY-1300G-120M6, working distance: 20 cm; lens parameters: 6 mm–1/1.8″–120 mm) manufactured by Beijing Weijing Intelligent Technology Co., (Beijing, China). It adopts line laser binocular stereo vision technology system to acquire 3D spatial information through the binocular parallax principle. The infrared laser is designed to be invisible. It is primarily designed to perform auxiliary positioning to assist the intelligent binocular stereo camera in extracting only 3D data from all points on the laser, thus excluding external light interference. The computer configuration was as follows: 64-bit Windows 7 Professional operating system, Intel (R) Core (TM) i5-7400 3.00 GHz processor, 8 GB RAM, 120 GB (SSD) hard disk, and Intel HD Graphics 630 graphics card. Figure 2 shows the 3D point-cloud acquisition platform.

2.3. Grain Point Cloud Processing Pipeline

The overall processing pipeline of the grain point cloud is shown in Figure 3. It mainly includes 5 steps: point-cloud acquisition, point-cloud preprocessing, single-grain point-cloud extraction, 3D model construction, and 3D morphological feature calculation.

2.3.1. Point Cloud Acquisition

The process of acquiring 3D point-cloud data with the binocular camera consists of three parts.
  • Binocular calibration. This uses the known correspondence between the world coordinate system (calibration plate) and the image coordinate system (after processing the image of the calibration plate) to calculate the parameter information of the binocular camera in the current position relationship. Before binocular calibration, it is also necessary to perform single camera calibration for each camera to determine its distortion coefficient, camera internal reference matrix, and other parameters.
  • Extraction of points of interest (feature extraction). In this process, the binocular camera extracts all data points on the laser line. Two pictures taken with the left and right cameras from different angles are used to describe the laser line. Then, a suitable pre-processing algorithm is added to extract and segment the laser lines from the two images.
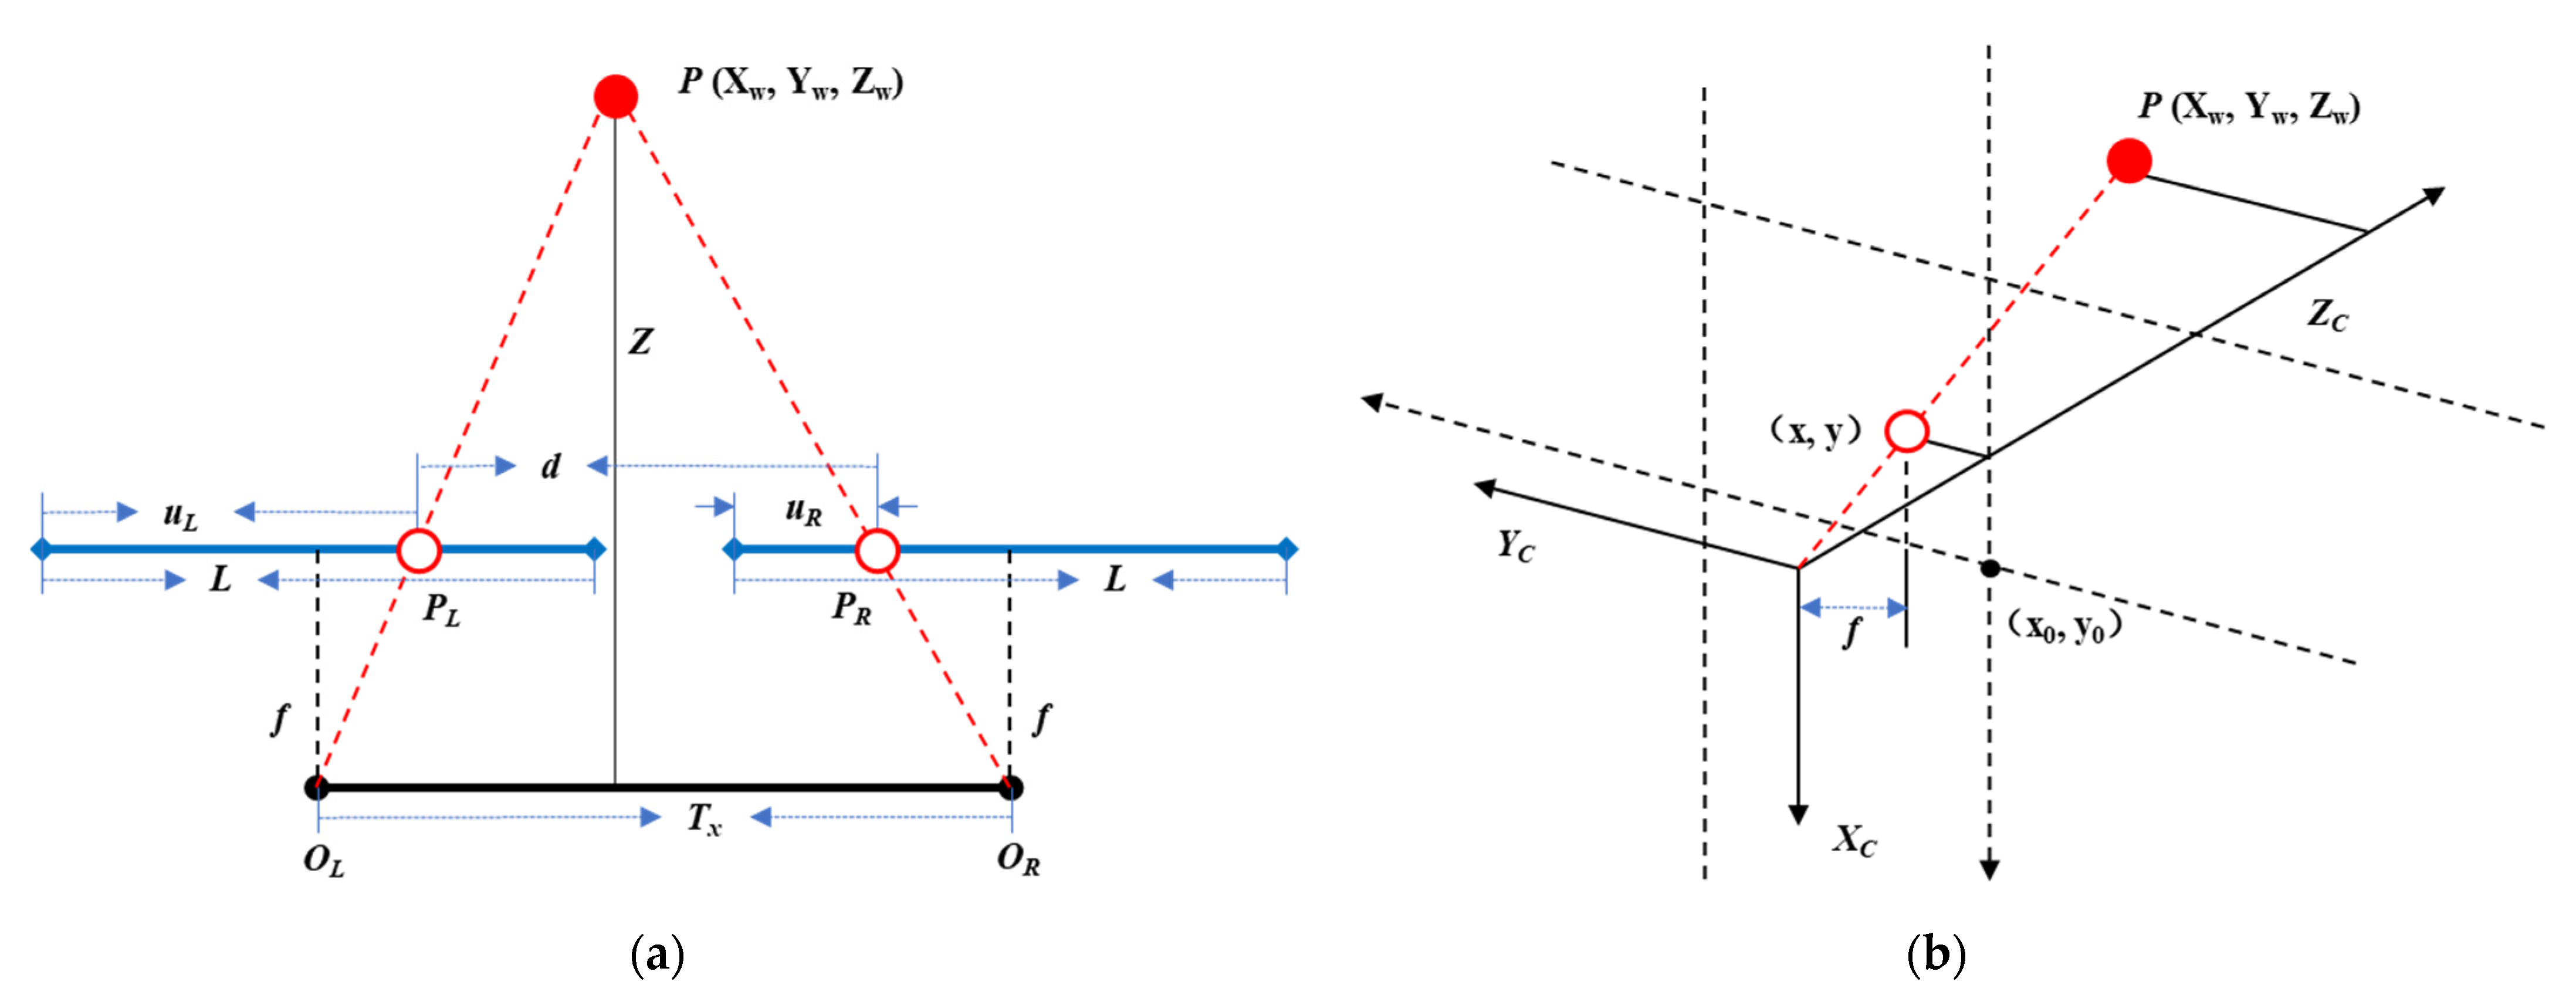
  • Accurate digital description (stereo matching). In this stage, the “stereo matching” algorithm is used, which calculates the base matrix based on the coordinate points of the feature points in the left and right images and corresponds the coordinate points of the same name in the left and right images one by one. The calculation is performed using the parallax principle (Figure 4).
The point P in Figure 4a is a point in 3D space; O L and O R are the left and right camera optical centers; and P L and P R are the imaging points of the point P on the left and right image planes. The parallax of the point P in the left and right cameras is defined as
D i s p a r i t y = | u L u R | ,
where u L and u R are the distances of the two imaging points on the left and right image planes from the left edge of the image, respectively.
According to the similar triangle, it follows that
d T x = Z f Z ,
where Z denotes the depth information; T x is the distance between the two camera optical centers, also called the baseline; f is the focal length; and d is calculated as
d = T x ( u L L 2 ) ( L 2 u R ) = T x ( u L u R ) .
It can be deduced that
Z = T x f u L u R = T x f D i s p a r i t y .
When the point P moves in the 3D space, the imaging position of the point P on the left and right cameras will also change, and thus, the parallax will also change accordingly. As can be seen from the above equation, the parallax is inversely proportional to the distance from the point on the 3D space to the center plane of the projection. Therefore, as long as the parallax of a point is known, the depth information of that point can be known. From Figure 4b, it can be deduced that
{ x x 0 X w = f Z w y y 0 Y w = f Z w .
Finally, the 3D coordinates of the point P are determined as
{ X w = x x 0 f Z w Y w = y y 0 f Z w Z w = Z .
All grains are placed on the carrier table in a uniform position with the back of the belly facing down and the front facing up. The grains can be quickly adjusted with tweezers and kept from overlapping and piling up. After the grains are prepared, the 3D point-cloud scanning system is activated, and the carrier table moves between the limiters at an even speed (25 mm/s). The binocular camera starts generating valid point-cloud data in real time as the carrier moves within the binocular camera capture distance. When the carrier leaves the capture range of the binocular camera, all point-cloud data are generated and transferred to the computer for point-cloud data processing.

2.3.2. Point Cloud Preprocessing

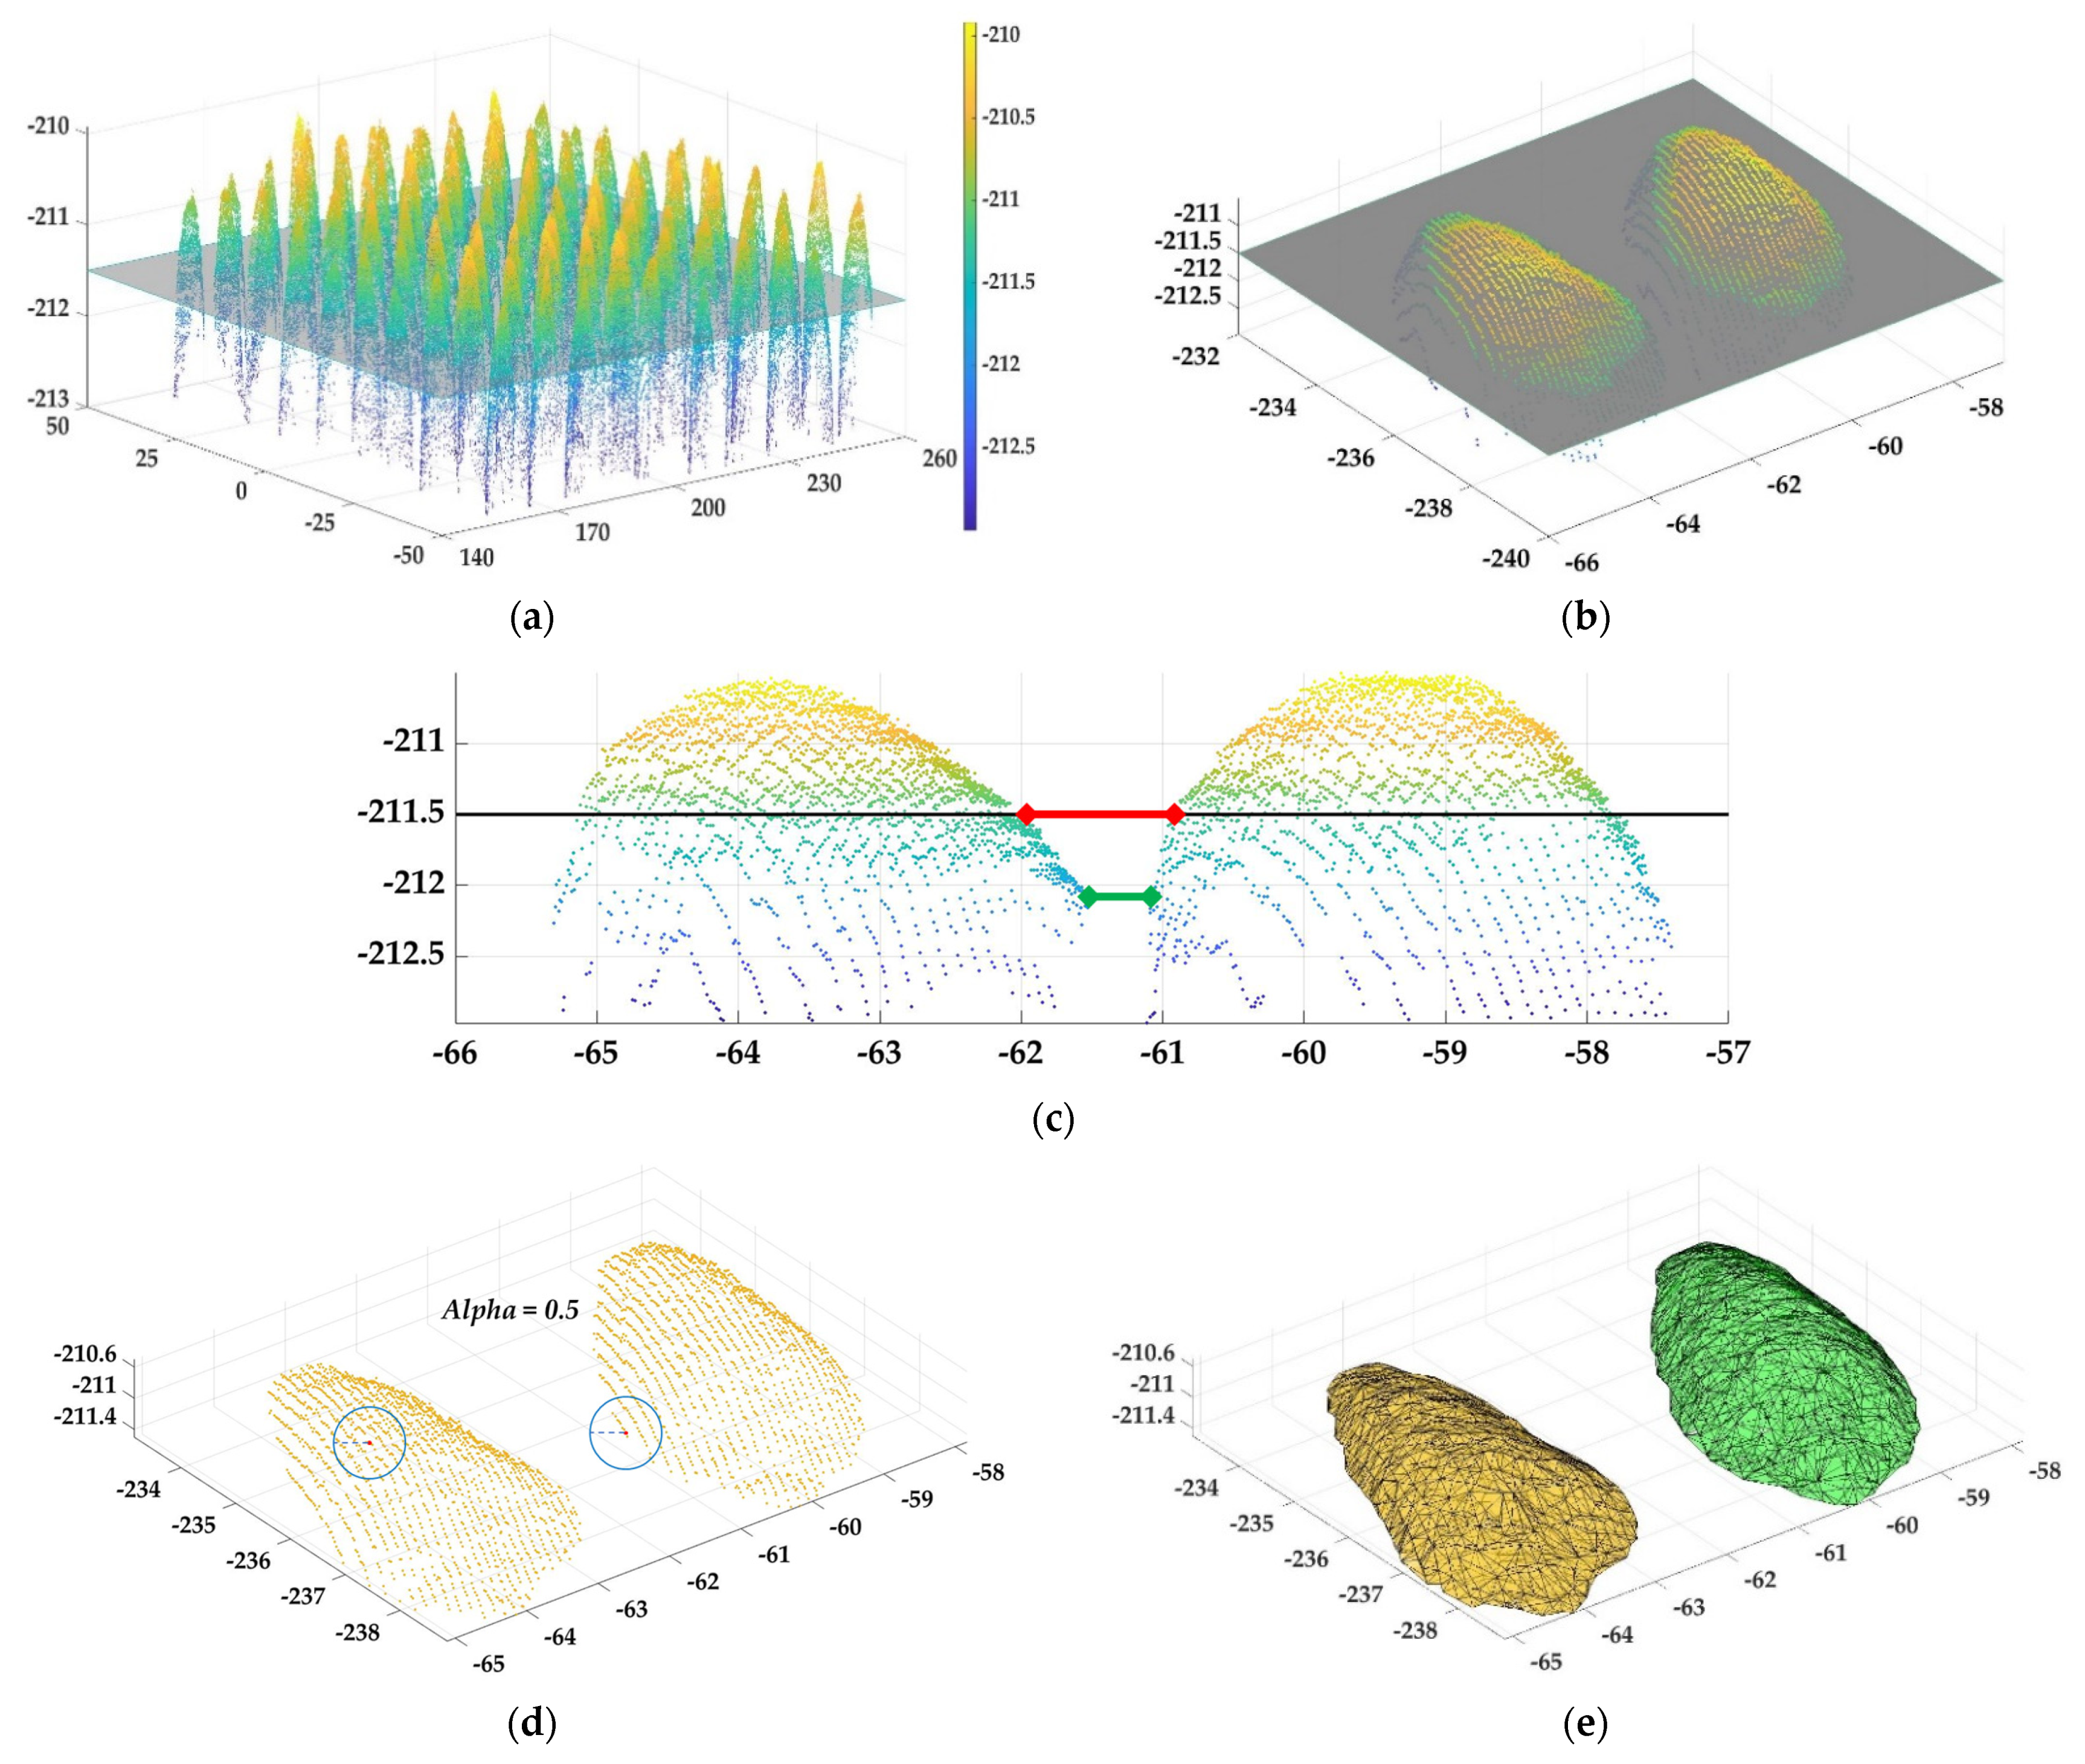
The raw point-cloud data contains both grain information and carrier information. It was necessary to segment the two objects to obtain useful grain point-cloud information. We set the segmentation plane threshold φ1, and the threshold size is related to the height of the carrier table from the binocular camera, as shown in Figure 5b. The horizontal height of the carrier stage is fixed. After analyzing a large amount of data, it was concluded that φ1 = −213.00 can split the grain from the carrier stage. Figure 5a shows the original point cloud, where blue represents the carrier table, and yellow-green represents the grain. Figure 5c–e shows the extracted point clouds of the grains after segmentation.

2.3.3. Single-Grain Point-Cloud Extraction

In the experimental environment, the grains were spaced apart and split from each other more easily. However, there were also cases of grain adhesion. Therefore, we partitioned between grains under more extreme conditions to obtain more reliable single grain. First, setting a segmentation plane threshold φ2 to split grain point cloud into two parts: the upper and lower parts. Second, the AlphaShape function method for constructing polyhedra from points was used for the upper part [33]. By setting the Alpha shape radius value, the upper part of grains could be clustered into different polyhedra. Final, for the lower part of the point cloud, each point was classified to its nearest polyhedron.
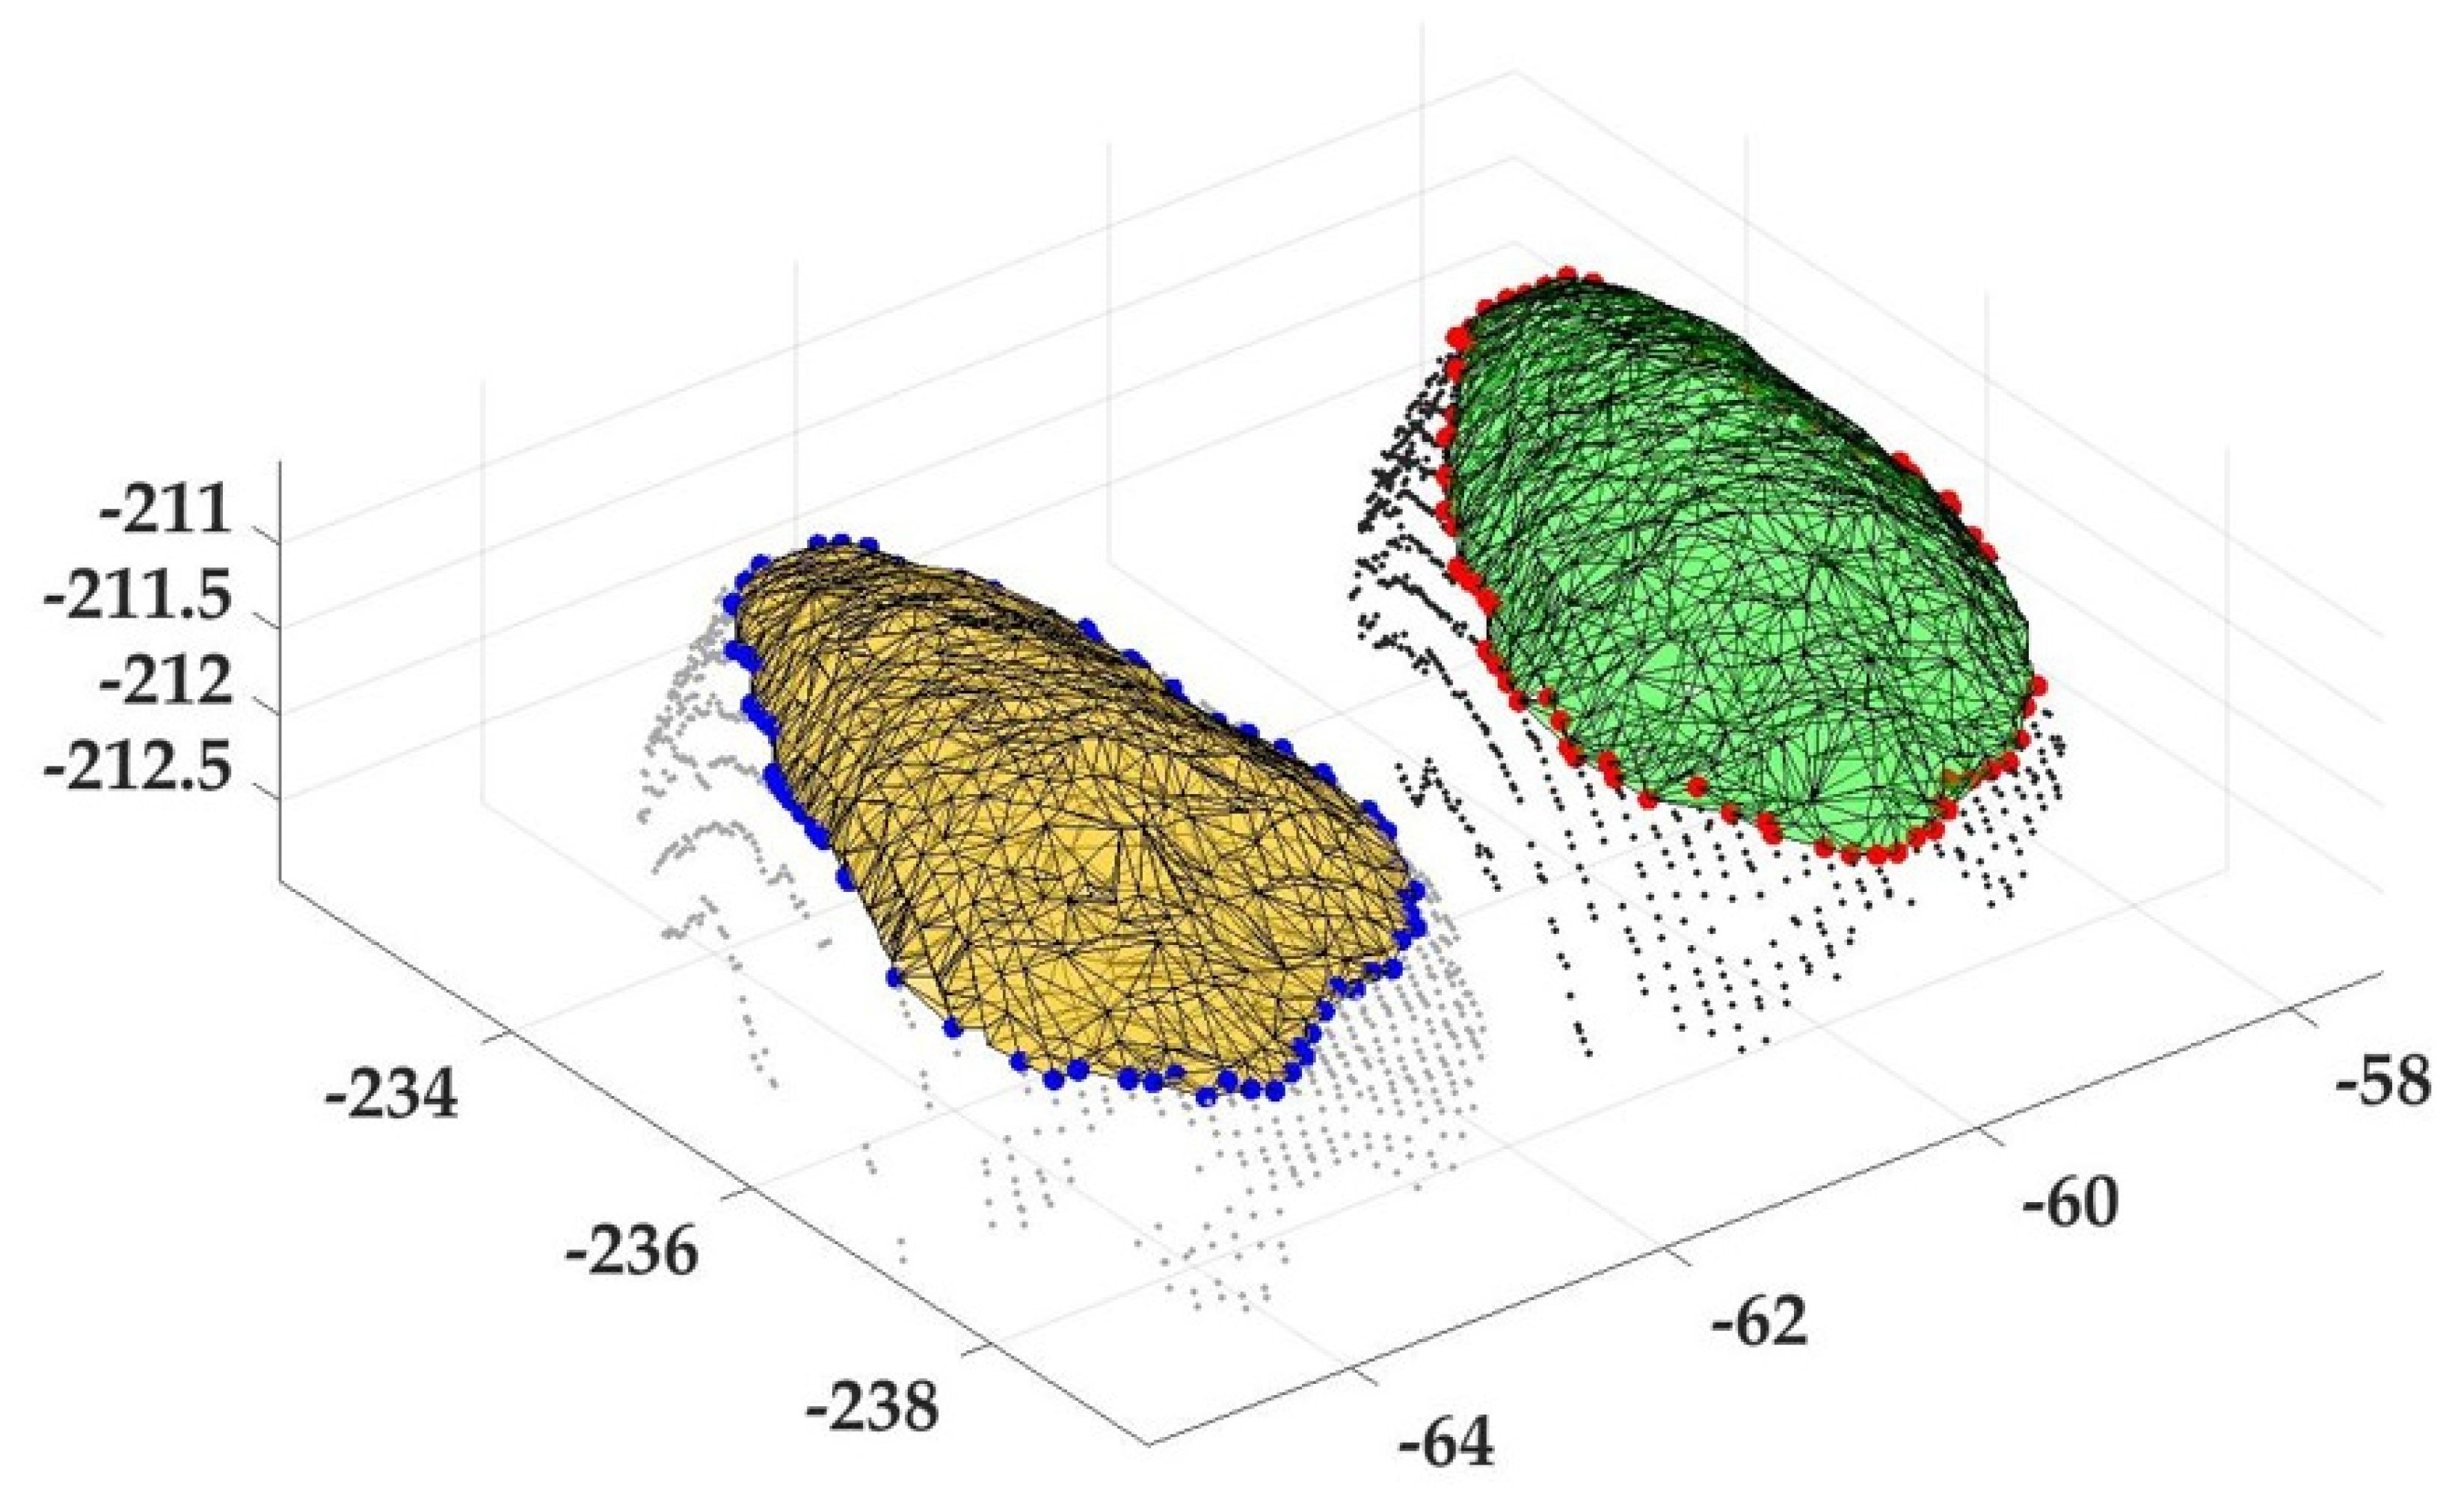
Usually, the thickness of the grain was not less than 2 mm, and setting the segmentation plane φ2 = −211.5, which allowed for the easily splitting of the grain point cloud into two parts: the upper and lower parts (Figure 6a,b). As can be seen in Figure 6c, the red line distance is larger than the green line distance, which ensured that the right radius was used to categorize the different grain point clouds. Setting the Alpha shape radius α = 0.5, which could accurately cluster the grain point clouds of the same category together (Figure 6d). Thus, the upper part of the grain point cloud was grouped into different polyhedra (Figure 6e) to extract the upper part of a single grain point cloud. For the lower part of the point cloud, classifying the point to its nearest polyhedron and repeating this until the ending classification of all of the lower parts of the point cloud (Figure 7).

2.3.4. 3D Model Construction

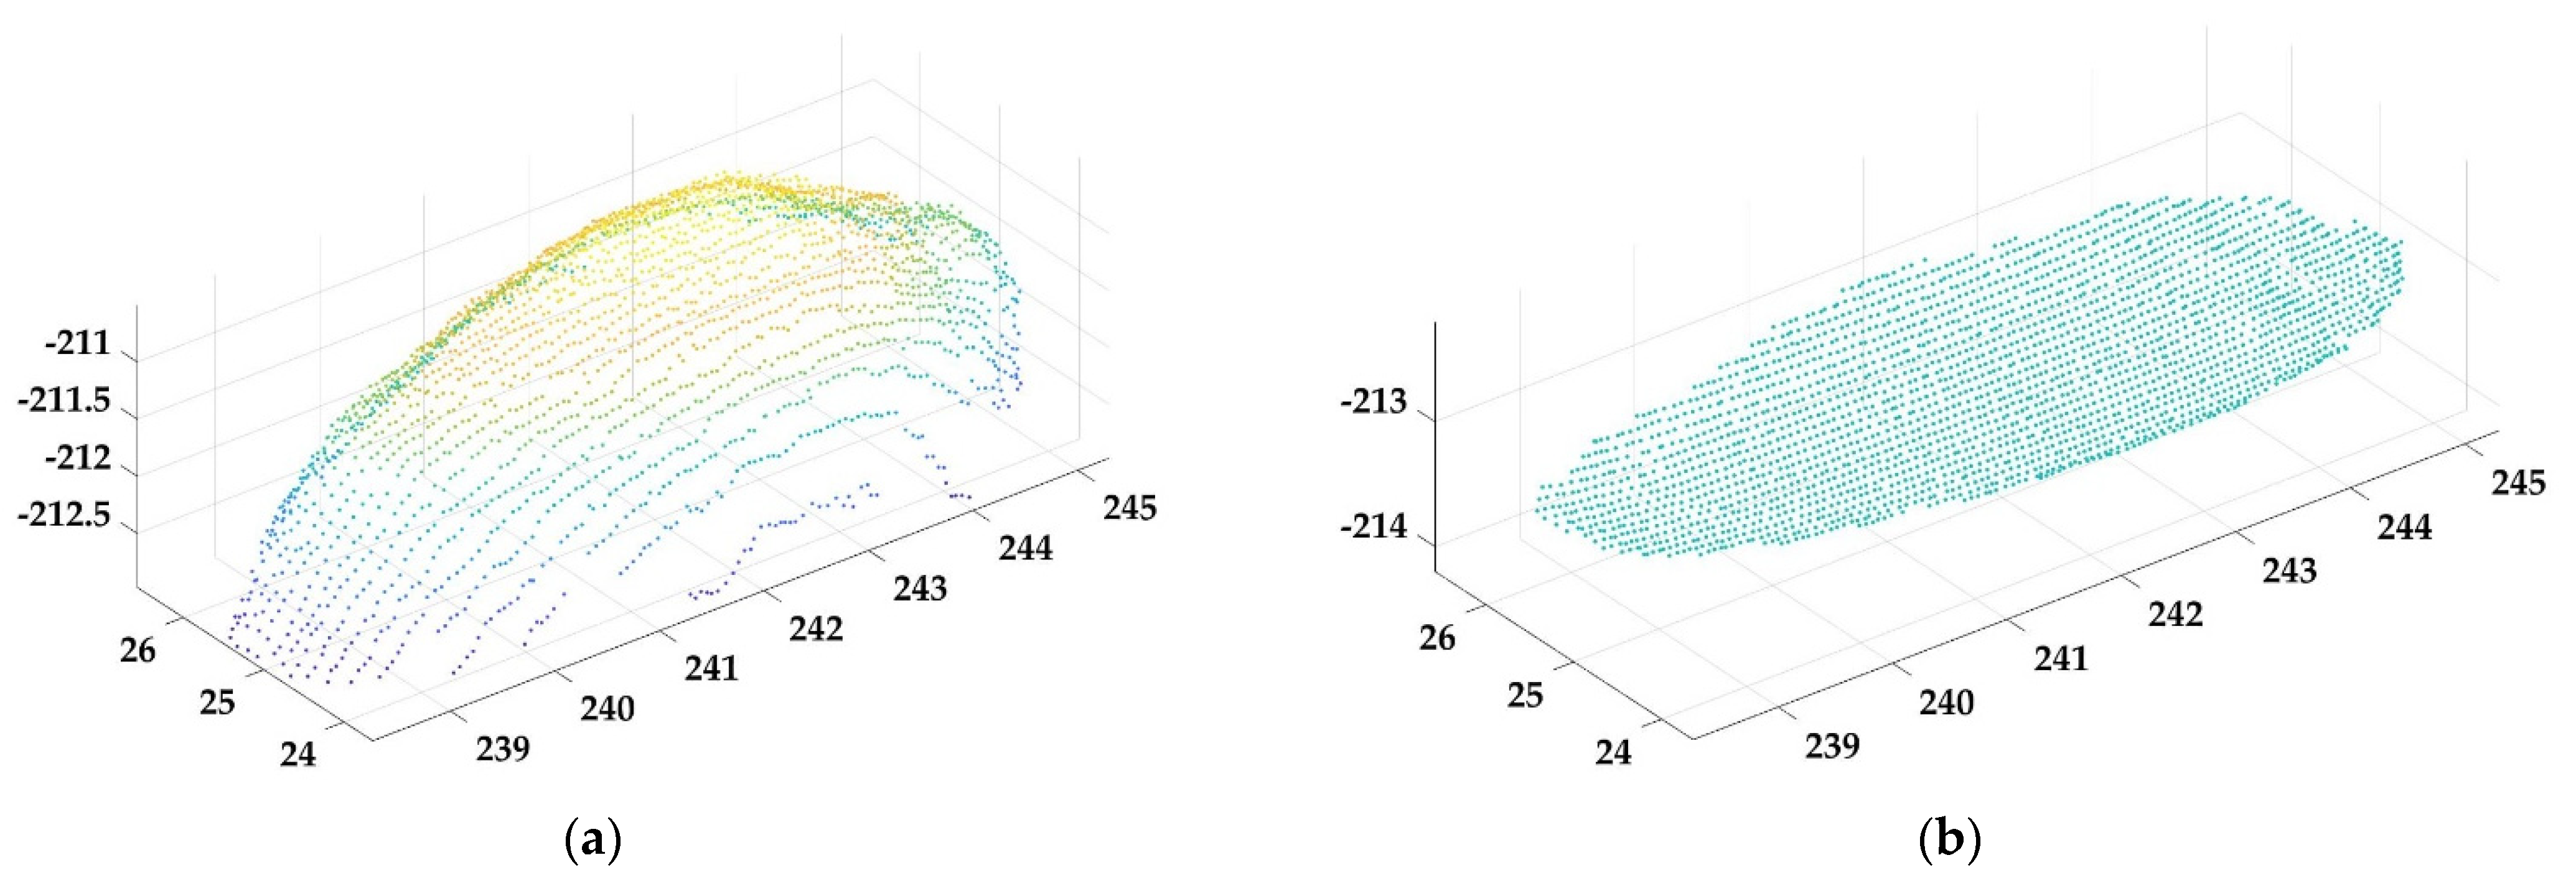
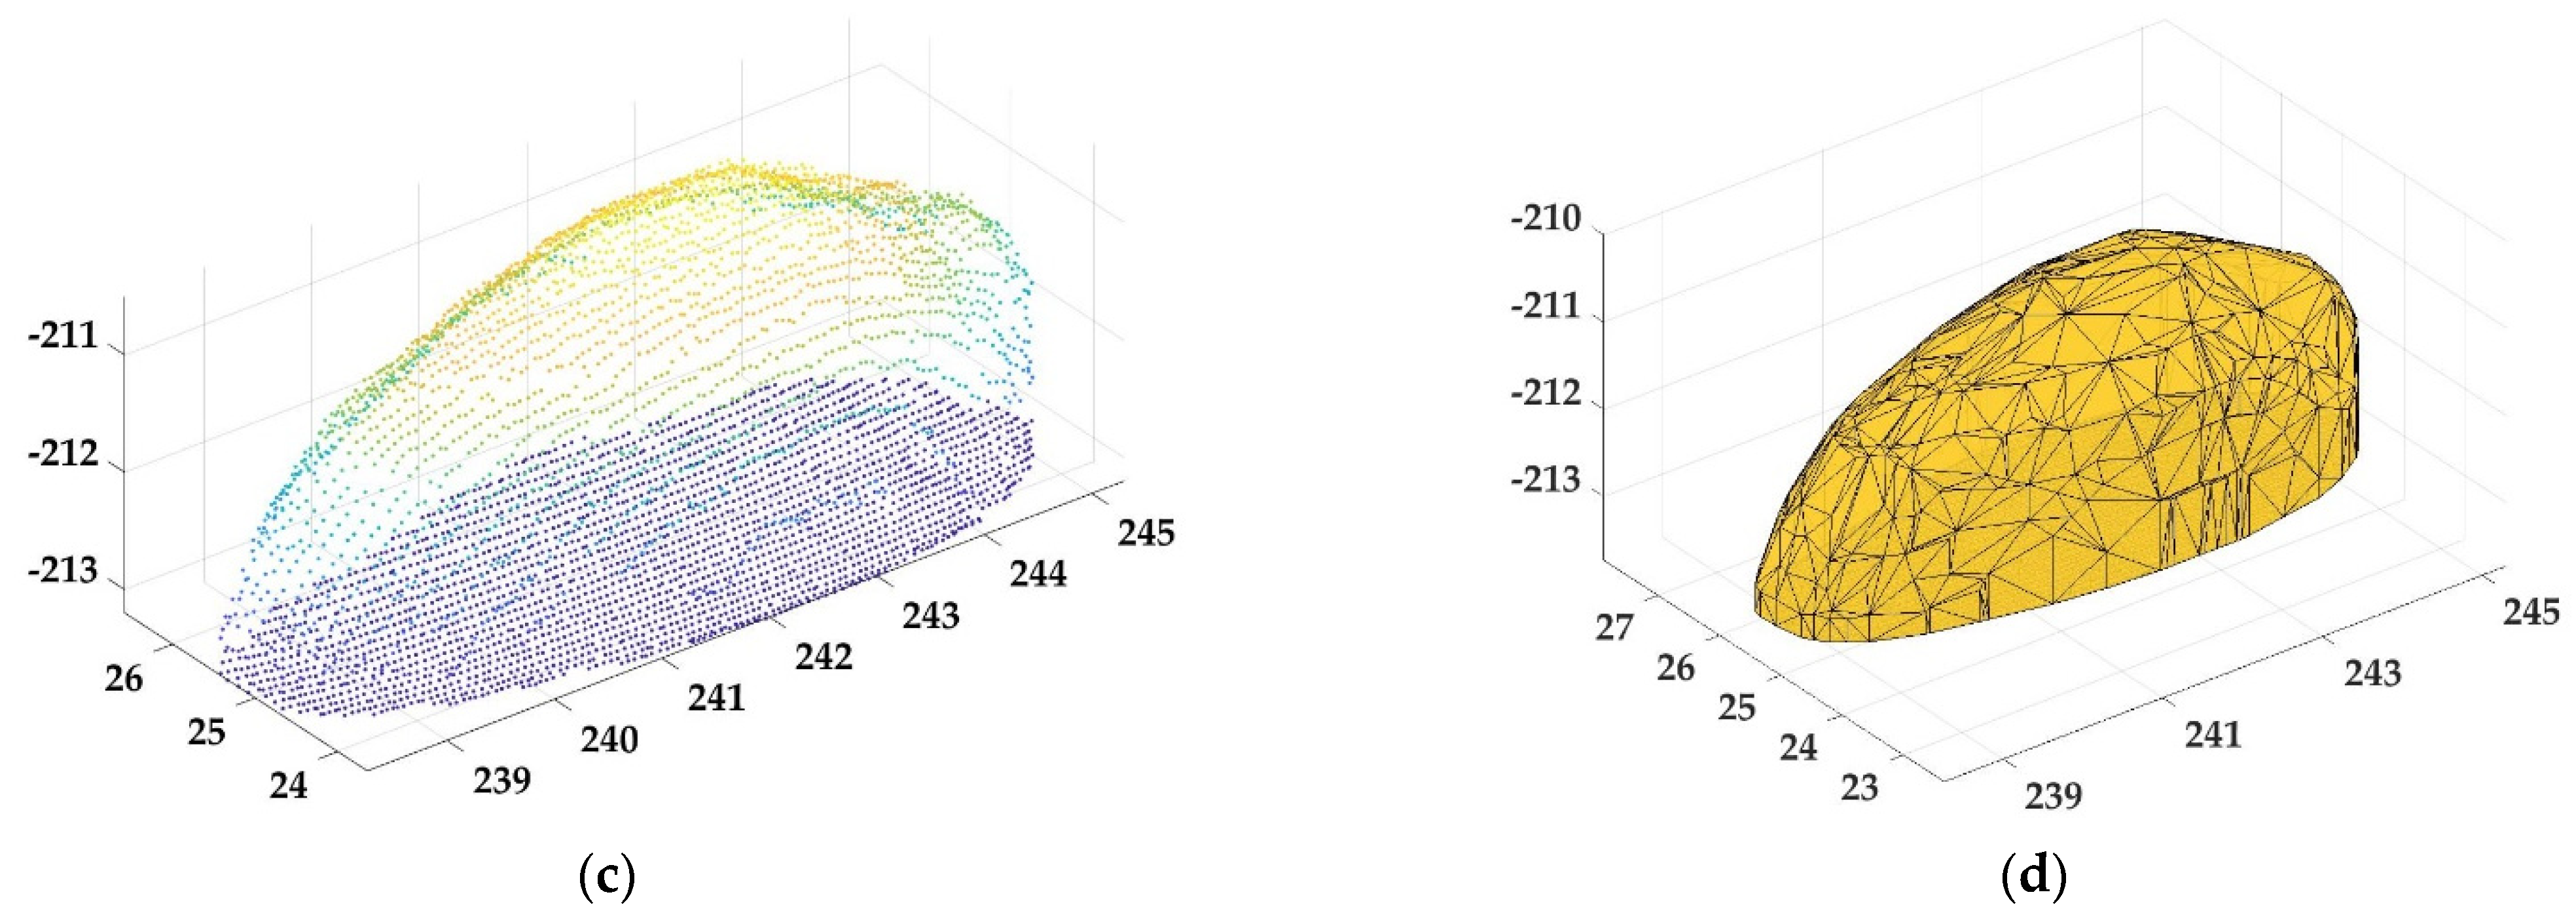
All the grain point-cloud data were taken from the grain frontal scan. To construct a complete 3D grain body, the grain bottom needed to be obtained. Using overhead projection to project all grain point clouds to the height level of the carrier table, which could simulate the bottom of the grains (Figure 8b). Combining it with the bottomless point cloud (Figure 8a) to obtain a complete grain point cloud (Figure 8c). Again, setting the Alpha shape radius α = 0.5, which clustered all point clouds into a complete 3D model of the grains (Figure 8d).

2.3.5. 3D Morphological Feature Calculation

The grain length and width were calculated based on the minimum bounding rectangle (MBR) method on the bottom of the grain obtained after mapping. The grain thickness (T) is the difference between the maximum value of the grain on the Z-axis and the Z-axis value of the carrier table. The formula used to calculate it is as follows:
T = Z m a x Z r e f ,
where Z m a x is the maximum coordinate point of the grain in the Z-axis direction, and Z r e f is the coordinate of the carrier table in the Z-axis.
Volumes of more complicated polyhedra may not have simple formulas. Volumes of such polyhedra may be computed by subdividing the polyhedron into smaller pieces (for example, by triangulation). For example, the volume of a regular polyhedron can be computed by dividing it into congruent pyramids, with each pyramid having a face of the polyhedron as its base and the center of the polyhedron as its apex. In general, it can be derived from the divergence theorem, which states that the volume of a polyhedral solid is given by
V = 1 3 | F ( Q F · N F ) S ( F ) | ,
S ( F ) = i ( x i 1 + x i ) · ( y i 1 y i ) / 2 ,
where the sum (S) is over the faces F of the polyhedron; Q F is an arbitrary point on face F ; N F is the unit vector perpendicular to F pointing outside the solid; and the multiplication dot is the dot product; x i and y i are the horizontal and vertical coordinates of each point on the surface.

2.4. Manual Measurement Indicators

High-precision electronic vernier calipers were used to measure the size of the longest, widest, and thickest parts of the grains. We marked and positioned 100 grains acquired from the 3D images to achieve matching of the manual measurement data with the data measured by the WG-3D platform.
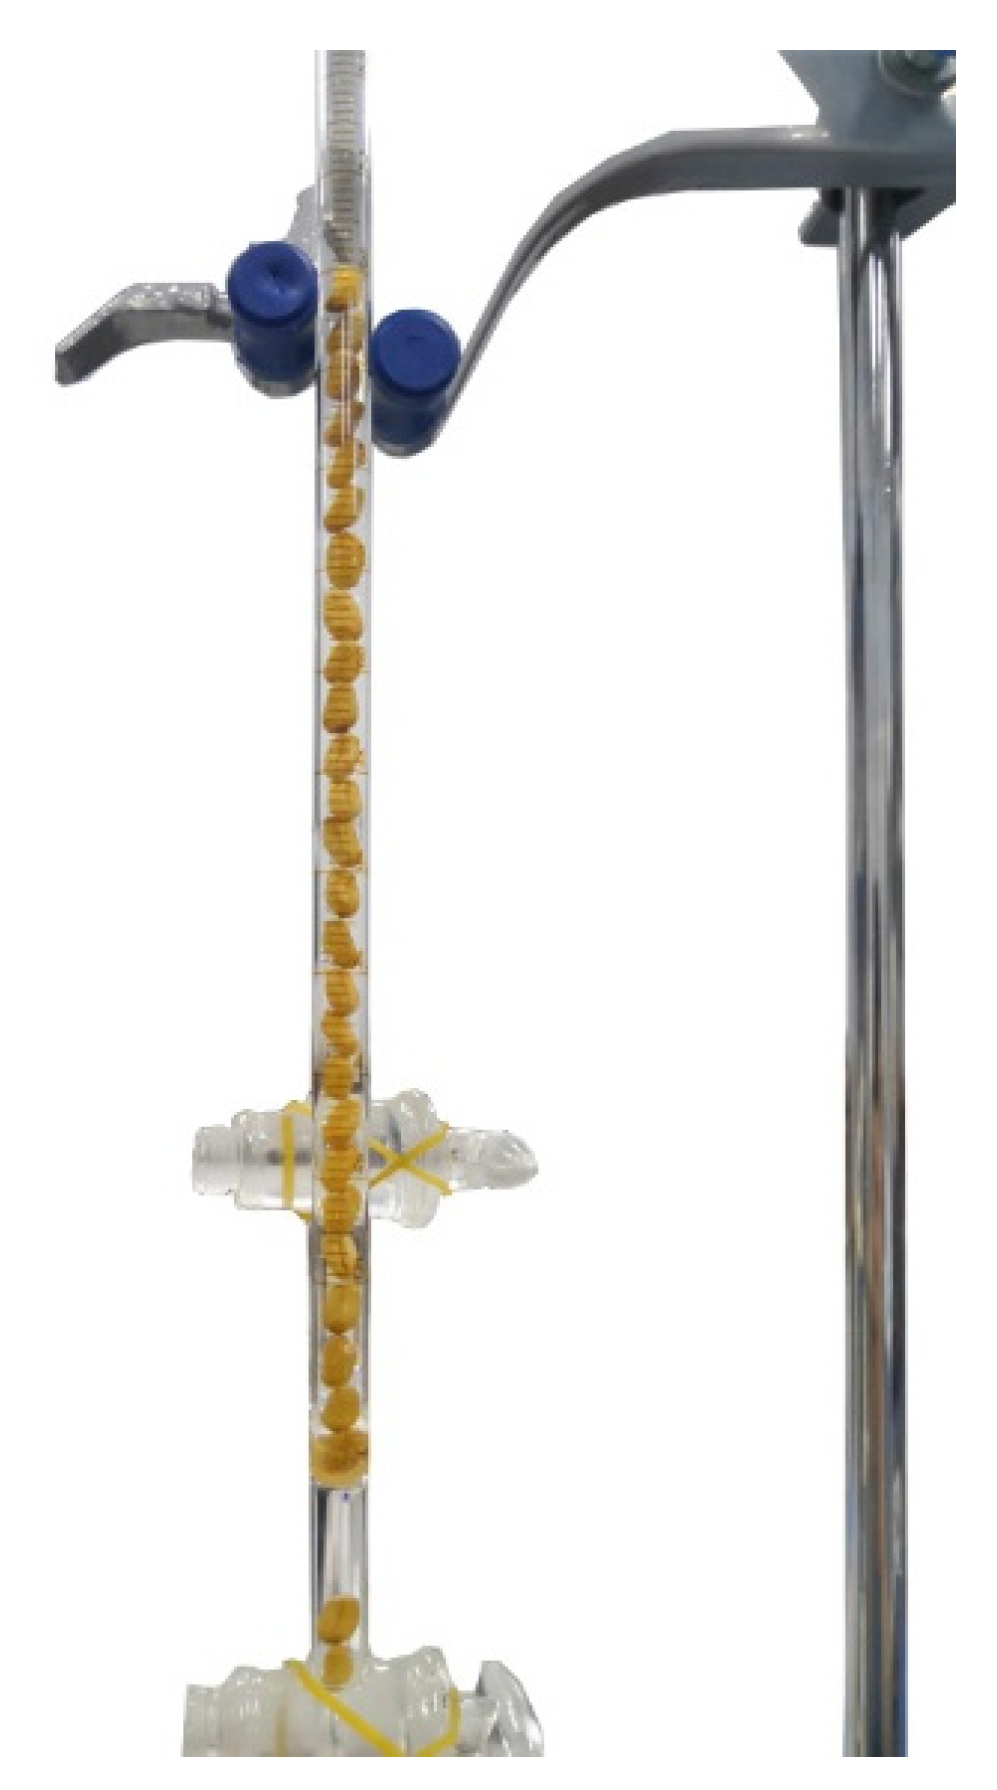
General methods of solid volume measurement include the sand discharge method and drainage method. These conventional methods are less effective because the volume of individual grains is too small, the accuracy of the measuring cylinder is not high, and water bubbles will be attached to the surface of the grains. This experiment used a high-precision burette as a volumetric measuring device (Figure 9), in which water was replaced with alcohol to reduce the air bubbles adhering to the surface of the grains. We divided 100 grains into 10 groups and took readings for each of the sunken 10 grains to obtain the total volume of the 10 grains.

2.5. Evaluation Indicators

The root mean square error (RMSE) and mean absolute percentage error (MAPE) were used to evaluate the WG-3D measurement accuracy. The formulae are as follows:
R M S E = i ( x i y i ) 2 n
M A P E = 1 n i | x i y i | y i × 100 %
where x i is the WG-3D measurement, y i the manual measurement, and n is the number of grains.

2.6. Data Processing and Analysis Software

The point-cloud data processing software was MATLAB R2019a, and IBM SPSS Statistics 26 and Microsoft Excel 2019 Professional Edition were used for data analysis and plotting.

3. Results

3.1. Measurement Accuracy

This research verified the usefulness of the grain 3D model construction by assessing the accuracy of four indicators: length, width, thickness, and volume. The WG-3D measurements of 100 grains of three varieties were compared with manual measurements at a carrier table moving speed of 25 mm/s. The results are shown in Table 2. The measurement error of length, width, and thickness of three varieties was at the same level, and the RMSE was about 0.20 mm. Length was lower than width and thickness in the MAPE evaluation index due to its large base number. The volume data are the total value of the measured 10 grains. The measurement error of volume fluctuated among varieties, and the RMSE was within 20.00 mm3. From the distribution of all samples (Figure 10), the manual measurement data and WG-3D measurement data were evenly distributed around the 1:1 line. The RMSE and MAPE of the length were 0.2256 mm and 2.60%. The RMSE and MAPE of the width were 0.2154 mm and 5.83%. The RMSE and MAPE of the thickness were 0.2119 mm and 5.81%. The RMSE and MAPE of the volume were 1.7740 mm3 and 4.31%. Overall, the measurement accuracy of the four indicators was relatively reliable. This indicates that our method can be used as an effective means for high-throughput acquisition of 3D information of wheat grains.
In order to further evaluate the accuracy of the method proposed in this paper, 26 varieties of Yangmai series were tested. The results are shown in Table 3. There was no abnormal value, and the measurement accuracy of all varieties is good. The average RMSE and MAPE of the length were 0.2181 mm and 2.93%. The average RMSE and MAPE of the width were 0.1974 mm and 5.43%. The average RMSE and MAPE of the thickness were 0.2027 mm and 5.15%. The average RMSE and MAPE of the volume were 1.8997 mm3 and 4.61%. These results are consistent with the previous verification results, which shows that the method has strong robustness.

3.2. Measurement Efficiency

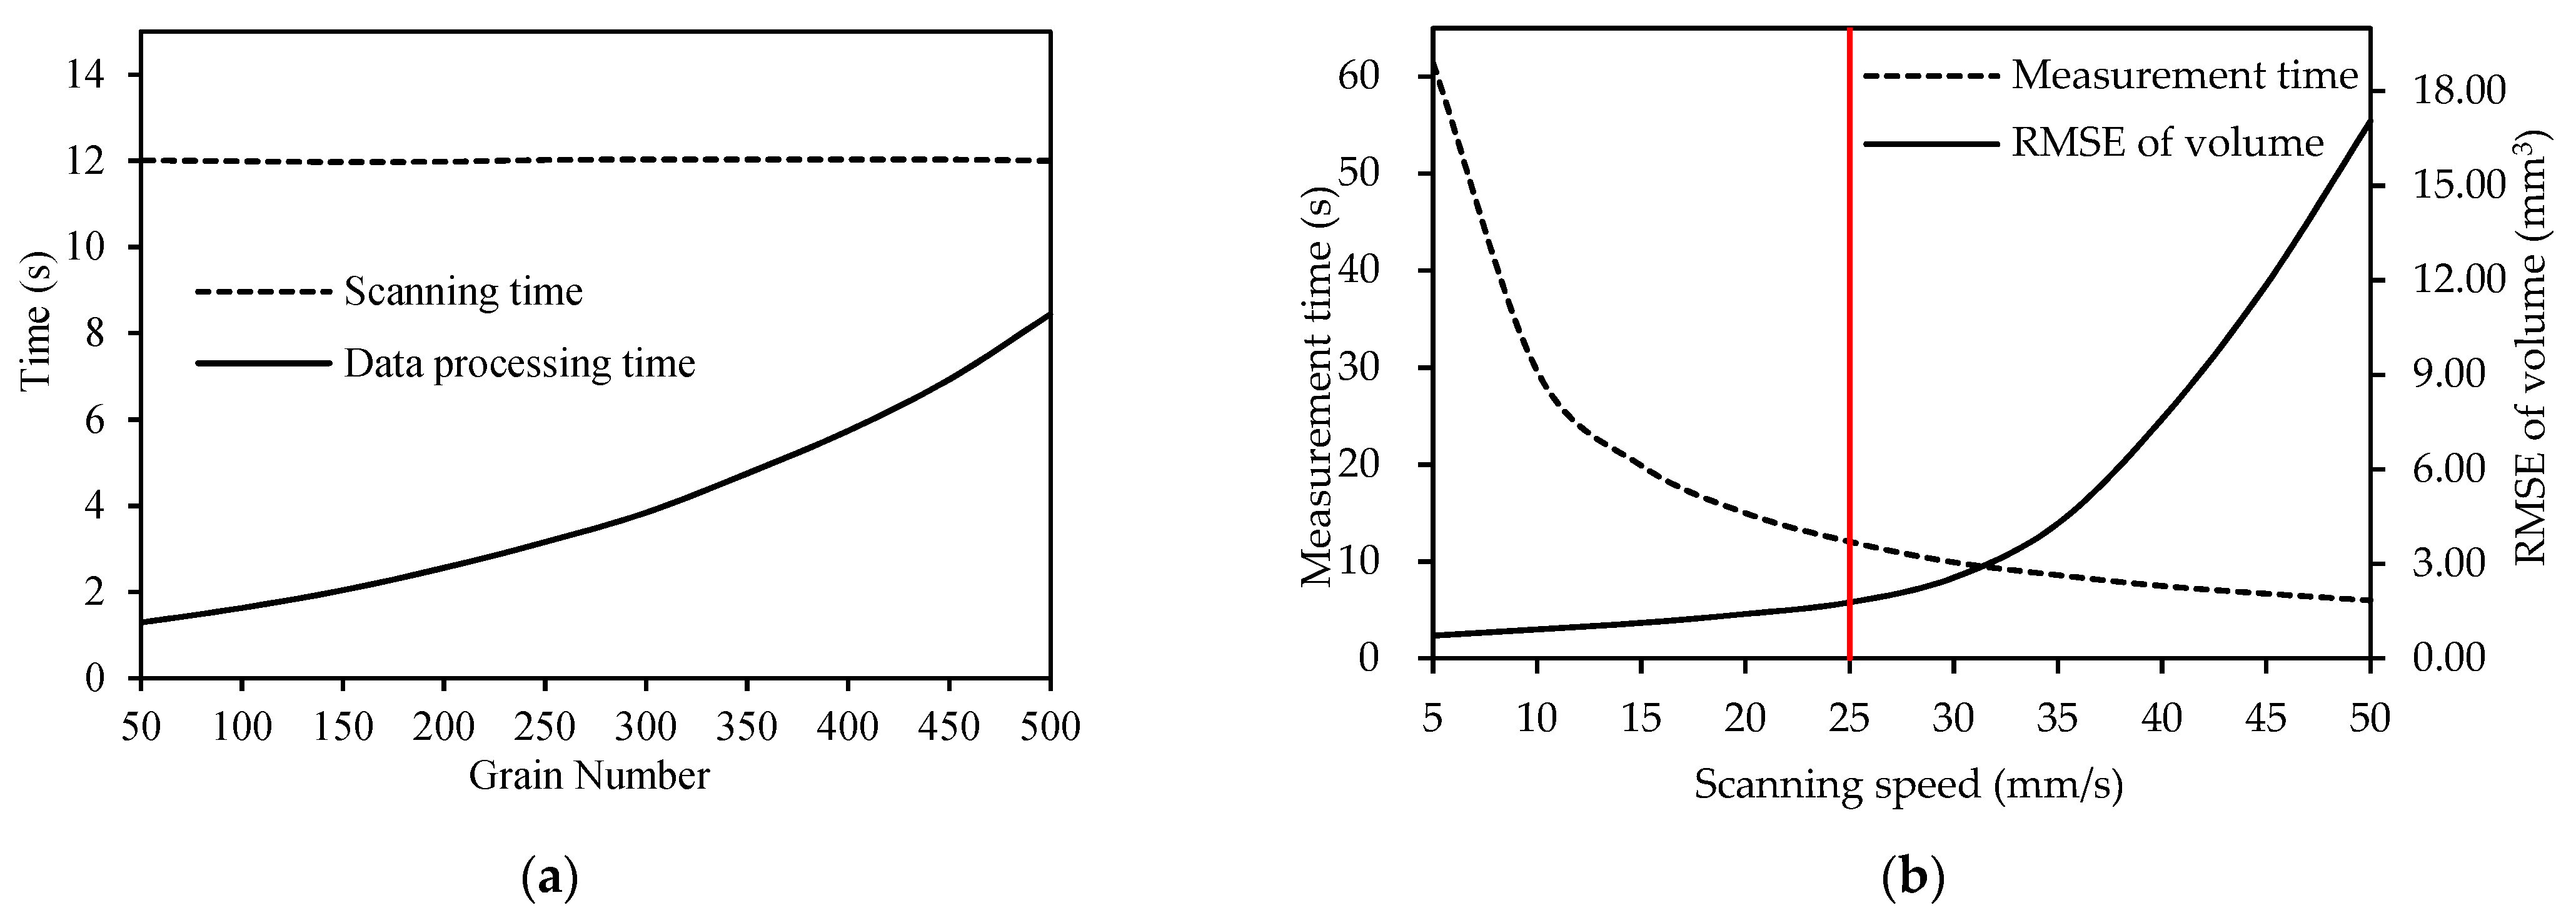
The WG-3D information acquisition platform can perform point-cloud data acquisition, 3D point-cloud data processing, and several indicator measurement tasks in real time. Therefore, evaluating the real-time measurement efficiency is necessary. The two main time-consuming blocks involved are the scan acquisition of the point-cloud data and the amount of calculation of the 3D point-cloud data processing and measurement indicators. The results are shown in Figure 11a at a carrier table scanning speed of 25 mm/s. The scanning time consumption was not affected, as the number of grains increased and remained stable at approximately 12 s. This is because we set the whole scanning process to scan the point-cloud data above the carrier (if there are no grains, only the carrier point-cloud data are available). Therefore, the total amount of point-cloud data remained the same at a constant scanning speed, and the time consumed was also stable. However, the time consumed for the processing of the grain 3D point-cloud data and the indicator measurement increased positively with the number of grains. At a scanning speed of 25 mm/s, the effective interval time (calculation time) for each batch was approximately 9 s. This enables automated wheat grain 3D data measurement in batches of up to 500 grains.
Usually, the slower that the carrier table is set to move, the slower the scanning speed will be, and the more amount of point-cloud data can be acquired with higher quality. To better balance the relationship between speed and quality, we tested 100 grains and compared the effect of different scanning speeds on the total measurement time consumed and RMSE. The results are shown in Figure 11b. If the speed is controlled within 30 mm/s, a high measurement accuracy can be effectively guaranteed. However, too-slow speed will seriously affect the efficiency. Therefore, 25 mm/s was set as the normal scanning speed, and the time consumed for one batch was around 14 s. Of course, this value is also related to the computer configuration, the number of measurement indicators, and the efficiency of the algorithm. The higher the computer configuration and the smaller the number of measurement indicators, the more efficient the algorithm will be, the faster the data processing will be, and the lower the time consumption will be.

4. Discussion

4.1. Comparison of Related Studies

The significance of 3D morphological traits of grains has attracted the attention of many researchers, and Table 4 shows the comparison result with related studies. The results shows that most of the methods used binocular cameras for its cheapness and high accuracy. Among them, the accuracy of reference [27] is the best, but this method only measures one grain at a time. Therefore, it is not suitable for mass screening scenarios because of its low efficiency. The methods in reference [34,35] and WG-3D-5 in this paper have the same accuracy level, while the former two do not measure volume parameters. In addition, they have unstable threshold segmentation results of two-dimensional images and low efficiency in obtaining point clouds from multiple angles. The accuracy and efficiency of reference [32] are good, but the measurement indicator is single. Compared with WG-3D-25, WG-3D-5 improves accuracy, but with reduced efficiency. Therefore, the proposed method can meet the challenges of different grain morphology measurement.

4.2. 3D Morphological Cluster Analysis

Based on the rapid batch measurement of grain 3D morphology, the 3D morphological traits such as length, width, thickness, and volume were used as cluster analysis variables for the stratified clustering of Yangmai series varieties. As shown in Table 5 and Figure 12, the differences in grain 3D morphology were small, and the Yangmai series varieties could be classified into two classes at the genetic distance of 5-level. The first category is dominated by small-grain wheat, with the volume generally not exceeding 35 mm3, including Y 1#, Y 2#, Y 3#, Y 6#, Y 12#, Y 16#, Y 22#, Y 23#, and Y 158. The second category was dominated by large-grain wheat with a volume of more than 35 mm3 and included Y 4#, Y 5#, Y 10#, Y 11#, Y 13#, Y 14#, Y 15#, Y 17#, Y 18#, Y 19#, Y 20#, Y 21#, Y 24#, Y 25#, Y 26#, Y 27#, and Y 28#. Zhang et al. [36] clustered the Yangmai series varieties into two categories using different quality traits as variables, which was supported by the results of genealogical analysis. The results of the present study are similar to their findings, such as Y 158 being the genetic basis of the strong-gluten and small-grain varieties of Yangmai, Y 23# being inherited from Y 16#, and Y 16# being inherited from Y 158 superior line Yang91F138. Yang80Jian3 and Ningmai No.9 are the genetic basis of the weak-gluten and large-grain varieties of Yangmai, Y 15# is inherited from Yang 89-40, and Yang 89-40 is inherited from Yang80Jian3; Y 20# and Y 13# are also inherited from Yang80Jian3; Y 18# and Y 21# are inherited from Ningmai No.9.

4.3. Advantages and Disadvantages

The WG-3D phenotyping platform has obvious advantages. First, it enables auto-mated high-throughput acquisition of grain 3D indicators at a higher level of accuracy. Second, it uses a line laser binocular camera (which costs only a few hundred dollars) to greatly reduce the cost compared to other expensive 3D acquisition equipment (which can cost up to tens of thousands of dollars for tomography). In addition, it can acquire RGB color information and fuse it into RGBD point-cloud data. The grain color characteristics can be analyzed effectively. It is not limited to morphological indicators and will be de-veloped for more indicators, such as surface area, curvature, and roughness. However, there are also some shortcomings of the platform. When the back side of the grain belly is placed facing upward, it causes the grain to be tilted at an angle. This is not suitable for horizontal scanning. Therefore, it is currently recommended to scan only the frontal point-cloud data of the grain. The 3D point-cloud data and indicator parameters about the grain belly back are not available. In the future, we will consider how to achieve a standard for grain belly balance, such as by designing notches in the carrier table.

5. Conclusions

Grain 3D morphological indicators have good application value and research prospects. This study developed a low-cost WG-3D platform for high-throughput acquisition of wheat grain 3D indicators to lay the foundation for the in-depth study of grain 3D characteristics. The platform uses a line laser binocular camera to capture high-quality point-cloud data. It realizes the construction of grain 3D models using point-cloud segmentation, finding, clustering, projection, and reconstruction. The grain length and width information are calculated using the MBR method. The grain thickness is calculated using height difference. The grain volume is calculated using the division method to derive the irregular polyhedral volume. Validation of the manual measurement data proved that the WG-3D platform can achieve an effective and reliable accuracy level. The platform also has high efficiency in point-cloud scanning and parameter calculation. It is a reliable platform for high-throughput acquisition of wheat grain 3D indicators and lays the foundation for in-depth study of other grain 3D morphologies.

Author Contributions

Conceptualization, W.W., X.Z., T.S. and S.L.; methodology, W.W.; software, W.W.; validation, Y.Z. and H.W.; formal analysis, W.W.; investigation, Y.Z. and T.Y.; resources, X.Z., H.W., C.S. and T.S.; data curation, Y.Z., H.W. and T.Y.; writing—original draft preparation, W.W. and Y.Z.; writing—review and editing, X.Z. and S.L.; visualization, W.W.; supervision, X.Z. and S.L.; project administration, X.Z., S.L. and T.L.; funding acquisition, Y.H., T.L., C.S. and S.L. All authors have read and agreed to the published version of the manuscript.

Funding

This research was funded by Central Public-interest Scientific Institution Basal Research Fund (JBYW-AII-2022-09, JBYW-AII-2022-16, JBYW-AII-2022-17), Science and Technology Innovation Project of Chinese Academy of Agricultural Sciences (CAAS-ASTIP-2016-AII), Special Fund for Independent Innovation of Agricultural Science and Technology in Jiangsu, China (CX(21)3065, CX(21)3063), National Natural Science Foundation of China (32172110, 32001465, 31872852), the Key Research and Development Program (Modern Agriculture) of Jiangsu Province (BE2020319), Supported by Bingtuan Science and Technology Program (2021DB001).

Institutional Review Board Statement

Not applicable.

Data Availability Statement

Not applicable.

Acknowledgments

We thank LetPub (www.letpub.com (16 June 2022)) for its linguistic assistance during the preparation of this manuscript.

Conflicts of Interest

The authors declare no conflict of interest.

References

  1. Dixon, L.E.; Pasquariello, M.; Badgami, R.; Levin, K.A.; Poschet, G.; Ng, P.Q.; Orford, S.; Chayut, N.; Adamski, N.M.; Brinton, J.; et al. MicroRNA-resistant alleles of HOMEOBOX DOMAIN-2 modify inflorescence branching and increase grain protein content of wheat. Sci. Adv. 2022, 8, eabn5907. [Google Scholar] [PubMed]
  2. Okamoto, Y.; Kajimura, T.; Ikeda, T.M.; Takumi, S. Evidence from principal component analysis for improvement of grain shape-and spikelet morphology-related traits after hexaploid wheat speciation. Genes Genet. Syst. 2012, 87, 299–310. [Google Scholar] [PubMed] [Green Version]
  3. Liu, X.; Mou, C.; Zhou, C.; Cheng, Z.; Jiang, L.; Wan, J. Research progress on cloning and regulation mechanism of rice grain shape genes. Chin. J. Rice Sci. 2018, 32, 1–11. [Google Scholar]
  4. Botwright, T.L.; Condon, A.G.; Rebetzke, G.J.; Richards, R.A. Field evaluation of early vigour for genetic improvement of grain yield in wheat. Aust. J. Agric. Res. 2002, 53, 1137–1145. [Google Scholar]
  5. Chastain, T.G.; Ward, K.J.; Wysocki, D.J. Stand establishment response of soft white winter wheat to seedbed residue and seed size. Crop Sci. 1995, 35, 213–218. [Google Scholar] [CrossRef]
  6. Kumar, A.; Mantovani, E.E.; Seetan, R.; Soltani, A.; Echeverry-Solarte, M.; Jain, S.; Simsek, S.; Doehlert, D.; Alamri, M.S.; Elias, E.M.; et al. Dissection of genetic factors underlying wheat kernel shape and size in an elite x nonadapted cross using a high density SNP linkage map. Plant. Genome 2016, 9, 1–22. [Google Scholar]
  7. Breseghello, F.; Sorrells, M.E. QTL analysis of kernel size and shape in two hexaploid wheat mapping populations. Field. Crop Res. 2007, 101, 172–179. [Google Scholar]
  8. Ramya, P.; Chaubal, A.; Kulkarni, K.; Gupta, L.; Kadoo, N.; Dhaliwal, H.S.; Chhuneja, P.; Lagu, M.; Gupt, V. QTL mapping of 1000-kernel weight, kernel length, and kernel width in bread wheat (Triticum aestivum L.). J. Appl. Genet. 2010, 51, 421–429. [Google Scholar]
  9. Williams, K.; Munkvold, J.; Sorrells, M. Comparison of digital image analysis using elliptic Fourier descriptors and major dimensions to phenotype seed shape in hexaploid wheat (Triticum aestivum L.). Euphytica 2013, 190, 99–116. [Google Scholar]
  10. Su, Z.; Jin, S.; Lu, Y.; Zhang, G.; Chao, S.; Bai, G. Single nucleotide polymorphism tightly linked to a major QTL on chromosome 7A for both kernel length and kernel weight in wheat. Mol. Breed. 2016, 36, 15. [Google Scholar]
  11. Campbell, K.G.; Bergman, C.J.; Gualberto, D.G.; Anderson, J.A.; Giroux, M.J.; Hareland, G.; Gary Fulcher, R.; Sorrells, M.E.; Finney, P.L. Quantitative trait loci associated with kernel traits in a soft× hard wheat cross. Crop Sci. 1999, 39, 1184–1195. [Google Scholar] [CrossRef]
  12. Gegas, V.C.; Nazari, A.; Griffiths, S.; Simmonds, J.; Fish, L.; Orford, S.; Sayers, L.; Doonan, J.H.; Snape, J.W. A genetic framework for grain size and shape variation in wheat. Plant Cell 2010, 22, 1046–1056. [Google Scholar] [CrossRef] [PubMed] [Green Version]
  13. Abdipour, M.; Ebrahimi, M.; Izadi-Darbandi, A.; Mastrangelo, A.M.; Najafian, G.; Arshad, Y.; Mirniyam, G. Association between grain size and shape and quality traits, and path analysis of thousand grain weight in Iranian bread wheat landraces from different geographic regions. Not. Bot. Horti Agrobot. 2016, 44, 228–236. [Google Scholar] [CrossRef] [Green Version]
  14. Cheng, R.; Kong, Z.; Zhang, L.; Xie, Q.; Jia, H.; Yu, D.; Huang, Y.; Ma, Z. Mapping QTLs controlling kernel dimensions in a wheat inter-varietal RIL mapping population. Theor. Appl. Genet. 2017, 130, 1405–1414. [Google Scholar] [CrossRef]
  15. Kaur, H.; Singh, B. Classification and grading rice using multi-class SVM. Int. J. Sci. Res. Publ. 2013, 3, 1–5. [Google Scholar]
  16. Wu, W.; Yang, T.; Li, R.; Chen, C.; Liu, T.; Zhou, K.; Sun, C.; Li, C.; Zhu, X.; Guo, W. Detection and enumeration of wheat grains based on a deep learning method under various scenarios and scales. J. Integr. Agric. 2020, 19, 1998–2008. [Google Scholar] [CrossRef]
  17. Mahajan, S.; Das, A.; Sardana, H.K. Image acquisition techniques for assessment of legume quality. Trends Food. Sci. Technol. 2015, 42, 116–133. [Google Scholar] [CrossRef]
  18. Guindo, D.; Davrieux, F.; Teme, N.; Vaksmann, M.; Doumbia, M.; Fliedel, G.; Bastianelli, D.; Verdeil, J.L.; Mestres, C.; Kouressy, M.; et al. Pericarp thickness of sorghum whole grain is accurately predicted by NIRS and can affect the prediction of other grain quality parameters. J. Cereal Sci. 2016, 69, 218–227. [Google Scholar] [CrossRef]
  19. Lu, L.; Deng, S.; Zhu, Z.; Tian, S. Classification of rice by combining electronic tongue and nose. Food Anal. Method 2015, 8, 1893–1902. [Google Scholar] [CrossRef]
  20. Ferreira, D.S.; Pallone, J.A.L.; Poppi, R.J. Direct analysis of the main chemical constituents in Chenopodium quinoa grain using Fourier transform near-infrared spectroscopy. Food Control 2015, 48, 91–95. [Google Scholar] [CrossRef]
  21. Guelpa, A.; du Plessis, A.; Kidd, M.; Manley, M. Non-destructive estimation of maize (Zea mays L.) kernel hardness by means of an X-ray micro-computed tomography (μCT) density calibration. Food Bioprocess Technol. 2015, 8, 1419–1429. [Google Scholar] [CrossRef]
  22. Ravikanth, L.; Singh, C.B.; Jayas, D.S.; White, N.D. Classification of contaminants from wheat using near-infrared hyperspectral imaging. Biosyst. Eng. 2015, 135, 73–86. [Google Scholar] [CrossRef]
  23. Pearson, T. High-speed sorting of grains by color and surface texture. Appl. Eng. Agric. 2010, 26, 499–505. [Google Scholar] [CrossRef]
  24. Golpour, I.; Chayjan, R.A. Identification and classification of bulk paddy, brown, and white rice cultivars with colour features extraction using image analysis and neural network. Czech J. Food Sci. 2014, 32, 280–287. [Google Scholar] [CrossRef] [Green Version]
  25. Anami, B.S.; Naveen, N.M.; Hanamaratti, N.G. Behavior of HSI color co-occurrence features in variety recognition from bulk paddy grain image samples. Int. J. Signal Process. Image Process. Pattern Recognit. 2015, 8, 19–30. [Google Scholar] [CrossRef]
  26. Dubosclard, P.; Larnier, S.; Konik, H.; Herbulot, A.; Devy, M. Automated visual grading of grain kernels by machine vision. In Proceedings of the Twelfth International Conference on Quality Control by Artificial Vision 2015, Le Creusot, France, 3–5 June 2015; SPIE: Bellingham, WA, USA, 2015; Volume 9534, pp. 112–119. [Google Scholar]
  27. Li, H.; Qian, Y.; Cao, P.; Yin, W.; Dai, F.; Hu, F.; Yan, Z. Calculation method of surface shape feature of rice seed based on point cloud. Comput. Electron. Agric. 2017, 142, 416–423. [Google Scholar] [CrossRef]
  28. Rungyaem, K.; Sukvichai, K.; Phatrapornnant, T.; Kaewpunya, A.; Hasegawa, S. Comparison of 3D Rice Organs Point Cloud Classification Techniques. In Proceedings of the 2021 25th International Computer Science and Engineering Conference (ICSEC), Chiang Rai, Thailand, 18–20 November 2021; pp. 196–199. [Google Scholar]
  29. Gong, L.; Du, X.; Zhu, K.; Lin, K.; Lou, Q.; Yuan, Z.; Huang, G.; Liu, C. Panicle-3D: Efficient Phenotyping Tool for Precise Semantic Segmentation of Rice Panicle Point Cloud. Plant Phenomics 2021, 2021, 9838929. [Google Scholar] [CrossRef]
  30. Sun, Y.; Luo, Y.; Chai, X.; Zhang, P.; Zhang, Q.; Xu, L.; Wei, L. Double-Threshold Segmentation of Panicle and Clustering Adaptive Density Estimation for Mature Rice Plants Based on 3D Point Cloud. Electronics 2021, 10, 872. [Google Scholar] [CrossRef]
  31. Rattanasuwan, P.; Kumazawa, I.; Kasetkasem, T. Non-destructive measurement of rice leaf dimension in 3D point cloud. IOP Conf. Ser. Earth Environ. Sci. 2021, 633, 012013. [Google Scholar] [CrossRef]
  32. Sun, C.; Berman, M.; Coward, D.; Osborne, B. Thickness measurement and crease detection of wheat grains using stereo vision. Pattern Recogn. Lett. 2007, 28, 1501–1508. [Google Scholar] [CrossRef]
  33. Gardiner, J.D.; Behnsen, J.; Brassey, C.A. Alpha shapes: Determining 3D shape complexity across morphologically diverse structures. BMC Evol. Biol. 2018, 18, 184. [Google Scholar] [CrossRef] [PubMed]
  34. Zhong, X.; Chen, W.; Liu, T.; Hao, X.; Li, Z.; Sun, C. Three-dimensional information measurement of wheat grain based on image technology. Guangdong Agric. Sci. 2016, 43, 150–155. [Google Scholar]
  35. Qin, Z.; Zhang, Z.; Hua, X.; Yang, W.; Liang, X.; Zhai, R.; Huang, C. Cereal grain 3D point cloud analysis method for shape extraction and filled/unfilled grain identification based on structured light imaging. Sci. Rep. 2022, 12, 3145. [Google Scholar] [CrossRef]
  36. Zhang, X.; Li, M.; Liu, D.; Jiang, W.; Zhang, Y.; Gao, D. Analysis of quality traits and breeding inspiration in Yangmai series wheat varieties. Sci. Agric. Sin. 2020, 53, 1309–1321. [Google Scholar]
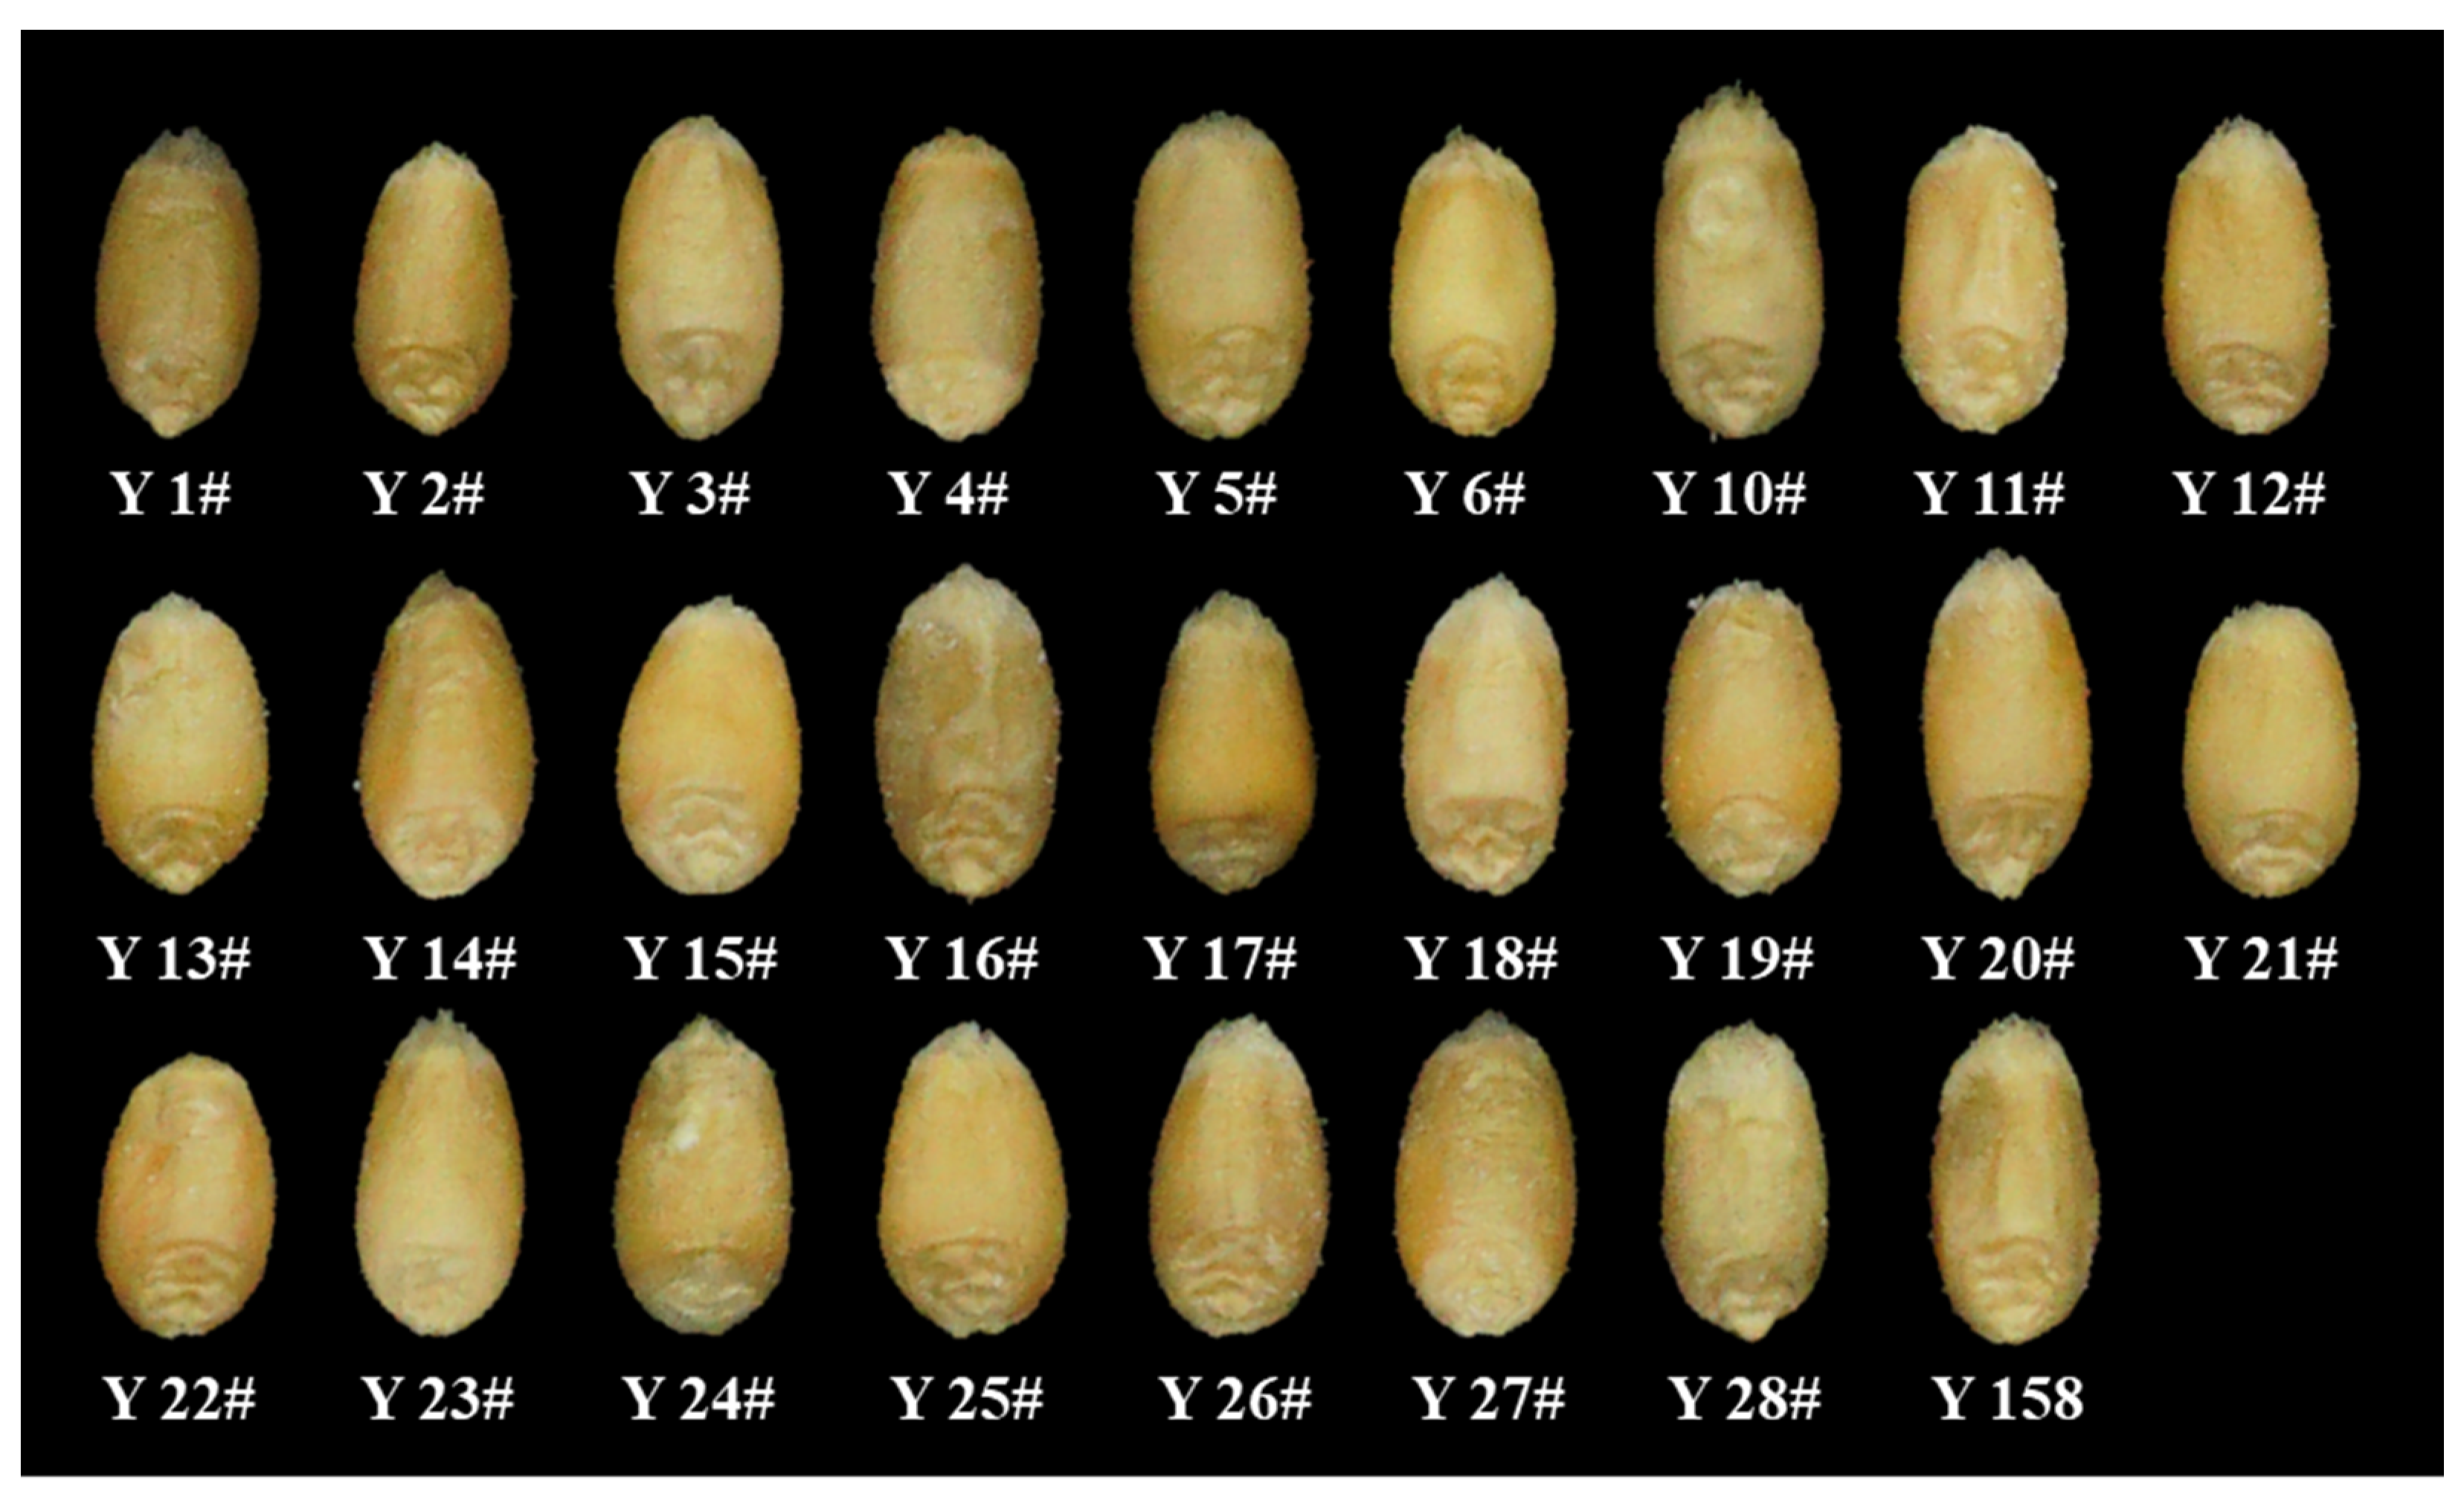
Figure 1. Wheat grains of different Yangmai series varieties.
Agriculture 12 01861 g001
Figure 2. Wheat grain 3D point-cloud acquisition platform. (a) Overview of the platform; (b) binocular camera.
Agriculture 12 01861 g002
Figure 3. Grain point-cloud processing pipeline.
Agriculture 12 01861 g003
Figure 4. Principle of the binocular stereo imaging parallax. (a) Schematic of depth information; (b) schematic of XY information.
Agriculture 12 01861 g004
Figure 5. Grain point-cloud data extraction. (a) Top view of the original 3D point cloud; (b) northeast view of the grain and carrier point−cloud data segmentation; (c) top view of the extracted grain point cloud; (d) right view of the extracted grain point cloud; (e) northeast view of the extracted grain point cloud.
Agriculture 12 01861 g005
Figure 6. Single-rain point-cloud extraction. (a) All grain point clouds with segmented plane; (b) two grains’ point clouds and segmentation plane; (c) analysis of two grains’ point clouds and segmentation planes. The red line and green line indicate the distance between grains at different height levels.; (d) the upper part of the grain point cloud; (e) classification result of the upper part of different grains.
Agriculture 12 01861 g006
Figure 7. Complete single−grain classification results. The blue dot represents the nearest polyhedron on the left and the red dot represents on the right.
Agriculture 12 01861 g007
Figure 8. Complete grain 3D model construction. (a) Northeast view of the single−grain point cloud; (b) mapped grain bottom; (c) complete grain with bottom point cloud; (d) northeast view of the grain 3D model.
Agriculture 12 01861 g008aAgriculture 12 01861 g008b
Figure 9. Manual measurement of grain volume.
Agriculture 12 01861 g009
Figure 10. The sample accuracy analysis. (a) Length, (b) width, (c) thickness, (d)volume.
Agriculture 12 01861 g010
Figure 11. Measurement efficiency: (a) measurement time consumption for different numbers of grains; (b) relationship between scanning speed and measurement time and RMSE of volume. The red line is selected reference line.
Agriculture 12 01861 g011
Figure 12. Cluster analysis of 3D morphological of Yangmai series varieties.
Agriculture 12 01861 g012
Table 1. Yangmai series variety name and abbreviation.
VarietyAbbreviationVarietyAbbreviation
Yangmai No.1Y 1#Yangmai No.17Y 17#
Yangmai No.2Y 2#Yangmai No.18Y 18#
Yangmai No.3Y 3#Yangmai No.19Y 19#
Yangmai No.4Y 4#Yangmai No.20Y 20#
Yangmai No.5Y 5#Yangmai No.21Y 21#
Yangmai No.6Y 6#Yangmai No.22Y 22#
Yangmai No.10Y 10#Yangmai No.23Y 23#
Yangmai No.11Y 11#Yangmai No.24Y 24#
Yangmai No.12Y 12#Yangmai No.25Y 25#
Yangmai No.13Y 13#Yangmai No.26Y 26#
Yangmai No.14Y 14#Yangmai No.27Y 27#
Yangmai No.15Y 15#Yangmai No.28Y 28#
Yangmai No.16Y 16#Yangmai 158Y 158
Table 2. Three varieties measurement accuracy.
IndicatorsZhenmai No.9Yangmai No.23Ningmai No.13
RMSE
(mm)
MAPE
(%)
RMSE
(mm)
MAPE
(%)
RMSE
(mm3)
MAPE
(%)
Length (n = 100)0.20002.240.23692.610.24002.96
Width (n = 100)0.22356.100.20955.530.21335.86
Thickness (n = 100)0.20545.320.21646.100.21375.99
Volume (n = 10)18.12673.5621.84535.6613.24943.72
Table 3. Measurement accuracy of Yangmai series varieties.
VarietiesLength (n = 40)Width (n = 40)Thickness (n = 40)Volume (n = 40)
RMSE
(mm)
MAPE
(%)
RMSE
(mm)
MAPE
(%)
RMSE
(mm)
MAPE
(%)
RMSE
(mm3)
MAPE
(%)
Y 1#0.21573.040.20706.080.21955.991.91675.77
Y 2#0.21953.070.17484.950.19284.691.72864.56
Y 3#0.20212.850.20245.860.18464.861.78154.64
Y 4#0.25403.250.18645.050.19814.881.98934.42
Y 5#0.21092.670.19205.240.21035.052.21795.60
Y 6#0.22232.990.17594.650.20705.361.87634.56
Y 10#0.22512.890.20766.020.21965.902.11995.18
Y 11#0.20992.650.20475.730.17944.602.07134.89
Y 12#0.20642.770.19195.650.18984.991.92415.05
Y 13#0.22643.360.22236.400.21035.311.85874.53
Y 14#0.22052.900.21145.490.19584.751.83644.05
Y 15#0.19902.700.19754.960.19924.801.81514.00
Y 16#0.22482.930.22126.540.20195.241.79374.40
Y 17#0.22672.960.19104.810.20775.171.89204.53
Y 18#0.22122.870.19275.300.20885.231.95574.60
Y 19#0.20052.870.21165.890.21285.511.80254.06
Y 20#0.24513.320.17484.800.20455.361.72363.98
Y 21#0.21012.560.17094.600.20235.051.82694.04
Y 22#0.23923.590.20865.660.19555.062.14555.53
Y 23#0.19442.470.19925.740.19985.301.65904.16
Y 24#0.22043.080.19495.220.20925.041.97494.69
Y 25#0.18782.340.19745.060.19514.681.81484.08
Y 26#0.23793.150.18974.820.22896.011.97004.43
Y 27#0.19502.670.20055.390.20114.931.91044.56
Y 28#0.22463.010.19895.400.20094.921.69834.10
Y 1580.23153.110.20595.850.19575.102.08775.40
Average0.21812.930.19745.430.20275.151.89974.61
Table 4. Comparative results of relevant studies.
MethodsDeviceLength
(mm)
Width
(mm)
Thickness
(mm)
Volume
(mm3)
EfficiencyAdditional
Reference [32]Binocular camera----0.1635--highSingle indicator
Reference [34]Single camera0.09880.08410.0917--highUnstable accuracy
Reference [27]Binocular camera0.03000.04280.03620.3789lowOne grain one time
Reference [35]Binocular camera0.18400.07000.0420--lowMulti-angle acquisition
WG-3D-25Binocular camera0.22560.21540.21191.7740highScanning speed at 25 mm/s
WG-3D-5Binocular camera0.10180.09380.09160.6457middleScanning speed at 5 mm/s
The ‘--’ means no measurement in the reference.
Table 5. Mean value of 3D morphological indicators of Yangmai series varieties.
VarietiesLength
(mm)
Width
(mm)
Thickness
(mm)
Volume
(mm3)
Y 1#5.962.983.2129.92
Y 2#6.043.133.4134.12
Y 3#6.153.113.3434.06
Y 4#6.843.223.5639.93
Y 5#6.343.083.5737.00
Y 6#6.273.203.4634.81
Y 10#6.713.123.3836.92
Y 11#6.743.163.3638.49
Y 12#6.392.963.3333.23
Y 13#5.903.153.4437.00
Y 14#6.463.443.5538.99
Y 15#6.313.443.7539.88
Y 16#6.833.083.3134.51
Y 17#6.483.373.4937.84
Y 18#6.723.093.5137.20
Y 19#6.043.173.4738.39
Y 20#6.283.113.4636.21
Y 21#6.973.153.5540.53
Y 22#5.973.203.3634.50
Y 23#6.493.153.2033.63
Y 24#6.273.273.6236.93
Y 25#6.443.373.6438.45
Y 26#6.633.323.4637.69
Y 27#6.273.183.5837.43
Y 28#6.323.173.6036.44
Y 1586.303.123.2934.05
Publisher’s Note: MDPI stays neutral with regard to jurisdictional claims in published maps and institutional affiliations.