Article

The Use of Compost Increases Bioactive Compounds and Fruit Yield in Calafate Grown in the Central South of Chile

by
Fernando Pinto-Morales
1,
Jorge Retamal-Salgado
2,*,
María Dolores Lopéz
1,
Nelson Zapata
1,
Rosa Vergara-Retamales
3 and
Andrés Pinto-Poblete
3
1
Faculty of Agronomy, Universidad de Concepción, Vicente Méndez 595, Casilla 537, Chillán 3812120, Chile
2
Instituto de Investigaciones Agropecuarias, INIA-Quilamapu, Avenida Vicente Méndez 515, Chillán 3800062, Chile
3
Faculty of Engineering and Business, Universidad Adventista de Chile, km 12 Camino a Tanilvoro, Chillán 3780000, Chile
*
Author to whom correspondence should be addressed.
Agriculture 2022, 12(1), 98; https://doi.org/10.3390/agriculture12010098
Submission received: 7 December 2021 / Revised: 2 January 2022 / Accepted: 8 January 2022 / Published: 11 January 2022

Abstract

:
Different concentrations of compost applied as organic fertilizer can modify productive, quality, and chemical parameters in several fruit tree species. The objective of this study was to determine the effect of increasing applications of compost on physiological, productive, and quality parameters in calafate fruit during the seasons of 2018–2019 and 2019–2020. The study was conducted on a commercial calafate orchard using a randomized complete block design with four treatments (CK: no compost application, T1: 5 Ton ha−1, T2: 10 Ton ha−1, and T3: 15 Ton ha−1), each with four repetitions. The results did not show statistical significance for stomatal conductance (Gs), quantum yield of PSII, or photosynthetic active radiation (PAR) within treatments. As for fruit yield, a statistical difference was found between the control treatment and T1, which were lower than T2 and T3 in both seasons. The trees reached a higher leaf area index with T2 in both seasons. The highest antioxidant capacity was obtained with T3 and T2 for the first and second season, respectively. Polyphenols and total anthocyanin production showed statistical significance, with a higher content at the second season with T2. It is concluded that the dose under which yield, quality, and nutraceutical content of calafate fruit are optimized is the one used in T2, 10 Ton ha−1.

1. Introduction

Calafate (Berberis microphylla G. Forst) is a bush native of the Chilean and Argentine Patagonia. In Chile, it can be found from the metropolitan region to Punta Arenas (34° 59′0″ South to 53° 28′33″ South). However, its existence is concentrated in the Aisén and Magallanes regions. In these regions, an increasing demand for products made from calafate has been observed [1,2]. Currently, this plant is a subject of study due to its biological properties, attributed mainly to the content of polyphenols present in it [3]. The antioxidant capacity of B. microphylla compared with other species has shown to be up to 10 times more than apples, oranges, and pears, and more than four times higher than blueberries [4]. Different studies have detected 18 anthocyanins in the calafate fruit, with a total concentration between 14.2 and 26 µmol g−1 of fresh weight [5,6]. These polyphenols (PF) substantially reduce the presence of degenerative, cardiovascular, and carcinogenic diseases [7]; therefore, they are beneficial compounds for human health [8].
Most studies of B. microphylla have been developed in the so-called Austral Zone of Chile; all of them use wild calafate for which vegetative growth takes place by mid-spring [9]. Furthermore, a comparative study about the morphology and anatomy of mature leaves of calafate, growing under two different conditions, showed that leaves change their morphology and structure to adapt to new environmental conditions [10]. This makes it important to analyze the behavior and/or adaptation of B. microphylla focusing on both physiology and phenology mainly in agroclimatic zones different from its natural habitat, which could also lead to negative effects of the quality of the product [11,12] as well as variations in photosynthetic efficiency [13,14]. Thus, a question that the present research addresses is: could the introduction of B. microphylla into an intensive commercial environment, different from the original, generate changes on productive and quality parameters of the fruit? [15].
Currently, there is an unsatisfied demand for this fruit that wild species have not been able to meet [16], generated by educated consumers who are eager for a more natural and nutritious alimentation to have a healthier life. This has increased safe and environmental friendly food production [17].
Calafate is a species capable of growing under several environmental conditions [5]. However, no agronomic research has been conducted under intensive-commercial conditions that allow for optimized productivity and polyphenolic content in the fruit [10]. Despite the fact that compost application is a widely used technique of organic fertilization to use bio-residues [18], however, it is known that compost usage has beneficial effects on both quality and soil fertility but also on the environment [19].
Compost, as an organic fertilizer, has been shown in other species to enhance fruit quality, as pointed out by Vásquez and Maravi [20], where applications of 10 Ton ha−1 of compost in Morus alba L. significantly increased yield and quality of the fruit. Similarly, in a study on strawberries (Fragaria × ananassa Duch) cvs. Allstar and Honeoye grown in pots with an organic fertilization, the concentration of anthocyanins, phenolic content, and antioxidant capacity of the fruit increased with the increasing compost doses [21].
Furthermore, in macadamia (Macadamia integrifolia), compost application to the soil increased its total cationic exchange capacity, organic matter, potassium (K), calcium (Ca), and magnesium (Mg), among other micronutrients [22]. Compost also modifies physical properties in the soil, such as total porosity and water retention capacity. It has also been observed on studies on wine grapes (Vitis vinifera cv. Chardonnay), improving nitrogen mineralization and its availability to the studied crop [23]. Additionally, in research conducted for 21 years of organic applications to eroded soils that were nutritionally deficient and with low pH, it significantly increased soil pH, organic carbon content, total nitrogen, phosphorus, potassium, available nitrogen, and biological activity [24].
According to the stated above, the objective of this research was to determine the effect of different doses of compost on productive and physiologic parameters, including polyphenolic composition and antioxidant activity of the fruit of calafate grown under an intensive agronomic management in the central zone of Chile.

2. Materials and Methods

2.1. General Characteristics of the Site of the Study and Orchard Establishment

The study was conducted at the Universidad Adventista de Chile (UnACh), located in the Kilometer 12 route to Tanilvoro, province of Chillán, region of Ñuble (36°31′ S; 71° 54′ W), Chile. The site of the study has volcanic soil (Melanoxerand) (Stolpe, 2006), a temperate Mediterranean climate, hot and dry summers, cold and humid winters, with an annual precipitation of 815 mm concentrated in winter and early spring [25]. The study was conducted in a commercial calafate orchard established in August of 2017, using two-year-old plants with an average height of 70 cm. The plants were multiplied from seeds in 2015. The plant population density was 1 m within a row and 3 m between rows, planted on berms 1 m wide and 20 cm high. After establishing the orchard, the soil was physically and chemically characterized at a depth of 0 to 40 cm, where most parts of the roots are found [9] (Table 1). These analyses were carried out at the laboratory of chemistry and physics of soils of the Agricultural Research Institute of Chile (INIA Quilamapu, Chillán, Chile).
At establishment, a base fertilization was applied into the plantation hole of 150 g of urea (45% N), 200 g of triple superphosphate (46% P2O5). and 200 g of potassium sulfate (50 % K2O) [19]. In addition, hydraulic replenishment was standardized for all treatments and estimated according to the daily potential evapotranspiration of the crop (ETCc) using the methodology suggested by Romero et al. [26]. This was performed with the objective of maintaining optimum humidity levels in the soil during the entire development of the crop. Weed control was also standardized for all treatments and consisted of the manual elimination of them when establishing the orchard, plus three times a year, equally distributed, according to the annual cycle of the crop. In parallel, the same phytosanitary management was applied to all treatments, which consisted of six annual applications during the growing season, alternating two active ingredients, which were Tebuconazole (Orius 43 SC) at a concentration of 25.8 g per hectoliters and cuprous oxide (Cuprodul WG) at a concentration of 180 g per hectoliter of the active ingredient.
The experimental design used for the study was a randomized complete block design with a total of 4 treatments of compost doses, with 4 repetitions per treatment. Each treatment and repetition consisted of 4 plants in which only the 2 central plants were evaluated. Additionally, there were border rows to help diminish the border effect. Compost treatments consisted of: (1) control treatment (CK) with no compost application, (2) 5 tons per hectare (Ton ha−1) of compost (T1), (3) 10 Ton ha−1 of compost (T2), and (4) 15 Ton ha−1 of compost (T3). All treatments were applied each year in August to each experimental unit, administering the first application at the plantation.
The compost used in the study was commercially produced by the composting and recycling center of the Universidad Adventista of Chile, which was created from chicken manure, produced at the same institution, and oat bales. The manure and bales were mixed at a rate of 3:1 (Vol/Vol). The creation process lasted 5 months, controlling during that time the temperature, humidity, and ventilation [27,28,29]. The physical–chemical characterization of the compost used for this study is detailed in Table 2.

2.2. Characterization of Physiological and Environmental Conditions of the Plant

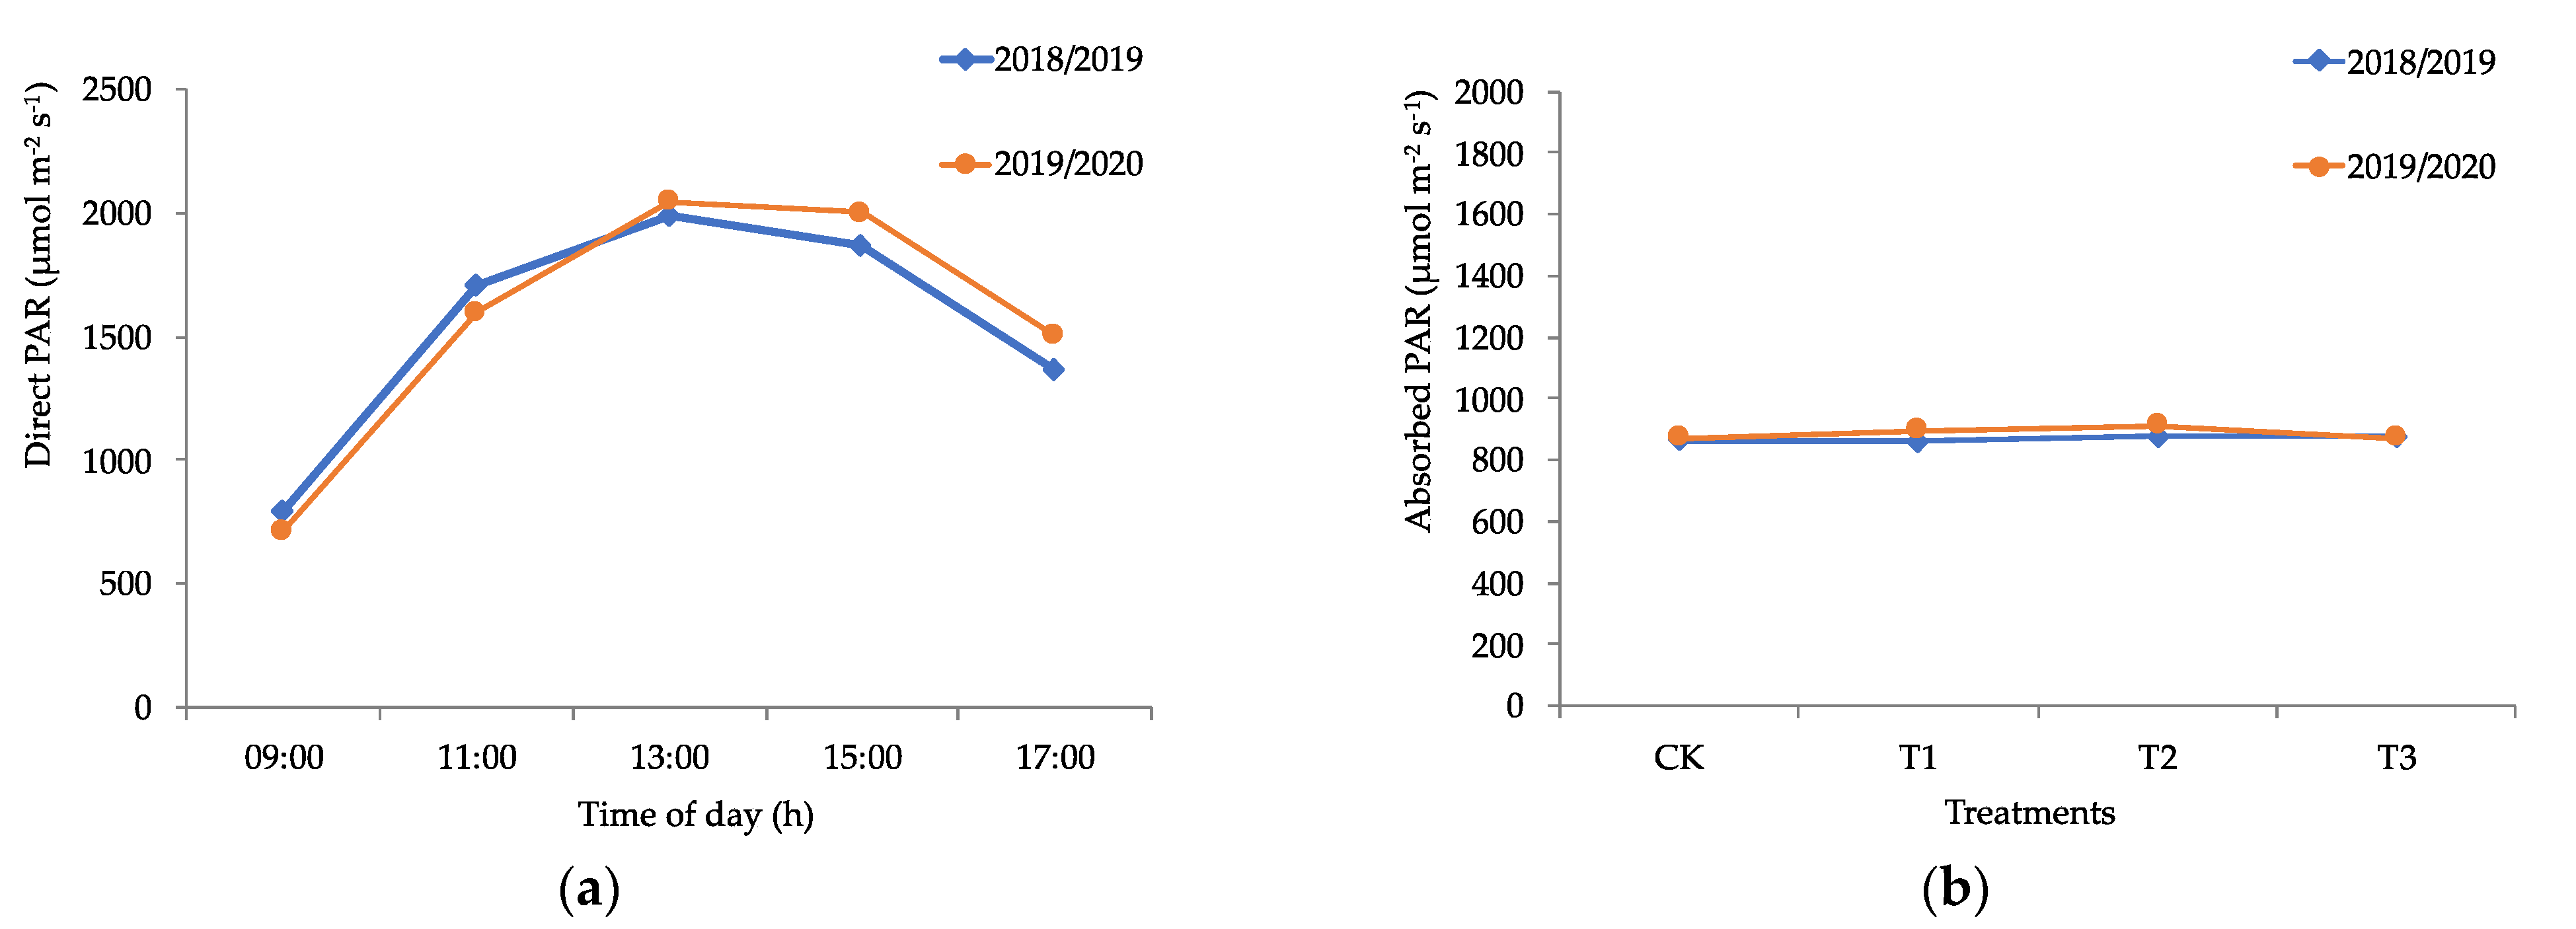
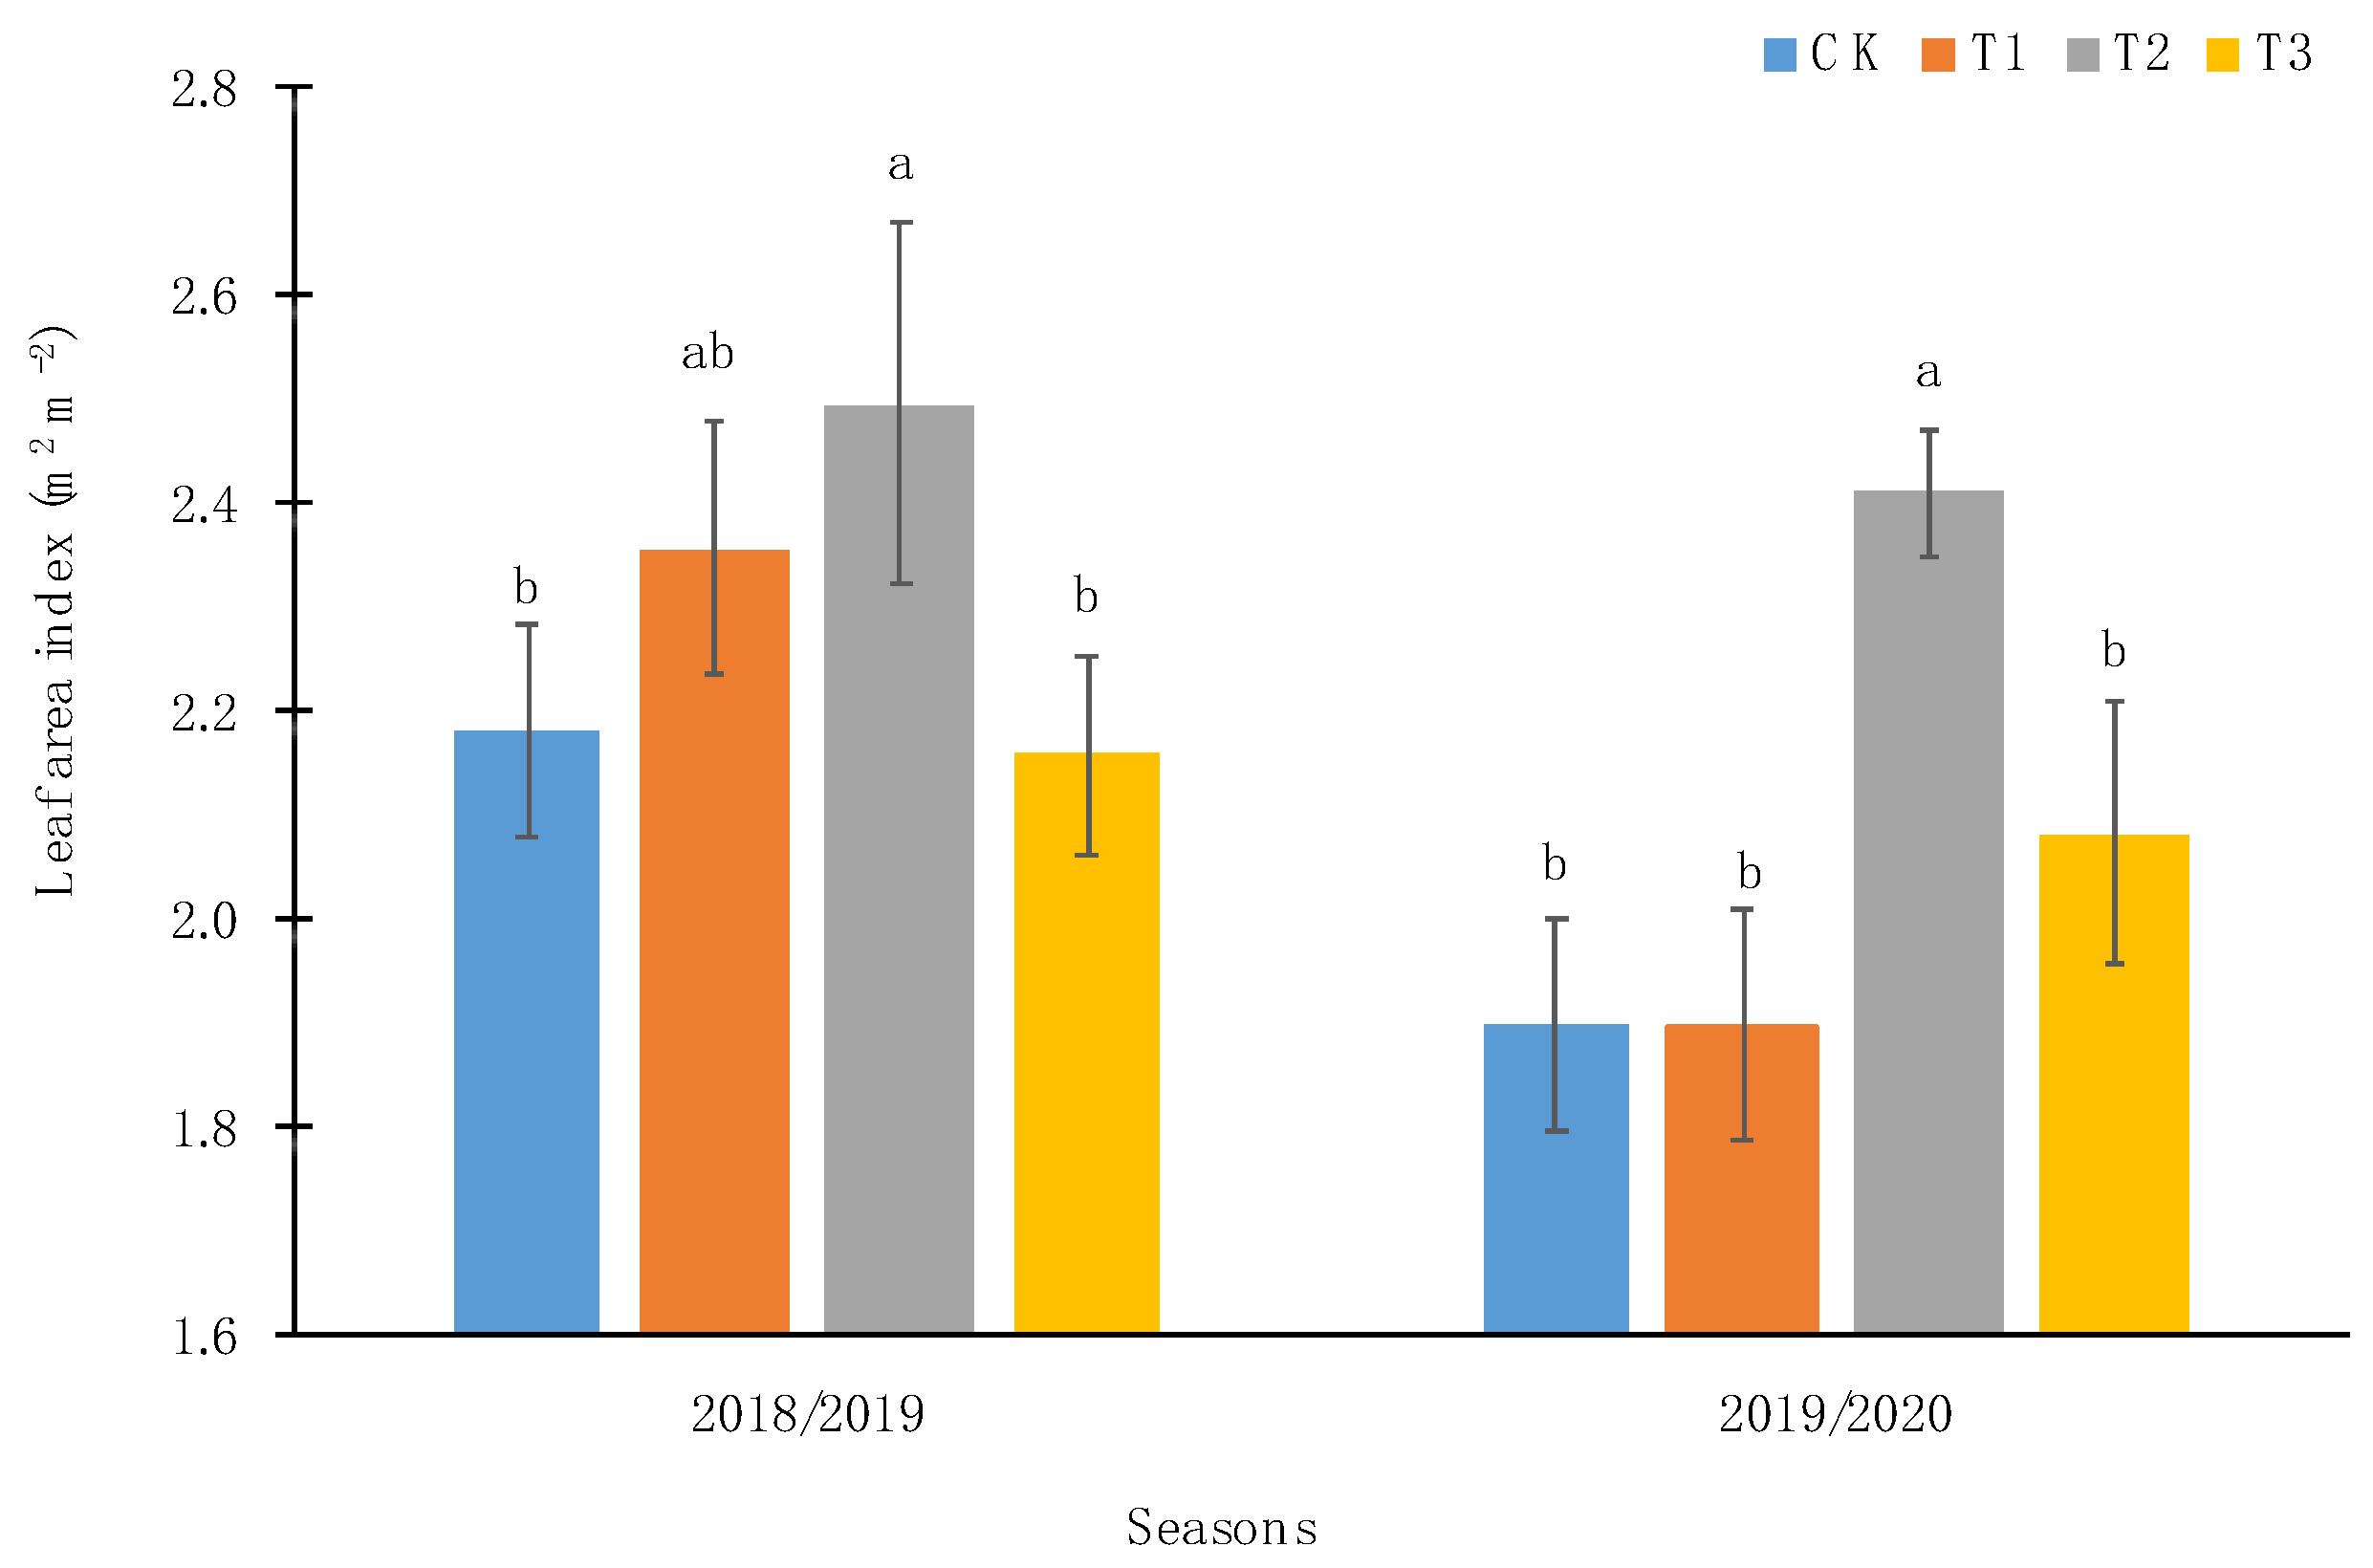
2.2.1. PAR Radiation and Leaf Area Index

For the purposes of environmental records, the photosynthetic photon flux density (PPFD, µmol m−2 s−1) was quantified at five times of the day: 09:00, 11:00, 13:00, 15:00, and 17:00 h, in ambient conditions of a completely sunny day. The radiation parameters correspond to the direct, diffuse, residual, and reflected photosynthetically active radiation of the soil and plant throughout the development of the crop, and with these parameters, the intercepted PAR was estimated. For this, an AccuPAR LP-80 ceptometer (Decagon Devices Inc., Washington, DC, USA) was used, which delivers the average of 80 quantum sensors. The readings of the leaf area index (LAI; m2 m−2) were made at noon and were measured in post-harvest (January) when the growth of the plant had already stopped, using the same instrument and in parallel to the PAR radiation measurements [30].

2.2.2. Chlorophyll Fluorescence and Stomatal Conductance

The maximum intensity of fluorescence (Fm) was measured as well as the minimum intensity of fluorescence (Fo) of chlorophyll. This was achieved by using a portable fluorimeter model OS-5p (Opti-Sciences, Hudson, NH, USA) during a clear day at five times of the day, respectively: 09:00, 11:00, 13:00, 15:00, and 17:00 h, on leaves exposed to the sun and in the second third of a branch of the season [31].
Both Fo and Fm were determined after a period of 30 min in which the leaves were adapted to darkness [31,32]. For this, foliar clips that included a mobile obturation plate were used. With these parameters, the maximum photochemical efficiency of photosystem II (Fv/Fm) was quantified using the following relationship proposed by Kooten and Snell and Maxwell and Johnson [33,34]: Fv/Fm = (Fm − Fo)/Fm.
At the same time, stomatal conductance measurements (Gs, mmol m−2 s−1) were performed. For this, a portable porometer model SC-1 (Decagon Devices INC, Washington, DC, USA) was used. The Gs measurements were performed on fully illuminated leaves of the same plant, shoots, location, and frequencies used in the chlorophyll fluorescence measurements. Using the same equipment and the same frequencies as for Fv/Fm, a record of the leaf temperature (Tf; °C) was kept. In order for the data collected to be representative, these were taken on leaves exposed to the sun and in the second third of a branch of the season [14].

2.3. Yield and Chemical Parameters of the Fruit

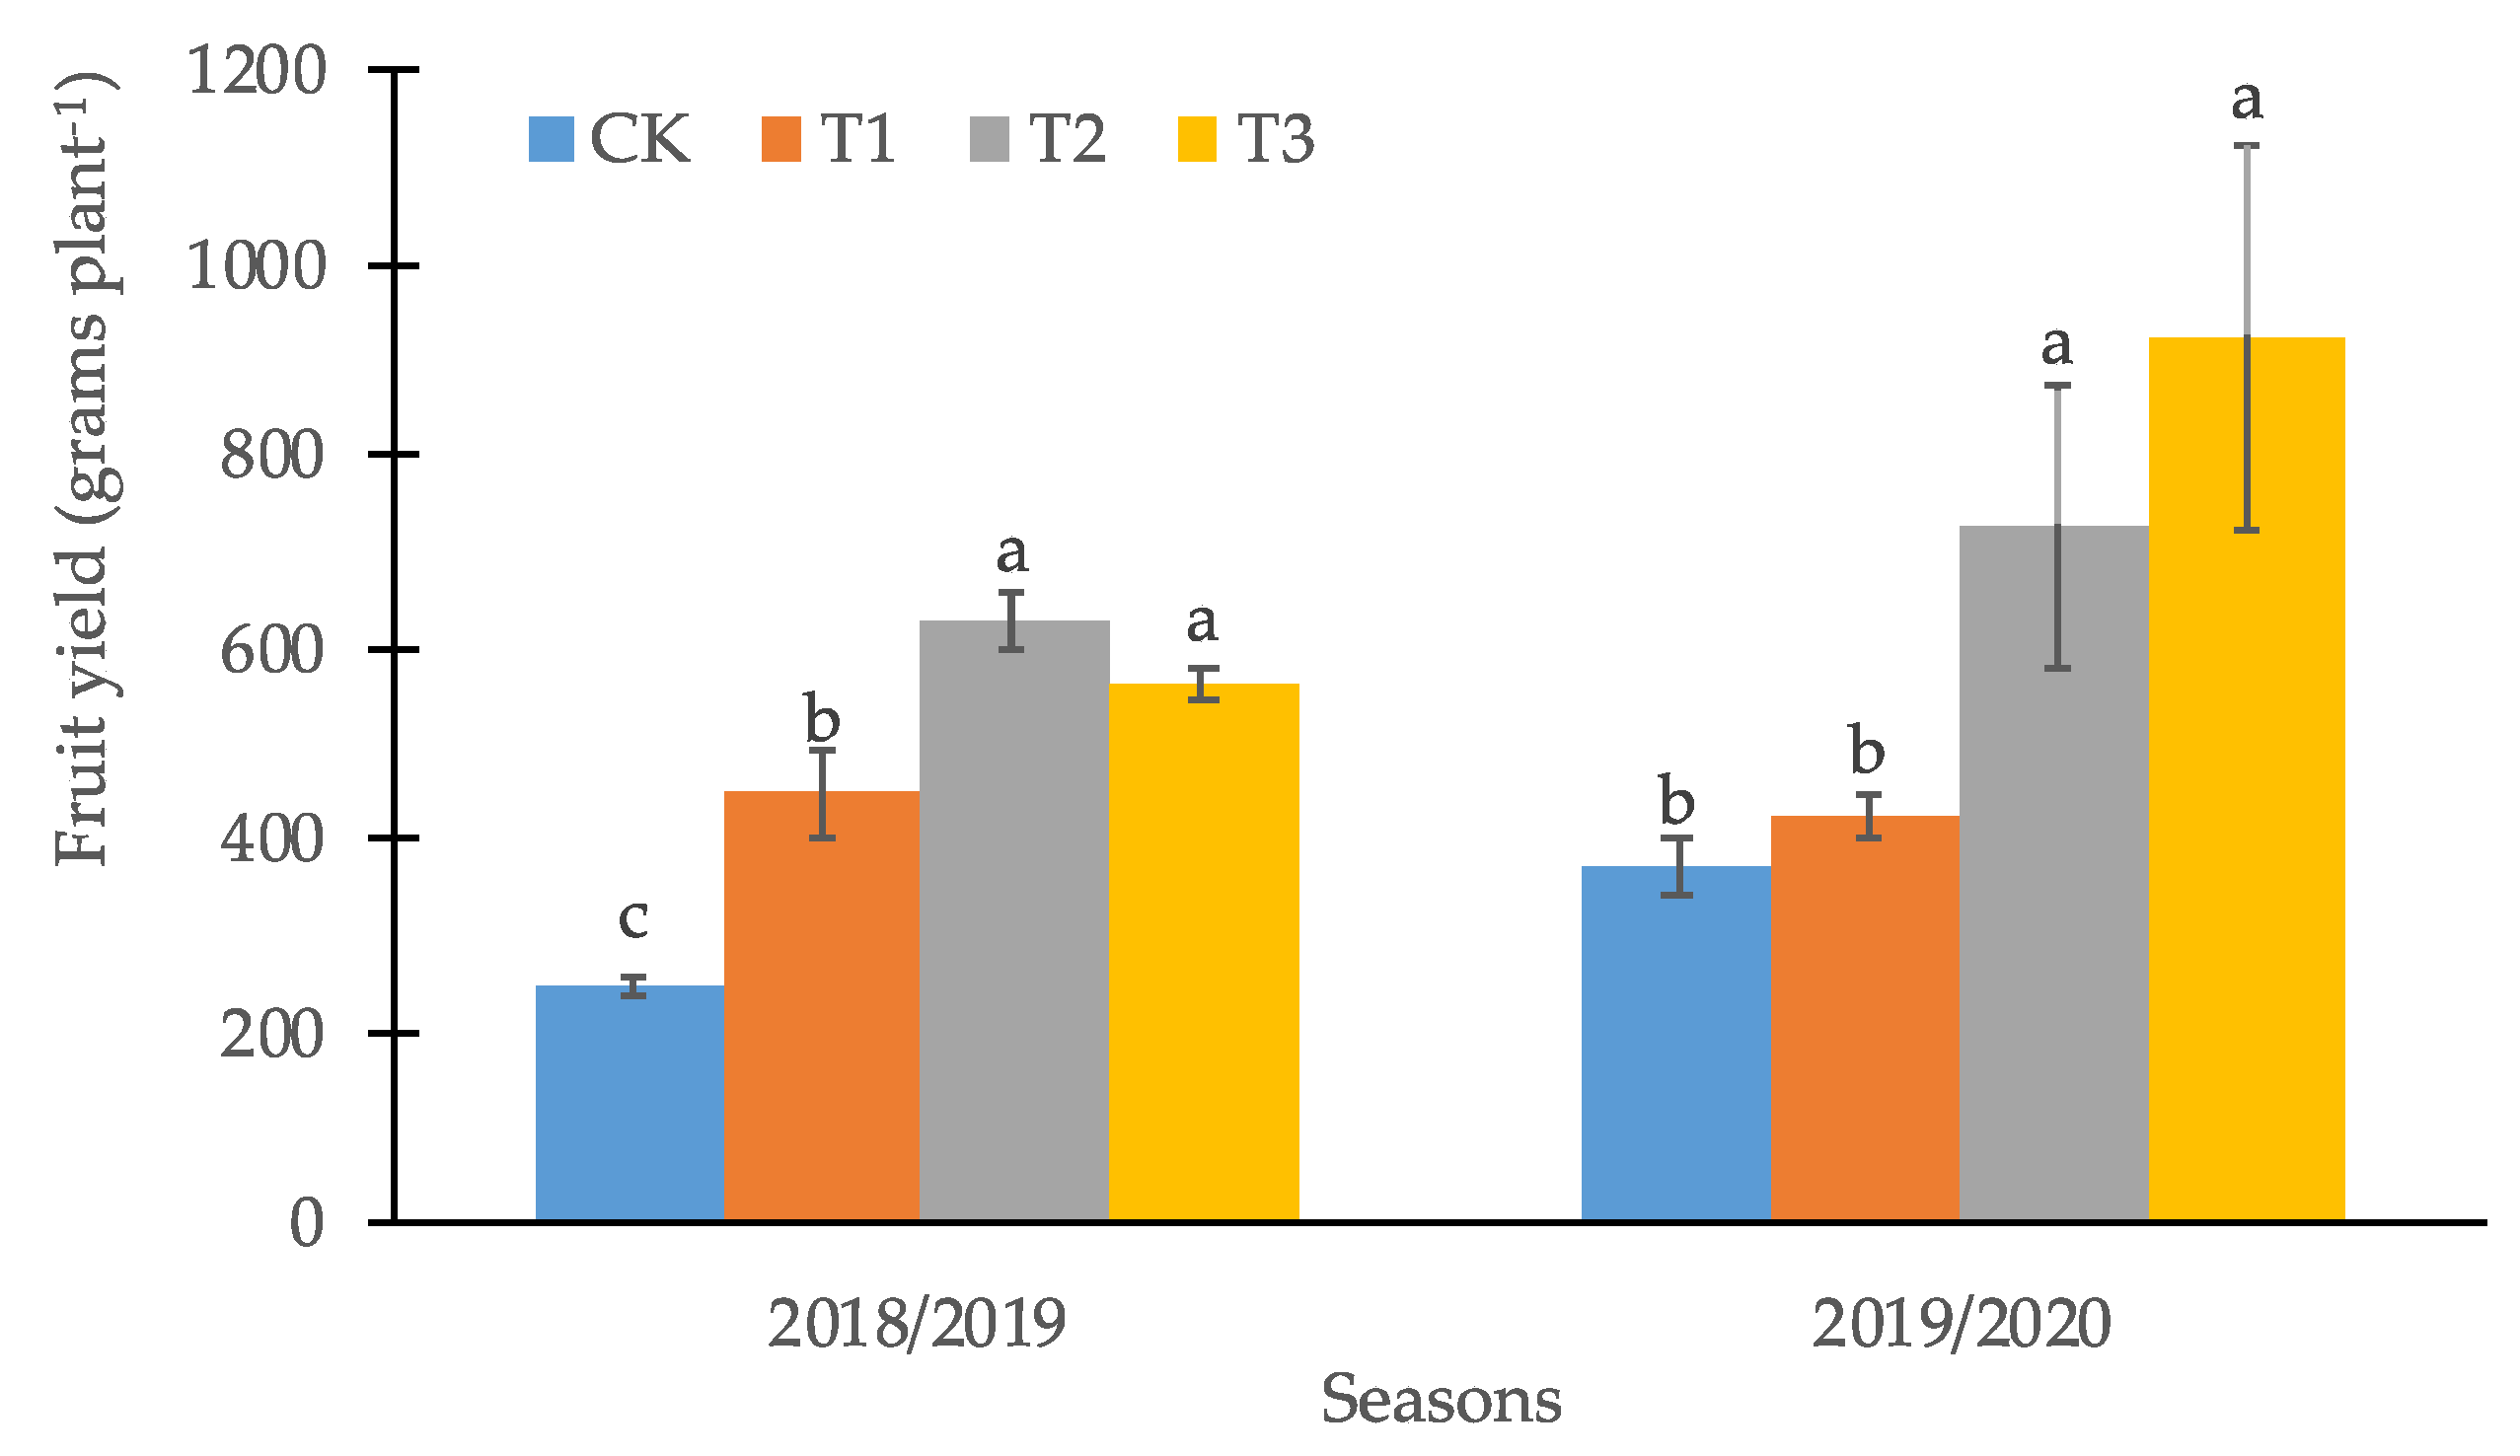
2.3.1. Calafate Fruit Productivity

The harvest was carried out 130 days after full flower for both study seasons. The harvest was done manually in which the total weight (g) of fruits per plant was quantified.

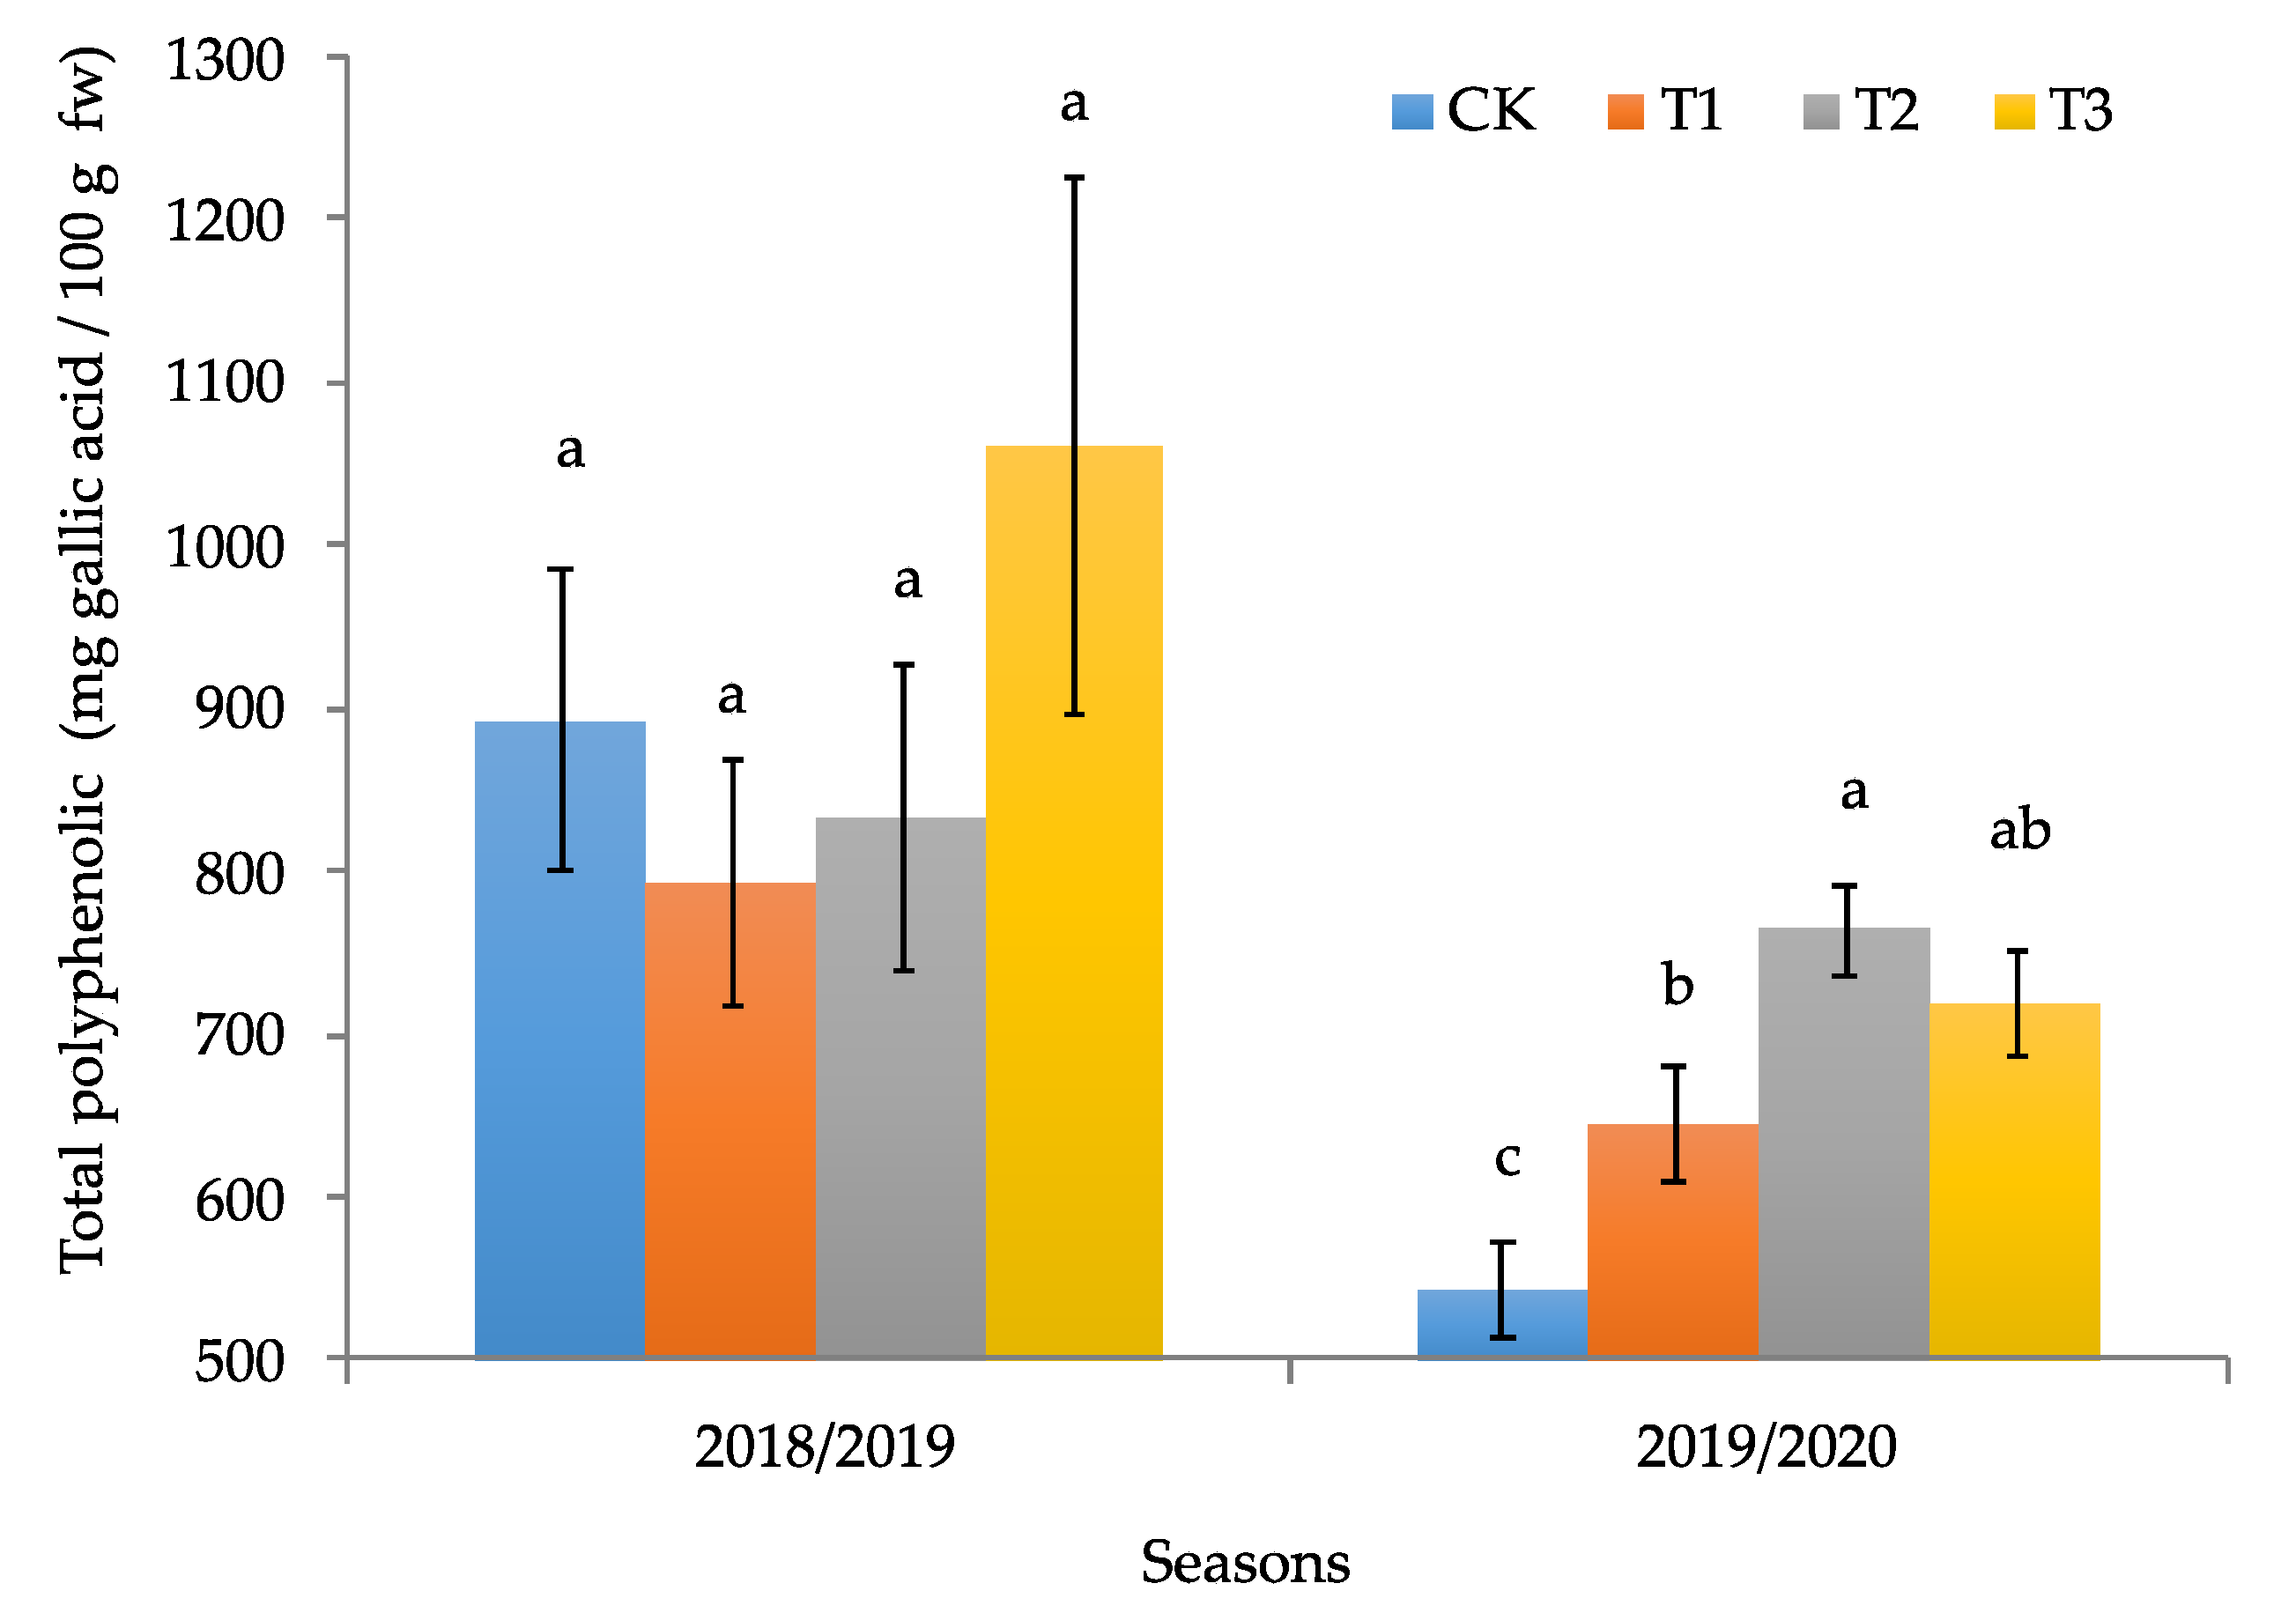
2.3.2. Determination of Total Polyphenol Concentration

Total polyphenols were determined by colorimetry using the method of Folin Ciocalteu in the food chemistry laboratory of the Universidad de Concepcion, Chillán, Chile. To calculate the polyphenol content, a calibration curve with gallic acid was used, with concentrations between 0 to 1000 mg L−1 of gallic acid according to the methodology proposed by Yıldırım et al. [35]. The results are expressed in mg of gallic acid 100 g−1 [10].

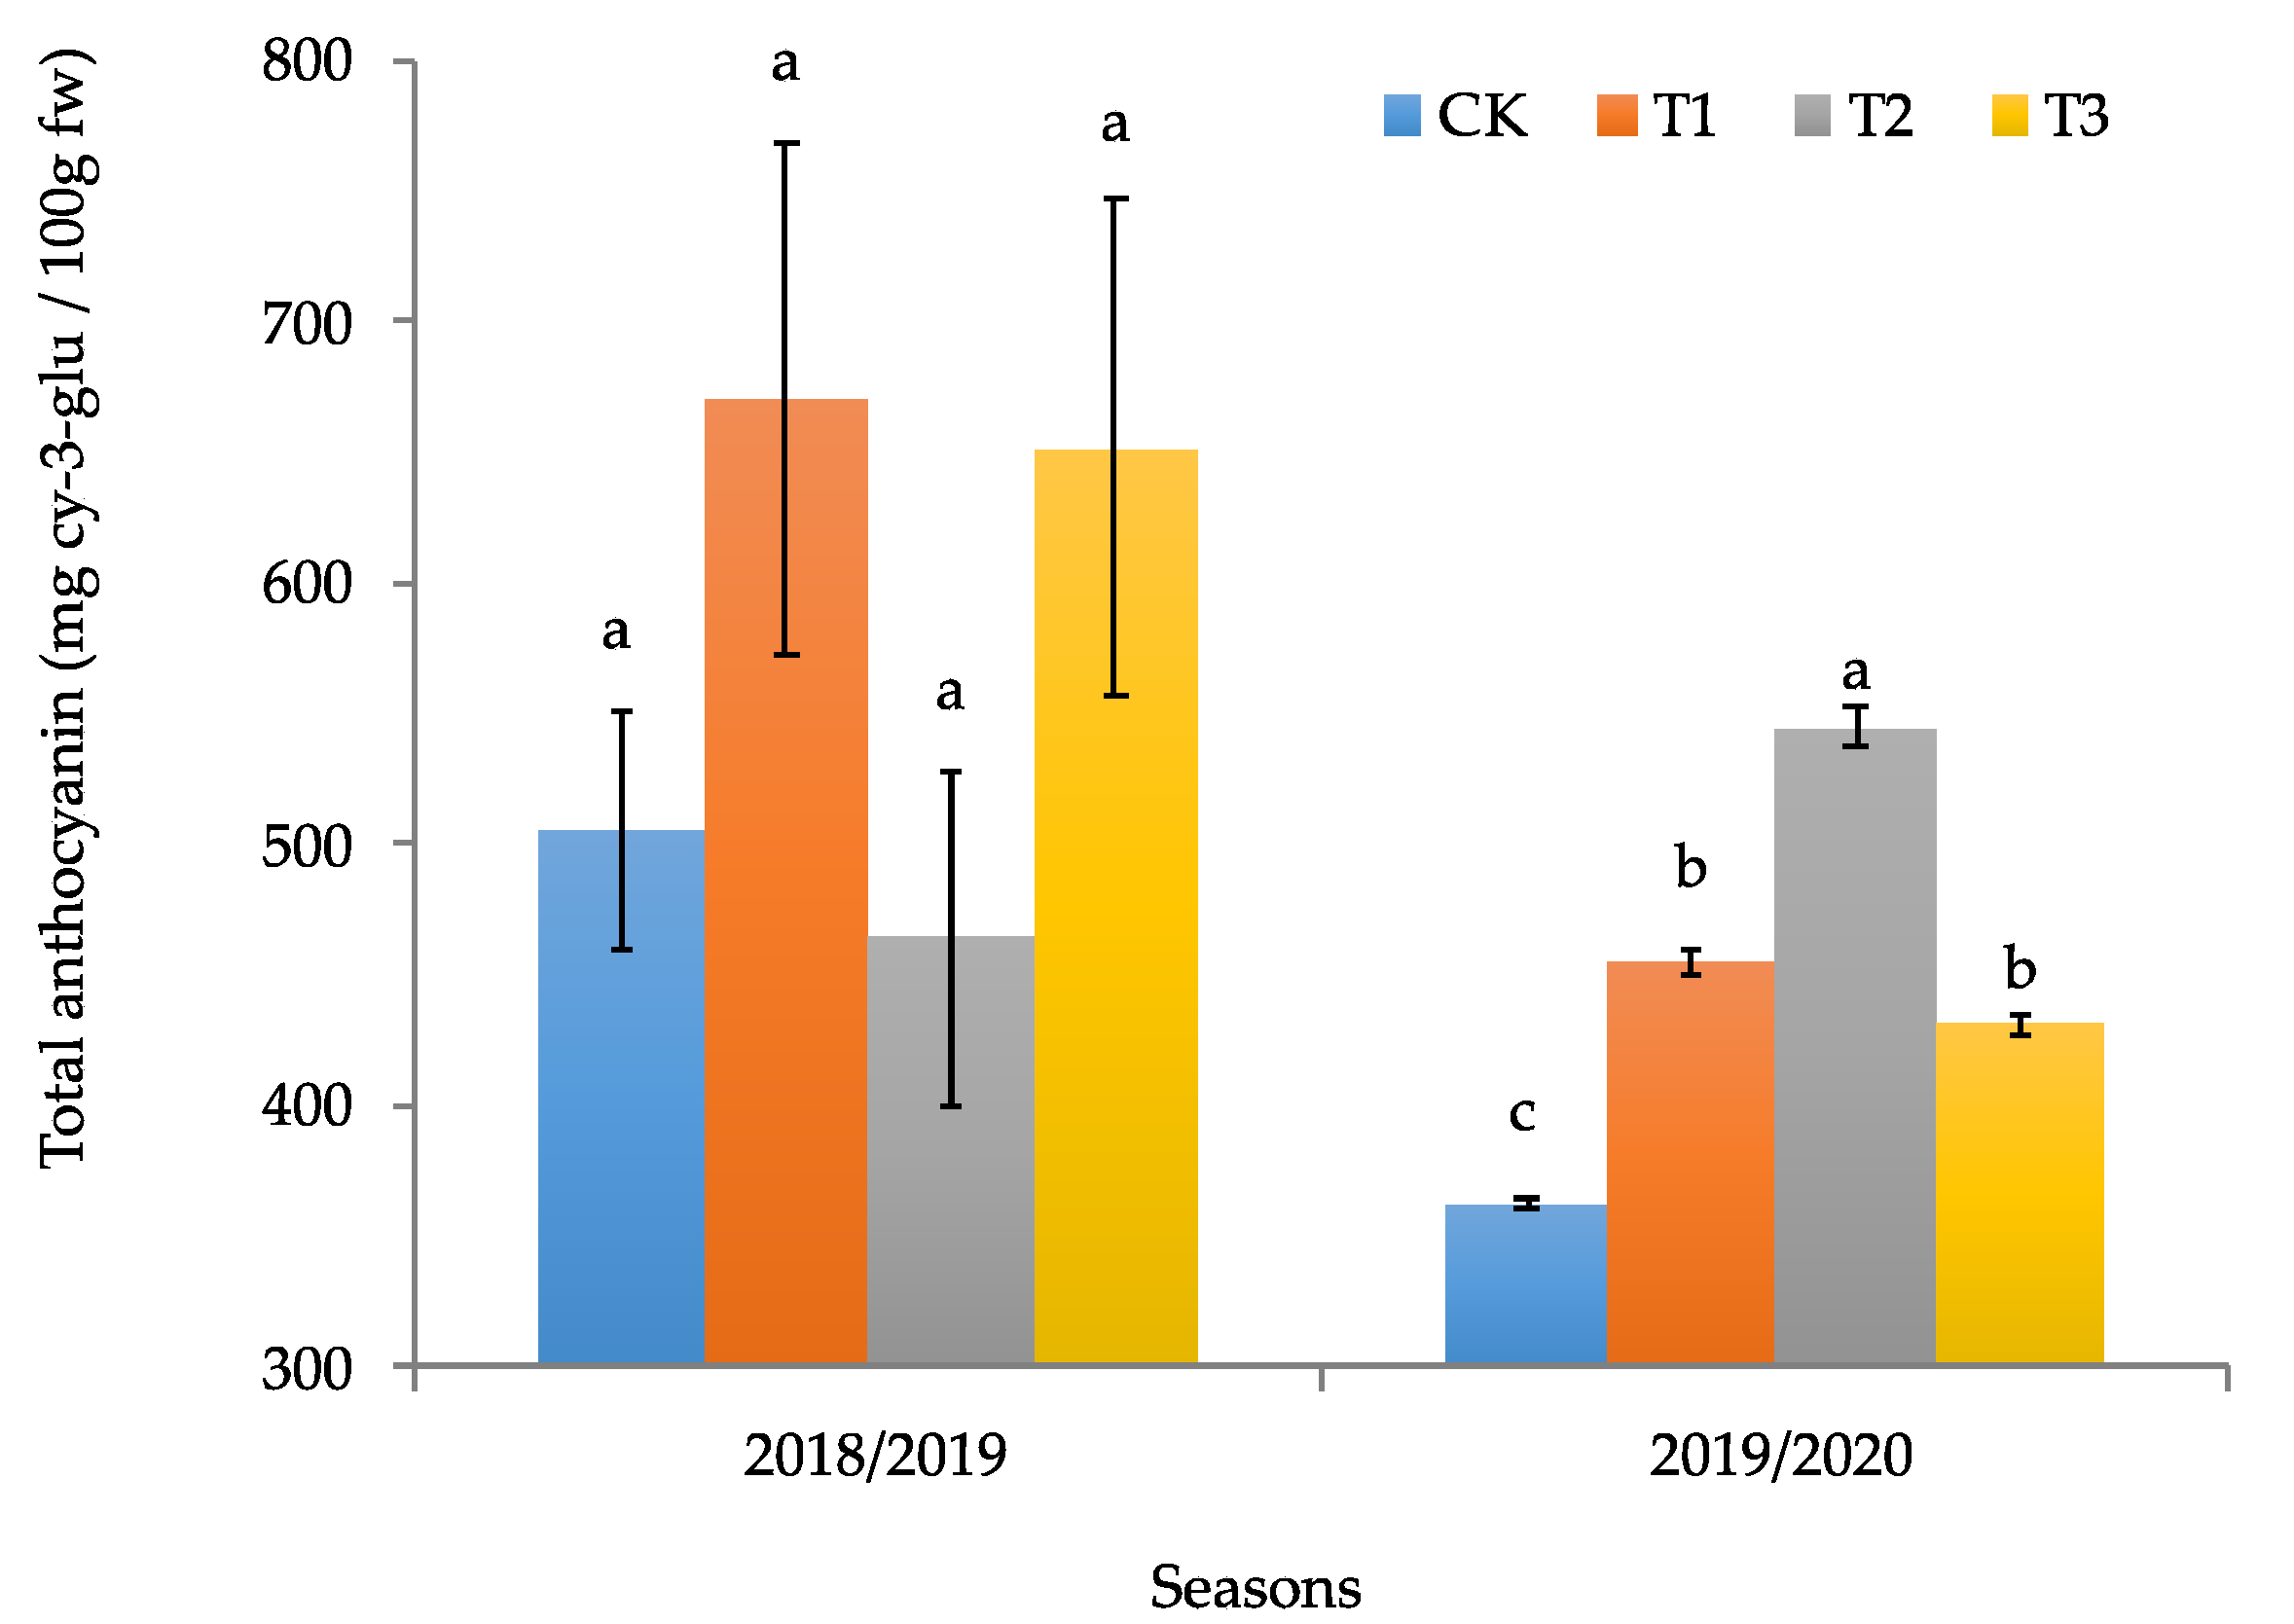
2.3.3. Determination of Anthocyanin Content

Total anthocyanins were determined by a differential pH technique. The determination of the anthocyanin content is based on the Lambert–Beer Law (A = ε * C * L), where A corresponds to the absorbance that is measured with a spectrophotometer; ε corresponds to the molar absorbance, a constant physics for molecular species in a solvent at a given wavelength; C is the molar concentration; and L is the length of the route, expressed in cm. Molar absorbance values for purified pigments were obtained from the literature. The concentration in mg L−1 was determined by multiplying by the molecular weight (MW) of the pigment. To calculate the anthocyanin content, the molecular weight and molar absorbance of the anthocyanin pigment present in the highest proportion were used [5]. The calculation of the anthocyanin concentration was carried out with the equation shown below, and data was expressed as mg of cyanidin 100 g−1 of fresh weight:
A × 1000 × 449.2 26,900 × 3000 100 × 5 1000 × g   s a m p l e × 100                                      

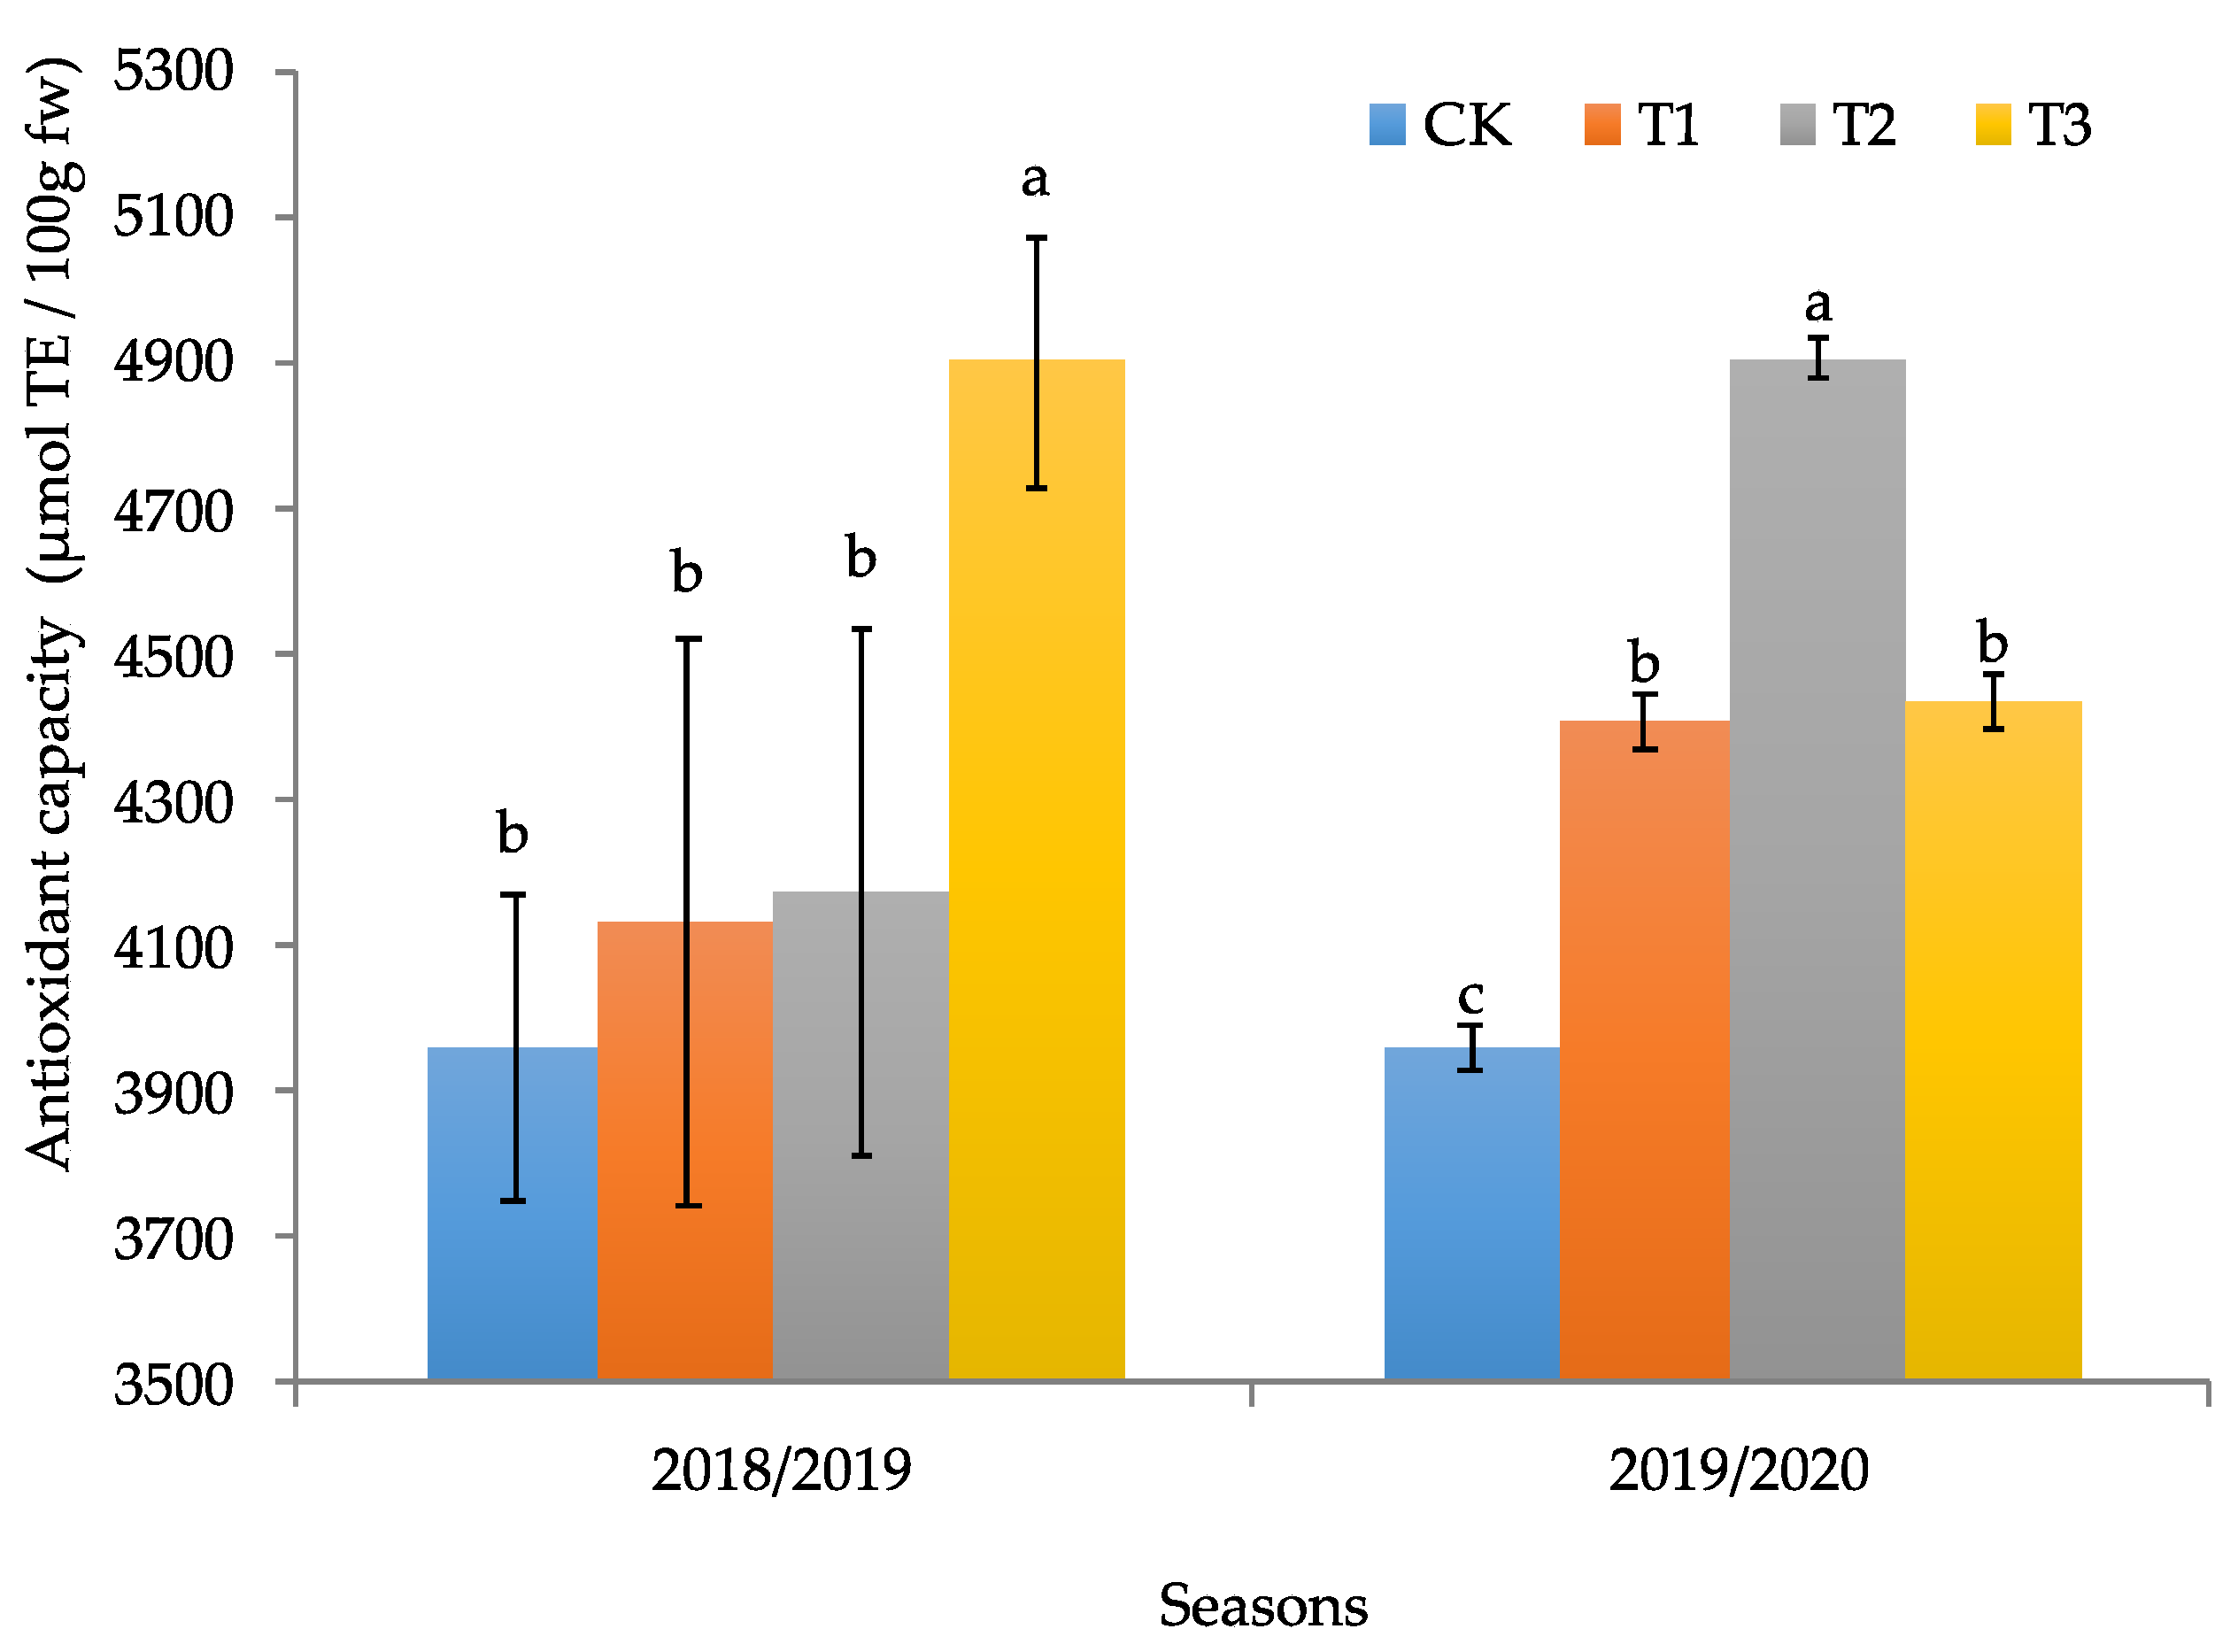
2.3.4. Determination of Antioxidant Capacity

The DDPH antioxidant capacity was determined through the decolorization of the 1.1-Diphenyl-2-picrylhydrazyl free radical, proposed by Brand-Williams et al. [36]. The DPPH radical is reduced in the presence of antioxidants, manifesting a color change in the solution over time. To quantify the inhibition, a calibration curve was elaborated using the TROLOX reagent in methanol, achieving concentrations of 25, 50, 75, 100, 150, 200, 250, 300, 350, and 400 ppm. A methanol solution was used as a blank, and all solutions were incubated in the dark for 30 min; absorbance was measured in the spectrophotometer at 515 nm after 60 min. The antioxidant capacity was expressed in μmol Trolox equivalent (TE) 100 g−1 fresh weight).

2.4. Statistical Analysis

The effect of the treatments was estimated by an ANOVA and the Fischer LSD test, with a level of statistical significance of 0.05; for this, the INFOSTAT software was used (Infostat, Cordoba, Argentina, 2015).

3. Results

3.1. Edaphoclimatic and Physiological Parameters of Calafate

In Figure 1a, the average of direct photosynthetically active radiation (µmol m−2 s−1) can be observed in the 2018–2019 and 2019–2020 seasons, quantified at five times of the day: 09:00 a.m., 11:00 a.m., 1:00 p.m., 3:00 p.m., and 5:00 p.m, presenting the lowest PAR values at 09:00 for both seasons, with values close to 750 µmol m−2 s−1. In both seasons, the same trend of increasing PAR was observed from the first hours of the day until reaching the maximum values, close to 2000 µmol m−2 s−1, towards the end of the day, with values close to 1500 µmol m−2 s−1, in both seasons (Figure 1a). In Figure 1b, the absorbed photosynthetically active radiation can be observed, which did not show significant differences between treatments for each of the seasons under evaluation, registering similar values (p < 0.05) in both seasons, which were on average 866, 878, 893, and 873 µmol m−2 s−1 for CK, T1, T2, and T3, respectively.
Table 3 shows the variations in the physicochemical parameters of the soil at the end of the study for the different compost treatments. It should be noted that the percentage of organic matter increased in the different treatments as the volume of compost applied increased, being CK < T1 < T2 < T3, with values of 9.8%, 10.40%, 11.00%, and 11.90% for each treatment, respectively. For the pH parameter, no significant modifications were observed between treatments towards the end of the study, corresponding to 6.59, 6.56, 6.50, and 6.60 for CK, T1, T2, and T3, respectively. The nutritional levels of the soil tended to improve with increases in the dose of compost applied, mainly in the case of P, K, Ca, S, and Mg (Table 3). Together, the cation exchange capacity increased close to 12% in the treatments with the application of compost (Table 3). On the contrary, the concentration of iron and manganese decreased by 12 and 89%, respectively.
In Figure 2, the results obtained for the leaf area index parameter can be observed. In the first season, the treatment that registered the highest leaf area index (LAI) value was T2 (LAI: 2.5), which was significantly higher than CK and T3 and with no significant differences from T1 (Figure 2). For the second season, the same trend was observed, with T2 showing the highest LAI value (2.41; p < 0.05) compared to treatments CK, T1, and T3, which did now show statistical significance (p > 0.05) between the three of them; the results were 1.9, 1.9 and 2.08 LAI, respectively.
The results for the variation of maximum quantum yield of photosystem II (Fv/Fm) analysis can be observed in Figure 3a,b for the 2018/2019 and 2019/2020 seasons, respectively. Emphasizing that, in the first season, all treatments presented similar values at the beginning of the day (p < 0.05), close to 0.8. Similar results were observed at 11:00, 13:00, 15:00, and 17:00, where the average values recorded for Fv/Fm were 0.79, 0.78, 0.76, and 0.77, respectively. In all treatment values, Fv/Fm decreased as the day passed (Figure 3a) without significant differences between the treatments (p < 0.05). For the second season, the same trend and values obtained in the first season were observed, on average, with only a lower average value of Fv/Fm towards the end of the day in the second season under evaluation (Figure 3b).
In Figure 4, it is possible to observe the registered values of the stomatic conductance (mmol m−2 s−1) of the calafate leaf at different hours of the day and for different compost dose treatments. Highlighting that, for the 2018–2019 season, no significant differences were observed among treatments, with average values of 260, 289, 308, and 291 mmol m−2 s−1 (p > 0.05) for CK, T1, T2, and T3, respectively. However, for the control treatment, from 11:00 until the end of the day, Gs values were always above 260 mmol m−2 s−1 unlike the rest of the treatments, which, after obtaining the maximum values of stomatal conductance, their values decreased by up to 40% (data not shown). For the 2019/2020 season, the same trend was observed as in the 2018/2019 season. However, recorded values were slightly lower than the previous season, with averages of Gs for CK, T1, T2, and T3 of 227, 214, 257, and 230 mmol m−2 s−1 (p > 0.05), respectively.

3.2. Productive and Quality Parameters of the Calafate Fruit

In Figure 5, the antioxidant capacity of the calafate fruit can be observed for the 2018–2019 and 2019–2020 seasons. For the first season under study, the highest value of DDPH antioxidant capacity was recorded at the dose of 15 Ton ha−1 (T3; p < 0.05) with 4900 μmol TE/100 g fw, followed by treatments CK, T1, and T2 with 3961, 4130, and 4172 μmol TE/100 g fw, respectively, being similar to each other (p > 0.05). For the second season, a greater effect was observed where T2 was the one that reported the highest antioxidant capacity of the calafate fruit with 4905 μmol TE/100 g fw (p < 0.05), followed by treatments T1 and T3, with values of 4406 and 4435 μmol TE/100 g fw, respectively, both without significant differences. Finally, the control treatment showed the lowest DDPH antioxidant capacity of all the treatments (p > 0.05) with a value of 3958 μmol TE/100 g fw (Figure 5).
Figure 6 shows the total content of polyphenols in the calafate fruit grown with different doses of compost for the 2018–2019 and 2019–2020 seasons. In the first season, no significant differences were observed between treatments. However, for the 2019/2020 season, the average polyphenolic content of the fruit decreased by 25% compared with CK. T2 and T3 were the ones that contributed the highest CPT values (p < 0.05), these being 764 and 718 mg of gallic acid/100 g of fresh weight, respectively (Figure 6). However, T3 did not show significant differences with T1 (645 mg of gallic acid/100 g of fresh weight). CK was the one that registered the lowest PFT content (543 mg of gallic acid/100 g of fresh weight) (p < 0.05) among all treatments.
Figure 7 shows the total anthocyanin content (TAC) in the calafate fruit for the different compost treatments in the 2018–2019 and 2019–2020 seasons. For the first season under evaluation, the same behavior as the CPT was observed, not registering significant differences between CK, T1, T2, and T3, whose values averaged 573 mg cyanidin-3-glucoside/100 g fw. For the second season, more noticeable effects were observed, although there was a decrease in TAC in most treatments. T2 was the one that registered the highest TAC (p < 0.05), with 545 mg cyanidin -3-glucoside/100g fw. This was followed by T1 and T3, without significant differences between them, with values of 445 and 431 mg cyanidin-na-3-glucoside/100 g fw, respectively. Finally, the one that registered the lowest TAC (p <0.05) was CK, with a value of 363 mg cyanidin-3-glucoside/100g fw (Figure 7).
In Figure 8, the yields of fresh calafate fruit (g plant−1) grown under different doses of compost in the 2018–2019 and 2019–2020 seasons are observed. For the first season, the treatments that recorded the highest fruit production were T2 and T3 (p < 0.05), without significant differences, with values of 629 and 561 g plant−1, respectively. On the contrary, the treatment that registered a lower production was CK, with an average fruit yield of 249 g plant−1 (p < 0.05). In the second season, there was an increase in performance in most treatments, with T3 and T2 as the ones that registered the highest average fruit production of 924 and 726 g plant−1 (p > 0.05), respectively, and without significant differences between them. Finally, lower fruit production T1 and CK registered an average production of 424 and 370 g plant−1 (p > 0.05), respectively.

4. Discussion

Despite that photosynthetically active radiation (Figure 1a) was 26% higher at the site of study with respect to the habitat of origin of the plants (1600 µmol m−2 s−1; Valdivia, Chile), no symptoms of excess radiation were observed. This was possibly due to the great structural and physiological plasticity that this species possesses [15,37,38,39,40,41], managing to adapt to higher ambient temperature conditions, as indicated by Radice and Arena [10]. The above is confirmed by Romero-Román et al. [42], who observed that productive and some physiological parameters of the calafate plant were not influenced by extreme temperatures; however, these environmental conditions could influence chemical parameters of the fruit [42] in response to higher levels of radiation, such as those observed at the study site (Figure 1a). Even though the radiation was high, no higher levels of absorbed PAR radiation between treatments and seasons were registered (Figure 1b), which could be showing that calafate, despite having morphological plasticity, has low variability of its light saturation point. The light saturation point of calafate is 800 µmol m−2 s−1 [43], and at values higher than 1000 µmol m−2 s−1, photosynthesis rates would be constant. Therefore, higher levels of PAR radiation could be generating photo-oxidative damage due to an excess of radiation. Studies developed by Arenas et al. [15] point out that low levels of irradiation improve plant development and nutrient content in the calafate leaf. In this study, however, no improvements were observed in indirect parameters used as indicators of photosynthetic performance, such as stomatal conductance (Figure 4). Results showed that this species does not respond strongly to changes in fertilization levels in relation to Gs, with values between 200 and 300 mmol m−2 s−1 between treatments and evaluation seasons (p > 0.05). These results are in contrast to those found in a study carried out on blueberries, where Gs was affected by the fertilization doses together with the water regime, where a correlation was found between the fertilization dose and moisture content in the soil [44]. As the soil moisture was constant for all treatments in this study, it could be strongly influential so that no significant differences in Gs are observed between treatments [44].
On the other hand, the application of compost to the soil increased levels of organic matter (OM) in all treatments (Table 1 and Table 2), which could be affecting the moisture retention capacity, aeration, porosity, and soil carbon content as reported in multiple studies [45,46,47]. Said OM modifications in the soil could be having an impact not only on the physical parameters of the soil, but also to the nutritional status and biomass of the plant and consequently on the foliar area of the plant [44,45]. In the present study, the LAI was higher in both seasons in Q3 (Figure 2), showing an increase in the second season of more than 20% compared to CK and T1 (p < 0.05) and close to 10% higher than T3 (p < 0.05). These results are consistent with other authors, who point out that the application of compost not only increases the vegetative development of the plant, but also the total chlorophyll content of the leaf [15,45].
In a study carried out on vine (Vitis vinifera cv. Chardonnay), during 9 years of compost applications, equal yields were observed with inorganic fertilization. However, fertilization with compost significantly increased levels of organic matter in the soil; in addition, there was a substantial increase in the concentrations of mineralizable nitrogen in the soil [23]. The former could have happened in this study since the applied levels of nitrogen reached 60 mg kg−1 of soil (Table 2), but they were not strongly affected until the third year from the implementation of the study (Table 3). Interestingly, nitrogen levels in the soil fluctuated between 13 and 16 mg kg−1 in all treatments; this response of low nitrogen availability in the soil could be generated by the high levels of nitrogen that the plant is extracting to satisfy the greater vegetative development [48] (Figure 2) in conjunction with the higher levels of productivity [45] (Figure 8), as those observed in T2 and T3, which were 100% higher in both seasons for the treatments of 10 and 15 ton ha−1 of compost, compared to the control treatment. The treatments that obtained the best productive results, both at the beginning and at the end of the study, were the treatments with the highest doses of compost, corresponding to 10 and 15 tons ha−1 and with productivity levels close to 1000 g per plant (Figure 8), coinciding with the results of other authors [45,48,49]. These results suggest that the long-term application of compost to the soil, in addition to improving the physical and chemical properties of the soil, as indicated above, could improve its biological activity. [24]. Although, the aforementioned is an uncertainty in this new species for commercial purposes since there are no studies related to the microbial activity in the soil and rhizosphere. Therefore, this study opens the door to future investigations that propose to understand and/or analyze the interaction of agronomic management with the activity and microbiological diversity of the soil and the response of the calafate plant [15,42].
In the present study, it can be observed that the evaluated nutraceutical parameters were positively influenced by the dose of compost application when compared with the control treatment (Figure 5, Figure 6 and Figure 7). Regarding the content of polyphenols (Figure 6) and total anthocyanins of the calafate fruit (Figure 7), these decreased in the second evaluation season by 25% on average between treatments. The compost treatment of 15 Ton ha−1 was the one that contributed the greatest decrease in polyphenolic content in the second season. However, the average total polyphenol contents observed in this study (764 mg of gallic acid/100 g fw) were below the polyphenolic contents observed in wild plants in studies developed by other authors [50]. Nevertheless, the results obtained in the compost treatments were superior to the control treatment. This has been corroborated in other species, such as strawberries, where the effect of an organic fertilization based on compost increased the contents of anthocyanins, phenolic contents, and antioxidant capacity, and also in the Rhubarb (Rheum rhabarbarum L.) crop, where organic fertilization also improved the levels of polyphenolic content and antioxidant capacity of the fruit [48,51]. In a study conducted by Cojocaru et al., no increase in fruit yield was observed as it was observed in this study (Figure 8) and was probably associated with the low doses of compost (2.4 Ton ha−1) used in their study [51], which was associated with the high levels of extraction given by the levels of fruit production.
Regarding the contents of total anthocyanins, despite the fact that these plants are being cultivated and subjected to intensive agronomic management, the total concentrations of anthocyanins observed were higher than the results obtained in wild calafate plants in different locations in Usuahia (Argentina) and Buenos Aires (Argentina) [10], with values close to 118 and 316 mg cyanidin-3-glucoside/100 g fw, respectively, as well as values lower than the results observed in Chile [16,43,52], with values over 1000 mg cyanidin-3-glucoside/100 g of fresh weight. These differences in concentrations of anthocyanins and total polyphenols could be stimulated by multiple factors, which could affect the biosynthesis of bioactive compounds, such as different light intensities, ultraviolet radiation, extreme temperatures, and availability of nutrients and water, among other factors, specific to each environment where this species grows [15,53]. However, it is suggested that, among the factors that could be influencing the differences in results between the different studies, the most influential is the great variability in the opportune moment of harvest, which is influenced by the aforementioned parameters. It is important to mention that in this study, the harvest time corresponded to 130 days after full flower, which is longer than the harvest dates observed in other polyphenolic evaluation studies of wild calafate fruits, fluctuating from 98 to 126 days after full flower [40,54].

5. Conclusions

The use of increasing doses of compost turned out to be beneficial to the physiological, productive, and quality parameters of calafate during the studied seasons. Treatment T2 at a rate of 10 Ton ha−1 obtained the highest index of foliar area, antioxidant capacity, total polyphenols, and total anthocyanins in the second study season. The compost application rates of 10 and 15 Ton ha−1 obtained the highest fruit production per plant, with a production of 3300 kilos per hectare. On the other hand, increasing compost doses generated an increase in organic matter in the soil and nutritional content of the soil. Therefore, the dose that optimizes the yield, fruit quality, and nutraceutical content of the calafate fruit is set at a rate of 10 Ton ha−1. However, this study opens the doors to future research in this matter to answer questions regarding the behavior of soil microbial activity and its interaction between agronomic management and the calafate plant, which could alter the nutraceutical properties of calafate fruits.

Author Contributions

Conceptualization, J.R.-S.; methodology, J.R.-S., F.P.-M. and N.Z.; software, J.R.-S., A.P.-P. and R.V.-R.; validation, J.R.-S.; formal analysis, J.R.-S. and F.P.-M.; investigation, F.P.-M. and J.R.-S.; resources, F.P.-M. and J.R.-S.; data curation, M.D.L. and J.R.-S.; writing—original draft preparation, F.P.-M. and J.R.-S.; writing—review and editing, R.V.-R., N.Z., M.D.L. and A.P.-P.; project administration, J.R-S.; funding acquisition, J.R.-S. and F.P.-M. All authors have read and agreed to the published version of the manuscript.

Funding

The present work benefited from the project of research Nº 106, granted by the Universidad Adventista de Chile, Chile. We are grateful to Fondecyt 1191141 ANID Chile for the scientific instruments provided for this research.

Institutional Review Board Statement

Not applicable.

Informed Consent Statement

Not applicable.

Data Availability Statement

Corresponding author.

Acknowledgments

We are grateful for the support of the students of the Adventist University of Chile, for actively participating in the data collection: Samuel Contreras, Juan Pablo Molina and Sebastiancamilo Ospino.

Conflicts of Interest

The authors declare no conflict of interest.

References

  1. Mc Leod, C.; Pino, M.T.; Aguila, K. Calafate (Berberis microphylla): Otro Superberries Chileno. Available online: https://biblioteca.inia.cl/bitstream/handle/123456789/4637/NR40444.pdf?sequence=1 (accessed on 10 November 2021).
  2. Pino, M.T.; Mc Leod, C.; Ojeda, A.; Zamora, O.; Saavedra, J. Characterization and Clonal Selection of Berberis Microphylla G. Forst in the Chilean Patagonia Region for Natural Colorant Purposes. In XIV EUCARPIA Symposium on Fruit Breeding and Genetics; ISHS: Bologna, Italy, 2017; pp. 249–254. [Google Scholar] [CrossRef]
  3. Arena, M.E.; Zuleta, A.; Dyner, L.; Constenla, D.; Ceci, L.; Curvetto, N. Berberis Buxifolia Fruit Growth and Ripening: Evolution in Carbohydrate and Organic Acid Contents. Sci. Hortic. 2013, 158, 52–58. [Google Scholar] [CrossRef]
  4. Rodoni, L.M.; Feuring, V.; Zaro, M.J.; Sozzi, G.O.; Vicente, A.R.; Arena, M.E. Ethylene Responses and Quality of Antioxidant-Rich Stored Barberry Fruit (Berberis microphylla). Sci. Hortic. 2014, 179, 233–238. [Google Scholar] [CrossRef]
  5. Ruiz, A.; Hermosín-Gutiérrez, I.; Mardones, C.; Vergara, C.; Herlitz, E.; Vega, M.; Dorau, C.; Winterhalter, P.; von Baer, D. Polyphenols and Antioxidant Activity of Calafate (Berberis microphylla) Fruits and Other Native Berries from Southern Chile. J. Agric. Food Chem. 2010, 58, 6081–6089. [Google Scholar] [CrossRef] [PubMed]
  6. Ruiz, A.; Zapata, M.; Sabando, C.; Bustamante, L.; von Baer, D.; Vergara, C.; Mardones, C. Flavonols, Alkaloids, and Antioxidant Capacity of Edible Wild Berberis Species from Patagonia. J. Agric. Food Chem. 2014, 62, 12407–12417. [Google Scholar] [CrossRef] [PubMed]
  7. Manach, C.; Mazur, A.; Scalbert, A. Polyphenols and prevention of cardiovascular diseases. Curr. Opin. Lipidol. 2005, 16, 77–84. [Google Scholar] [CrossRef] [PubMed]
  8. Albrecht, C.; Pellarin, G.; Rojas, M.J.; Albesa, I.; Eraso, A.J. Beneficial Effect of Berberis Buxifolia Lam., Zizyphus Mistol Griseb and Prosopis Alba Extracts on Oxidative Stress Induced by Chloramphenicol. Medicina 2010, 70, 65–70. [Google Scholar]
  9. Arena, M.E.; Vater, G.; Peri, P. Fruit Production of Berberis Buxifolia Lam. in Tierra Del Fuego. HortScience 2003, 38, 200–202. [Google Scholar] [CrossRef] [Green Version]
  10. Radice, S.; Arena, M.E. Environmental Effect on the Leaf Morphology and Anatomy of Berberis Microphylla G. Forst. Int. J. Plant Biol. 2015, 6. [Google Scholar] [CrossRef] [Green Version]
  11. Sandri, M.A.; Andriolo, J.L.; Witter, M.; Dal Ross, T. Effect of Shading on Tomato Plants Grow under Greenhouse. Hortic. Bras. 2003, 21, 642–645. [Google Scholar] [CrossRef] [Green Version]
  12. Challa, H.; Schapendonk, A.H.C.M. Quantification of Effects of Light Reduction in Greenhouses on Yield. Acta Hortic. 1984, 501–510. [Google Scholar] [CrossRef]
  13. Medina, C.L.; Souza, R.P.; Machado, E.C.; Ribeiro, R.V.; Silva, J.A.B. Photosynthetic Response of Citrus Grown under Reflective Aluminized Polypropylene Shading Nets. Sci. Hortic. 2002, 96, 115–125. [Google Scholar] [CrossRef]
  14. Retamal-Salgado, J.; Vásquez, R.; Fischer, S.; Hirzel, J.; Zapata, N. Decrease in Artificial Radiation with Netting Reduces Stress and Improves Rabbit-Eye Blueberry (Vaccinium Virgatum Aiton) Cv. Ochlockonee Productivity. Chil. J. Agric. Res. 2017, 77, 226–233. [Google Scholar] [CrossRef] [Green Version]
  15. Arena, M.E.; Pastur, G.M.; Lencinas, M.V.; Soler, R.; Bustamante, G. Changes in the Leaf Nutrient and Pigment Contents of Berberis Microphylla G. Forst. in Relation to Irradiance and Fertilization. Heliyon 2020, 6, e03264. [Google Scholar] [CrossRef] [PubMed]
  16. Romero, M.E.; Noriega Vásquez, F.; Farías Villagra, M.; López Belchi, M.D.; Jara Zapata, P.; Vera Flores, B. Nuevas fuentes de antioxidantes naturales: Caracterización de compuestos bioactivos en cinco frutos nativos de Chile. Perfiles 2019, 2, 34–41. [Google Scholar] [CrossRef]
  17. Valenzuela, C.; Pérez, P. Actualización En El Uso de Antioxidantes Naturales Derivados de Frutas y Verduras Para Prolongar La Vida Útil de La Carne y Productos Cárneos. Rev. Chil. Nutr. 2016, 43, 188–195. [Google Scholar] [CrossRef] [Green Version]
  18. Radice, S.; Alonso, M.; Arena, M. Berberis Microphylla: A Species with Phenotypic Plasticity in Different Climatic Conditions. Int. J. Agric. Biol. 2018, 20, 2221–2229. [Google Scholar] [CrossRef]
  19. Hirzel, J. Diagnostico Nutricional y Principios de Fertilizacion en Frutales y Vides. Segunda Edicion Aumentada y Corregida; Colección Libros INIA—Instituto de Investigaciones Agropecuarias Trama Impresores S.A.: Hualpén, Chile, 2014. [Google Scholar]
  20. Vásquez, H.V.; Maraví, C. Efecto de fertilización orgánica (biol y compost) en el establecimiento de morera (Morus alba L.). Rev. De Investig. En Cienc. Y Biotecnol. Anim. 2017, 1, 33–39. [Google Scholar] [CrossRef] [Green Version]
  21. Wang, S.Y.; Lin, H.-S. Compost as a Soil Supplement Increases the Level of Antioxidant Compounds and Oxygen Radical Absorbance Capacity in Strawberries. J. Agric. Food Chem. 2003, 51, 6844–6850. [Google Scholar] [CrossRef]
  22. Bittenbender, H.C.; Hue, N.V.; Fleming, K.; Brown, H. Sustainability of organic fertilization of macadamia with macadamia husk-manure compost. Commun. Soil Sci. Plant Anal. 1998, 29, 409–419. [Google Scholar] [CrossRef]
  23. Mugnai, S.; Masi, E.; Azzarello, E.; Mancuso, S. Influence of Long-Term Application of Green Waste Compost on Soil Characteristics and Growth, Yield and Quality of Grape (Vitis Vinifera L.). Compost Sci. Util. 2012, 20, 29–33. [Google Scholar] [CrossRef]
  24. Zhong, W.; Gu, T.; Wang, W.; Zhang, B.; Lin, X.; Huang, Q.; Shen, W. The Effects of Mineral Fertilizer and Organic Manure on Soil Microbial Community and Diversity. Plant Soil 2010, 326, 511–522. [Google Scholar] [CrossRef]
  25. INIA Red Agrometeorológica de INIA. Available online: http://agromet.inia.cl (accessed on 27 April 2020).
  26. Romero, P.; Fernández-Fernández, J.I.; Martinez-Cutillas, A. Physiological Thresholds for Efficient Regulated Deficit-Irrigation Management in Winegrapes Grown under Semiarid Conditions. Am. J. Enol. Vitic. 2010, 61, 300–312. [Google Scholar]
  27. Evanylo, G.; Sherony, C.; Spargo, J.; Starner, D.; Brosius, M.; Haering, K. Soil and Water Environmental Effects of Fertilizer-, Manure-, and Compost-Based Fertility Practices in an Organic Vegetable Cropping System. Agric. Ecosyst. Environ. 2008, 127, 50–58. [Google Scholar] [CrossRef]
  28. Bohórquez, W. El proceso de Compostaje; Universidad de la Salle: Bogota, DC, Colombia, 2019; ISBN 978-958-54-8668-3. [Google Scholar]
  29. Sayara, T.; Basheer-Salimia, R.; Hawamde, F.; Sánchez, A. Recycling of Organic Wastes through Composting: Process Performance and Compost Application in Agriculture. Agronomy 2020, 10, 1838. [Google Scholar] [CrossRef]
  30. Sonnentag, O.; Talbot, J.; Chen, J.M.; Roulet, N.T. Using Direct and Indirect Measurements of Leaf Area Index to Characterize the Shrub Canopy in an Ombrotrophic Peatland. Agric. For. Meteorol. 2007, 144, 200–212. [Google Scholar] [CrossRef]
  31. Retamal-Salgado, J.; Bastías, R.M.; Wilckens, R.; Paulino, L. Influence of Microclimatic Conditions under High Tunnels on the Physiological and Productive Responses in Blueberry Cv. O’Neal. Chil. J. Agric. Res. 2015, 75, 291–297. [Google Scholar] [CrossRef] [Green Version]
  32. Reyes-Diaz, M.; Alberdi, M.; de la Luz Mora, M. Short-Term Aluminum Stress Differentially Affects the Photochemical Efficiency of Photosystem II in Highbush Blueberry Genotypes. J. Am. Soc. Hortic. Sci. 2009, 134, 14–21. [Google Scholar] [CrossRef] [Green Version]
  33. van Kooten, O.; Snel, J.H. The Use of Chlorophyll Fluorescence Nomenclature in Plant Stress Physiology. Photosynth. Res. 1990, 25, 147–150. [Google Scholar] [CrossRef]
  34. Maxwell, K.; Johnson, G.N. Chlorophyll Fluorescence—A Practical Guide. J. Exp. Bot. 2000, 51, 659–668. [Google Scholar] [CrossRef]
  35. Yıldırım, A.; Mavi, A.; Kara, A.A. Determination of Antioxidant and Antimicrobial Activities of Rumex Crispus L. Extracts. J. Agric. Food Chem. 2001, 49, 4083–4089. [Google Scholar] [CrossRef]
  36. Brand-Williams, W.; Cuvelier, M.E.; Berset, C. Use of a Free Radical Method to Evaluate Antioxidant Activity. LWT—Food Sci. Technol. 1995, 28, 25–30. [Google Scholar] [CrossRef]
  37. Giordani, E.; Gori, M.; Arena, M.; Radice, S. Caracterización molecular de especies nativas de Berberis del NOA. Investig. Cienc. Univ. 2019, 3, 118. [Google Scholar]
  38. Giordani, E.; Müller, M.; Gambineri, F.; Paffetti, D.; Arena, M.; Radice, S. Genetic and Morphological Analysis of Berberis Microphylla G. Forst. Accessions in Southern Tierra Del Fuego. Plant Biosyst.—Int. J. Deal. Asp. Plant Biol. 2017, 151, 715–728. [Google Scholar] [CrossRef]
  39. Arena, M.E.; Lencinas, M.V.; Radice, S. Variability in Floral Traits and Reproductive Success among and within Populations of Berberis Microphylla G. Forst., an Underutilized Fruit Species. Sci. Hortic. 2018, 241, 65–73. [Google Scholar] [CrossRef]
  40. Arena, M.E.; Postemsky, P.D.; Curvetto, N.R. Changes in the Phenolic Compounds and Antioxidant Capacity of Berberis Microphylla G. Forst. Berries in Relation to Light Intensity and Fertilization. Sci. Hortic. 2017, 218, 63–71. [Google Scholar] [CrossRef]
  41. Arena, M.E.; Radice, S. Shoot Growth and Development of Berberis Buxifolia Lam. in Tierra Del Fuego (Patagonia). Sci. Hortic. 2014, 165, 5–12. [Google Scholar] [CrossRef]
  42. Romero-Román, M.E.; Schoebitz, M.; Bastías, R.M.; Fernández, P.S.; García-Viguera, C.; López-Belchi, M.D. Native Species Facing Climate Changes: Response of Calafate Berries to Low Temperature and UV Radiation. Foods 2021, 10, 196. [Google Scholar] [CrossRef] [PubMed]
  43. Peri, P.L.; Arena, M.; Martínez Pastur, G.; Lencinas, M.V. Photosynthetic Response to Different Light Intensities, Water Status and Leaf Age of Two Berberis Species (Berberidaceae) of Patagonian Steppe, Argentina. J. Arid Environ. 2011, 75, 1218–1222. [Google Scholar] [CrossRef]
  44. Guo, X.; Li, S.; Wang, D.; Huang, Z.; Sarwar, N.; Mubeen, K.; Shakeel, M.; Hussain, M. Effects of water and fertilizer coupling on the physiological characteristics and growth of rabbiteye blueberry. PLoS ONE 2021, 16, e0254013. [Google Scholar] [CrossRef] [PubMed]
  45. Hasnain, M.; Chen, J.; Ahmed, N.; Memon, S.; Wang, L.; Wang, Y.; Wang, P. The Effects of Fertilizer Type and Application Time on Soil Properties, Plant Traits, Yield and Quality of Tomato. Sustainability 2020, 12, 9065. [Google Scholar] [CrossRef]
  46. Medina, J.; Calabi-Floody, M.; Aponte, H.; Santander, C.; Paneque, M.; Meier, S.; Panettieri, M.; Cornejo, P.; Borie, F.; Knicker, H. Utilization of Inorganic Nanoparticles and Biochar as Additives of Agricultural Waste Composting: Effects of End-Products on Plant Growth, C and Nutrient Stock in Soils from a Mediterranean Region. Agronomy 2021, 11, 767. [Google Scholar] [CrossRef]
  47. Maselesele, D.; Ogola, J.B.O.; Murovhi, R.N. Macadamia Husk Compost Improved Physical and Chemical Properties of a Sandy Loam Soil. Sustainability 2021, 13, 6997. [Google Scholar] [CrossRef]
  48. Mohamed, M.H.M.; Petropoulos, S.A.; Ali, M.M.E. The Application of Nitrogen Fertilization and Foliar Spraying with Calcium and Boron Affects Growth Aspects, Chemical Composition, Productivity and Fruit Quality of Strawberry Plants. Horticulturae 2021, 7, 257. [Google Scholar] [CrossRef]
  49. Wen, M.; Zhang, J.; Zheng, Y.; Yi, S. Effects of Combined Potassium and Organic Fertilizer Application on Newhall Navel Orange Nutrient Uptake, Yield, and Quality. Agronomy 2021, 11, 1990. [Google Scholar] [CrossRef]
  50. Arena, M.E.; Curvetto, N. Berberis Buxifolia Fruiting: Kinetic Growth Behavior and Evolution of Chemical Properties during the Fruiting Period and Different Growing Seasons. Sci. Hortic. 2008, 118, 120–127. [Google Scholar] [CrossRef]
  51. Cojocaru, A.; Vlase, L.; Munteanu, N.; Stan, T.; Teliban, G.C.; Burducea, M.; Stoleru, V. Dynamic of Phenolic Compounds, Antioxidant Activity, and Yield of Rhubarb under Chemical, Organic and Biological Fertilization. Plants 2020, 9, 355. [Google Scholar] [CrossRef]
  52. Fredes, C.; Parada, A.; Salinas, J.; Robert, P. Phytochemicals and Traditional Use of Two Southernmost Chilean Berry Fruits: Murta (Ugni Molinae Turcz) and Calafate (Berberis Buxifolia Lam.). Foods 2020, 9, 54. [Google Scholar] [CrossRef] [PubMed] [Green Version]
  53. Giordani, E.; Radice, S.; Lencinas, M.V.; Arena, M. Variabilidad fenotípica de Berberis microphylla G. Forst. en poblaciones naturales de Tierra del Fuego, una especie frutal forestal no maderable con posibilidad de diversificar la producción agroforestal patagónica. Investig. Cienc. Univ. 2019, 3, 91. [Google Scholar]
  54. Arena, M.E. Estudio de Algunos Fenómenos Morfofisiológicos y Cambios Bioquímicos en Berberis microphylla G. Forst. (sinónimo B. Buxifolia Lam.) Asociados a la Formación y Maduración de Frutos en Tierra de Fuego y su Relación con la Producción de Metabolitos Útiles; Sebelas Maret University: Surakarta City, Indonesia, 2016. [Google Scholar]
Figure 1. Average photosynthetically active radiation (PAR); (a) direct PAR (µmol m−2 s−1) and (b) absorbed PAR (µmol m−2 s−1) for the different treatments for the seasons 2018–2019 and 2019–2020. For (b): according to Fischer’s LSD test (p < 0.05), there are no significant differences between treatments; the experimental error was very small, so the error bars were not observed.
Agriculture 12 00098 g001
Figure 2. Leaf area index (LAI; m2 m−2) of calafate (Berberis mycrophilla G. Forst) for the different compost treatments for the 2018–2019 and 2019–2020 seasons. For each figure: CK = Control treatment (without compost application); T1 = Treatment 1 (5 Ton ha−1); T2 = Treatment 2 (10 Ton ha−1); T3 = Treatment 3 (15 Ton ha−1). For each season, different lowercase letters indicate significant differences for the leaf area index between treatments according to Fischer’s LSD test (p < 0.05). The bars correspond to the experimental error of each treatment.
Agriculture 12 00098 g002
Figure 3. Variation of maximum quantum yield of photosystem II (Fv/Fm) in calafate plants (Berberis mycrophilla G. Forst) for the different compost treatments, evaluated at different times of the day, 09:00, 11:00, 13:00, 15:00 and 17:00, corresponding to the figure: (a) season 2018–2019; (b) season 2019–2020. For each figure: CK = Control treatment (without compost application); T1 = Treatment 1 (5 Ton ha−1); T2 = Treatment 2 (10 Ton ha−1); T3 = Treatment 3 (15 Ton ha−1). For each hour of the day, different lowercase letters indicate significant differences between treatments according to Fischer’s LSD test (p < 0.05). The bars correspond to the experimental error of each treatment.
Agriculture 12 00098 g003
Figure 4. Effect of different doses of compost on stomatal conductance (mmol m−2s−1) of the calafate leaf (Berberis mycrophilla G. Forst) for the 2018–2019 and 2019–2020 seasons. CK = Control treatment (without compost application); T1 = Treatment 1 (5 Ton ha−1); T2 = Treatment 2 (10 Ton ha−1); T3 = Treatment 3 (15 Ton ha−1). For each treatment, different lowercase letters indicate significant differences in both seasons according to Fischer’s LSD test (p < 0.05). The bars correspond to the experimental error of each treatment.
Agriculture 12 00098 g004
Figure 5. Effect of different doses of compost on the antioxidant capacity of the Calafate fruit (Berberis mycrophilla G. Forst) for the 2018–2019 and 2019–2020 seasons. CK = Control treatment (without compost application); T1 = Treatment 1 (5 Ton ha−1); T2 = Treatment 2 (10 Ton ha−1); T3 = Treatment 3 (15 Ton ha−1). For each treatment, different lowercase letters indicate significant differences in both seasons according to Fischer’s LSD test (p < 0.05). The bars correspond to the experimental error of each treatment.
Agriculture 12 00098 g005
Figure 6. Effect of different doses of compost on the total polyphenolic content of calafate fruit (Berberis mycrophilla G. Forst) for the 2018–2019 and 2019–2020 seasons. CK = Control treatment (without compost application); T1 = Treatment 1 (5 Ton ha−1); T2 = Treatment 2 (10 Ton ha−1); T3 = Treatment 3 (15 Ton ha−1). For each treatment, different lowercase letters indicate significant differences in both seasons according to Fischer’s LSD test (p < 0.05). The bars correspond to the experimental error of each treatment.
Agriculture 12 00098 g006
Figure 7. Effect of different doses of compost on the total anthocyanin content of the calafate fruit (Berberis microphylla G. Forst) for the 2018–2019 and 2019–2020 seasons. CK = Control treatment (without compost application); T1 = Treatment 1 (5 Ton ha−1); T2 = Treatment 2 (10 Ton ha−1); T3 = Treatment 3 (15 Ton ha−1). For each treatment, different lowercase letters indicate significant differences in both seasons according to Fischer’s LSD test (p <0.05). The bars correspond to the experimental error of each treatment.
Agriculture 12 00098 g007
Figure 8. Effect of different doses of compost on the yield of calafate fruit (Berberis microphylla G. Forst) for the 2018–2019 and 2019–2020 seasons. CK = Control treatment (without application of com-post); T1 = Treatment 1 (5 Ton ha−1); T2 = Treatment 2 (10 Ton ha−1); T3 = Treatment 3 (15 Ton ha−1). For each season, different lowercase letters indicate significant differences in the different treatments according to Fischer’s LSD test (p < 0.05). The bars correspond to the experimental error of each treatment.
Agriculture 12 00098 g008
Table 1. Physical-chemical analysis of the soil before treatments.
Analysis 1UnitResult
Organic matter%9.70
Water pH 6.40
Nitrogen availabilitymg kg−119.00
Phosohorus availabilitymg kg−115.30
Potassium availabilitymg kg−1496.00
Sulfur availabilitymg kg−124.00
Exchangeable calciumcmol + kg−18.70
Exchangeable magnesiumcmol + kg−11.60
Exchangeable potassiumcmol + kg−11.30
Exchangeable sodiumcmol + kg−10.01
Sum of basescmol + kg−111.60
Interchangeable aluminumcmol + kg−10.02
CECcmol + kg−111.59
Aluminum saturation%0.14
Boronmg kg−10.40
Coppermg kg−11.63
Zincmg kg−10.90
Ironmg kg−144.00
Manganesemg kg−13.02
1 Samples were obtained at the beginning of the study in August of 2017, 0–40 cm depth. CEC = cation exchange capacity of soil.
Table 2. Physical–chemical analysis of compost used for this study.
AnalysisUnitsResult
Humidity (dry basis)%22.20
Apparent density (dry basis ˂16 mm)Kg m−3NS *
Porosity (sample ˂16 mm)mg kg−1NS *
pH in water 1:5 7.41
Electric conductivity 1:5dS/m0.19
Organic matter%21.60
Organic carbon%12.00
Total nitrogen%0.87
Nitrogen–ammonia (N– NH 4 +)mg kg−10.50
Nitrogen–Nitric (N– NO 3 )mg kg−159.64
Carbon/Nitrogen Ratio--13.78
Ammonium/Nitrate Ratio--0.008
* Undetermined.
Table 3. Physicochemical analysis of the soil in the 2019/2020 season at the end of the study.
AnalysisUnitsTreatments 1
CKT1T2T3
Organic matter%9.8010.4011.0011.90
Water pH---6.596.566.506.60
Nitrogen availablemg kg−116.0018.0016.0013.00
Available phosphorusmg kg−110.0014.009.0013.00
Available potassiummg kg−1342.00332.00372.00359.00
Available sulfurmg kg−19.0012.0029.0027.00
Exchangeable calciumcmol+ kg−19.2510.9010.0410.86
Exchangeable magnesiumcmol+ kg−12.172.331.822.19
Exchangeable potassiumcmol+ kg−10.870.850.950.92
Exchangeable sodiumcmol+ kg−10.300.270.290.29
Sum of basescmol+ kg−112.5914.3613.1014.26
Interch. aluminumcmol+ kg−10.0100.0010.0100.010
CECcmol+ kg−112.6014.3713.1114.27
Aluminum saturation%0.080.070.080.07
Boronmg kg−10.450.480.500.45
Coppermg kg−12.062.112.141.85
Zincmg kg−10.901.621.171.74
Ironmg kg−135.0033.1031.3030.80
Manganesemg kg−13.023.503,206.00
1 CK = Control treatment (without compost application); T1 = Treatment 1 (5 Ton ha−1); T2 = Treatment 2 (10 Ton ha−1); T3 = Treatment 3 (15 Ton ha−1). CEC = cation exchange capacity of soil; all samples were obtained at the end of the study in August 2020 at a depth between 0–40 cm.
Publisher’s Note: MDPI stays neutral with regard to jurisdictional claims in published maps and institutional affiliations.

