
Quantification of Dust Emissions during Tillage Operations in Steep Slope Vineyards in the Moselle Area

Abstract
:1. Introduction
1.1. Processes of Wind Erosion and Dust Emission with and without Mechanical Impact
1.2. Tillage Induced Airborne Dust and Dust Emissions from Vineyards
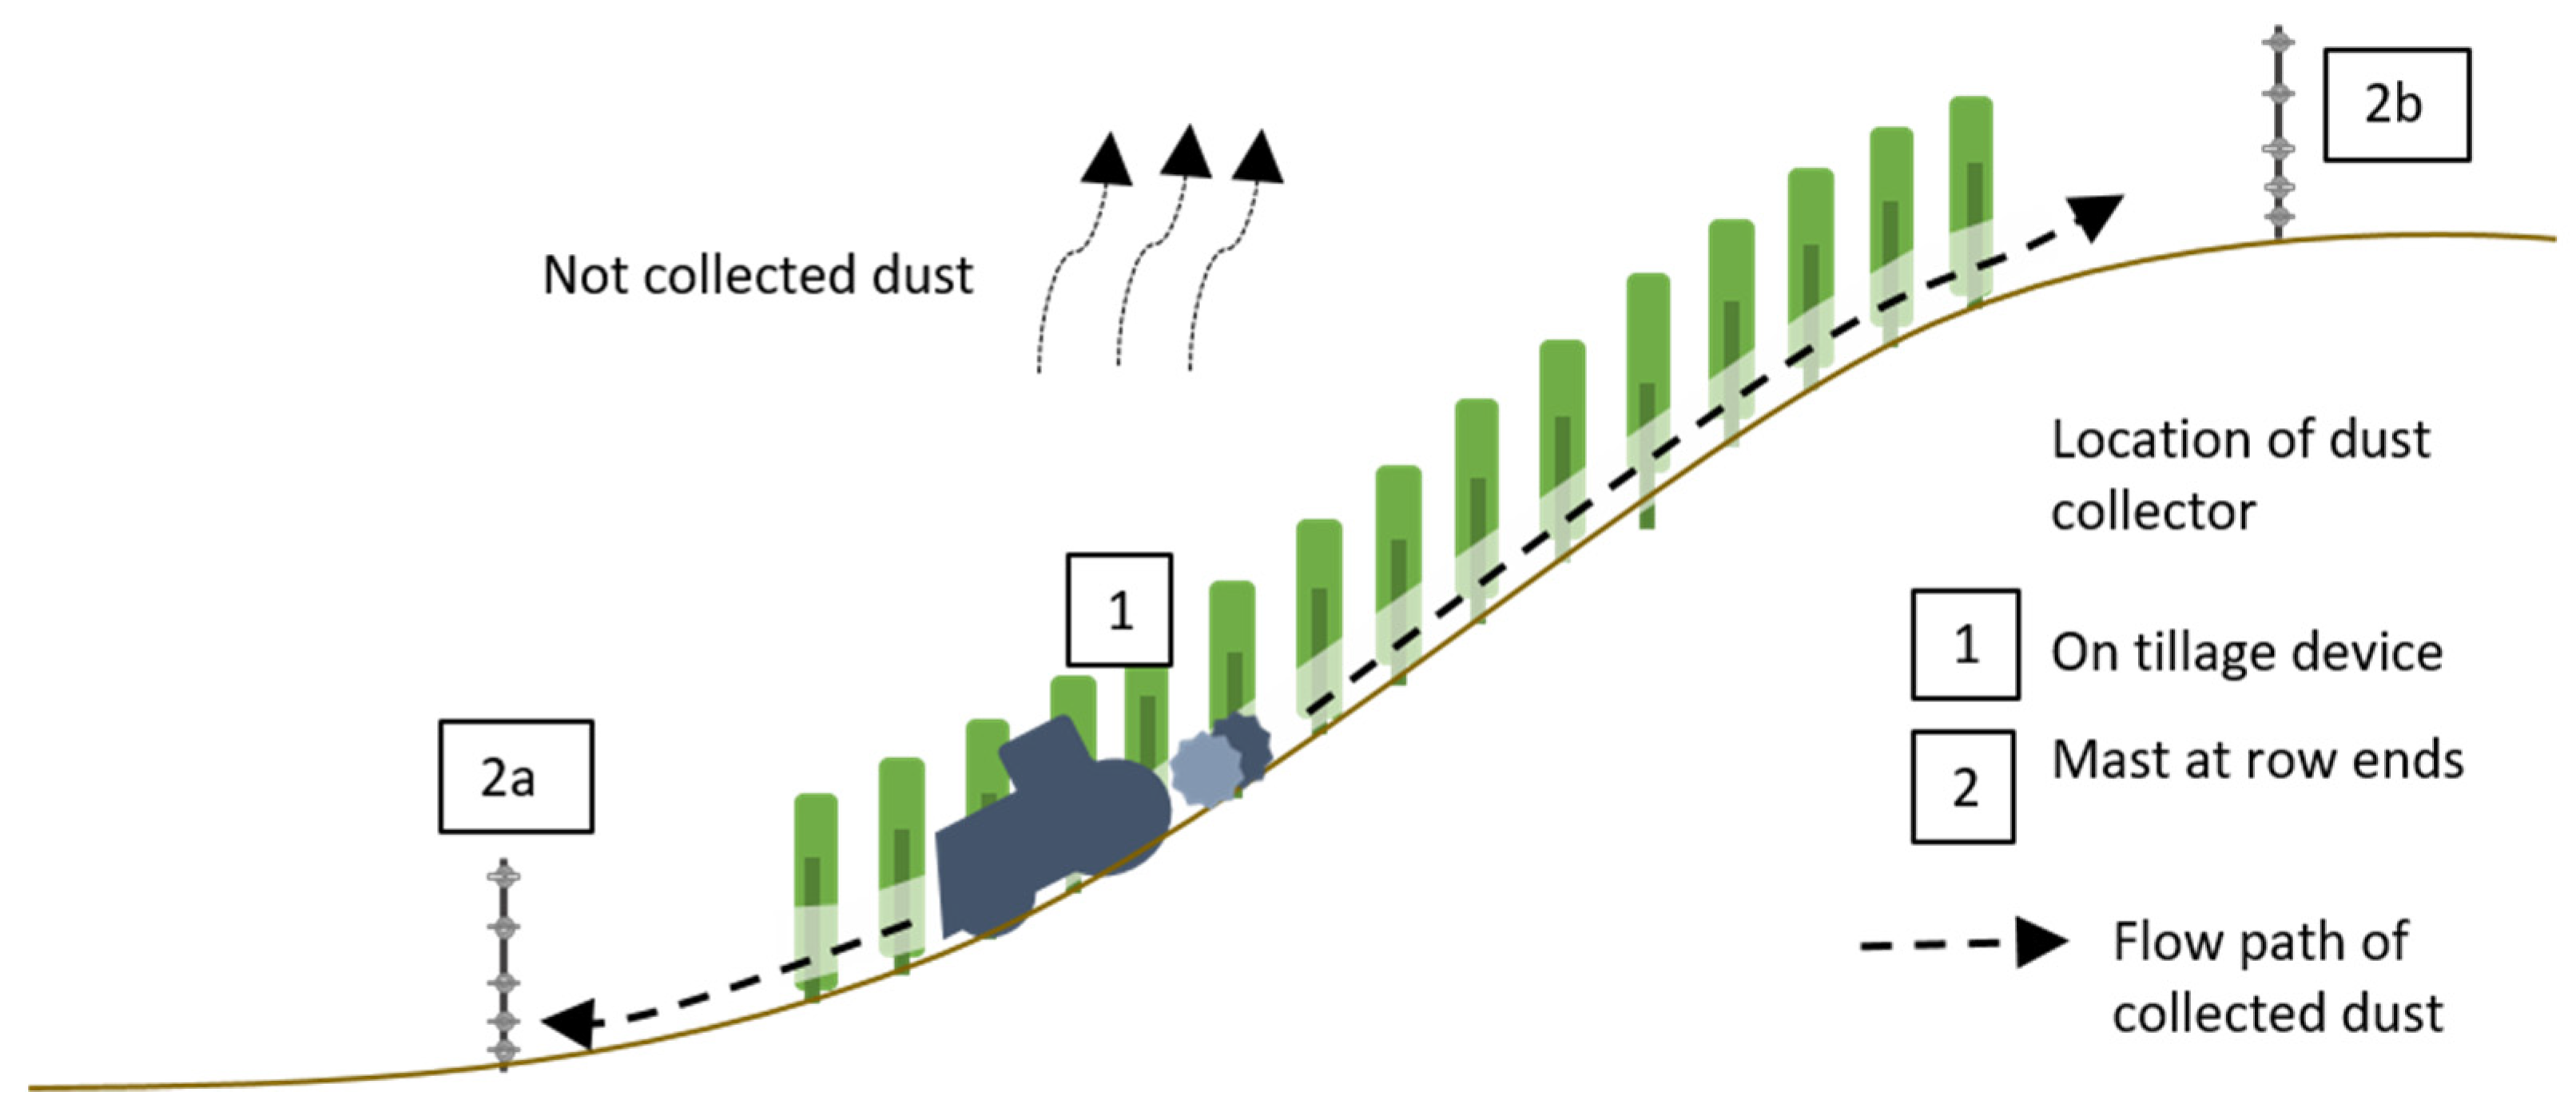
- The tested low-cost on-site test scheme including sediment samplers MWAC sampler is adequate to quantify dust emissions from vineyards on a small temporal and spatial scale;
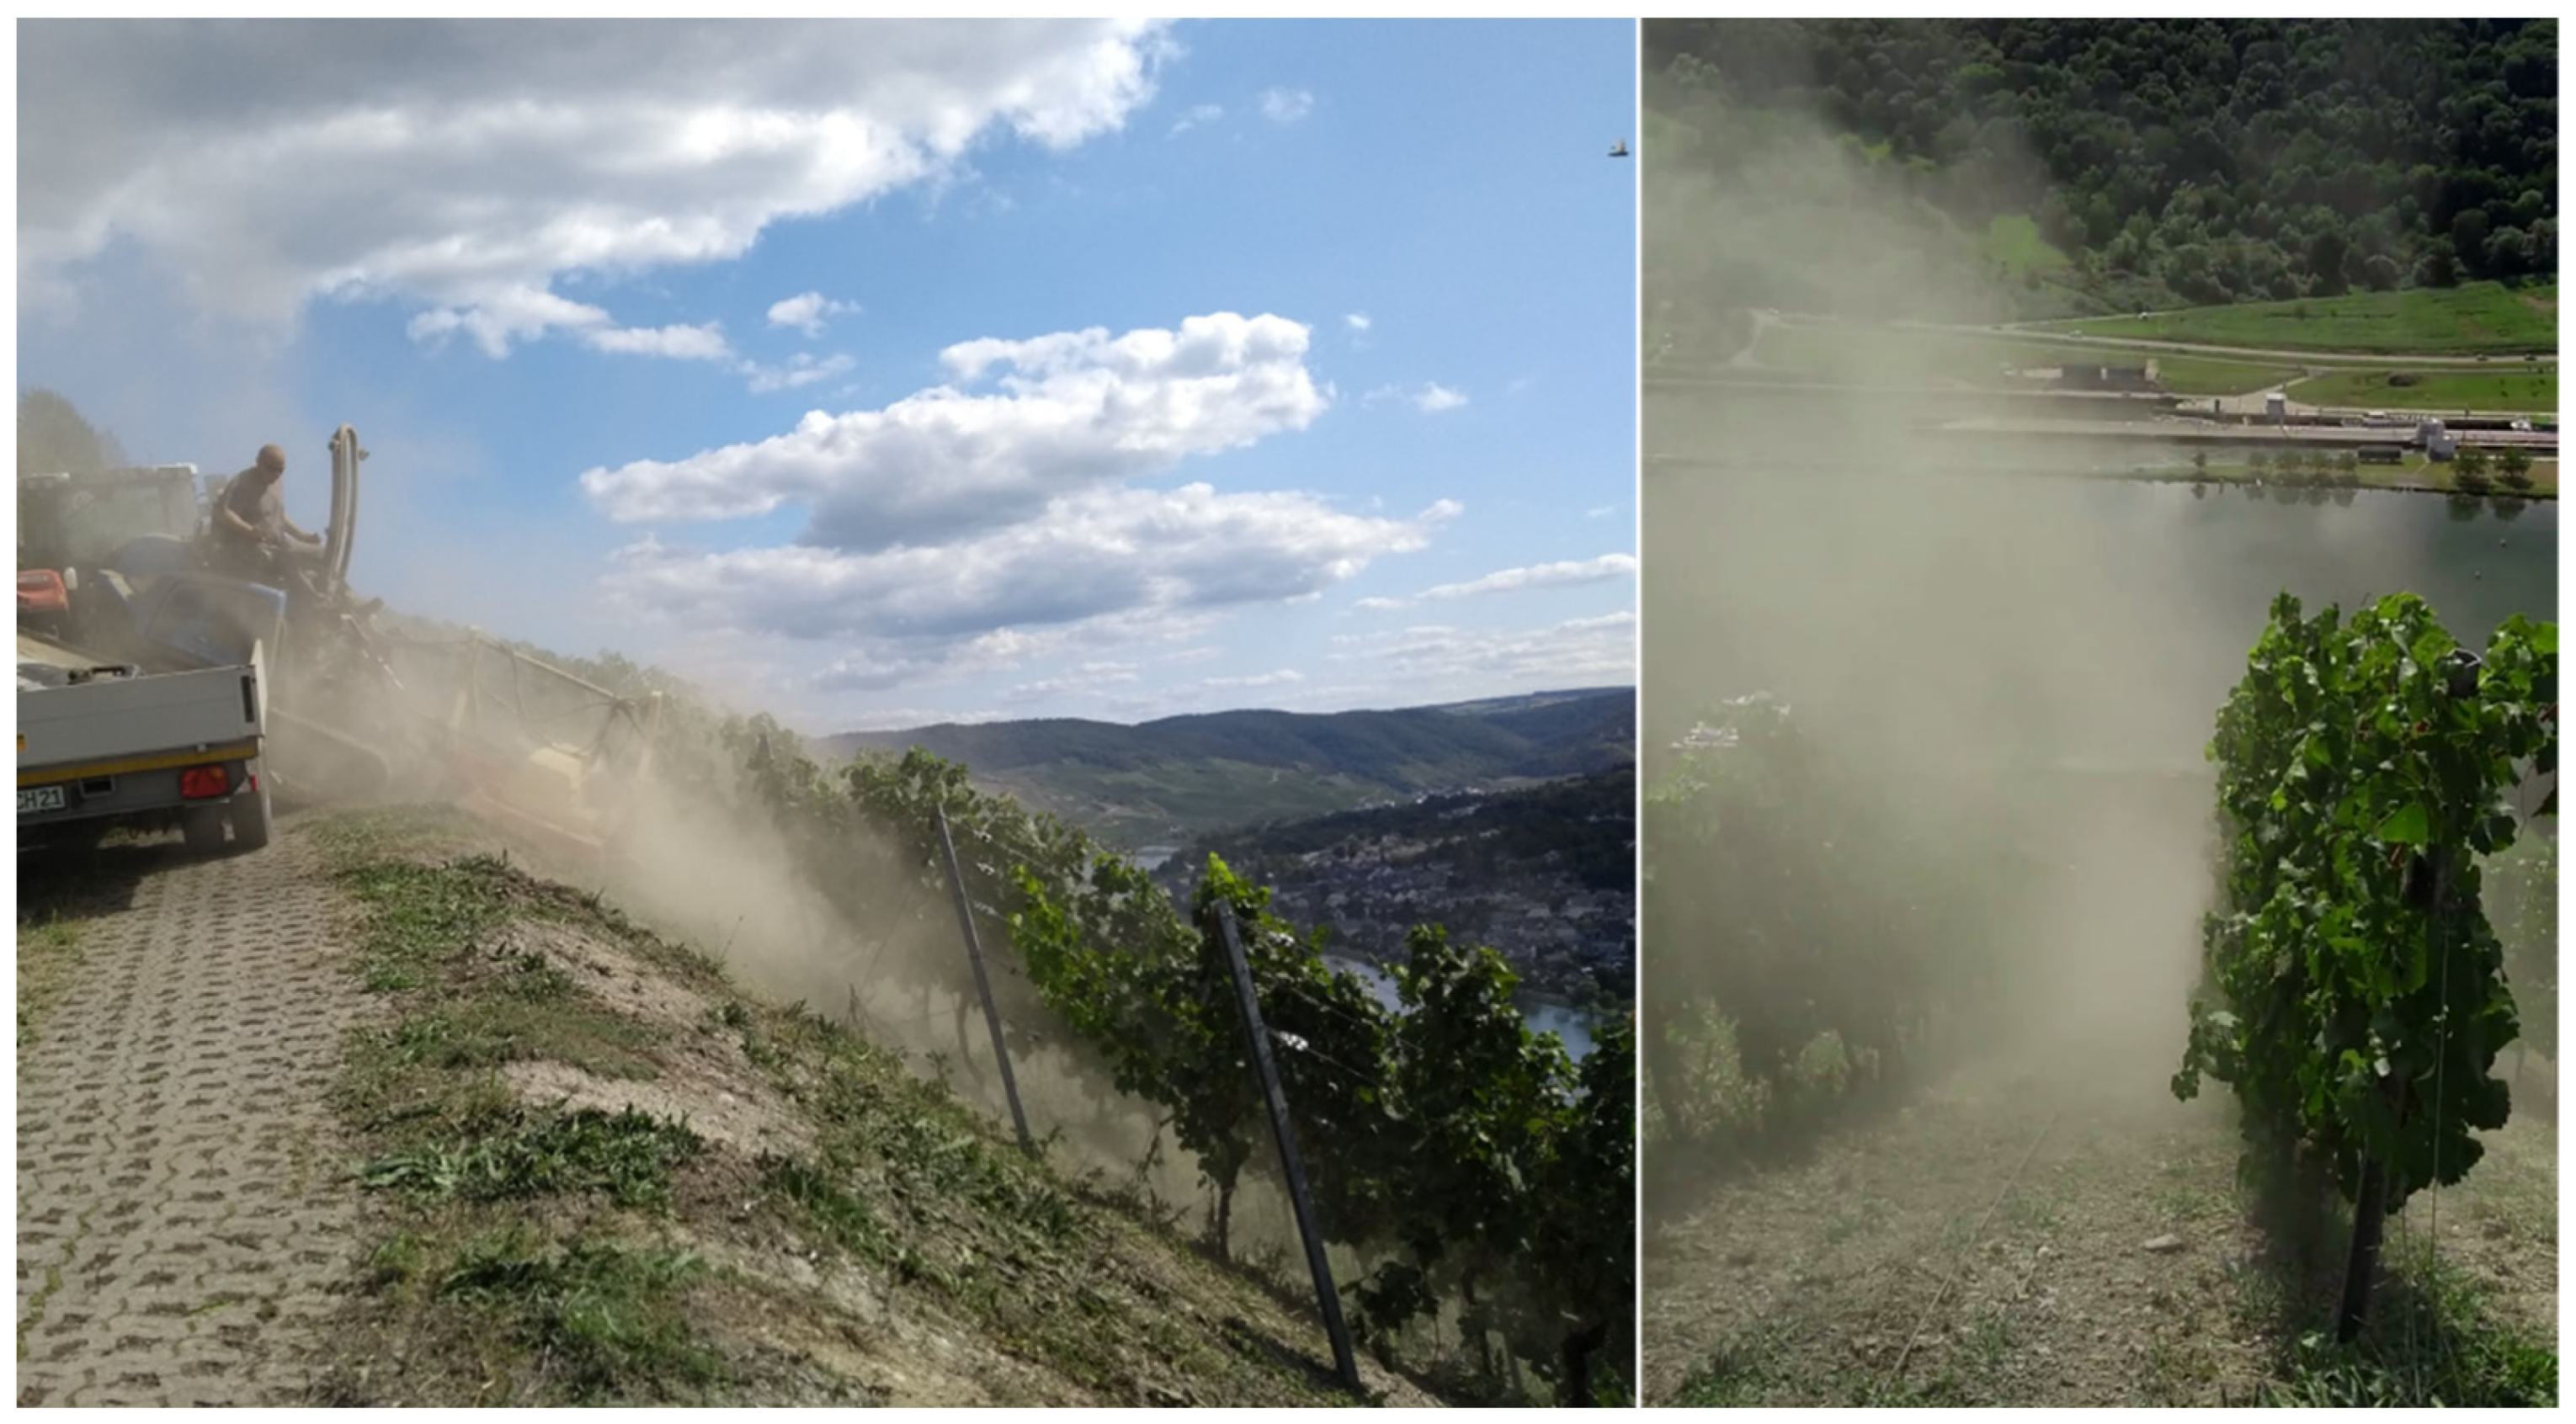
- Vineyards are a potential dust source particularly during cultivation activities;
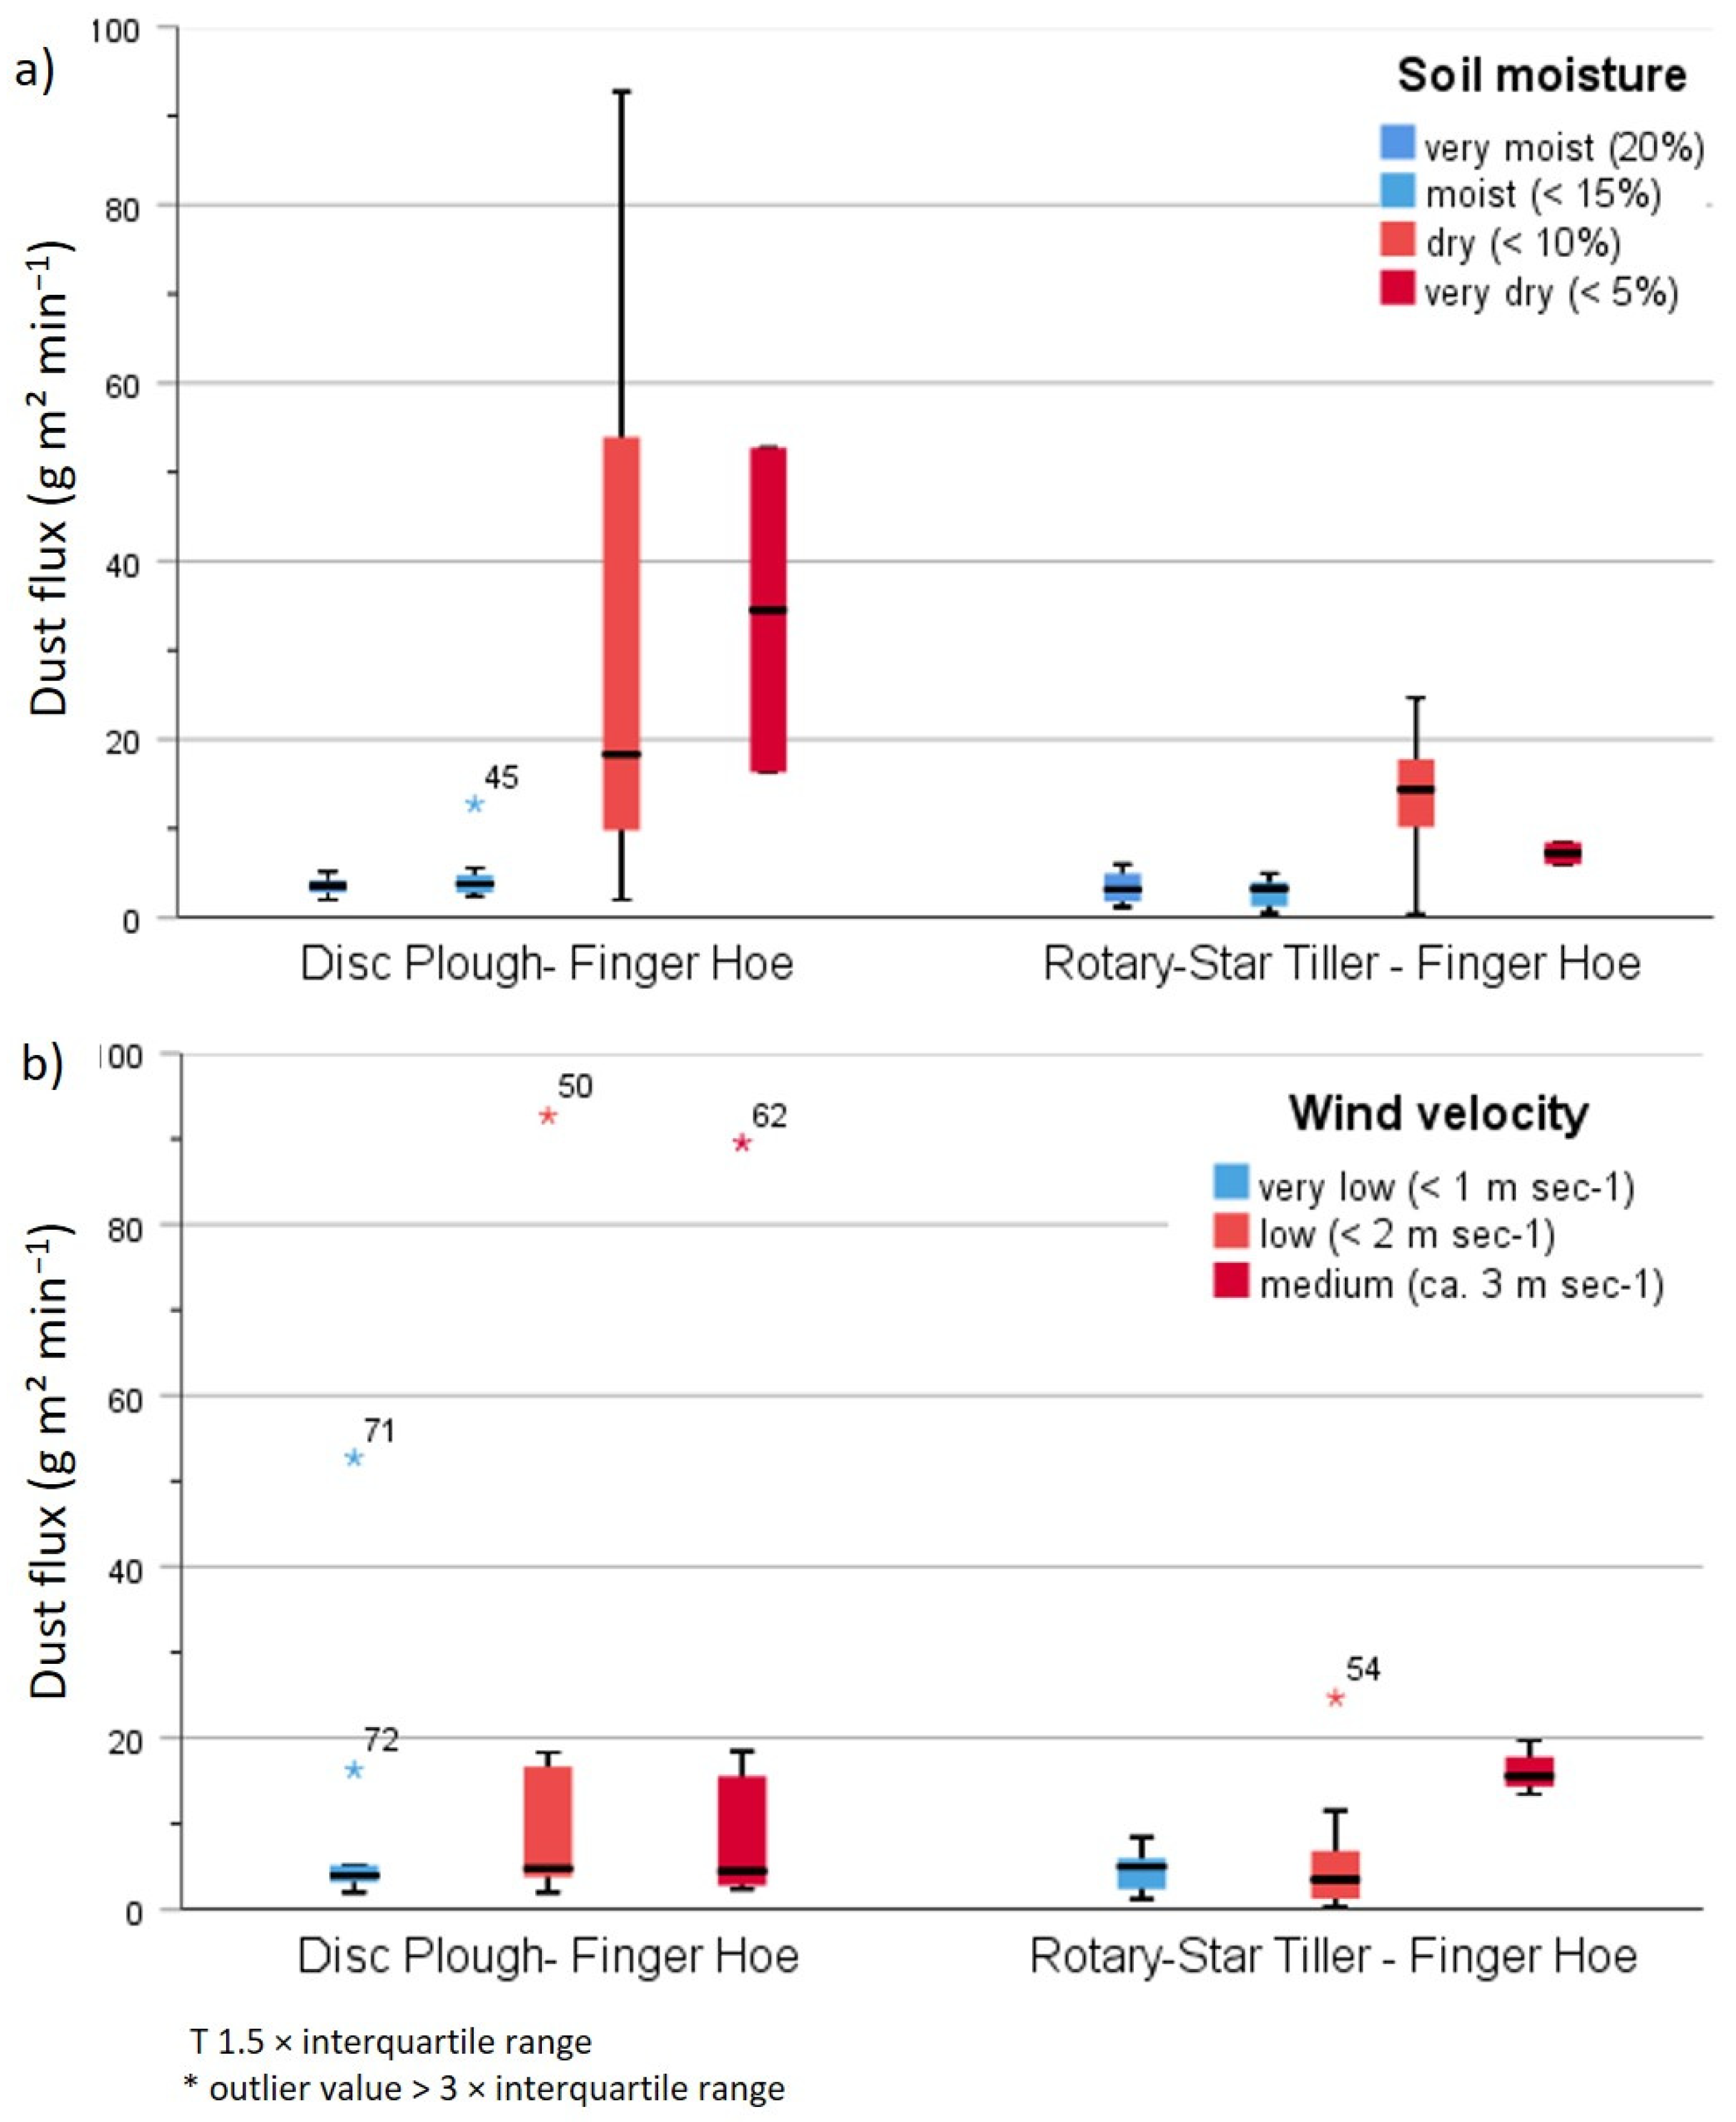
- The measured dust fluxes are related to environmental conditions and tillage tools.
2. Materials and Methods
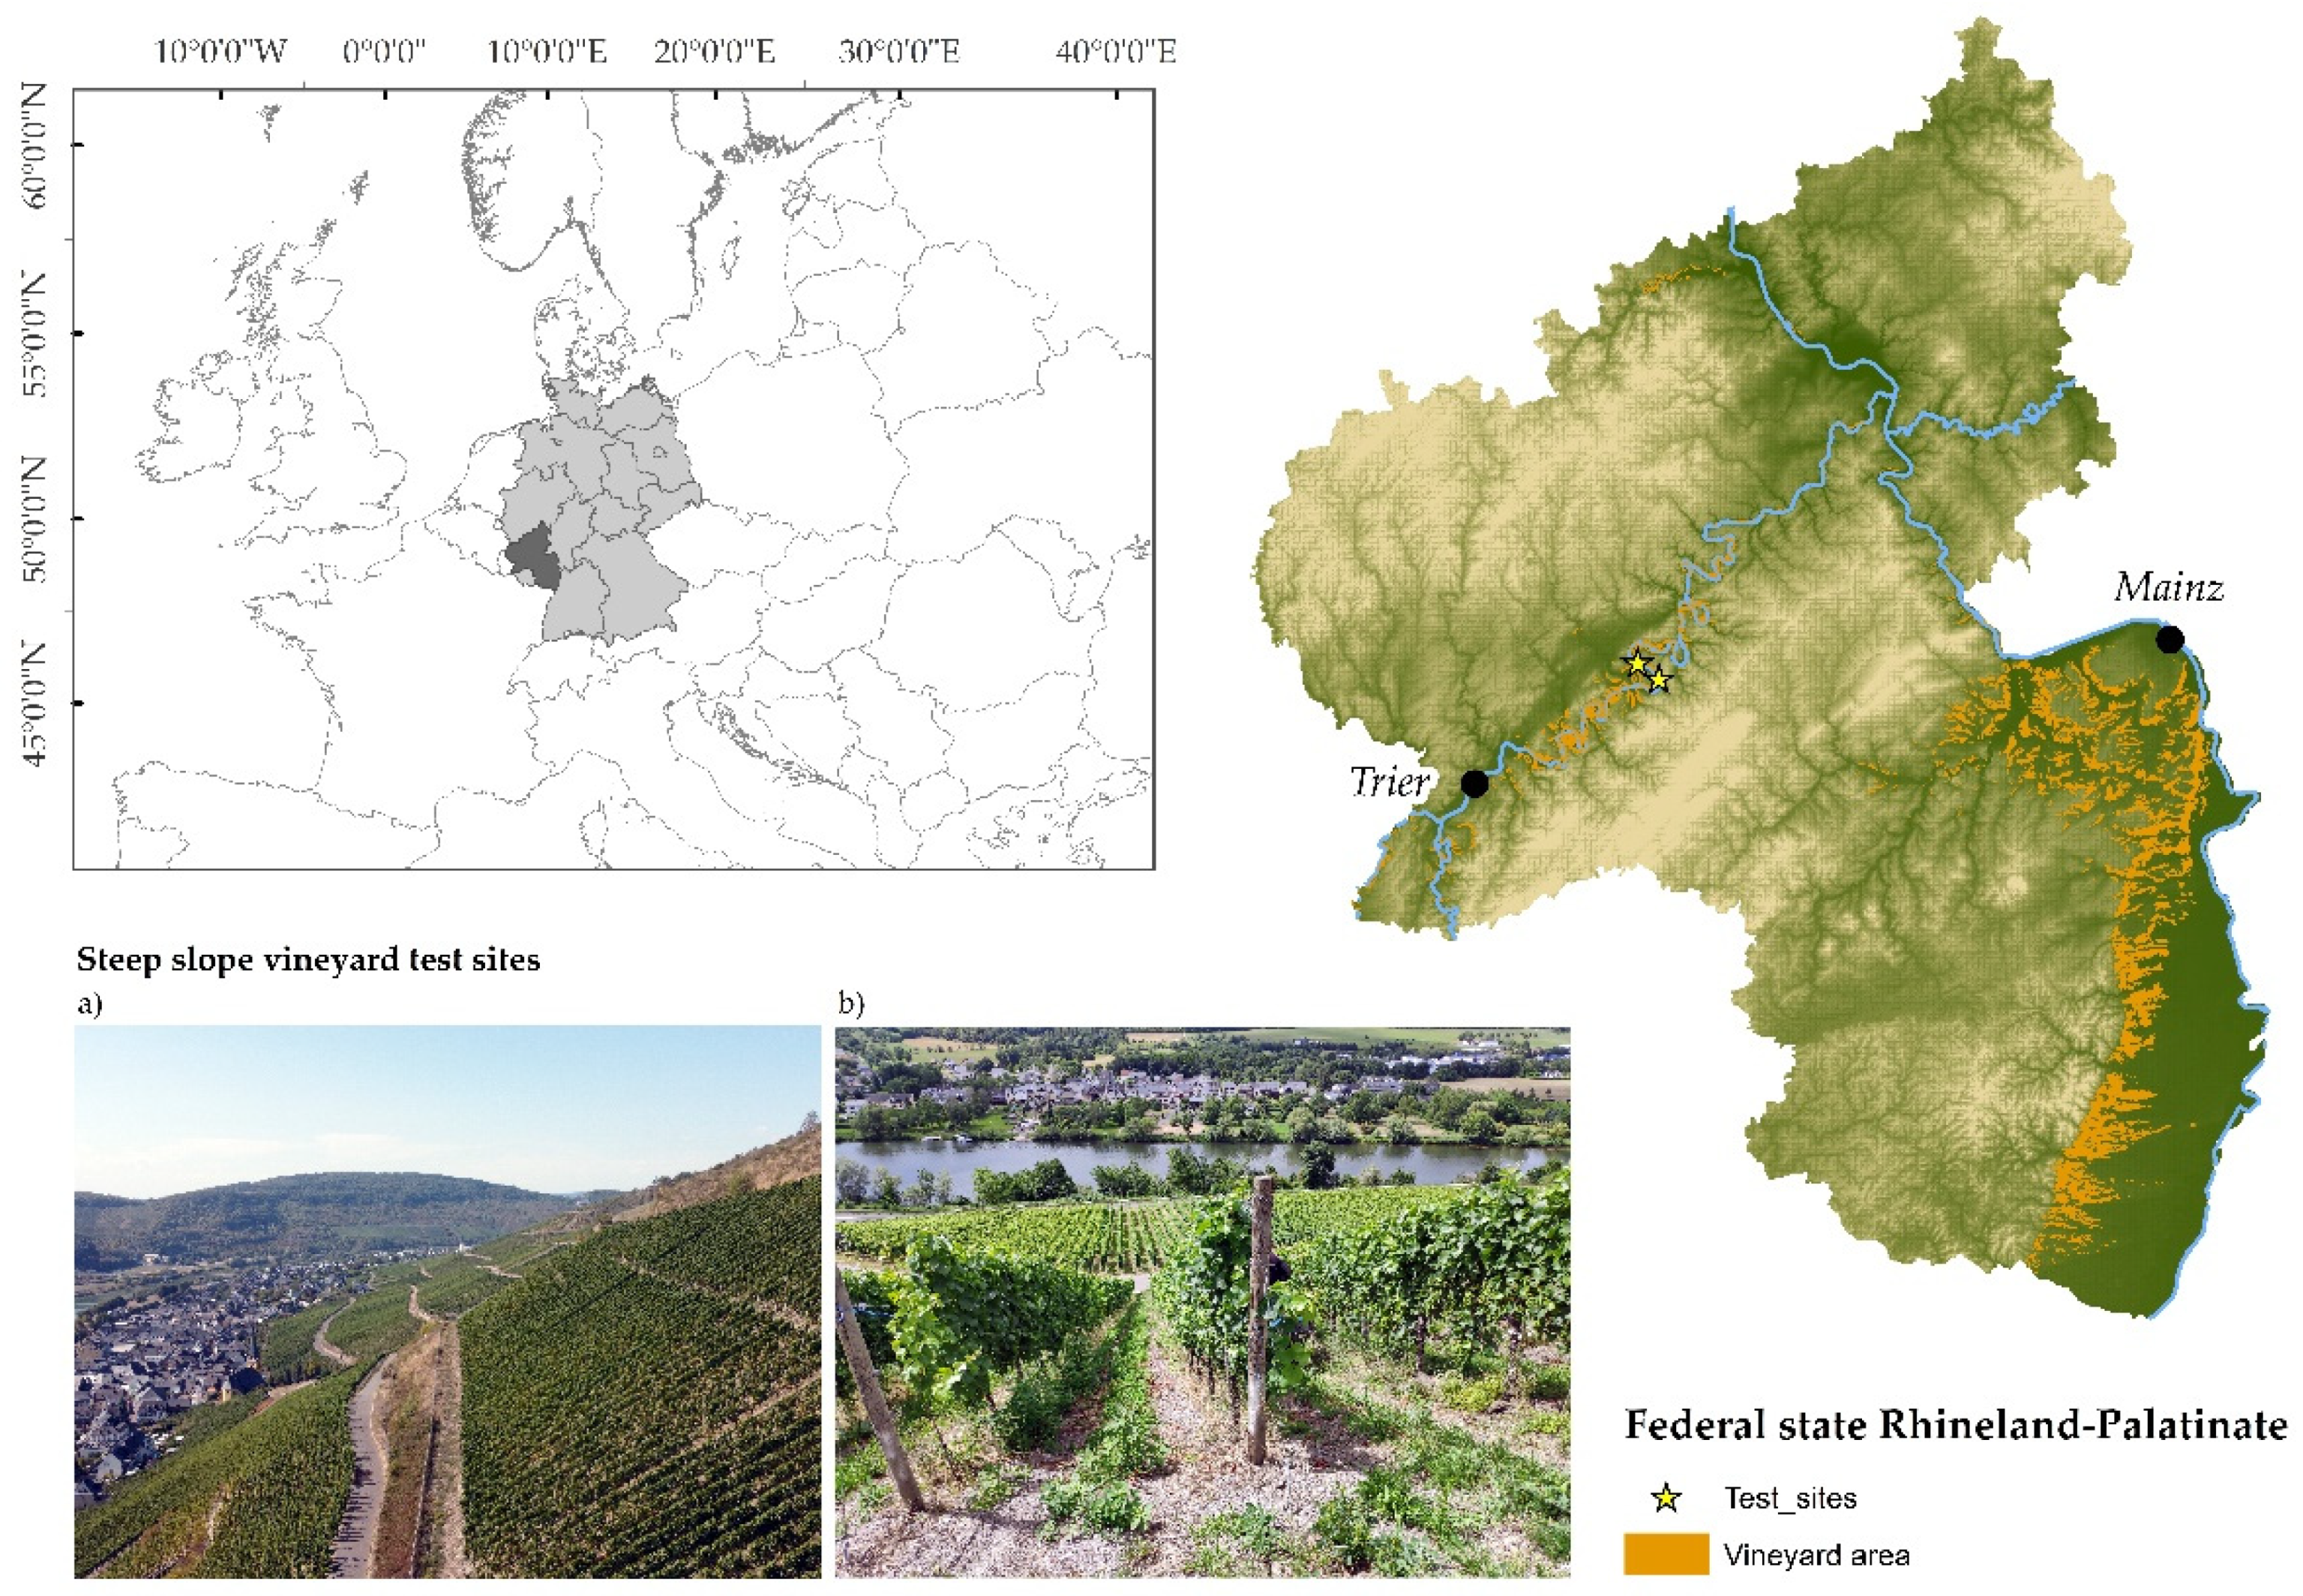
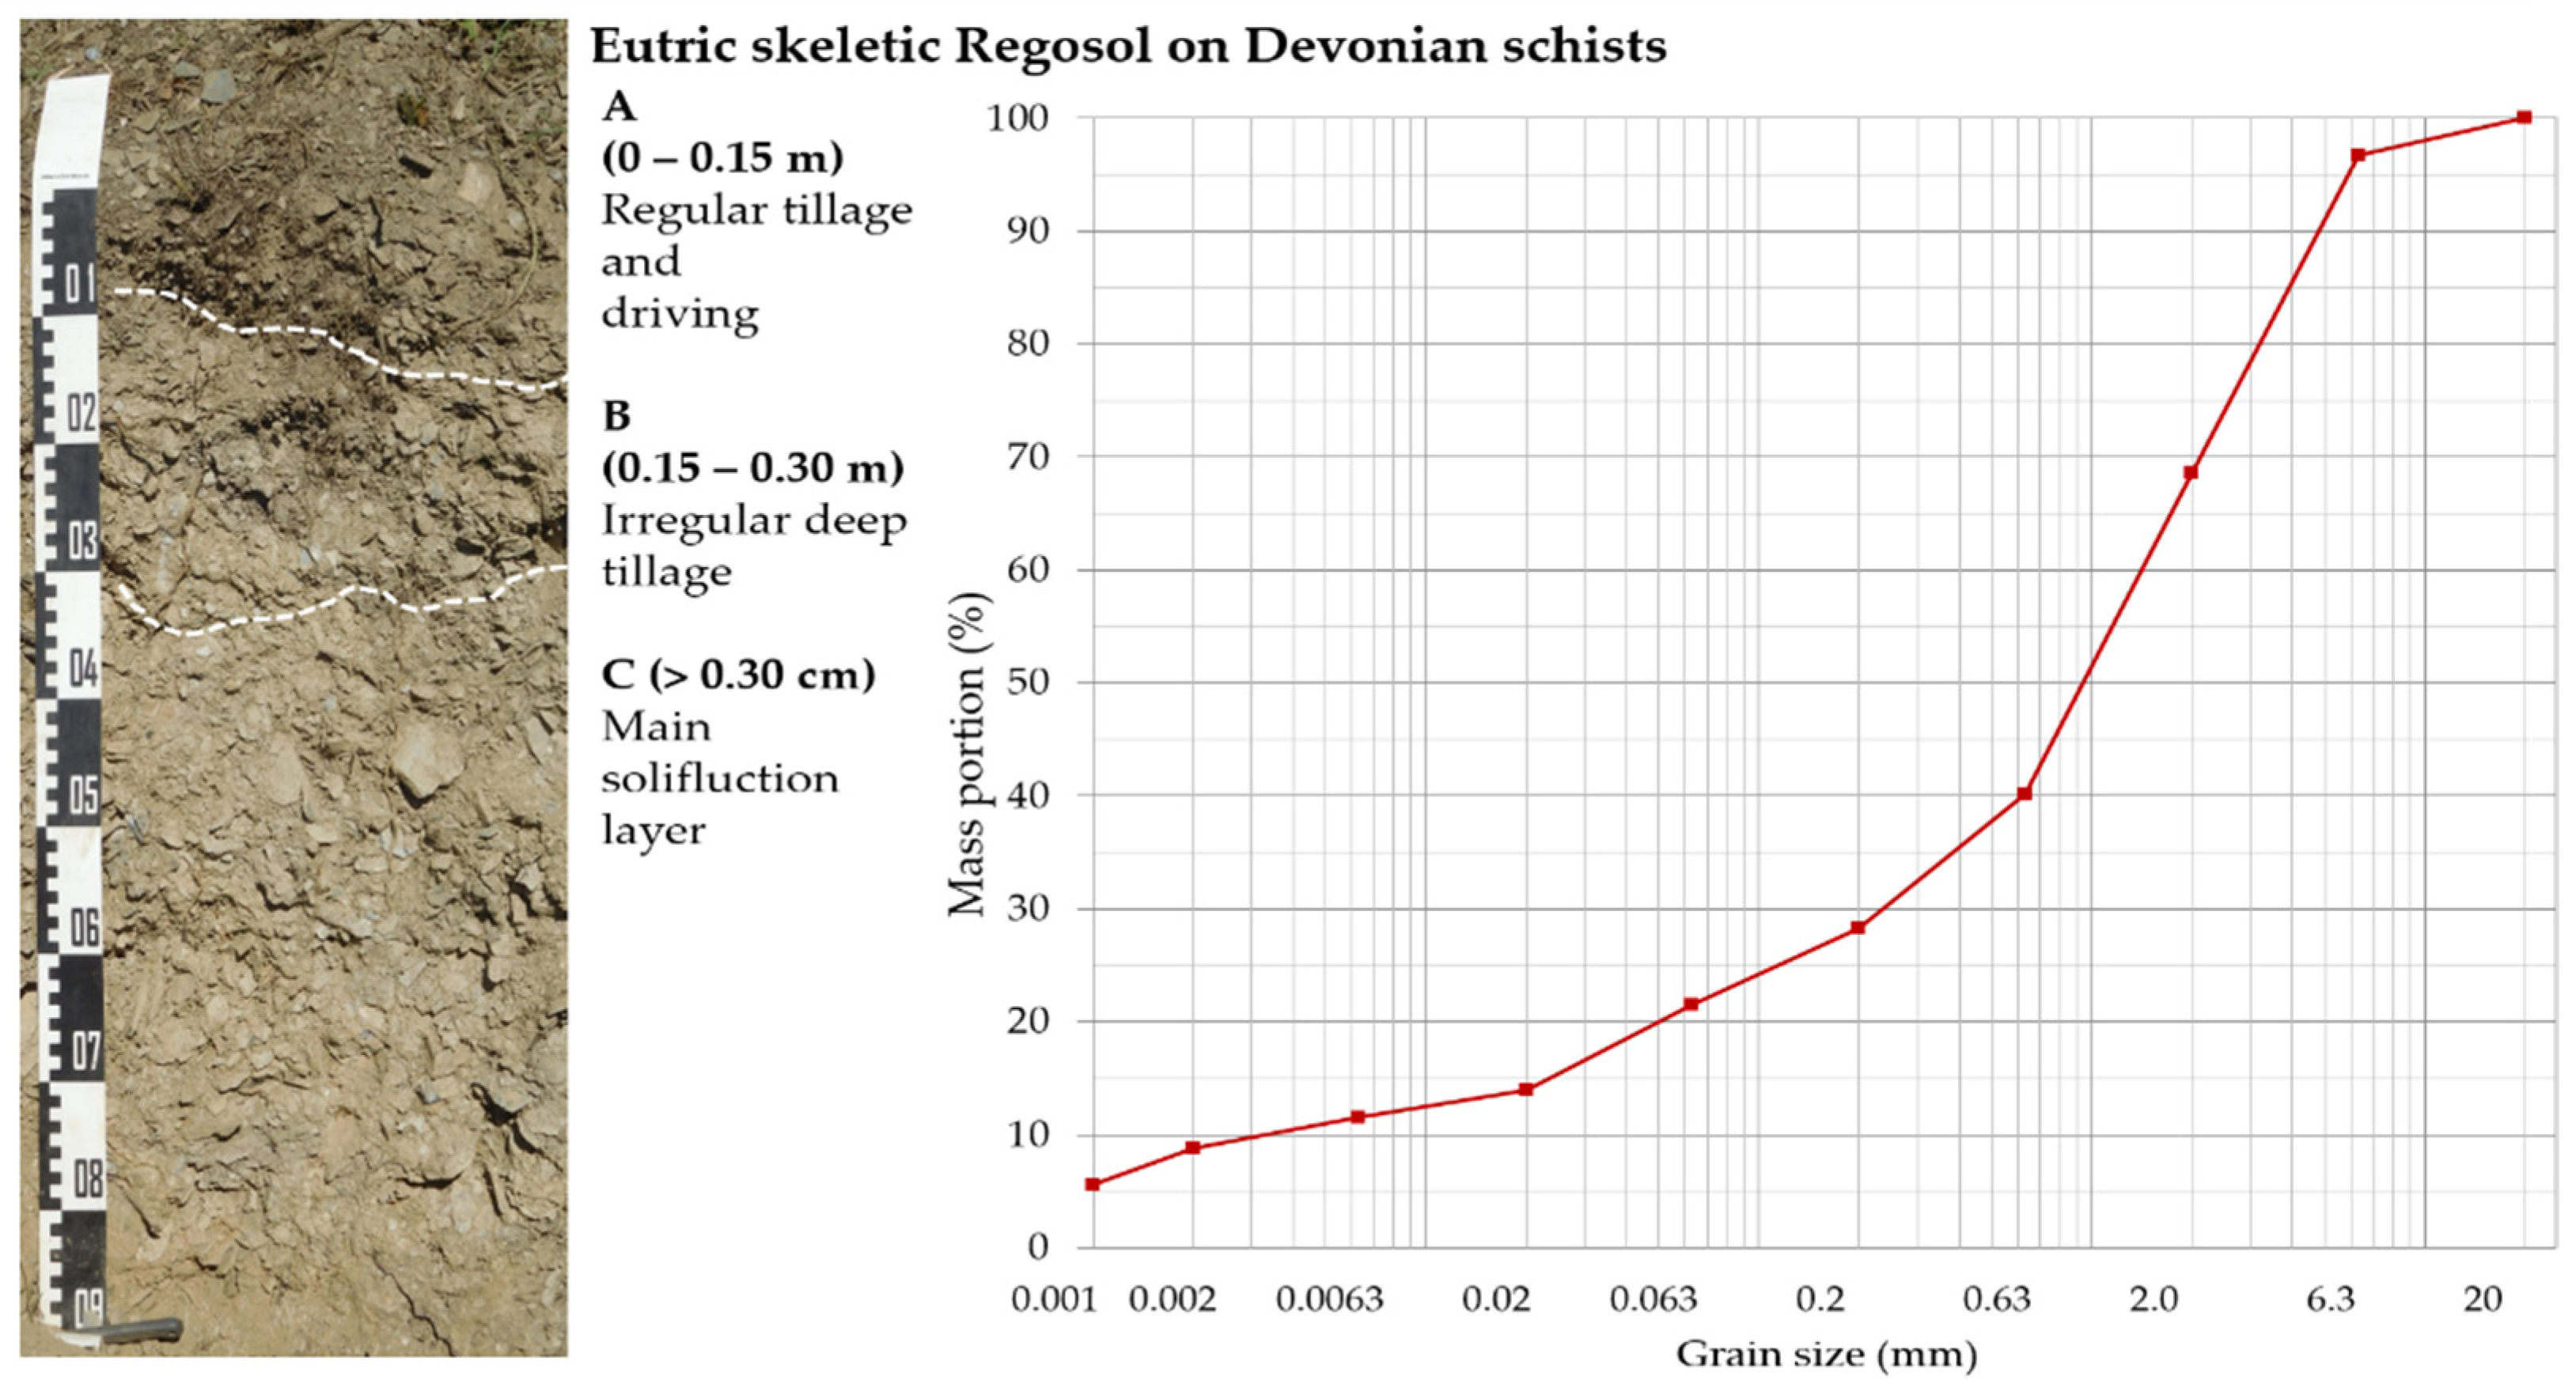
2.1. Study Site
2.2. Data Collection and Processing
2.3. Data Analysis
3. Results
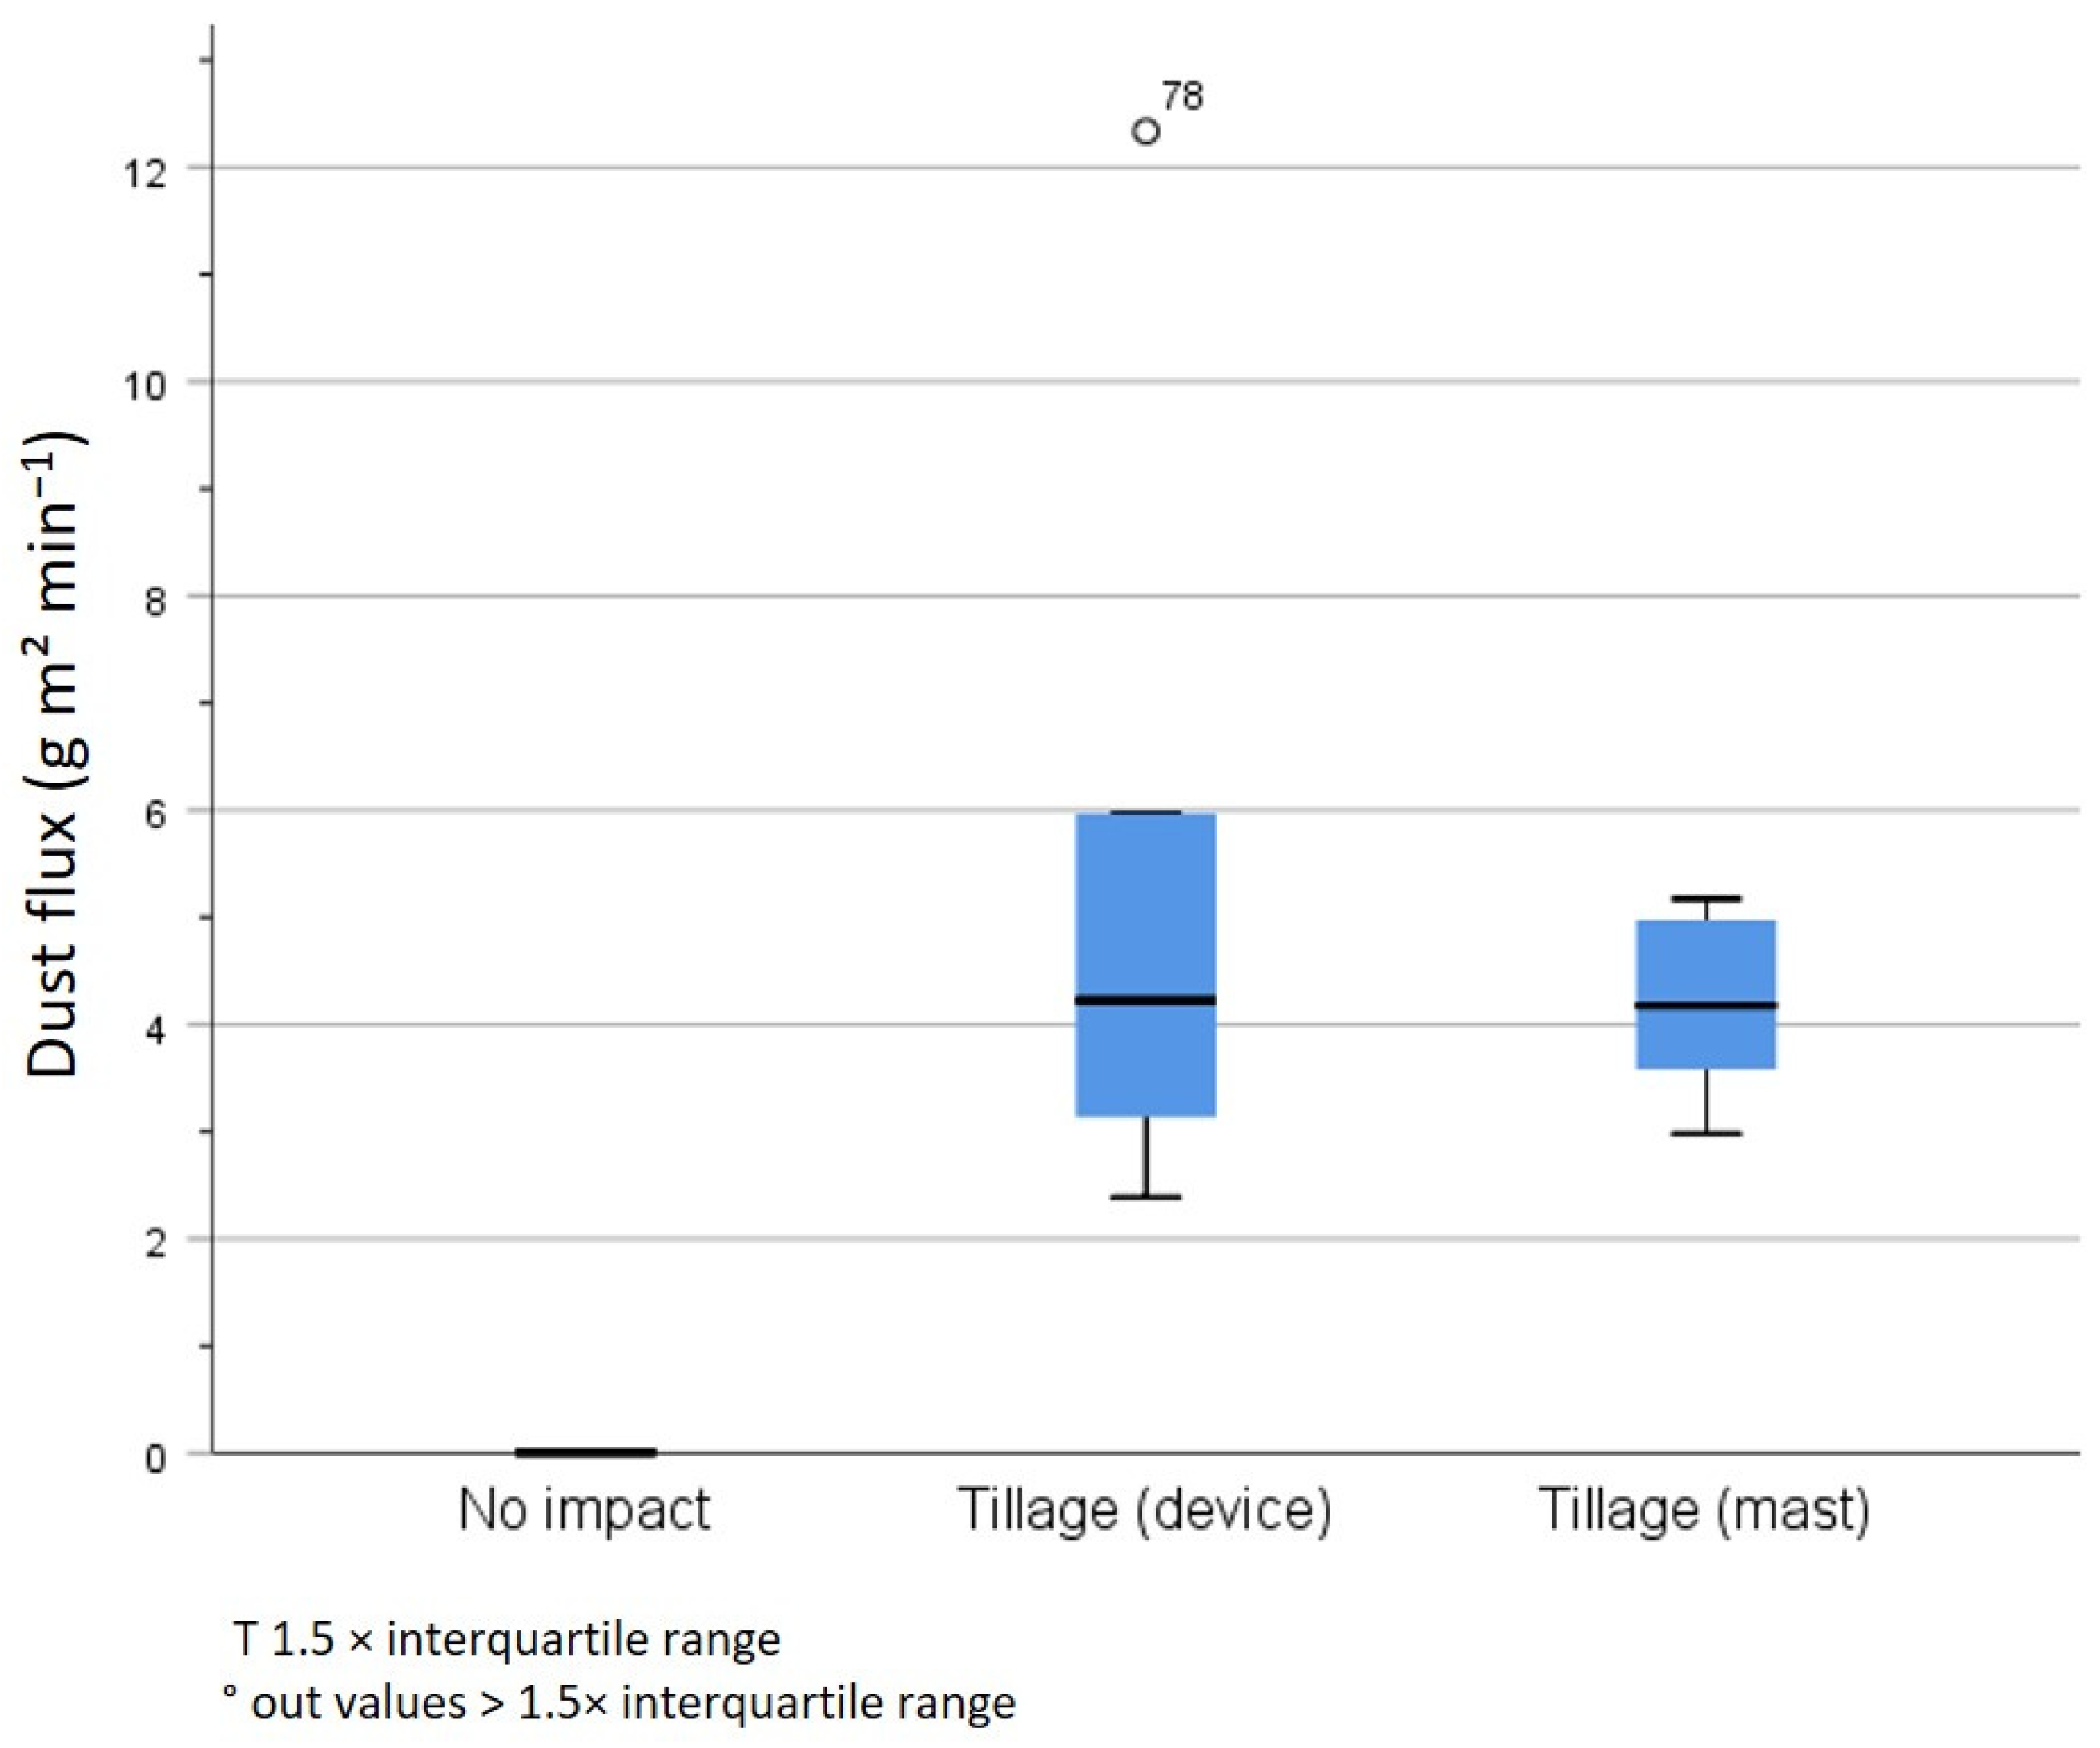
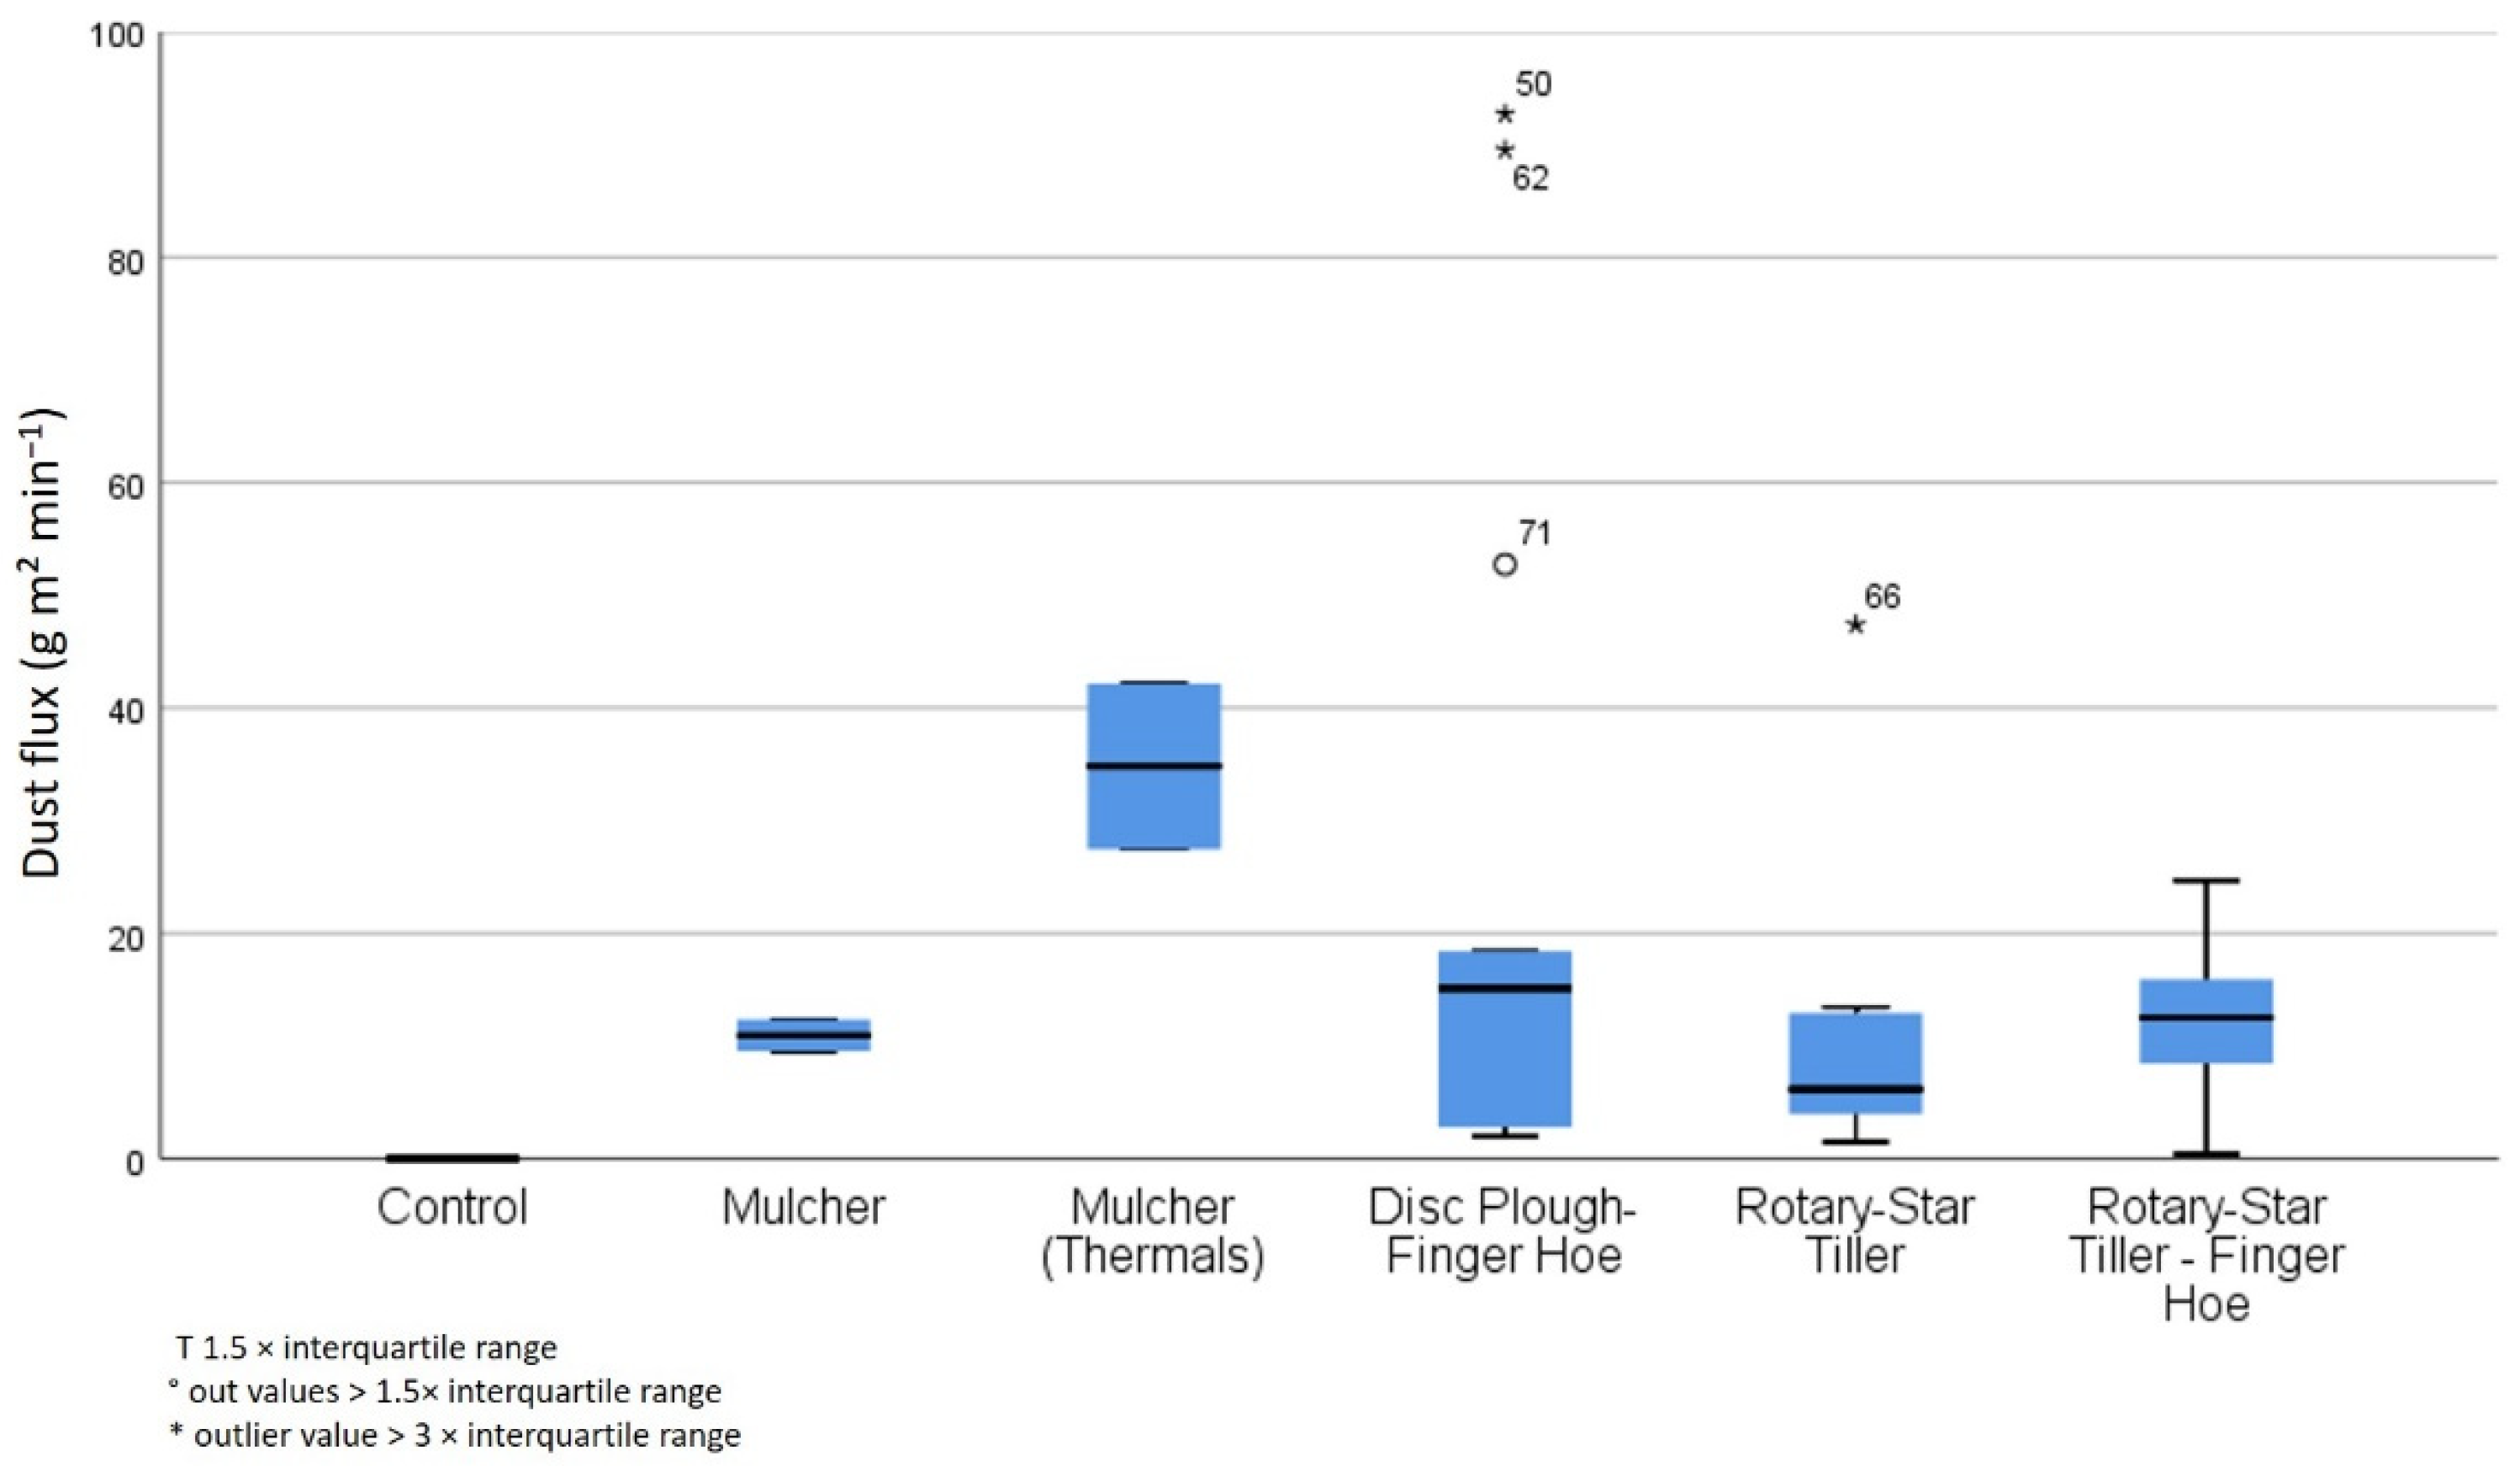
3.1. Dust Flux with and without Simultaneous Tillage
3.2. Parameters Influencing Dust Flux during Tillage
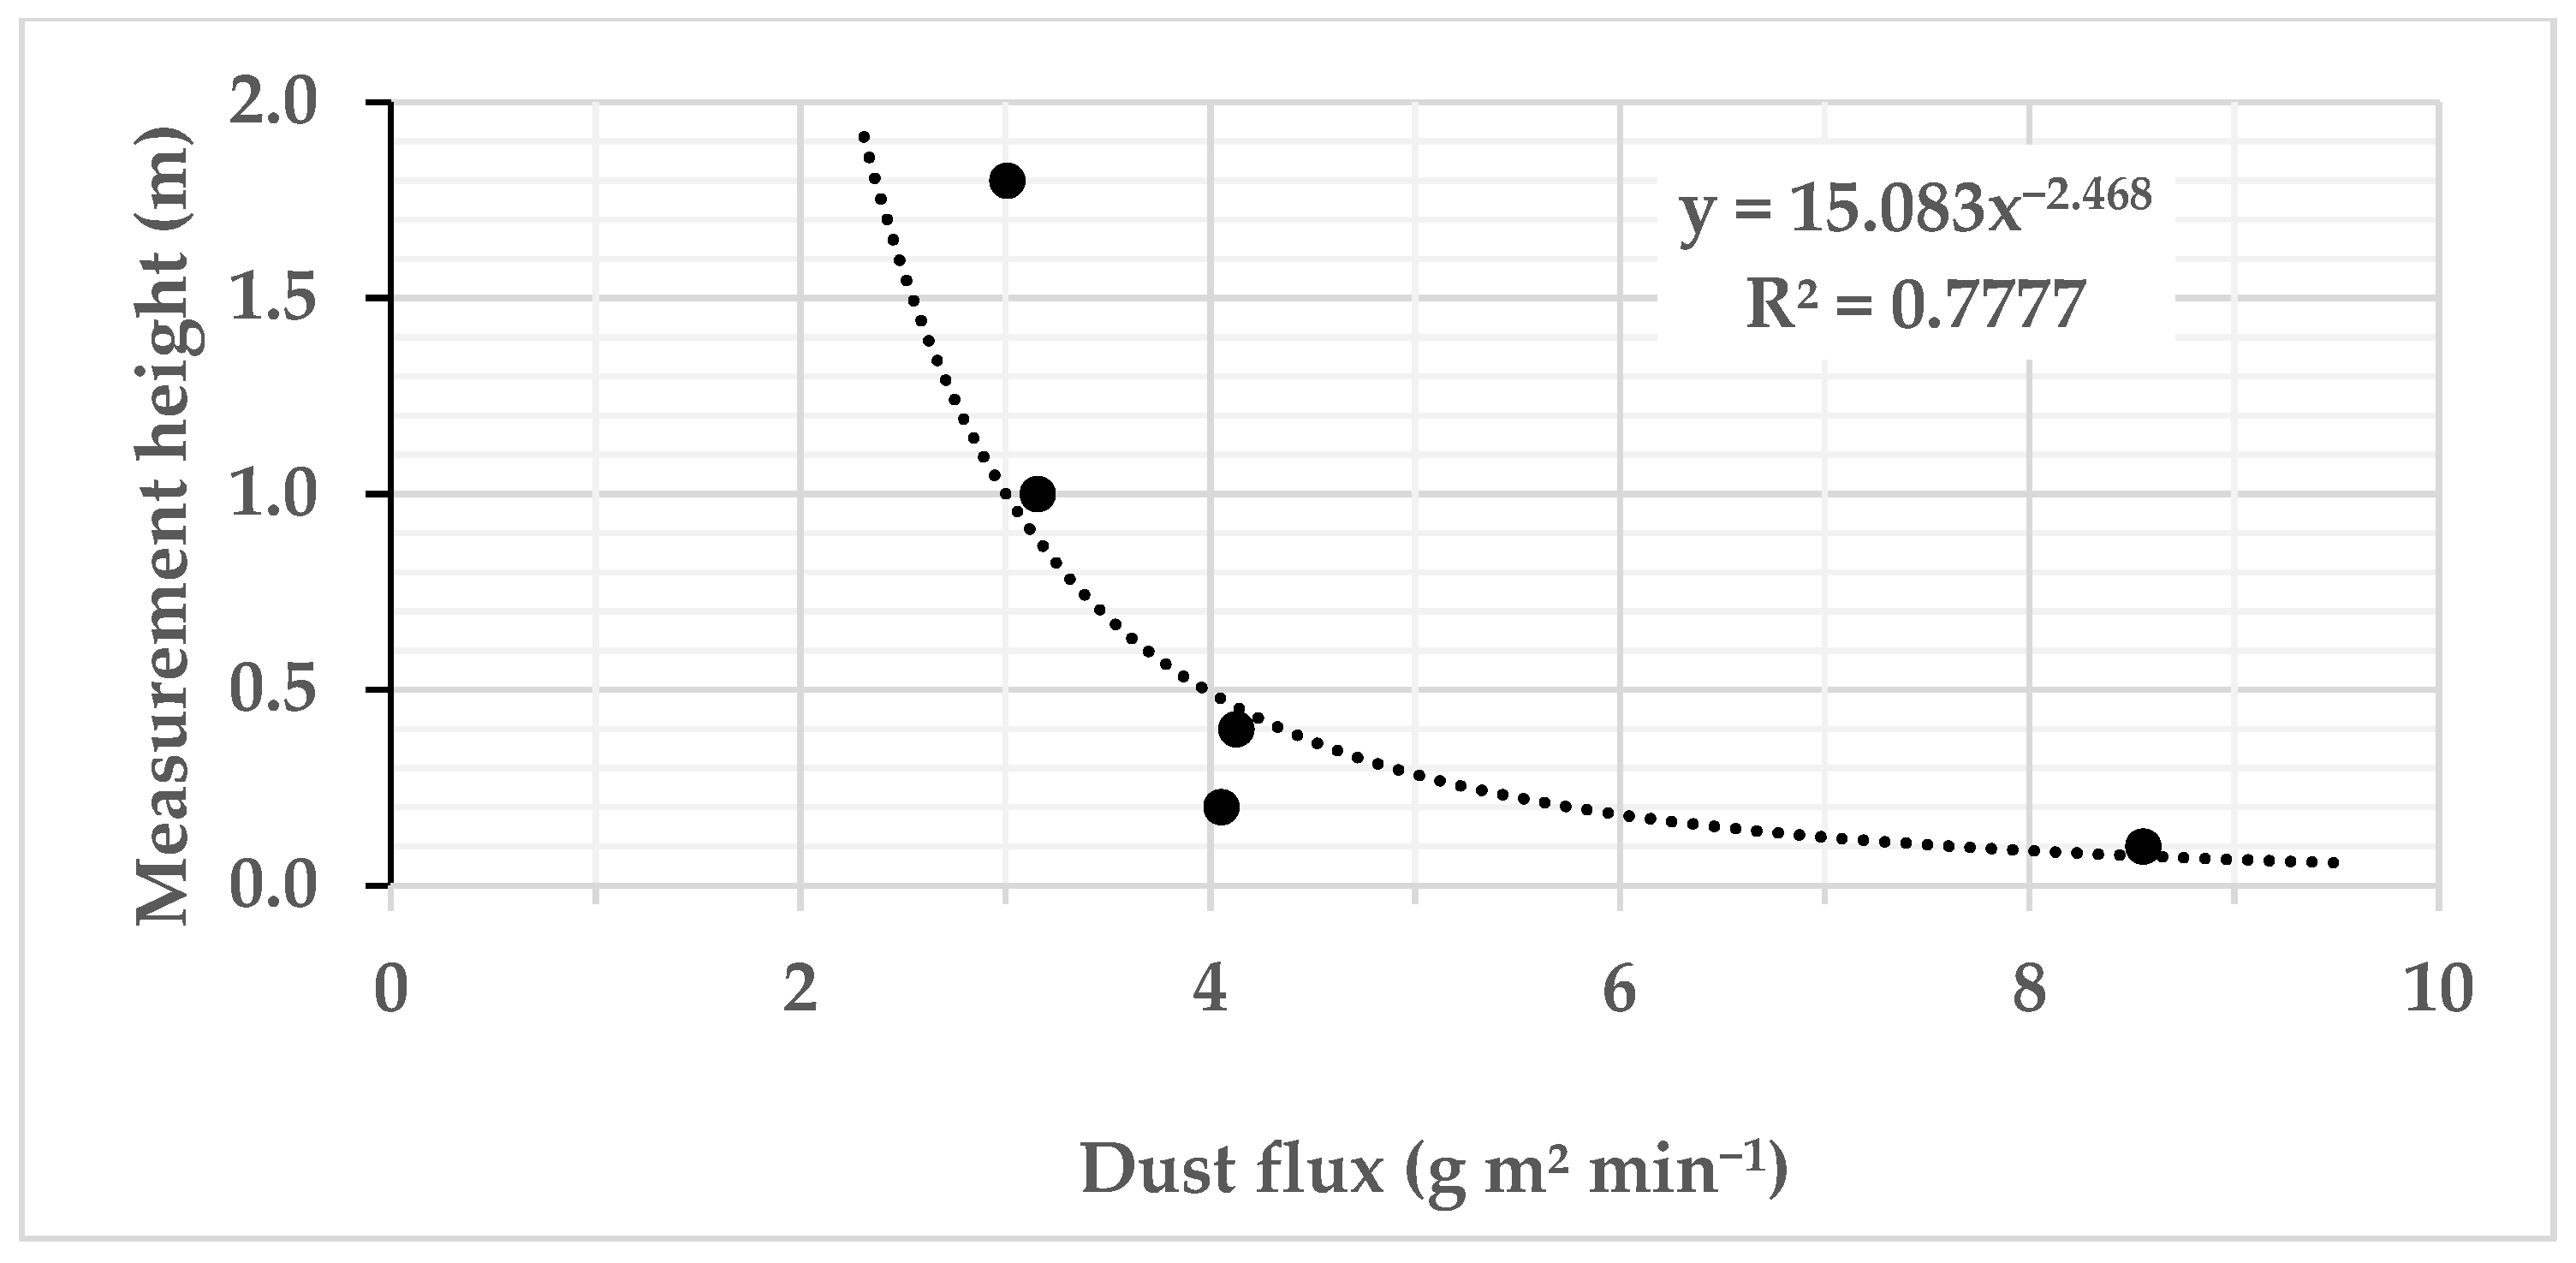
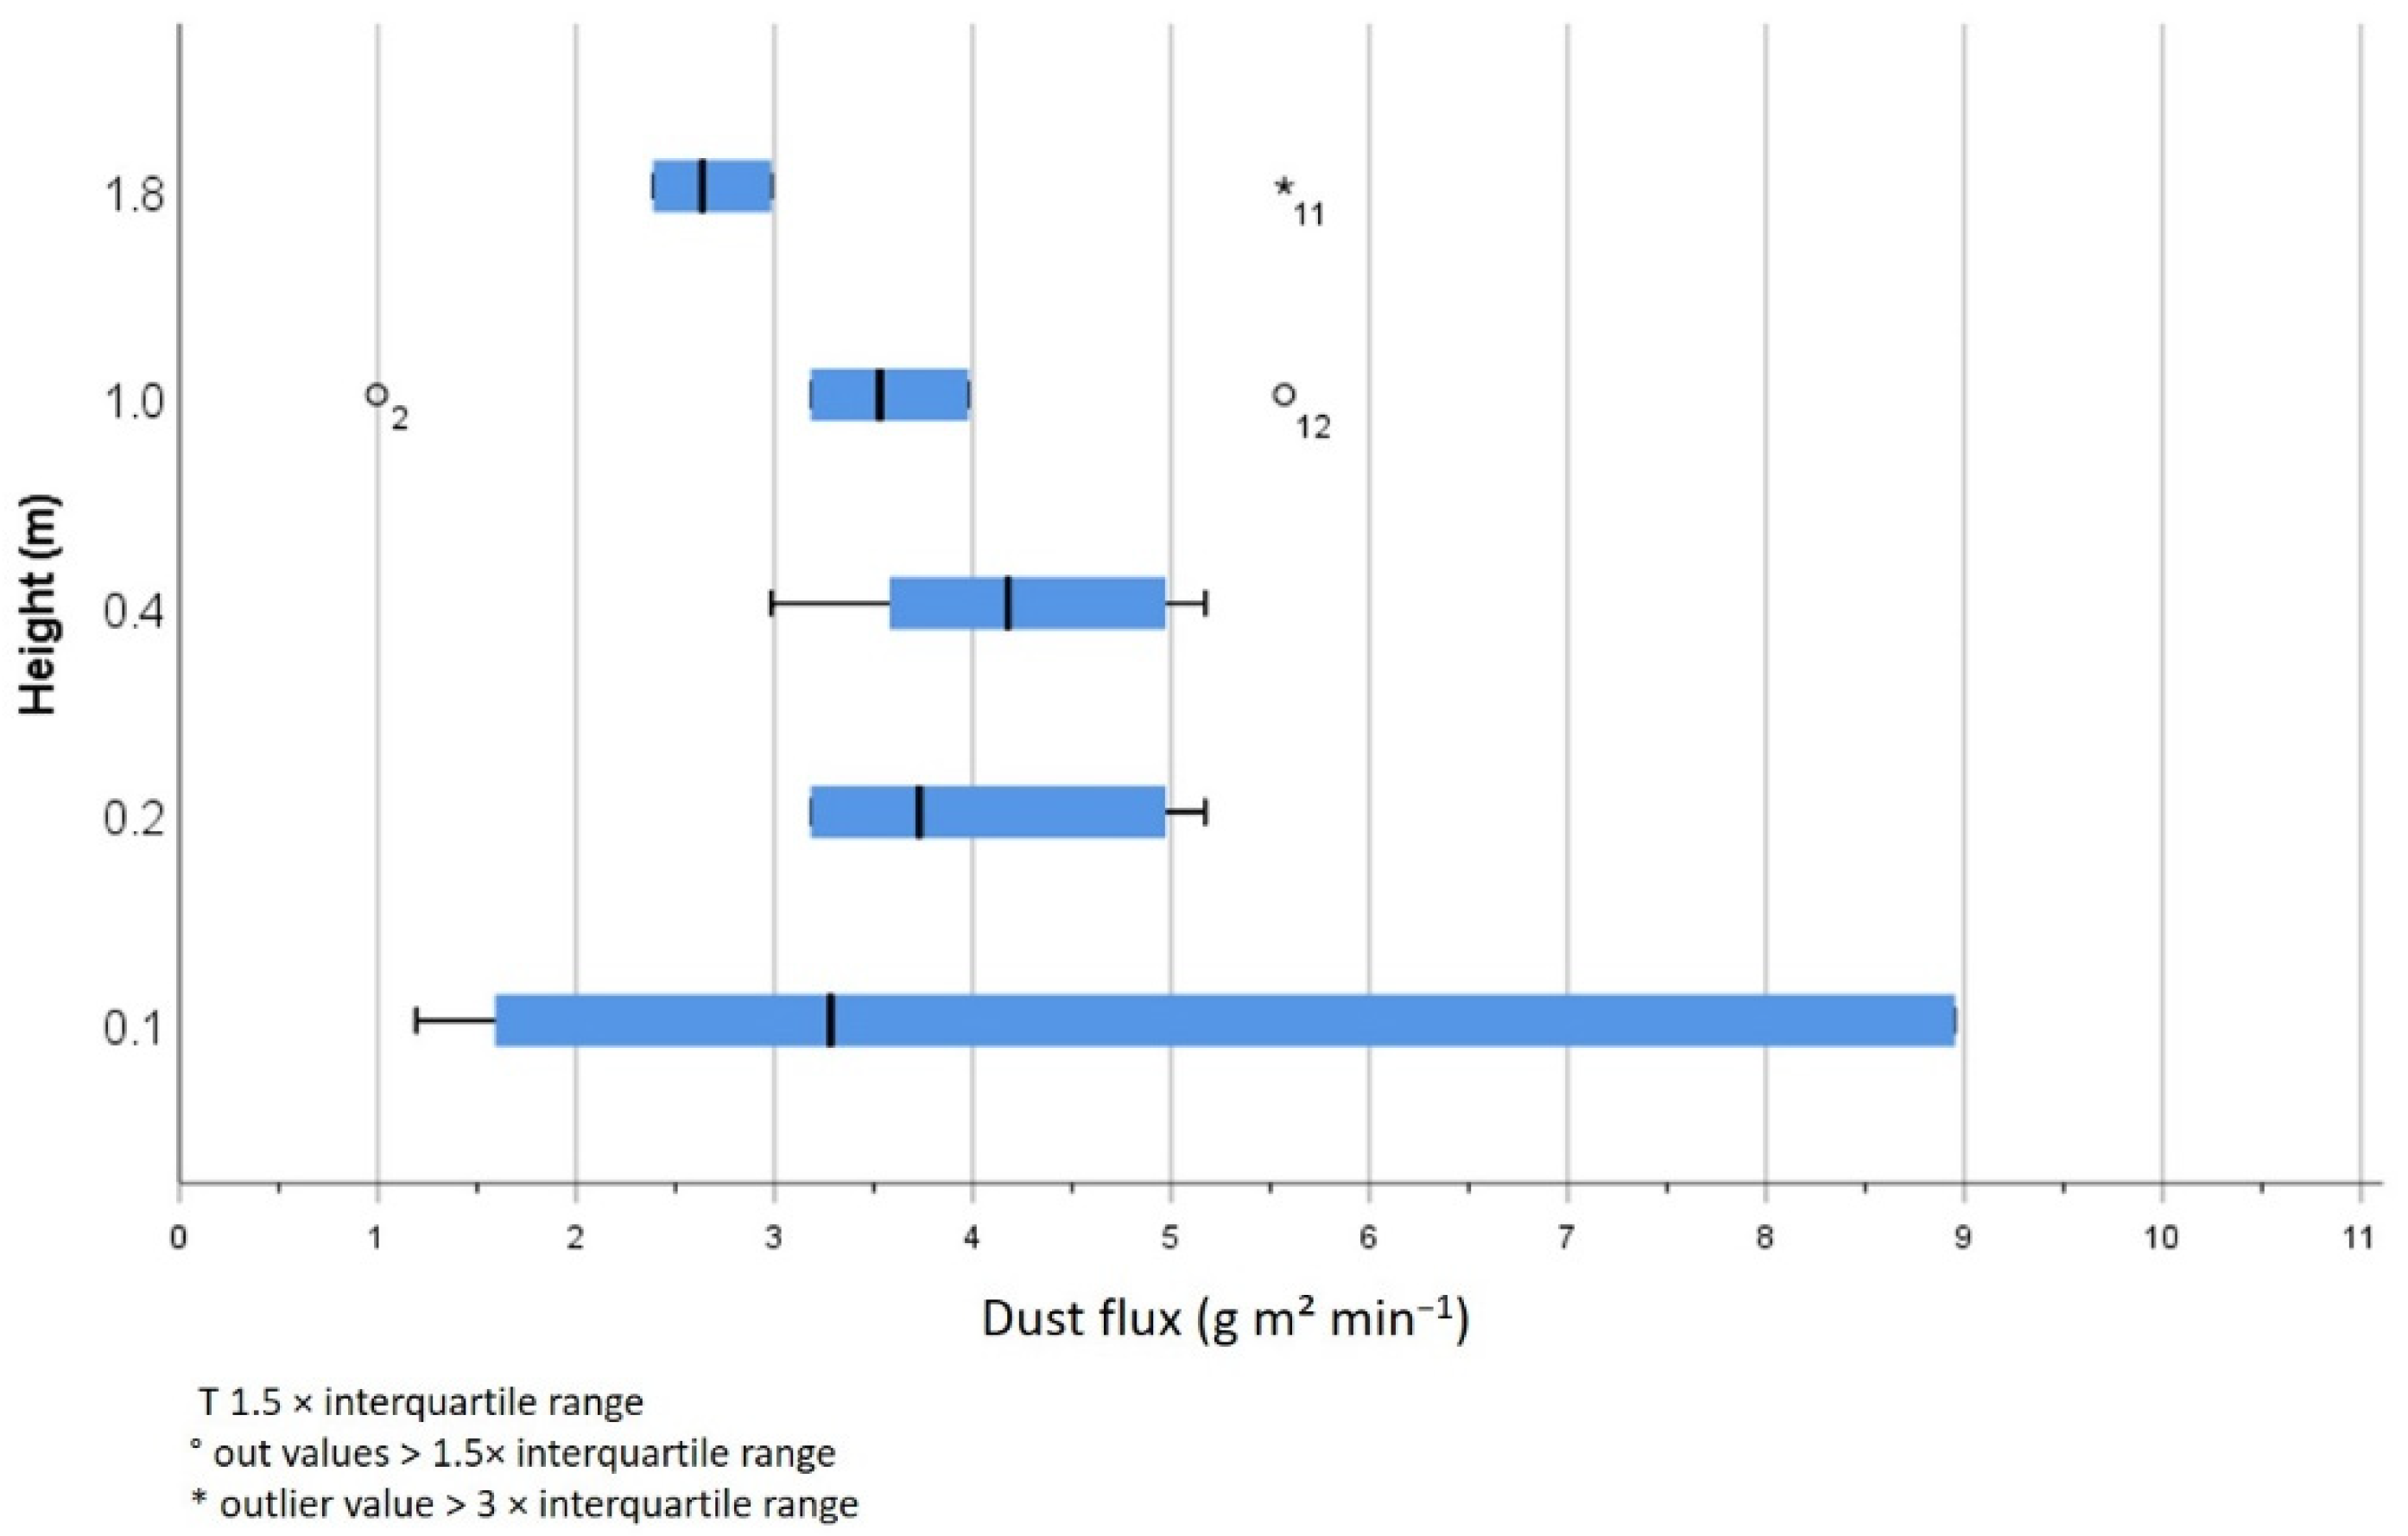
3.3. Horizontal and Vertical Dust Flux
4. Discussion
5. Conclusions
- The first quantifications of agricultural dust from vineyards with and without tillage impact show a considerable impact of tillage on total dust, which may account for singular but regular high emission events.
- Mechanical tillage operations are progressively applied to replace chemical treatments such as pesticides and herbicides. The disturbance of topsoil may enhance tillage-induced dust emissions and need to be considered for a comprehensive impact assessment.
- Climate change induced dry spells increase the number of days inadequate for tillage due to soil and climate conditions that enhance wind erosion and dust emissions. Thus, the total potential for dust emissions from vineyards may rise in the medium term.
- These high-emission events are not reflected by wind erosion models since they are not determined by soil or climate-related parameters. Including the mechanical impact into dust emission modeling is vital for a reliable risk assessment.
- The test setup was adequate for measurement of agricultural tillage operations and should be complemented by low- and high-volume sampling methods and optical particle samplers.
- Knowledge about the effects of specific management operations has great potential to provide a valuable tool for climate change mitigation and adaption strategies to support sustainable soil management.
Author Contributions
Funding
Institutional Review Board Statement
Informed Consent Statement
Data Availability Statement
Acknowledgments
Conflicts of Interest
References
- Shepherd, G.; Terradellas, E.; Baklanov, A.; Kang, U.; Sprigg, W.; Nickovic, S.; Boloorani, A.D.; Al-Dousari, A.; Basart, S.; Benedetti, A. Global Assessment of Sand and Dust Storms; UNEP, WMO, UNCCD; United Nations Environment Programme: Nairobi, Kenya, 2016. [Google Scholar]
- Goudie, A.S.; Middleton, N.J. Desert Dust in the Global System; Springer Science & Business Media: Berlin/Heidelberg, Germany, 2006; ISBN 978-3-540-32355-6. [Google Scholar]
- Katra, I. Soil erosion by wind and dust emission in semi-arid soils due to agricultural activities. Agronomy 2020, 10, 89. [Google Scholar] [CrossRef] [Green Version]
- Mc Tainsh, G.H.; Leys, J.F. Wind erosion. In Land Degradation Processes in Australia; Mc Tainsh, G.H., Boughton, W.C., Eds.; Longman-Cheshire Pty Limited: Melbourne, Australia, 1993; pp. 188–233. [Google Scholar]
- Webb, N.P.; Herrick, J.E.; Van Zee, J.W.; Courtright, E.M.; Hugenholtz, C.H.; Zobeck, T.M.; Okin, G.S.; Barchyn, T.E.; Billings, B.J.; Boyd, R.; et al. The national wind erosion research network: Building a standardized long-term data resource for aeolian research, modeling and land management. Aeolian Res. 2016, 22, 23–36. [Google Scholar] [CrossRef] [Green Version]
- Chen, W.; Tong, D.; Zhang, S.; Dan, M.; Zhang, X.; Zhao, H. Temporal variability of atmospheric particulate matter and chemical composition during a growing season at an agricultural site in Northeastern China. J. Environ. Sci. 2015, 38, 133–141. [Google Scholar] [CrossRef]
- Bärring, L.; Jönsson, P.; Mattsson, J.O.; Åhman, R. Wind erosion on arable land in scania, sweden and the relation to the wind climate—A review. Catena 2003, 52, 173–190. [Google Scholar] [CrossRef]
- Gomes, L.; Arrúe, J.L.; López, M.V.; Sterk, G.; Richard, D.; Gracia, R.; Sabre, M.; Gaudichet, A.; Frangi, J.P. Wind erosion in a semiarid agricultural area of Spain: The WELSONS project. Catena 2003, 52, 235–256. [Google Scholar] [CrossRef] [Green Version]
- Warren, A. Wind Erosion on Agricultural Land in Europe: Research Results for Land Managers; European Commission: Brussels, Belgium, 2002; ISBN 92-894-3958-0. [Google Scholar]
- IPCC. IPCC Special Report on Climate Change, Desertification, LandDegradation, Sustainable Land Management, Food Security, and Greenhouse Gas Fluxes in Terrestrial Ecosystems; 2019. Available online: https://www.ipcc.ch/srccl/ (accessed on 5 October 2021).
- Lal, R. Desertification and soil erosion. Glob. Environ. Chang. 2014, 1, 369–378. [Google Scholar]
- Steininger, M.; Wurbs, D. Bundesweite Gefährdung Der Böden Durch Winderosion Und Bewertung Der Veränderung Infolge Des Wandels Klimatischer Steuergrößen Als Grundlage Zur Weiterentwicklung Der Vorsorge Und Gefahrenabwehr Im Bodenschutzrecht. Umweltbundesamt-Texte 2017, 13, 119. [Google Scholar]
- Ginoux, P.; Prospero, J.M.; Gill, T.E.; Hsu, N.C.; Zhao, M. Global-scale attribution of anthropogenic and natural dust sources and their emission rates based on MODIS deep blue aerosol products. Rev. Geophys. 2012, 50. [Google Scholar] [CrossRef]
- Miller, R.L.; Tegen, I.; Perlwitz, J. Surface radiative forcing by soil dust aerosols and the hydrologic cycle. J. Geophys. Res. Atmos. 2004, 109. [Google Scholar] [CrossRef]
- Kok, J.F. A scaling theory for the size distribution of emitted dust aerosols suggests climate models underestimate the size of the global dust cycle. Proc. Natl. Acad. Sci. USA 2011, 108, 1016–1021. [Google Scholar] [CrossRef] [Green Version]
- Middleton, N.J. Desert dust hazards: A global review. Aeolian Res. 2017, 24, 53–63. [Google Scholar] [CrossRef]
- Buschiazzo, D.; Funk, R. Wind erosion of agricultural soils and the carbon cycle. In Soil Carbon: Science, Management and Policy for Multiple Benefits; Banwart, S.A., Noellemeyer, E., Milne, E., Eds.; CABI: Oxfordshire, UK, 2014. [Google Scholar] [CrossRef]
- Chepil, W.S. Conversion of relative field erodibility to annual soil loss by wind. Soil Sci. Soc. Am. J. 1960, 24, 143–145. [Google Scholar] [CrossRef]
- Field, J.P.; Belnap, J.; Breshears, D.D.; Neff, J.C.; Okin, G.S.; Whicker, J.J.; Painter, T.H.; Ravi, S.; Reheis, M.C.; Reynolds, R.L. The ecology of dust. Front. Ecol. Environ. 2010, 8, 423–430. [Google Scholar] [CrossRef] [Green Version]
- Katra, I.; Gross, A.; Swet, N.; Tanner, S.; Krasnov, H.; Angert, A. Substantial dust loss of bioavailable phosphorus from agricultural soils. Sci. Rep. 2016, 6, 24736. [Google Scholar] [CrossRef] [PubMed] [Green Version]
- Schenker, M.B.; Pinkerton, K.E.; Mitchell, D.; Vallyathan, V.; Elvine-Kreis, B.; Green, F.H.Y. Pneumoconiosis from agricultural dust exposure among young california farmworkers. Environ. Health Perspect. 2009, 117, 988–994. [Google Scholar] [CrossRef] [Green Version]
- Kok, J.F.; Ridley, D.A.; Zhou, Q.; Miller, R.L.; Zhao, C.; Heald, C.L.; Ward, D.S.; Albani, S.; Haustein, K. Smaller desert dust cooling effect estimated from analysis of dust size and abundance. Nat. Geosci. 2017, 10, 274–278. [Google Scholar] [CrossRef]
- Tozer, P.; Leys, J.; Tozer, P.; Leys, J. Dust storms—What do they really cost? Rangel. J. 2013, 35, 131–142. [Google Scholar] [CrossRef] [Green Version]
- Riksen, M.J.P.M.; de Graaff, J. On-site and off-site effects of wind erosion on european light soils. Land Degrad. Dev. 2001, 12, 1–11. [Google Scholar] [CrossRef]
- Mahowald, N.M.; Scanza, R.; Brahney, J.; Goodale, C.L.; Hess, P.G.; Moore, J.K.; Neff, J. Aerosol deposition impacts on land and ocean carbon cycles. Curr. Clim. Chang. Rep. 2017, 3, 16–31. [Google Scholar] [CrossRef] [Green Version]
- Li, J.; Kandakji, T.; Lee, J.A.; Tatarko, J.; Blackwell, J.; Gill, T.E.; Collins, J.D. Blowing dust and highway safety in the Southwestern United States: Characteristics of dust emission “hotspots” and management implications. Sci. Total Environ. 2018, 621, 1023–1032. [Google Scholar] [CrossRef]
- World Health Organization. WHO Global Air Quality Guidelines: Particulate Matter (PM2.5 and PM10), Ozone, Nitrogen Dioxide, Sulfur Dioxide and Carbon Monoxide; Executive Summary: Geneva, Switzerland, 2021. [Google Scholar]
- Air Quality Directive 2008. Available online: https://eur-lex.europa.eu/eli/dir/2008/50/2015-09-18 (accessed on 22 November 2021).
- Singh, P.; Sharratt, B.; Schillinger, W.F. Wind erosion and PM10 emission affected by tillage systems in the world’s driest rainfed wheat region. Soil Tillage Res. 2012, 124, 219–225. [Google Scholar] [CrossRef]
- Duniway, M.C.; Geiger, E.L.; Minnick, T.J.; Phillips, S.L.; Belnap, J. Insights from long-term ungrazed and grazed watersheds in a salt desert colorado plateau ecosystem. Rangel. Ecol. Manag. 2018, 71, 492–505. [Google Scholar] [CrossRef]
- Goossens, D.; Gross, J.; Spaan, W. Aeolian dust dynamics in agricultural land areas in Lower Saxony, Germany. Earth Surf. Process. Landf. 2001, 26, 701–720. [Google Scholar] [CrossRef]
- Funk, R.; Reuter, H.I.; Hoffmann, C.; Engel, W.; Öttl, D. Effect of moisture on fine dust emission from tillage operations on agricultural soils. Earth Surf. Process. Landf. 2008, 33, 1851–1863. [Google Scholar] [CrossRef]
- Riksen, M.J.P.M. Off-site effects of wind erosion on agricultural land in Northwestern Europe. In Wind Erosion and Dust Dynamics: Observations, Simulations, Modelling; Goossens, D., Riksen, M.J.P.M., Eds.; ESW Publications: Wageningen, The Netherlands, 2004; pp. 103–121. [Google Scholar]
- Chappell, A.; Webb, N.P.; Butler, H.J.; Strong, C.L.; McTainsh, G.H.; Leys, J.F.; Viscarra Rossel, R.A. Soil organic carbon dust emission: An omitted global source of atmospheric CO2. Glob. Chang. Biol. 2013, 19, 3238–3244. [Google Scholar] [CrossRef]
- Bagnold, R.A. The Physics of Blown Sand and Desert Dunes; William Morrow: New York, NY, USA, 1941. [Google Scholar]
- Owen, P.R. Saltation of uniform grains in air. J. Fluid Mech. 1964, 20, 225–242. [Google Scholar] [CrossRef]
- Gillette, D.A.; Herbert, G.; Stockton, P.H.; Owen, P.R. Causes of the fetch effect in wind erosion. Earth Surf. Process. Landf. 1996, 21, 641–659. [Google Scholar] [CrossRef]
- Shao, Y.; Raupach, M.R.; Findlater, P.A. Effect of saltation bombardment on the entrainment of dust by wind. J. Geophys. Res. Atmos. 1993, 98, 12719–12726. [Google Scholar] [CrossRef] [Green Version]
- Grini, A.; Zender, C.S. Roles of saltation, sandblasting, and wind speed variability on mineral dust aerosol size distribution during the Puerto Rican Dust Experiment (PRIDE). J. Geophys. Res. Atmos. 2004, 109. [Google Scholar] [CrossRef] [Green Version]
- Shao, Y. Physics and Modelling of Wind Erosion; Springer: Berlin/Heidelberg, Germany, 2008; Volume 37. [Google Scholar]
- Alfaro, S.C.; Gomes, L. Modeling mineral aerosol production by wind erosion: Emission intensities and aerosol size distributions in source areas. J. Geophys. Res. Atmos. 2001, 106, 18075–18084. [Google Scholar] [CrossRef]
- Bullard, J. Bridging the gap between field data and global models: Current strategies in aeolian research. Earth Surf. Process. Landf. 2010, 35, 496–499. [Google Scholar] [CrossRef] [Green Version]
- Klose, M.; Gill, T.E.; Etyemezian, V.; Nikolich, G.; Ghodsi Zadeh, Z.; Webb, N.P.; Van Pelt, R.S. Dust emission from crusted surfaces: Insights from field measurements and modelling. Aeolian Res. 2019, 40, 1–14. [Google Scholar] [CrossRef]
- Cook, E. (Ed.) Agriculture, Forestry and Fishery Statistics, 2019; Publications Office of the European Union: Luxembourg, 2019; ISBN 978-92-76-13193-9. [Google Scholar]
- Rodrigo Comino, J.; Iserloh, T.; Lassu, T.; Cerdà, A.; Keestra, S.D.; Prosdocimi, M.; Brings, C.; Marzen, M.; Ramos, M.C.; Senciales, J.M.; et al. Quantitative comparison of initial soil erosion processes and runoff generation in spanish and german vineyards. Sci. Total Environ. 2016, 565, 1165–1174. [Google Scholar] [CrossRef]
- Cerdan, O.; Govers, G.; Le Bissonnais, Y.; Van Oost, K.; Poesen, J.; Saby, N.; Gobin, A.; Vacca, A.; Quinton, J.; Auerswald, K.; et al. Rates and spatial variations of soil erosion in Europe: A study based on erosion plot data. Geomorphology 2010, 122, 167–177. [Google Scholar] [CrossRef]
- Novara, A.; Stallone, G.; Cerdà, A.; Gristina, L. The effect of shallow tillage on soil erosion in a semi-arid vineyard. Agronomy 2019, 9, 257. [Google Scholar] [CrossRef] [Green Version]
- IBM Corp. IBM SPSS Statistics for Windows; Version 27.0; IBM Corp: Armonk, NY, USA, 2020. [Google Scholar]
- Microsoft Corporation. Microsoft Excel. 2018. Available online: Https://Office.Microsoft.Com/Excel (accessed on 5 October 2021).
- Goossens, D.; Offer, Z.Y. Wind tunnel and field calibration of six aeolian dust samplers. Atmos. Environ. 2000, 34, 1043–1057. [Google Scholar] [CrossRef]
- Mendez, M.J.; Funk, R.; Buschiazzo, D.E. Efficiency of Big Spring Number Eight (BSNE) and Modified Wilson and Cook (MWAC) samplers to collect PM10, PM2.5 and PM1. Aeolian Res. 2016, 21, 37–44. [Google Scholar] [CrossRef]
- Goossens, D. On-site and off-site effects of wind erosion. In Wind Erosion on Agricultural Land in Europe: Research Results for Land Managers; Warren, A., Ed.; European Commission, Directorate-General for Research: Luxembourg, 2002; pp. 29–38. [Google Scholar]
- De Oro, L.A.; Avecilla, F.; Panebianco, J.E.; Buschiazzo, D.E. PM10 emission from feedlots in soils with different texture: Cattle trampling effect. Aeolian Res. 2021, 53, 100742. [Google Scholar] [CrossRef]
- Sterk, G.; Raats, P.A.C. Comparison of models describing the vertical distribution of wind-eroded sediment. Soil Sci. Soc. Am. J. 1996, 60, 1914–1919. [Google Scholar] [CrossRef]
- Öttl, D.; Funk, R. PM Emission factors for farming activities by means of dispersion modeling. Part. Matter Agric. 2007, 308, 173–177. [Google Scholar]


| Tillage Device * | Mast ** | |||
|---|---|---|---|---|
| samples | test runs | samples | tests runs | |
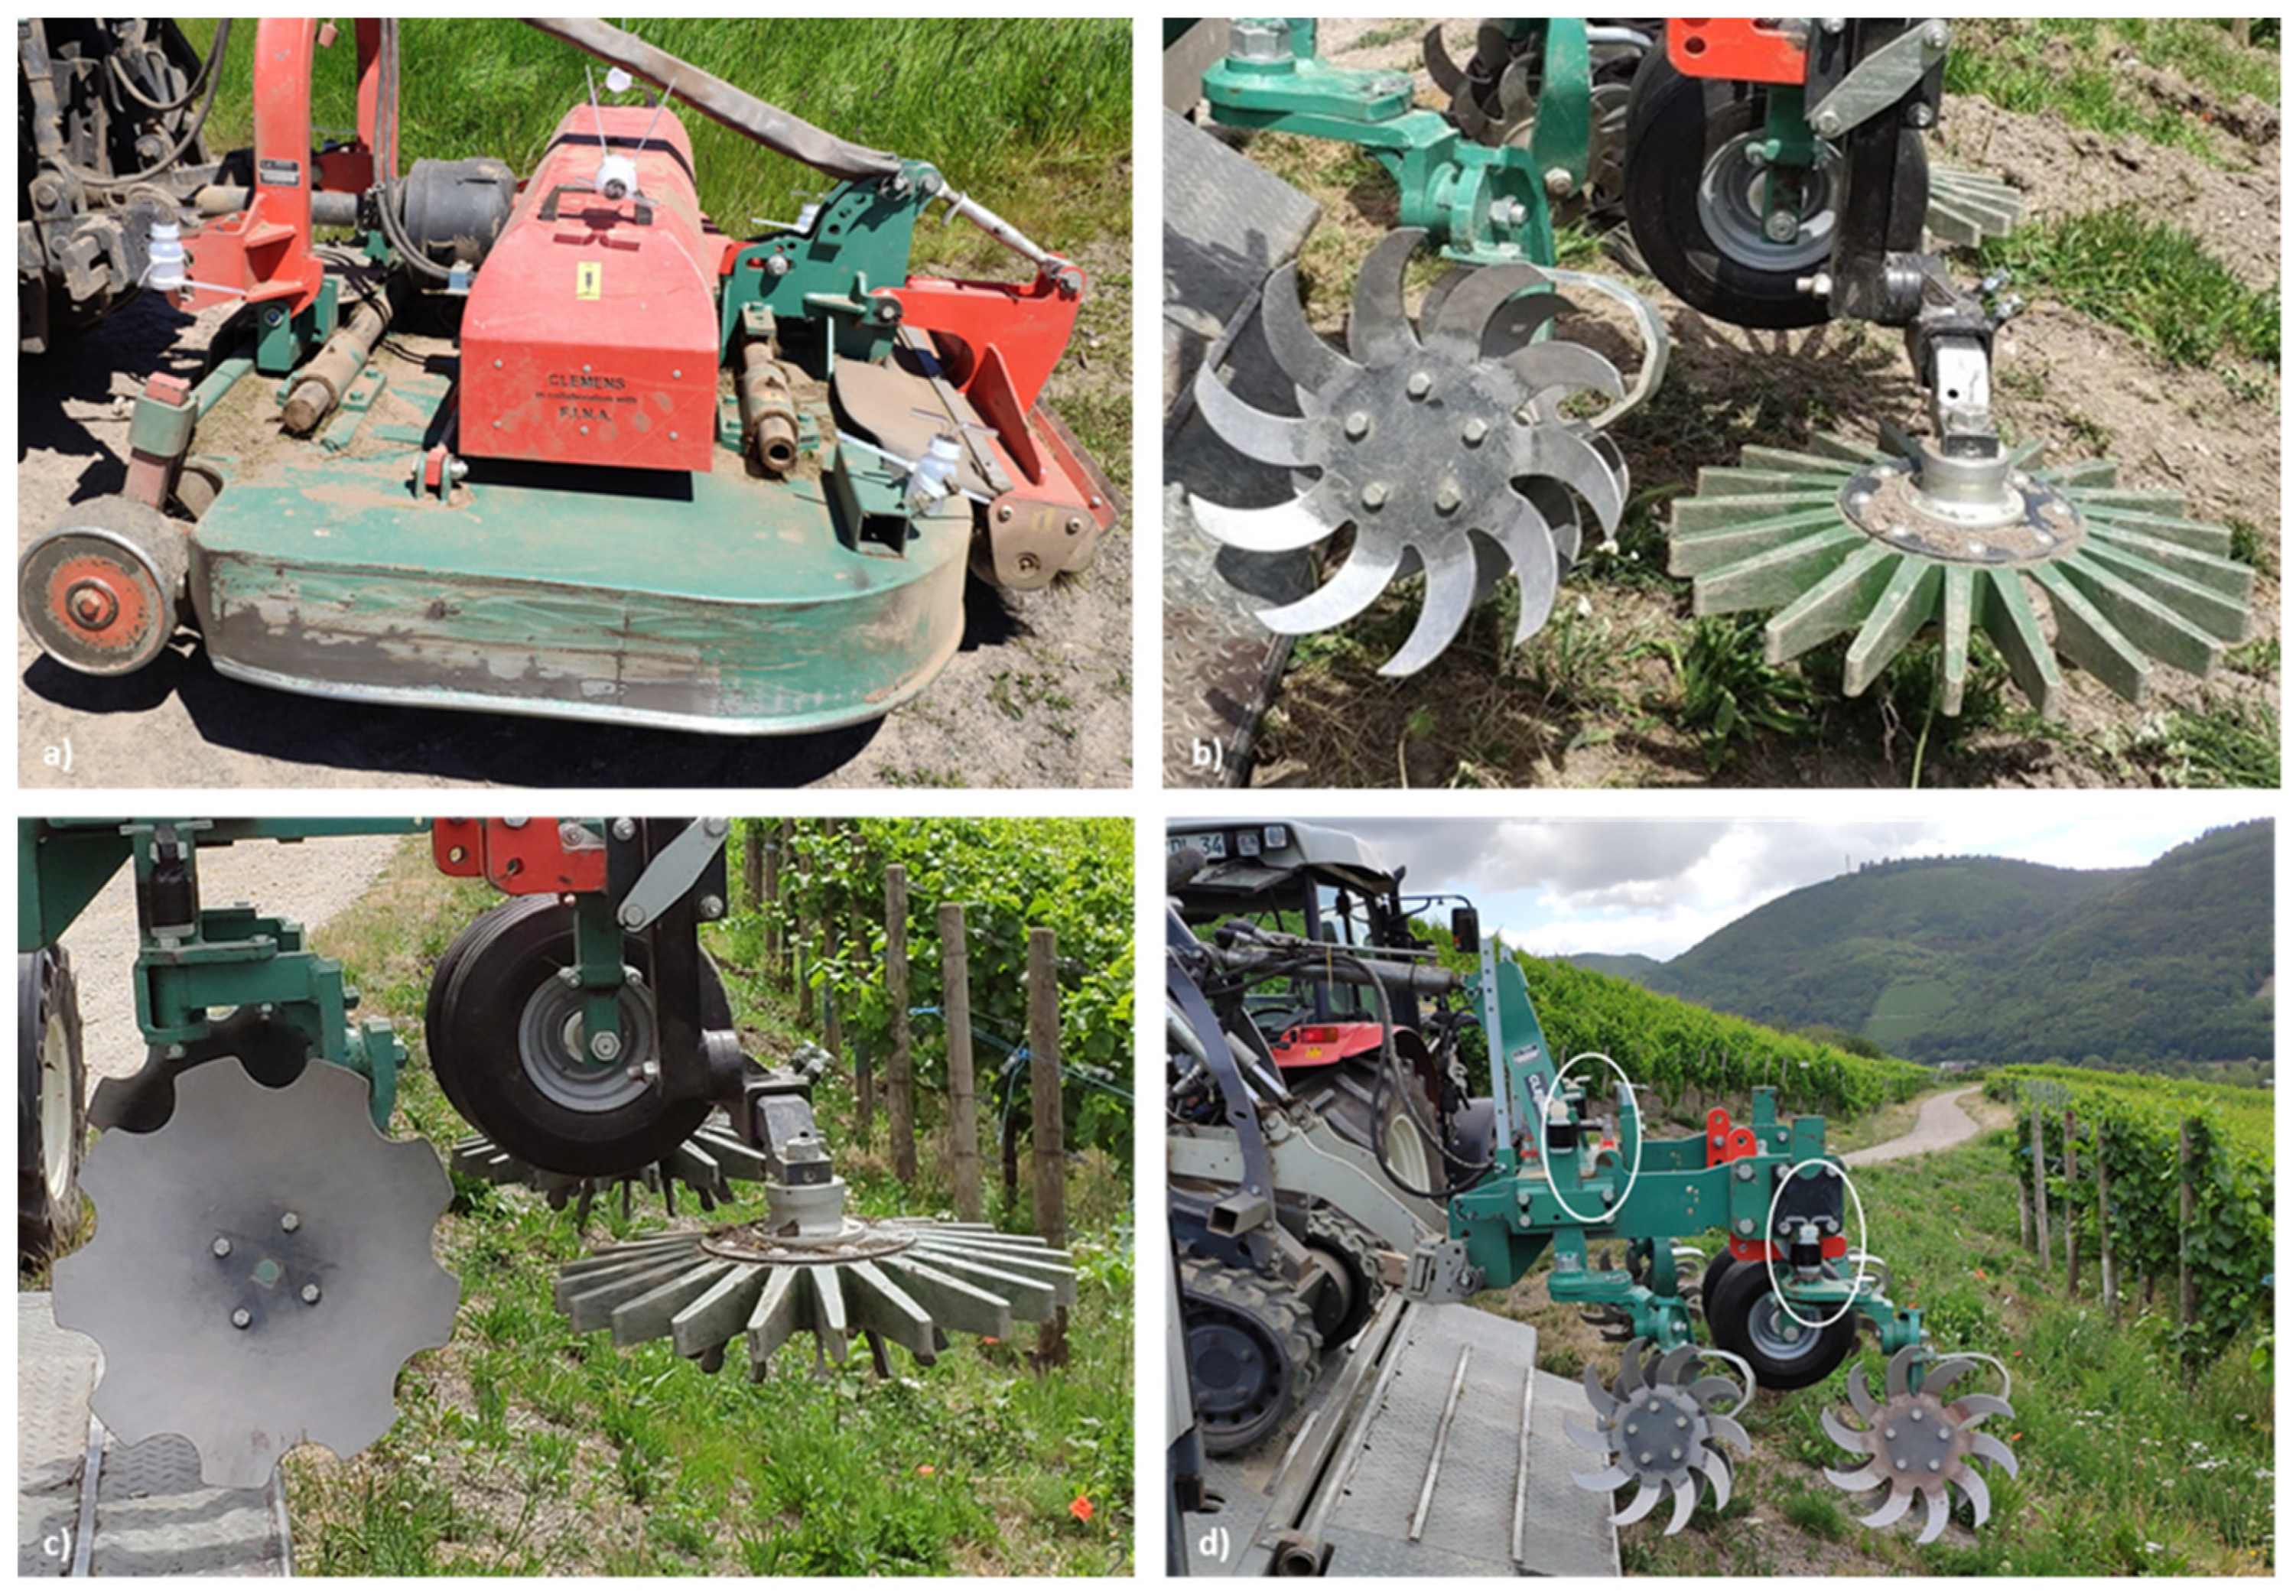
| Rotary-Star Tiller—Finger Hoe | 18 | 5 | 10 | 2 |
| Disc Plough—Finger Hoe | 17 | 5 | 20 | 4 |
| Rotary-Star Tiller | 9 | 3 | / | / |
| Mulcher | 4 | 2 | / | / |
| N | SD | g m² min−1 | |||
|---|---|---|---|---|---|
| Control | 6 | 0.004 | 0.006 | ||
| Mulcher | Mulcher | 2 | 1.969 | 10.942 | 22.879 |
| Mulcher (Thermals) | 2 | 10.41 | 34.815 | ||
| Row-Tillage | Rotary-Star Tiller | 9 | 14.113 | 11.736 | 16.517 |
| Rotary-Star Tiller—Finger Hoe | 10 | 6.993 | 12.411 | ||
| Disc Plough—Finger Hoe | 13 | 32.113 | 25.404 | ||
| Total | 42 | 21.096 | 15.512 | ||
| Spearman’s Rho | Soil Water (%) | Humidity (%) | Temperature (°C) | Wind Velocity (m sec−1) | |
|---|---|---|---|---|---|
| Dust flux (g m² min−1) | Pearson Correlation | −0.277 * | −0.131 | 0.172 | 0.245 * |
| Sig. (2-tailed) | 0.025 | 0.300 | 0.171 | 0.049 | |
| N | 65 | 65 | 65 | 65 |
| N | SD | g m² min−1 | ||
|---|---|---|---|---|
| Category soil moisture | Very moist | 11 | 1.42 | 3.47 |
| Moist | 16 | 2.76 | 3.76 | |
| Dry | 15 | 28.33 | 23.35 | |
| Very dry | 4 | 21.69 | 20.86 | |
| Total | 46 | 13.55 | 12.86 | |
| Category wind velocity | Very low | 15 | 12.87 | 8.11 |
| Low | 20 | 20.35 | 10.65 | |
| Medium | 11 | 24.63 | 17.95 | |
| Total | 46 | 19.26 | 12.24 |
Publisher’s Note: MDPI stays neutral with regard to jurisdictional claims in published maps and institutional affiliations. |
© 2022 by the authors. Licensee MDPI, Basel, Switzerland. This article is an open access article distributed under the terms and conditions of the Creative Commons Attribution (CC BY) license (https://creativecommons.org/licenses/by/4.0/).
Share and Cite
Marzen, M.; Porten, M.; Ries, J.B. Quantification of Dust Emissions during Tillage Operations in Steep Slope Vineyards in the Moselle Area. Agriculture 2022, 12, 100. https://doi.org/10.3390/agriculture12010100
Marzen M, Porten M, Ries JB. Quantification of Dust Emissions during Tillage Operations in Steep Slope Vineyards in the Moselle Area. Agriculture. 2022; 12(1):100. https://doi.org/10.3390/agriculture12010100
Chicago/Turabian StyleMarzen, Miriam, Matthias Porten, and Johannes B. Ries. 2022. "Quantification of Dust Emissions during Tillage Operations in Steep Slope Vineyards in the Moselle Area" Agriculture 12, no. 1: 100. https://doi.org/10.3390/agriculture12010100
APA StyleMarzen, M., Porten, M., & Ries, J. B. (2022). Quantification of Dust Emissions during Tillage Operations in Steep Slope Vineyards in the Moselle Area. Agriculture, 12(1), 100. https://doi.org/10.3390/agriculture12010100