Article

Soil Particulate and Mineral-Associated Organic Matter Increases in Organic Farming under Cover Cropping and Manure Addition

Institute of Agricultural and Environmental Sciences, Estonian University of Life Sciences, EE51006 Tartu, Estonia
*
Author to whom correspondence should be addressed.
Agriculture 2021, 11(9), 903; https://doi.org/10.3390/agriculture11090903
Submission received: 16 July 2021 / Revised: 16 September 2021 / Accepted: 17 September 2021 / Published: 19 September 2021
(This article belongs to the Section Agricultural Soils)

Abstract

:
This study aimed to investigate the soil organic carbon (SOC) sequestration rate and soil organic matter (SOM) composition in conventional rotational cropping with mineral fertilization compared with organic cover cropping with and without composted manure addition during 2008–2018 to specify the SOM stabilization under different farming systems. The SOC proportion in particulate organic matter (POM) (63–2000 µm) and mineral-associated organic matter (MAOM) (<63 µm) fractions were estimated in different treatments, and the SOM composition in the fractions was characterized by FTIR spectroscopy. The SOC sequestration rate was treatment-dependent, with the higher SOC sequestration rate (1.26 Mg ha−1 y−1) in the organic treatment with cover crop and composted manure. Across all treatments, 57.3%–77.8% of the SOC stock was in the MAOM fraction. Mineral N fertilization increased POM-C concentration by 19%–52% compared with the unfertilized control. Under the organic treatments, the POM-C concentration was 83%–95% higher than the control. The MAOM-C concentration increased by 8%–20%. The mineral N fertilization and organic treatments (with and without cover crops and composted manure) increased the SOC stock proportion of POM. The highest proportion of SOC stock related to POM was in the cover cropping system, reducing the proportion of C related to the MAOM fraction, but the addition of composted manure with cover cropping also increased the proportion of C in MAOM. Compared with MAOM, the POM had a less resistant organic matter composition, and the POM resistance was higher in organic than conventional treatments. In general, the recalcitrance of SOM increased with SOC concentration. The POM fraction had higher aromaticity (or degree of decomposition) than the MAOM fraction. The aromaticity in POM and MAOM fractions was higher in the organic farming system and depended on mineral N fertilization and cover cropping, but the effect of manure was not significant. Although the SOC sequestration rate was higher under manure addition, resulting in the highest formation of both POM and MAOM in the soil, manure addition had little effect on overall SOM composition compared with cover crops.

1. Introduction

Soil is the largest soil organic carbon (SOC) reservoir in terrestrial ecosystems [1]. Most agricultural soils have lost 30%–40% SOC relative to the native ecosystems from which they were derived [2,3], suggesting that cropland soils represent a huge potential global carbon (C) sink [4]. The accumulation or degradation of soil organic matter (SOM) depends on cultivation technique, crop rotation, fertilization, and environmental conditions [5], as these factors affect the C reserve balance. Thus, management techniques that slow SOM decomposition or increase the amount of organic matter entering the soil are preferred.
To slow down SOM degradation and reduce C loss in soil, it has been recommended to reduce soil physical disturbance using conservation or no-till agriculture [6,7]; however, the positive effect of this technique on C uptake has been found to be less than previously estimated [8]. Thus, the main management to increase SOC stock should be to increase C inputs into the soil [4], such as through organic manure or compost amendments and the cultivation of cover crops [3]. Tautges et al. [9] reported that SOC stock increased from 0.3 to 4.0 Mg ha−1 y−1 in manured systems, and winter cover crops increased SOC stock by 1.44 Mg ha−1 y−1. A global meta-analysis reported that cover crops increase SOC stocks by 0.32 Mg ha−1 y−1 in the upper 22 cm of soil [4]. These practices are particularly important in organic farming systems where manure and cover crops help maintain soil fertility and crop productivity and enrich the soil with nitrogen (N) [10], in addition to reducing N losses via leaching [11]. Crop rotation is important in farming systems to enhance soil physical, chemical, and biological properties [12] and is unavoidable in organic farming systems to prevent the accumulation of pests and diseases [13]. Crop rotations, especially those that include cover crops, sustain soil quality and productivity by enhancing soil C and N cycling and microbial biomass [14], making them a cornerstone for sustainable agroecosystems [15].
In addition to the amount of organic matter bound to the soil, the chemical composition of the SOM also depends on management techniques [16], which can be used to control the functioning of the SOM, either as a SOC sink by sequestering C in soil or as a source of CO2 emitted into the atmosphere [5]. In order to increase the SOC sequestration efficiency and SOC reserve, it is necessary to improve understanding of SOM formation, resistance to degradation, and functioning [17]. The SOC of the whole soil is not an ideal indicator to detect changes in SOC sequestration under different management practices [6] because SOC is heterogeneous, dynamic, and consists of a myriad of different fractions that vary in their physical and chemical properties, stabilities, and turnover rates [18,19]. It is therefore insufficient to simply study a single soil sample as a uniform entity [17] and necessary to instead divide the SOM into separate fractions [17,20], the varied properties of which affect the residence time and recalcitrance in the soil, allowing the assessment of SOM stability [21]. The simplest and most common method for this is to divide SOM into (i) organic matter associated with the sand fraction (soil particles larger than 53 or 63 µm based on the USDA or FAO system, respectively; POM), and (ii) mineral-associated organic matter (MAOM) associated with clay and silt particles (diameters of 2000–2053 or 63 µm) [20]. There is no consistent indication that the formation of MAOM occurred from the decomposition of POM, suggesting that POM and MAOM are formed by two separate pathways [22]. The POM fraction is a mixture of compounds caused by a regenerating plant residue and partial microbial decomposition containing many structural C compounds and low nitrogen (N) concentration [6]. C components in POM are characterized by short turnovers [23], and the persistence in the soil is related to physical protection in stable aggregates [21] or inherent organic matter biochemical recalcitrance [20].
The MAOM fraction mainly consists of microbially transformed C compounds and has a high N concentration [24]. Persistence in the soil is related to the formation of physically or chemically realized organo-mineral associations [20,25], and its location in soil microaggregates is less accessible to microbes [26]. Moreover, the MAOM fraction is considered to be more persistent in soil than POM, and the stable MAOM fraction serves as a long-term nutrient storage reservoir with a relatively slow turnover rate [14]. However, the POM fraction is considered to be more labile [27] and is important for soil fertility providing nutrients to plants, and POM enhance the soil biodiversity being as a source of nutrients and energy to the decomposer community [28,29].
In agricultural systems, it is therefore desirable to increase stocks of both labile and stable fractions of SOM [29]. Through the ratio of MAOM and POM fractions, it is possible to evaluate the effect of different factors on C stabilization in soil. As these fractions are very different in natural environments [17,22], their sensitivity and responsiveness to management techniques may differ. POM has been shown to be a sensitive indicator of the change in soil C under different management practices [30,31]. Bu et al. [31] found that N mineralization and microbial biomass were higher in soil containing a greater proportion of POM.
However, there are conflicting results on how mineral N fertilization alone influences SOM fractional composition. It has been found that N fertilization had no effect on POM proportion in soil [32], a POM-increasing effect [33,34], or a negative effect on POM fraction [34]. Long-term manure addition and manure addition in combination with inorganic N fertilization increased the contributions of different fractions [32]. In finely textured Mollisols, the cropping systems had minimal effects on the proportions of SOC in POM versus MAOM [35].
The distribution of SOC fractions in cropping systems with winter cover crops have been previously studied [36,37,38]; however, there has been little research examining SOC fractions in cover crop with or without manure addition compared to mineral fertilization. The aim of this study was to (i) investigate the effect of different farming systems (organic vs. conventional systems) on the SOC sequestration rate, (ii) study the fractional composition of soil organic matter in a long-term crop rotation experiment, (iii) characterize SOC and total N (Ntot) in POM and MAOM fractions, and (iv) describe the chemical composition of POM and MAOM fractions through functional groups using FTIR spectroscopy. We hypothesized that as the SOM formation processes vary between conventional and organic farming systems and the POM and MAOM fractions are fundamentally different in terms of their properties, then the SOM composition and stability depend on farming systems and farming systems affect POM and MAOM composition differently.

2. Materials and Methods

2.1. Site Description

This investigation was conducted in a long-term field crop rotation experiment comparing conventional and organic farming systems [39,40]. The experiment was established in 2008 at the Estonian University of Life Sciences (58°21′52.4″ N 26°39′57.3″ E). The soil type of the experimental site was Stagnic Luvisols [41]. In 2008, the soil of the experiment contained an average SOC content of 13.8 g kg−1, and Ntot of 1.3 g kg−1 and pHKCl was 6.0. The texture of the soil was sandy loam (56.5% sand, 34% silt, and 9.5% clay) in the epipedon with a humus layer of 20–30 cm [42].

2.2. Experimental Design

The experiment was set up in four replications in a systematic block design. The size of the plots was 40 m2 for the conventional and 60 m2 for the organic farming system. The data in the present study concerned the period 2008–2018. The sequence of the crop in rotation were: barley (Hordeum vulgare L.) with undersown red clover, red clover (Trifolium pratense L.), winter wheat (Triticum aestivum L.), pea (Pisum sativum L.), and potato (Solanum tuberosum L.). The description of treatments in the organic and conventional farming systems is presented in Table 1. There were four fertilizer treatments in conventional farming systems: C-control (with no additional mineral fertilizers used), C-fertN1, C-fertN2, and C-fertN3, in which mineral fertilizers were applied with different N rates used depending on the crop. NPK fertilizers were added during sowing/planting at the rate of 20:25:95 kg ha−1. One and/or two subsequent mineral N supplements were added during growth. Winter wheat and potato received mineral fertilizers at the same rates in all conventional systems (50 (C-fertN1), 100 (C-fertN2), and 150 (C-fertN3) kg N ha−1 y−1). Barley undersown with red clover received mineral N fertilizers as 40 (C-fertN1), 80 (C-fertN2), or 120 (C-fertN3) kg N ha−1 y−1. Red clover alone did not receive any mineral fertilizers. For pea as a leguminous crop, the N rate was the same in systems C-fertN1−N3 (20 kg N ha−1 y−1). Synthetic plant protection products or pesticides were used in conventional cultivation systems. Depending on the crop and its situation, weeds, plant diseases, and pests were controlled 1–5 times during the growing season. In the autumn, pea, potato, and winter wheat plots were treated with glyphosate for weed control after harvesting.
The organic farming system had three treatments: O-control (organic control), O-CC (crop rotation with winter cover crops), and O-CC-M (crop rotation with winter cover crops and addition of composted cattle manure). The following cover crops were grown: ryegrass (since 2014, ryegrass was replaced with winter oil turnip) followed winter wheat, winter oilseed rape (since 2014 mixture of winter rye and winter oil turnip) followed peas and winter rye followed potato. Cover crops were plowed into the soil in spring as green manure. Composted cattle manure applied in the O-CC-M treatment during 2008–2012 was added to the soil in the autumn (in 2009) or in the spring (2010–2012) at a rate of 40 Mg ha−1 in the crop rotation before potato. During the period 2012–2018, the composted cattle manure was applied in spring before potato at a rate of 20 Mg ha−1, before barley, and for winter wheat at a rate of 10 Mg ha−1. The O-control system, which follows crop rotation and where synthetic plant protection products or pesticides were not used, was established in 2011. In this system, the original adjacent O-CC and O-CC-M were split, and the O-control and O-CC variants were established from the original O-CC (Figure S1 in Supplementary Material). Thus, cover crops were also grown in the O-control treatment until 2011. A third of the plot area of O-CC, established in 2011, contained the after-effect from the manure provided in the period 2008–2011; therefore, the effect of cover crop on SOC concentration may be slightly overestimated.

2.3. Estimating Annual C Inputs from the Main Crops

For estimation of annual C inputs from main crops during 2008–2018, we used the C allometric equations described by Bolinder et al. [43]. The yields of aboveground agricultural products (grain, tuber, and aboveground biomass for clover) and the relative plant C allocation coefficients for barley, red clover, winter wheat, and potato based on Bolinder et al. [43,44] (Table 2) were used to calculate the below-ground and aboveground biomass left on the field. A method for calculating the C allocation coefficients for pea is described by Kauer et al. [40].
It was assumed that the C concentration in all plant parts was 0.45 g g−1. We considered that only agricultural product C was removed from the field (grain and tuber). Clover biomass was left on the plots and plowed before sowing winter wheat.

2.4. Estimating Annual C Inputs from Cover Crops and Solid Manure

The biomass of cover crops was not measured during 2008–2012. The methodology for calculating the C input from the cover crop for this period was described in detail by Kauer et al. [40]. The aboveground biomass of cover crops in 2013–2018 was determined in spring. The ratio between aboveground biomass and roots of cover crops was taken to be 1.6 [45]. The C input from the cover crop was calculated using this ratio, taking into account additional root rhizodeposition (root biomass × 0.65 [43]).
The C input from composted manure was calculated based on the fact that 40 Mg ha−1 (8 Mg ha−1 y−1) of manure was applied during the crop rotation. For the period 2008–2012, we used C input from composted manure reported in Kauer et al. [40], with a value of 495 kg C ha−1 y−1. As the management of the O-CC system was changed in 2011, we considered the annual C input of O-CC also to include a third of the C input from manure (495/3 = 165 kg C ha−1 y−1). Information on the manure dry matter and C concentrations used in the period 2012–2018 is presented in Table S1.

2.5. Soil Sampling and Laboratory Analysis

In the spring of 2008 and 2018, the soil samples were collected from all test plots at a depth of 0–25 cm. Prior to laboratory analysis, air-dried soil samples were sieved through a 2 mm sieve. Samples from 2018 were separated into particulate organic matter (POM) and mineral-associated organic matter (MAOM) using the size-fractionation procedure [21]. Briefly, 10 g of air-dry soil samples were dispersed in 0.5% sodium hexametaphosphate for 18 h on a reciprocal shaker. Each sample was then washed with distilled water through a 63 µm sieve. The fraction retained on the sieve was considered the POM fraction, and the finer fraction that passed through the sieve was considered the MAOM fraction. The POM and MAOM samples were dried at 60 °C for 24 h and ground with a ball mill. The bulk soil samples and fractions were analyzed for total SOC and Ntot concentrations by dry combustion on a VarioMAX CNS elemental analyzer (ELEMENTAR, Elementar Analysensysteme GmbH, Langenselbold, Germany). For discussion of the results of fractionated samples, the SOC and N concentrations of the whole bulk soil sample (bulk-C and bulk-N) were calculated by the addition of the fraction’s C (POM-C and MAOM-C) and N (POM-N and MAOM-N) concentrations. The recovery of C and N in fractions is presented in Table S2.
The SOC stocks (Mg ha−1) were calculated to 25 cm depth as follows:
SOC stock = SOC × D × BD
where SOC is soil organic carbon concentration (%), BD is soil bulk density (g cm−3) and D is the depth of the sampled soil layer (cm).
The pedotransfer function [46] was used for BD estimation:
BD = 1/(0.03476 × SOM + 0.6098)
where SOM is the concentration of soil organic matter (%), with the assumption that SOM consists of 58% SOC [47].
The SOC sequestration rate during 2008–2018 was calculated as the difference between SOC stocks in 2008 and 2018, divided by 10 years. The SOC sequestration for the period 2008–2013 and 2013–2018 also was estimated.

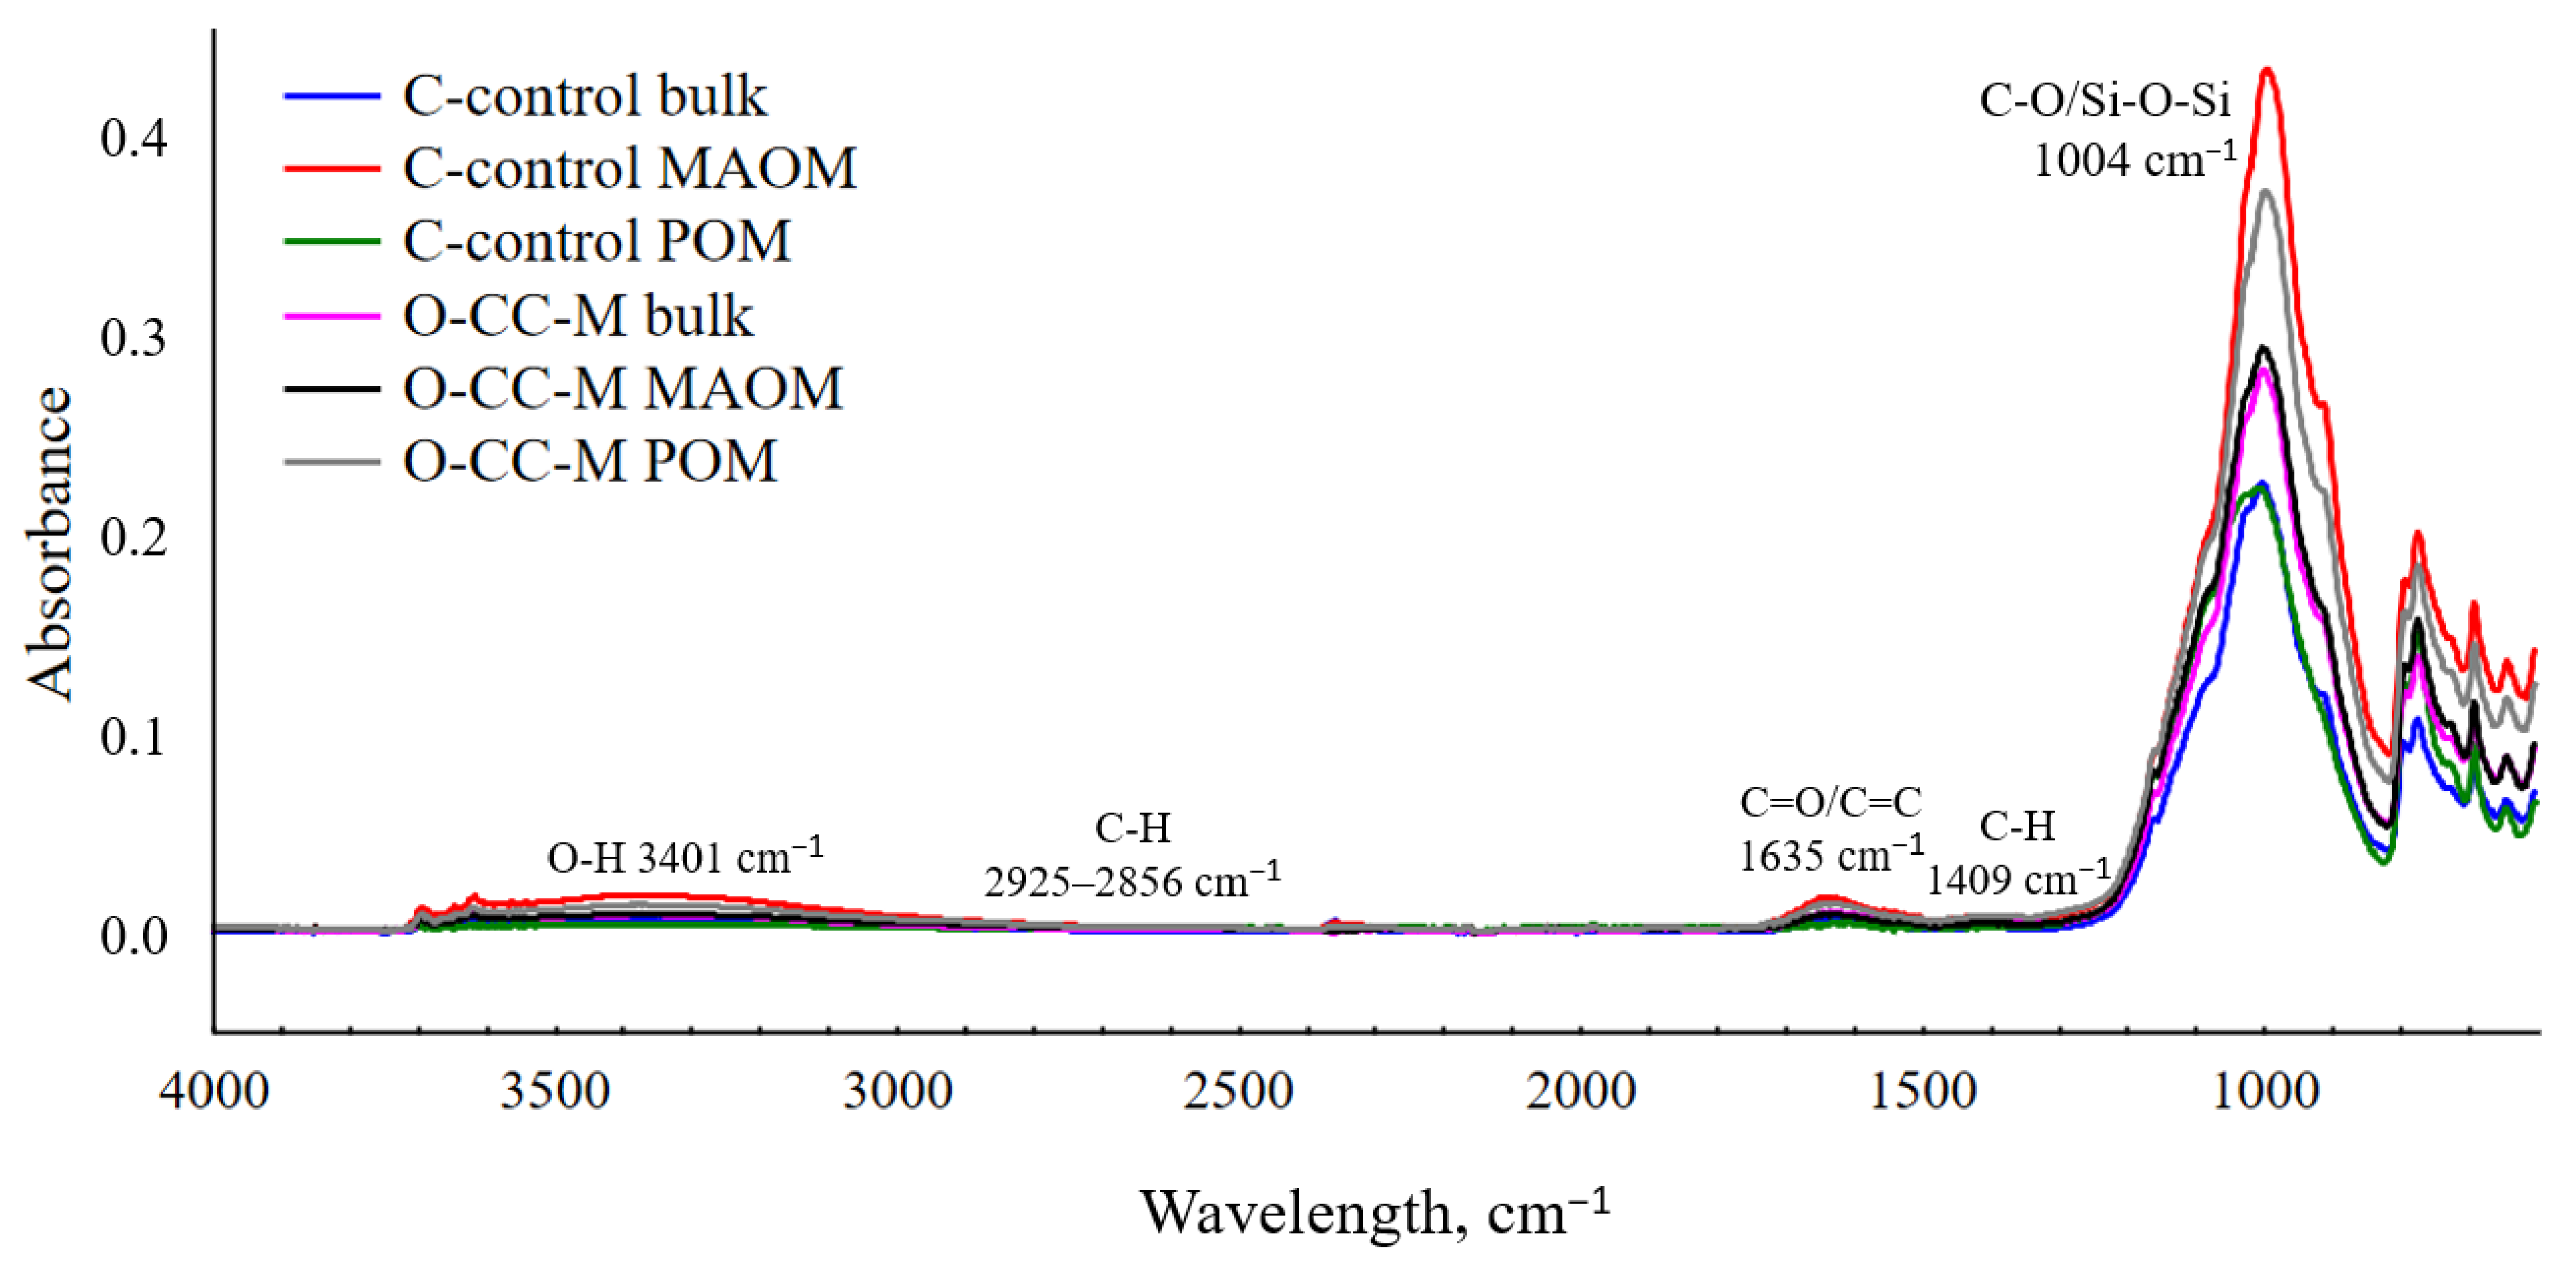
2.6. FTIR Spectroscopy

FTIR analyses were performed on samples (bulk, POM, and MAOM) from the following systems: C-control, C-fertN3, O-control, O-CC, and O-CC-M. The FTIR spectra of soil samples were obtained for a wavenumber range of 4000 to 400 cm−1 in a Thermo-Nicolet iS10 controlled by OMNIC software (Thermo Fisher Scientific, Waltham, MA, USA). To obtain the FTIR spectra, 32 scans were collected at 4 cm−1 resolution. Spectra replicates were corrected against the spectrum for ambient air as background. The baseline of the recorded spectra was automatically corrected and smoothed. The corrected peak heights were measured to estimate the intensity of infrared absorption. At eight wavelengths, the peak heights were measured, and the parameters for each peak were as follows: base 1/ peak/ base 2 (all in cm−1) 1157/1004/819, 1481/1409/1336, 1810/1635/1477, 2867/2856/2827, 2958/2925/2888, and 3527/3401/3164. Each portion of the test sample was loaded into the instrument for measurements once. The final result of the measurement was taken as the arithmetic mean of three parallel determinations performed under repeatability conditions [48]. The intense peak at 1004 cm−1 is related to the C–O bonds in polysaccharides and inorganic Si–O–Si vibration [49,50]. The peaks at 2856 and 2925 cm−1 were considered together and represent the symmetric and asymmetric aliphatic C–H functional groups [51,52,53]. The band at 1409 cm−1 was assigned to aliphatic C–H bending, which describes the presence of phenolic lignin in organic matter [54,55] but can also describe C = O vibrations of carboxylate ions, C = C aromatics, and C–N amides [56]. Absorption at 1635 cm−1 is due to C = C aromatic vibration and C = O vibrations of carboxylates (or amide) [50,57]. Absorption at 3401 cm−1 is due to O–H vibrations of alcohols, carboxyl functions, phenol, and N–H vibrations from amides and amines [50,58,59]. In order to determine relative changes of the existing bands or peaks and for comparison of the spectra, the relative absorbance (rA%) of each selected peak was calculated by dividing the corrected peak height of a distinct peak by the sum of the heights of all peaks studied and multiplying it by 100 [49].
The ratio of aromatic to aliphatic compound has been used to describe SOM aromaticity [60,61,62]. The aromaticity (Ar) was calculated as the intensity at 1635 cm−1 divided by the sum of intensities at 2925 + 2856 and 1409 cm−1 [62]. The recalcitrance (Recalc) of SOM was estimated using the ratio of C– to O– functional groups (sum of intensities at 2925 + 2856, 1635, and 1409 cm−1 divided by sum of intensities at 3401 and 1004 cm−1) [61].

2.7. Meteorological Data

Meteorological data were recorded at the field site with a Metos Compact (Pessl Instruments GmgH, Weiz, Austria) electronic weather station that automatically calculates average daily temperature and precipitation. In this study, monthly average values for temperature and precipitation were calculated from daily averages for the period 2008–2018. The annual average temperature was 6.2 °C, and precipitation was 544 mm (Table S3).

2.8. Statistical Analysis

Tukey HSD post-hoc tests for homogenous groups were used to test significant differences between treatments and experimental years. Factorial analysis of variance (ANOVA) and one-way ANOVA were applied to test the effect of treatments and fractionation on the different indicators. Linear relationships between SOC stock and year were estimated. The level of statistical significance was set at p < 0.05. These analyses were performed in STATISTICA version 13.4 (Quest Software Inc, Aliso Viejo, CA, USA). Spearman correlation plots and principal component analysis (PCA) were performed in R [63] software version 4.0.3 using RStudio software version 1.4.1103. Packages “corrplot” [64], “factoextra” [65], “FactoMineR” [66], and “ggplot2” [67] were used.

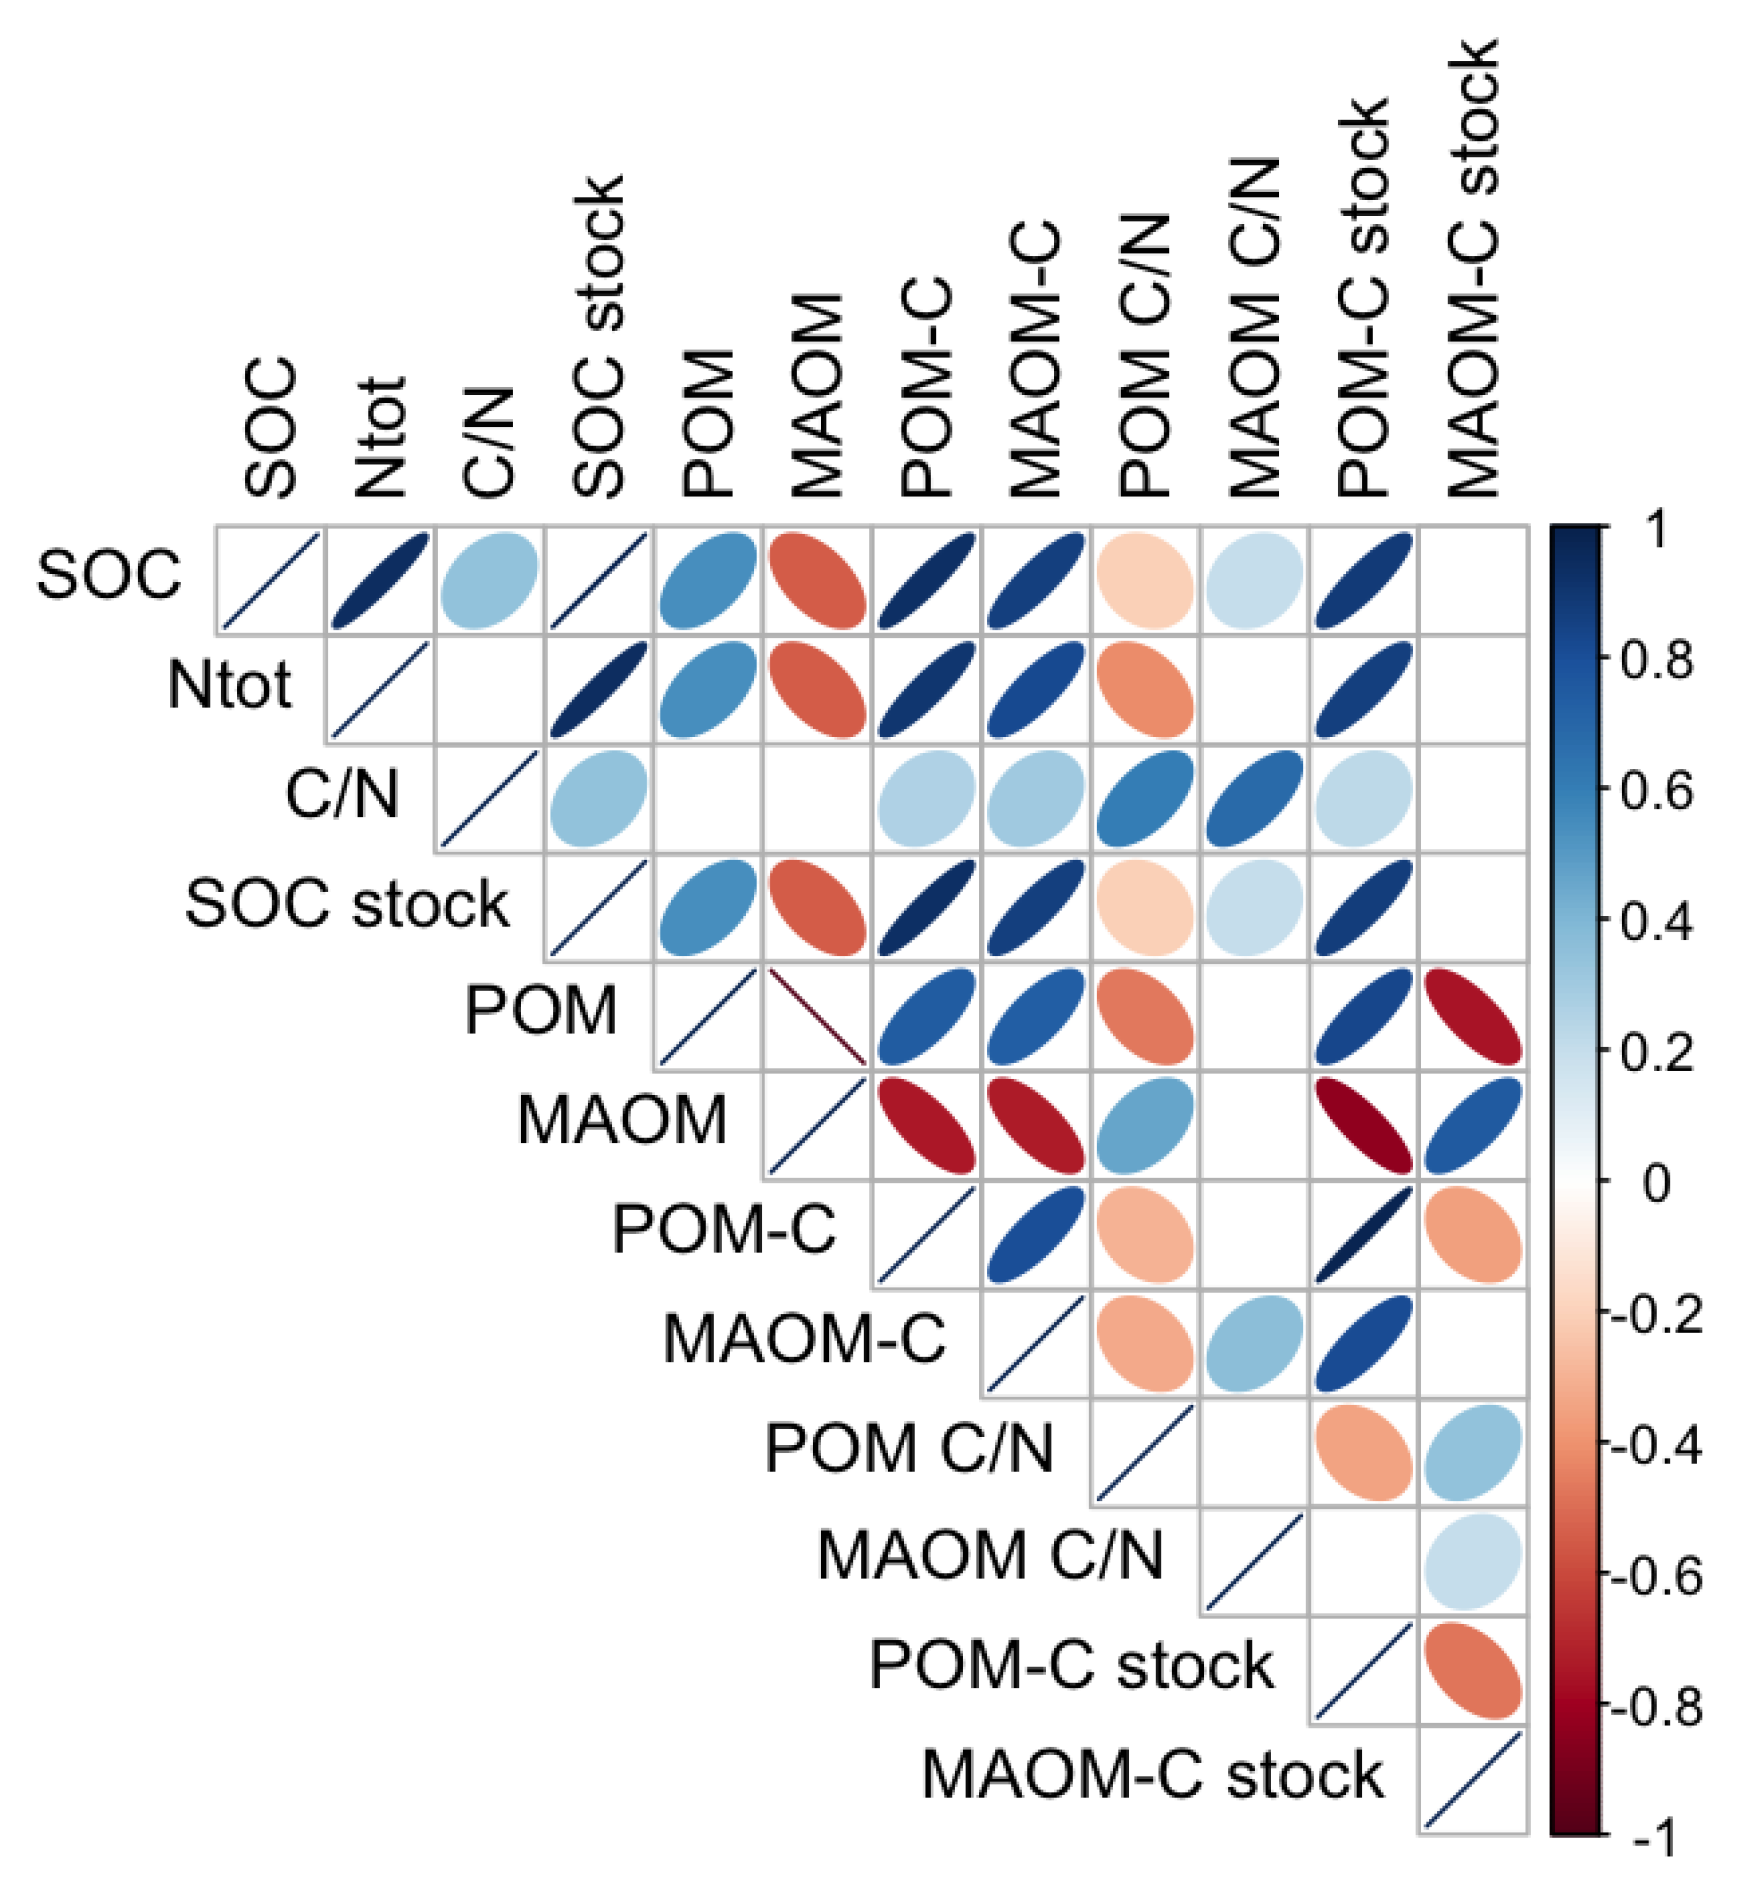
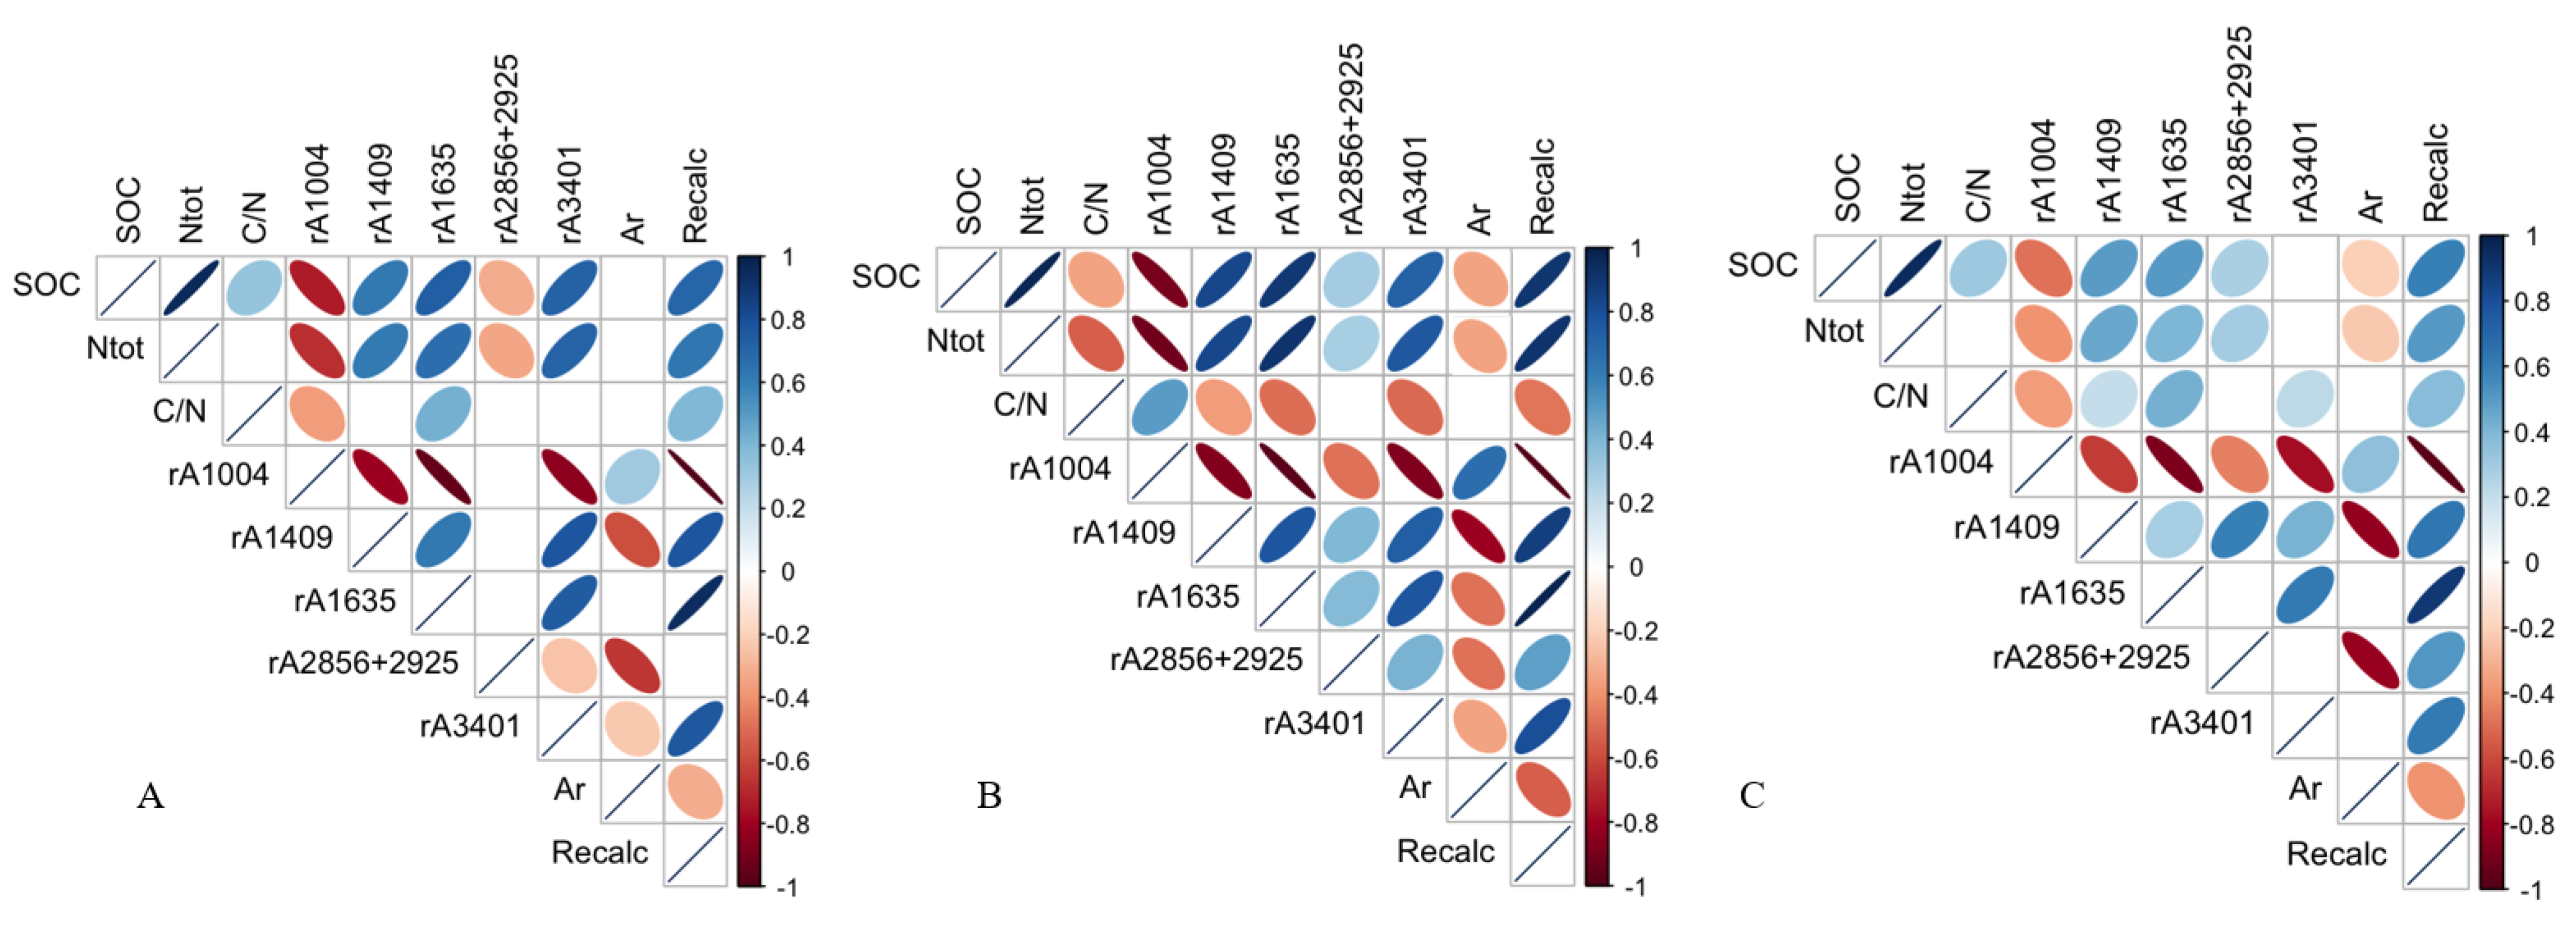
3. Results and Discussion

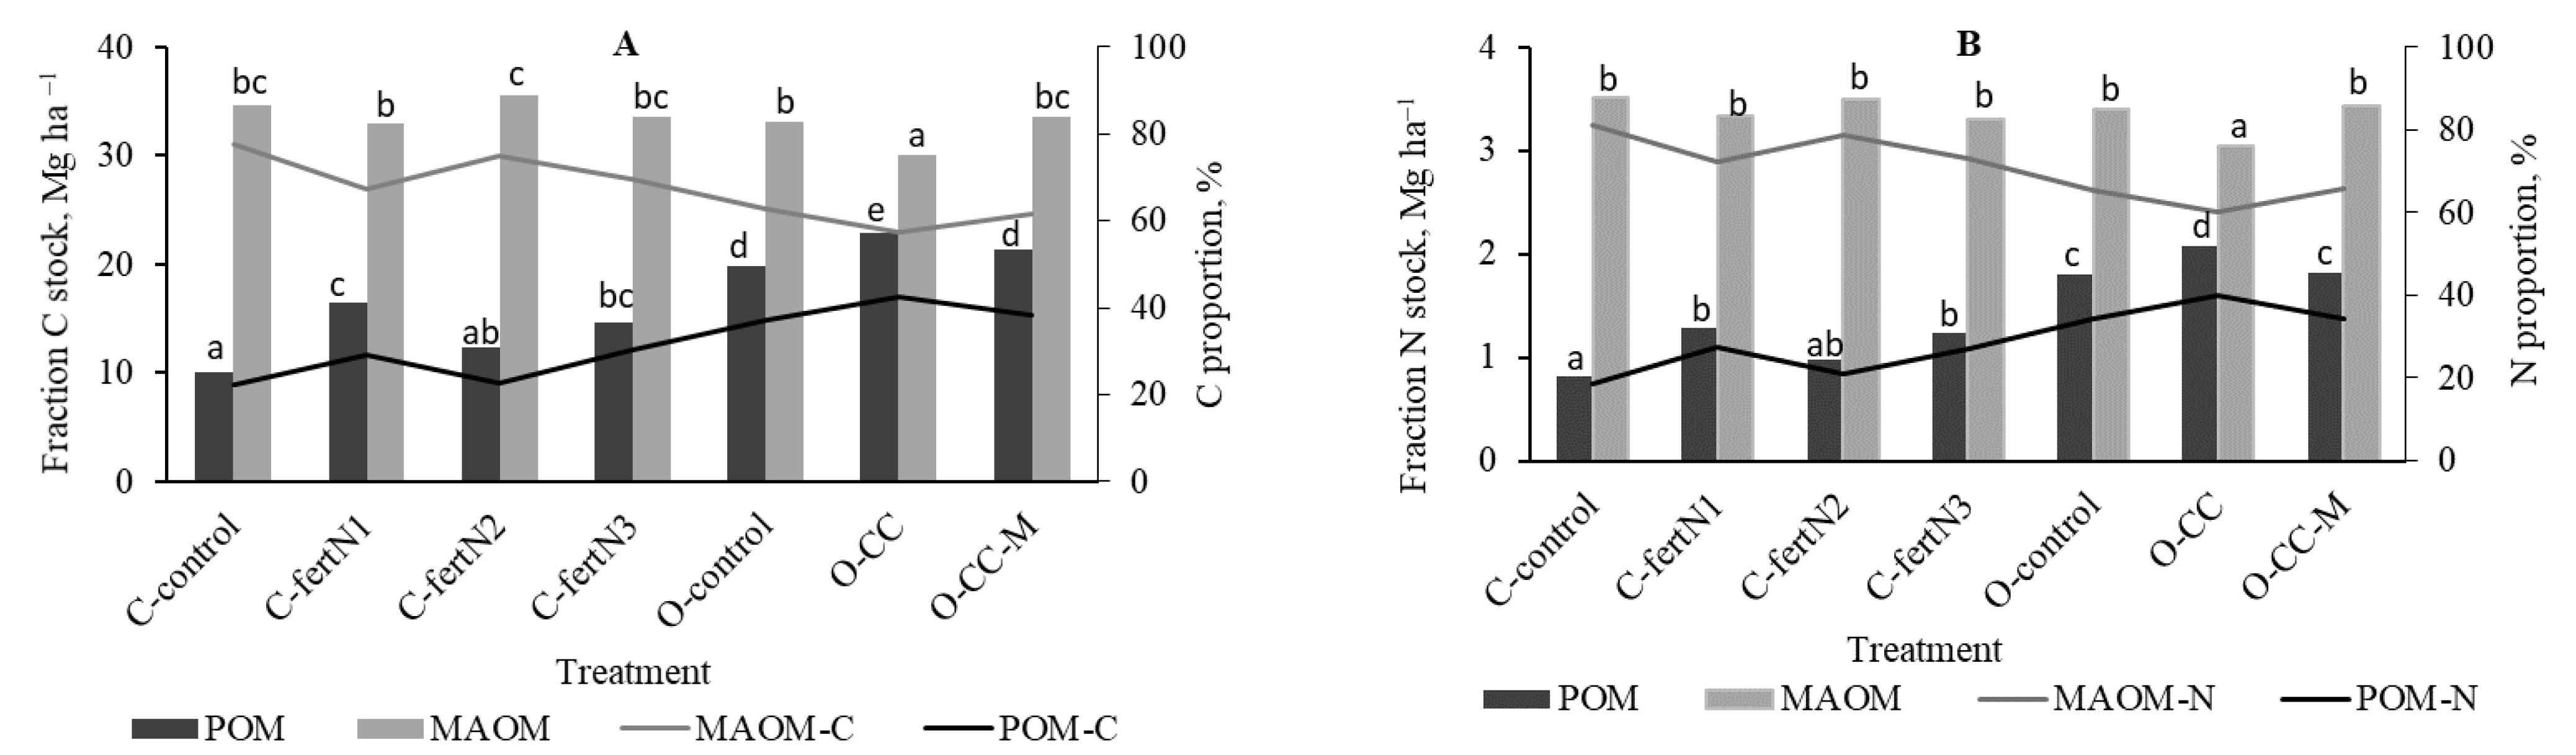
3.1. SOC Stock Change during 2008−2018

After the two crop rotations, the SOC concentrations increased only in the organic treatments where winter cover crops had been grown, and manure had been added (Table 3).
The higher SOC concentration in O-control in 2018 compared with the conventional system C-control was because the SOC concentration of this treatment was higher (12.8 vs. 14.7 g kg−1) at the beginning of the experiment because of the heterogeneity of the test area. It should also be noted that the O-control and O-CC treatments were slightly modified during the trial period. In the O-control, cover crops were also grown until 2011, which resulted in an increase in SOC concentration of 9.5% (up to 16.1 g kg−1), but upon discontinuation of cover crops, the SOC concentration decreased to the level at the beginning of the experiment after the second crop rotation in 2018 (14.7 g kg−1). During the second crop rotation, the SOC concentration also decreased in the O-CC system, which until 2011 also received manure across a third of the area, the input of which averaged 0.16 Mg C ha−1 y−1 (Table 4). The changes in the above-mentioned systems make it possible to estimate the duration of the after-effects of cover crops and manure in the soil, and these calculations suggest that the after-effects of cover crops and manure decreased significantly over the five-year period.
After two crop rotations, the Ntot concentration in the soil decreased in all treatments, during which the soil C/N ratio correspondingly increased. Soils with wider C/N ratios are associated with increased accumulation of non-degraded plant material [68]. The SOC stock in the conventional farming systems did not change during the study period (Table 3).
As SOC concentrations varied considerably from year to year (Figure S2), the linear relationships between SOC stock and years showed that SOC stock tended to increase under fertilization with low and medium levels of mineral N fertilizers (systems C-fertN1 and C-fertN2) or growing cover crops in rotation and adding composted manure (Table 5).
Under fertilization with higher N rates (system C-fertN3), the SOC stock did not change during the study period (Table 3 and Table 5), indicating that compared with the C-fertN1 and C-fertN2 treatments, mineral N fertilization increased the mineralization of SOM as annual C input into soil did not depend on N rates (Table 4). Thus, the higher the N rates, the lower the SOC sequestration rate (Table 3), confirmed by several studies that have shown that inorganic N fertilizer promotes N mineralization and depletes SOM stocks [69,70,71]. However, contradictory results have been found on how mineral N fertilization affects SOM decomposition [14].
The amount of C input in the cover cropping system (O-CC) was similar to the C input formed in conventional systems using mineral N fertilizers (3.78 vs. 3.76–3.84 Mg ha−1 y−1, respectively) (Table 4), but the SOC sequestration rate in O-CC was higher because there was no effect of mineral N fertilizer on the decomposition of SOM. However, the higher microbial activity found by Kuht et al. [72] and Eremeev et al. [73] and higher microbial diversity found by Esmaeilzadeh-Salestani et al. [74] in the organic systems at the same study site presented here had a positive effect on the SOC sequestration rate. Cover cropping also promotes increased microbial activity [75]. Microbes with higher activity in organic systems secrete extracellular polymetric substances that promote the formation of stable aggregates, resulting in slower cycling of organic matter [14,76]. During 2008–2018, an average of 0.50 Mg C ha−1 y−1 was applied to the soil with composted manure, which is less than the amount applied to the soil by cover crops (0.74 Mg C ha−1 y−1). However, the application of manure in cover cropping systems significantly increased the SOC sequestration (in the O-CC system, the SOC stock per 1 kg C input increased marginally, but in the O-CC-M system, the SOC stock increased by 0.30 Mg ha−1 y−1 per 1 Mg C input with a SOC retention efficiency of 30%). Thus, the properties of C input play an important role in controlling the SOC sequestration rate. In our earlier long-term research, we estimated that C retention from organic amendments was 22% [77]. Composted manure has undergone some degradation, resulting in the degradation of readily degradable compounds, whereas cover crops provide readily degradable (labile) organic matter [78], and thus, its SOC sequestration rate was lower compared with that under manure addition.
The SOC stock in the C-control system was constant over time; however, by manipulating the systems with amounts of mineral N, the variability of the SOC sequestration rate increased depending on the treatments and period (2008–2013 vs. 2013–2018) (Table 3). The SOC sequestration rate in treatments of C-fertN1 and C-fertN2 decreased during the first crop rotation but increased during the second crop rotation, whereas the trend was opposite in C-fertN3 and in the organic farming systems. Thus, the SOC sequestration rate decreases over time as the soil begins to approach an equilibrium point where the amount of degraded SOM and the amount of C entering the soil are in equilibrium. Han et al. [79] reported that globally at least 2.0 Mg ha−1 y−1 C input is needed to maintain the SOC. In our study, the C input was higher than this value, but the SOC stock did not increase. Studies in Europe and the USA have shown that SOC concentration increases when the annual C input is in the range of 5.4–8.9 Mg C ha−1 [80,81,82]. The low SOC sequestration rate in our experiment was due to the light soil texture, as SOC sequestration rates in light-textured soils may be low [77]. In general, it is found that the C retention coefficient in agricultural soils depends on their clay content as clay is positively related to SOC concentration [83], indicating that clayey soils have more potential to sequester C [26,84].

3.2. Fractional Composition of SOM

Of all studied soil fractions, the proportion of POM related to the sand fraction was the lowest, and the highest proportion of the MAOM fraction was the unfertilized C-control (Table 6), which had the smallest bulk SOC stock (Table 3). Mineral N fertilization increased the amount of C input to soil compared with the unfertilized C-control system (Table 4), and this was reflected in the ratio of fractions by increasing the POM and decreasing the proportion of the MAOM fraction. Cover cropping increased POM and reduced the proportion of MAOM, but manure addition eliminated the effect of cover crops, and the POM/MAOM distribution was similar in the O-control treatment (Figure 1).
Although the proportion of POM associated with the sand fraction was higher in the bulk soil (58.0%–68.6%), most of the SOC stock was located in the MAOM fraction (57.3%–77.8%) (Figure 1) because the MAOM-C concentration was higher than the POM-C concentration (Table 6).
This result was consistent with other studies [85,86], which reported that over 88% of SOC existed in the silt and clay fraction. Based on Guo et al. [87], in a Vertisol, 74%–92% of SOC was associated with MAOM. The relatively low proportion of C related to MAOM in our experiment is related to the lighter texture of the soil in this experiment, which contained 60% sand and 8% clay. Flessa et al. [86] found that 69% of the soil with sandy loam texture SOC was related to MAOM.
The mineral N fertilization increased POM-C concentration by 19%–52%. In organic farming systems, the POM-C concentration was 83%–95% higher compared with the C-control treatment (Table 6). The MAOM-C concentration increased 8%–20%. The POM-C stock was higher in organic systems and highest in the O-CC treatment (Figure 1A). The addition of manure showed no additional effect on POM-C stock but significantly increased in the MAOM-C stock, which was consistent with the results of previous studies [88,89,90], indicating that properties of C input influence the C stabilization into the soil as plant residues and manure were different in composition, containing different amounts of different C compounds [91,92]. The distribution of N stocks followed the same trend as for C (Figure 1B) because C and N are positively related (Figure 2). The C/N ratio of POM and MAOM was slightly narrower in the organic farming treatments compared with the conventional farming treatments (Table 6), indicating that the quality of SOM fractions described by the C/N ratio is dependent on farming systems [36].
The MAOM-C stock varied between 30.0 and 35.6 Mg ha−1 (Figure 1A). The variability of the MAOM-C stock was dependent on treatment and was smaller than the POM-C stock (10.1–22.9 Mg ha−1), indicating the possibility that the MAOM fraction approached SOM saturation [6,20]. Saturation is also indicated by a strong negative relationship between bulk soil C stock and the proportion of the MAOM fraction (Figure 2), which has also been reported by Cotrufo et al. [20]. Depending on the soil type, texture, and soil moisture regime, each soil has a certain C storage capacity and is related to the content of clay and silt particles in the soil [26]. The organic matter is stabilized in MAOM, but the stabilization efficiency decreases when clay and silt particles have insufficient free surfaces to bind organic matter [93]. When clay and silt particles are saturated with organic matter, the organic matter not bound to soil minerals remains in the labile POM fraction [6], and the proportion of POM increases [94]. At the same time, the POM-N and POM-C concentrations increased (Table 6), and there was a negative correlation between the POM proportion and the POM-C/N ratio (Figure 2).
This was due to increased C and N mineralization in POM, as N mineralization in POM may be partially balanced through N immobilization [93]. The POM mineralization is also promoted by higher N input via fertilization and through plant residues in the soil, calculated in this experiment based on Alaru et al. [39]. Increased mineralization can explain why the general SOC sequestration rate decreased with the N rate in conventional farming systems (Table 3). Compared with MAOM, the POM has a higher C/N ratio, which is closer to that of the plant residues from which organic matter is [93,95]. Narrowing the POM-C/N ratio during POM accumulation creates better conditions for SOM decomposition by promoting the release of nutrients from SOM, and thus the labile POM fraction plays an important role in plant nutrient supply [29,93]. The narrower C/N ratios in MAOM indicate an increasing degree of humification of organic [49]. The proportion of microbially derived organic matter with its characteristically low C/N ratio increases after the depolymerization of plant-derived organic macromolecules [76]. At the same time, enrichment with N-rich metabolites occurs in MAOM [49,76], and microbial residues bind to the surface of soil minerals, making them less available [96,97]. As MAOM is mostly of microbial origin [20], the MAOM-C/N variability is lower than that of POM (Table 5). POM consists of partially decomposed plant material, and in this experiment, the plant material differs in its C/N ratio depending on the plant species and fertilization.
The fractional composition of the O-control soil differed from that of the C-control, although the only difference between these systems was the use of the plant protection products, which were a part of the C-control system. The differences in fractional compositions were not due to the different bulk SOC concentrations, as the SOC did not change over time in these systems. The use of plant protection products may affect (inhibit) the activity and diversity of microbes [98,99]. Higher microbial activity in the O-control treatment promoted the formation of stable aggregates (especially in POM fraction), and organic matter was protected against degradation [14,100]. These conditions promoted the accumulation of SOM in the O-control and other organic farming systems compared to other systems.

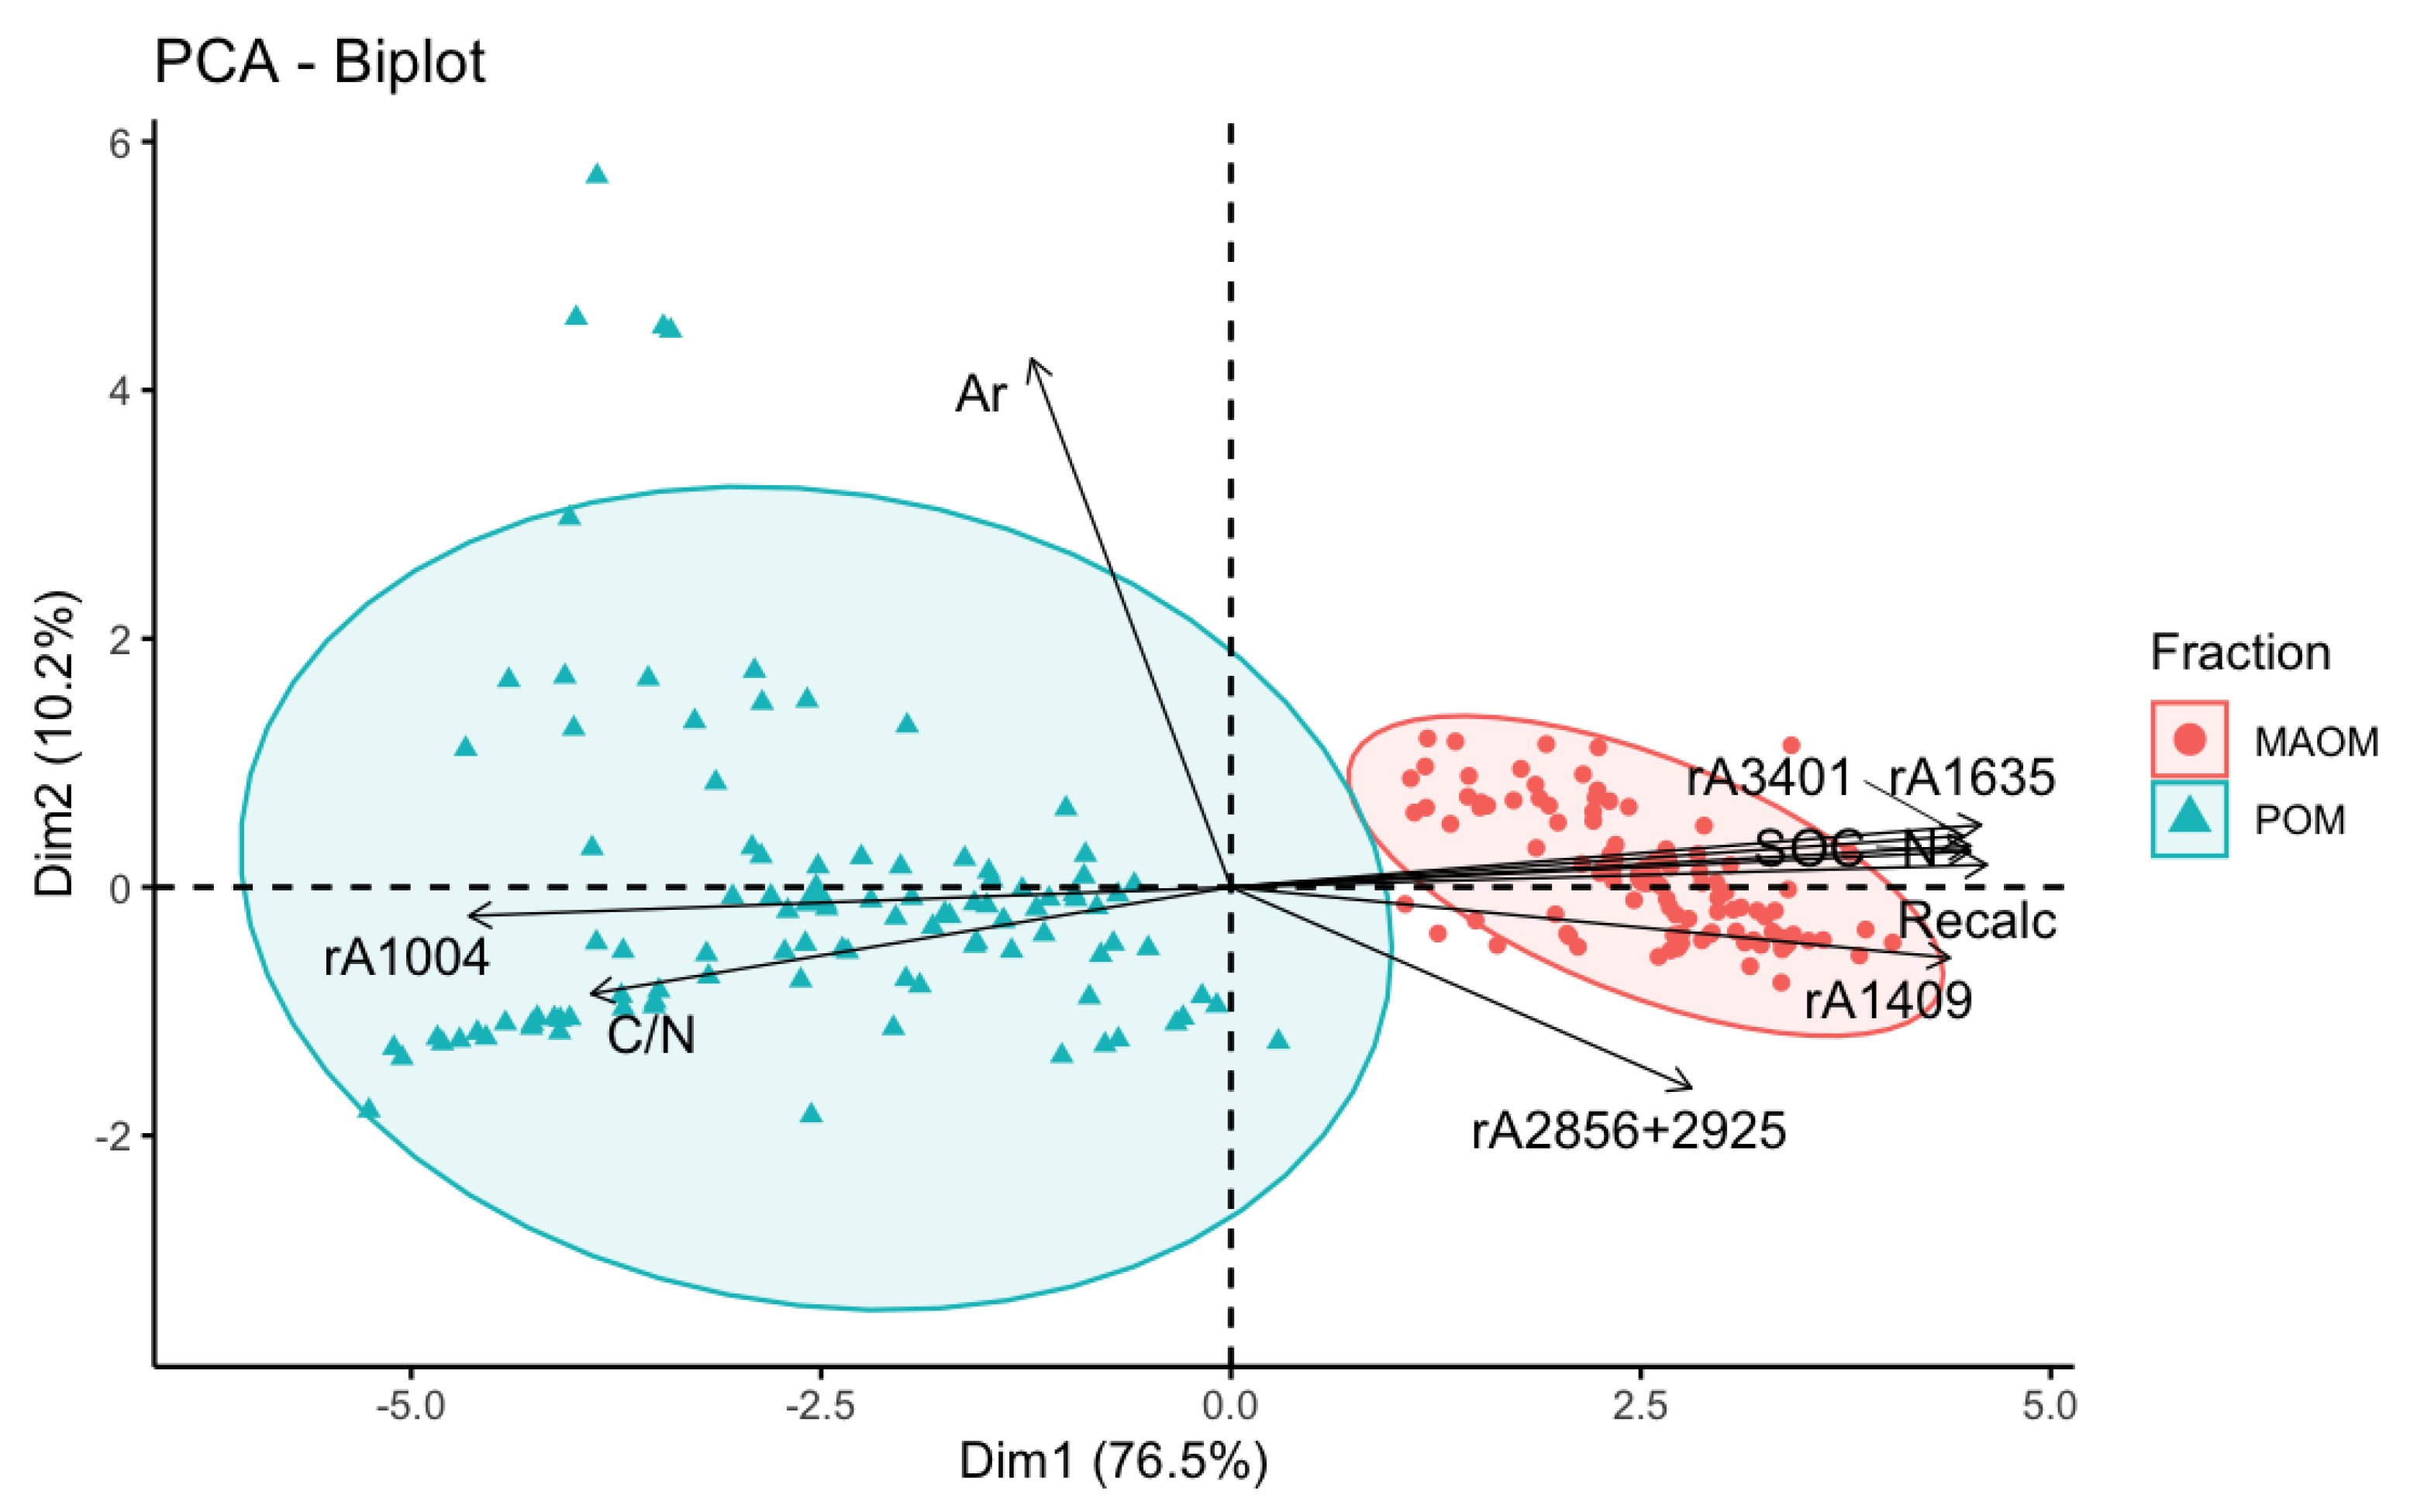
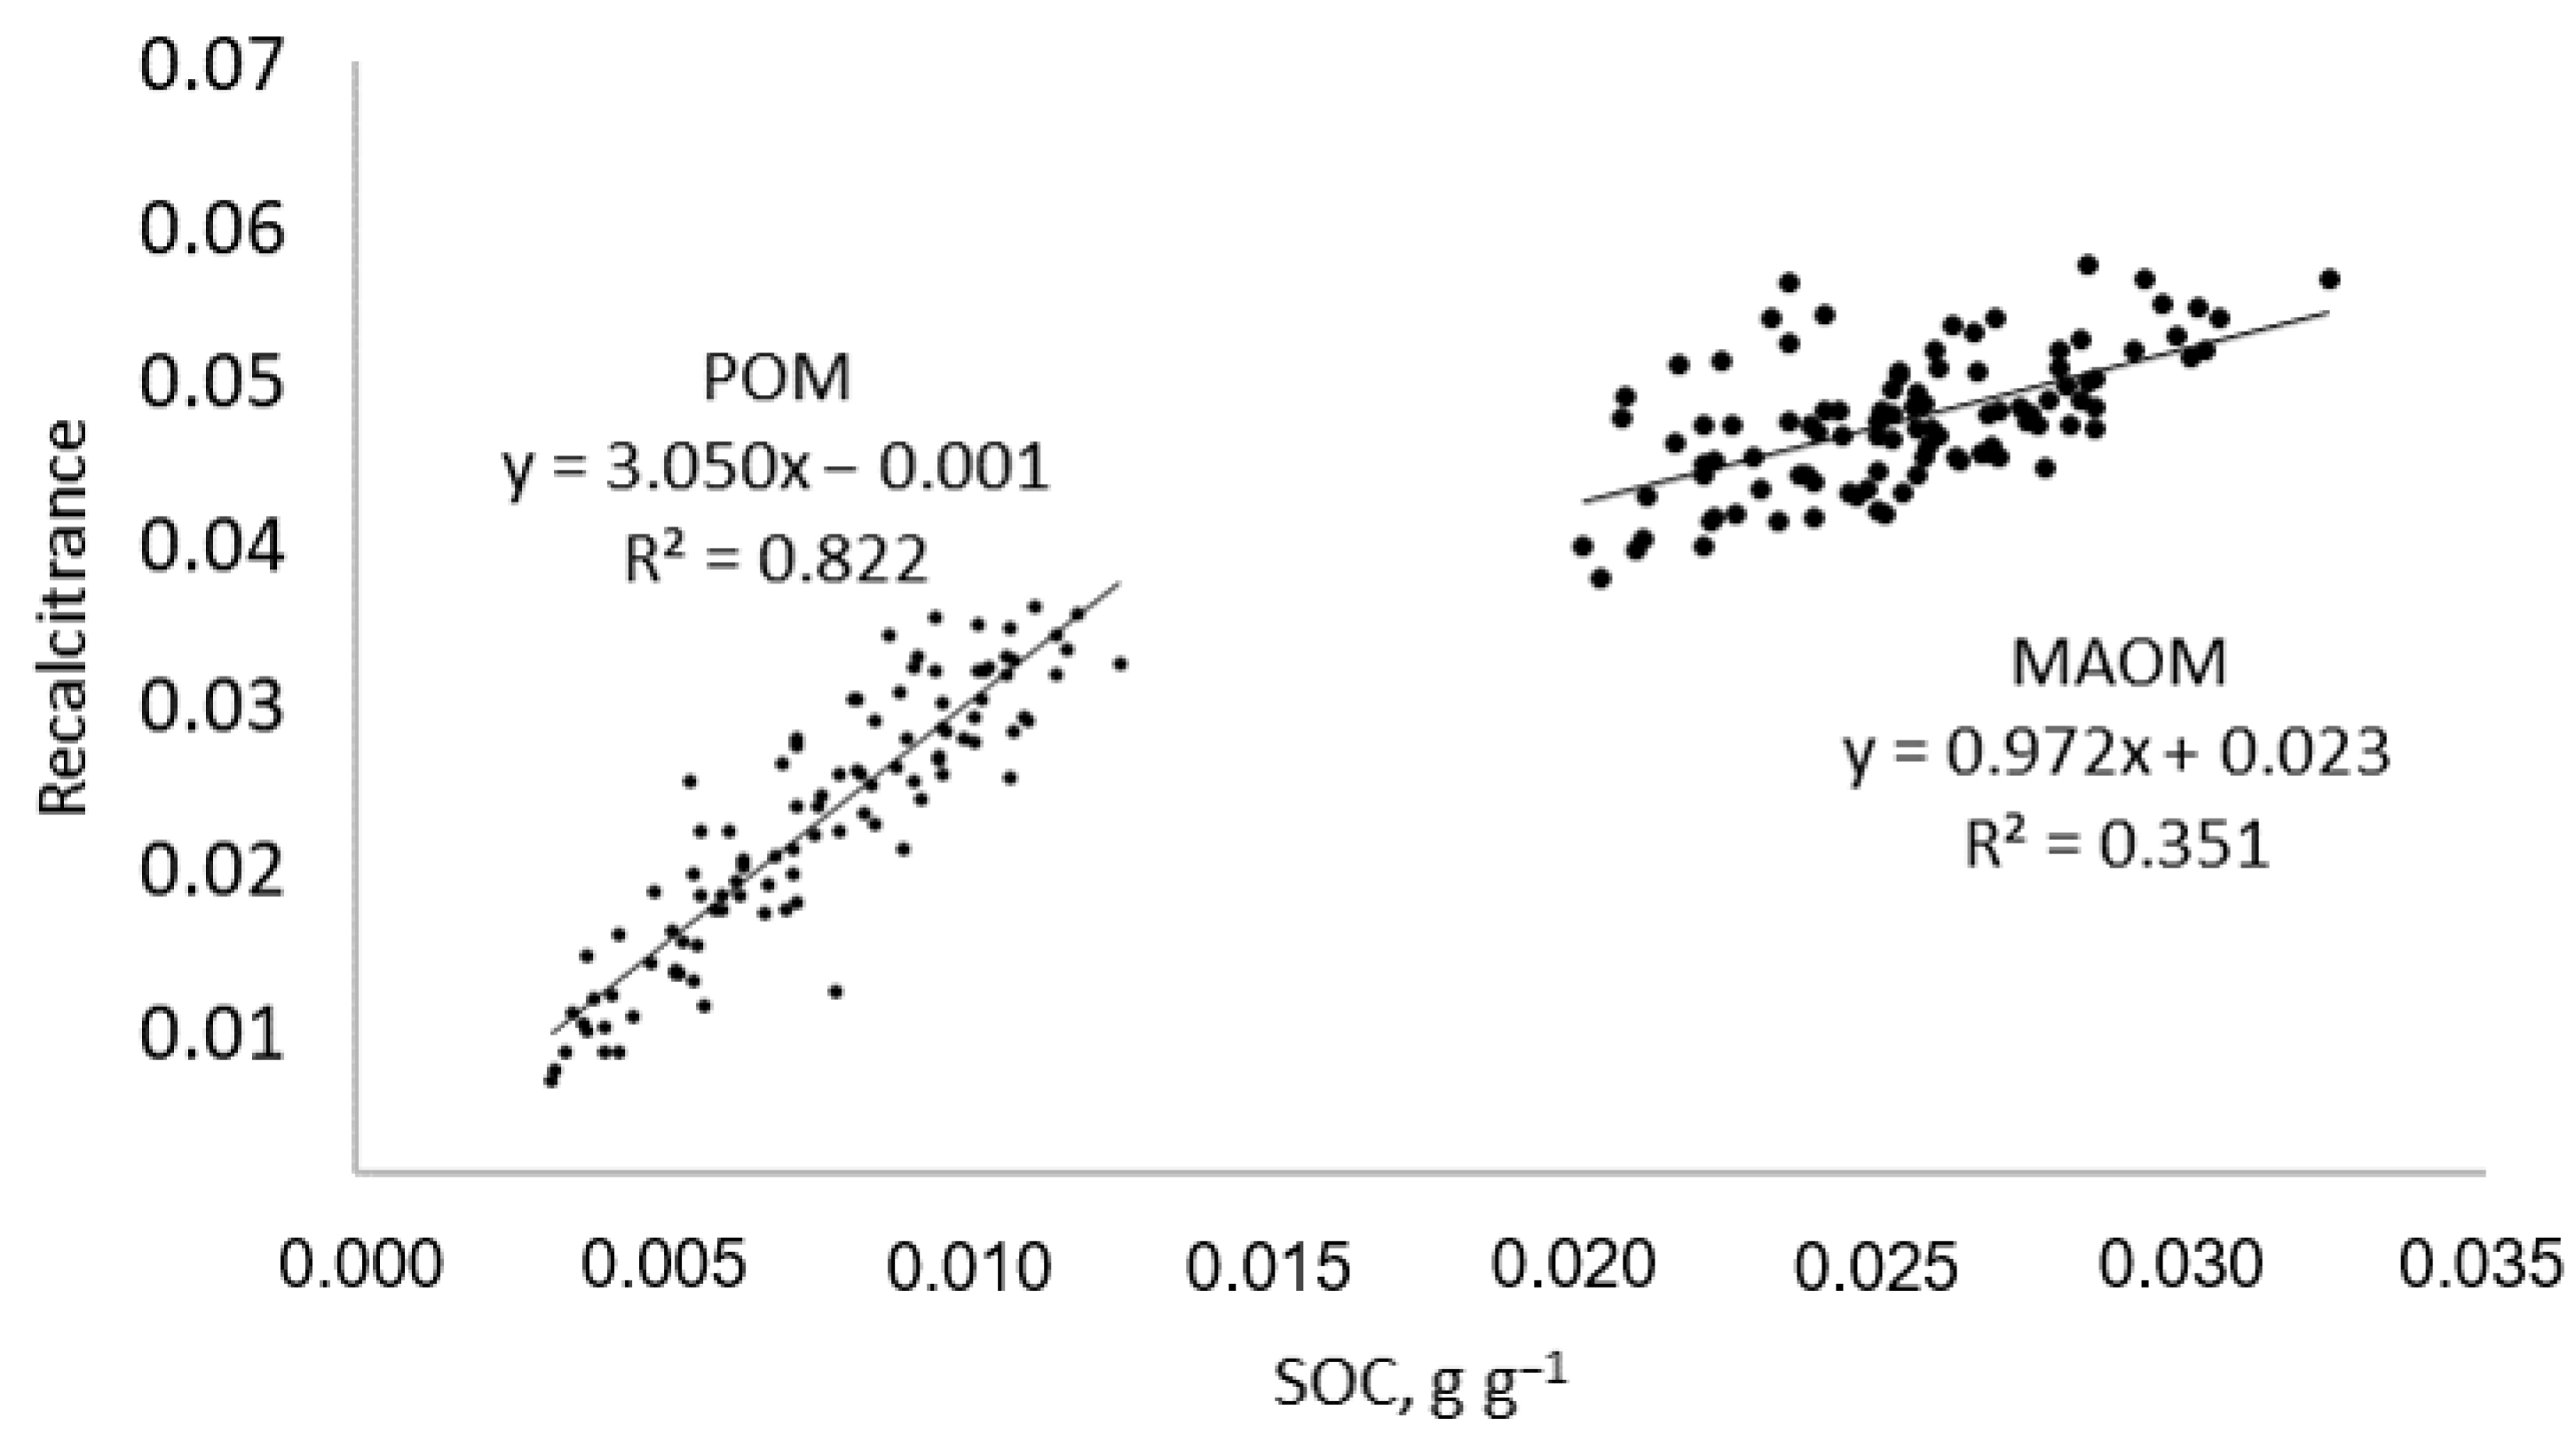
3.3. FTIR Spectroscopy

The studied absorbances at the selected wavelengths occurred both in bulk soil and in the MAOM and POM fractions (Figure 3).
All intensities were higher in MAOM (Table S4). The sharp peak at 1004 cm−1 related to the C–O bonds in polysaccharides and the inorganic Si–O–Si vibration was significantly weaker in POM and bulk soil than in MAOM, indicating that clay could have higher absorption capacity toward polysaccharides relative to the coarser size [101].
The relative absorbances of the functional groups were dependent on fraction, treatment, and their interaction (Table 7).
The bulk-C and bulk-N concentrations were positively related to relative absorbances at 1409, 1636, and 3401 cm−1 in bulk soil (Figure 4A; bulk soil).
Absorption at 1409 cm−1 may be related to either aliphatic C−H or C=O vibrations of carboxylate ions, C=C aromatic, and C−N amide bonds [55,56]. Absorbances caused by lignin and protein have been found in the 1635 cm−1 region [31,58,59] and describe a relatively recalcitrant form of organic C [58,59,102]. Proteins are of microbial origin [103], and lignin normally originates from decomposing plant residues, and thus the region at 1635 cm−1 describes the uptake relating to a combination of both. Aromatic and aliphatic compounds are referred to as recalcitrant groups in soil [104,105]. The absorbances near 3401 cm−1 are associated with more readily degradable organic matter in the soil [58]. The relationship between SOC concentration and the relative absorption due to polysaccharides at 1004 cm−1 was negative because during the SOM formation under a SOC concentration increase, the absorption by other functional groups increases but the share of polysaccharide absorption decreases (Table 8).
The relative absorbances relating to the different functional groups were positively related to each other (except for 1004 cm−1) because, during the formation of SOM, material containing functional groups from different C compounds accumulates in the soil. The SOC and N concentrations in the fractions were also related to relative absorbances (Figure 4; POM and MAOM) and followed the same trend as in bulk soil. Weaker relationships between MAOM-C and MAOM-N concentrations and MAOM functional groups indicate saturation of MAOM with organic matter.
The negative relationship between the bulk-C concentration and relative absorbance at 2925 + 2856 cm−1 is an unexpected result, as it has previously been found that aliphatic compounds typically increase with SOC concentration [103]. In particular, the addition of manure should increase the content of aliphatic compounds, especially under fertilization with mineral N fertilizer [106]. It is not clear why in our study this relationship in bulk soil samples is reversed as aliphatic compounds are present in the unfertilized treatment but missing in the manure-addition treatment (Table 8).
The PCA showed no correlations between POM and MAOM indices (Figure S3), indicating that POM and MAOM differ in their composition (Figure 5). The C and N concentrations of fractions, rA1409, rA1635, rA3401, and Recalc contributed positively, and the rA1004 and C/N ratio negatively to PCA1. Ar was positively contributed to PCA2. The MAOM fraction was characterized by high C and N concentrations, relative absorbances at 1409, 1635, 3401 cm−1, and Recalc, whereas the POM was less tightly clustered but characterized by high rA1004 and Ar and a wider C/N ratio.
Previous studies have shown that compared with MAOM, the microbially less processed POM should contain more polysaccharides (oxygen-rich functional groups) [75,107], more aliphatic [89], and less aromatic C [60,61,87,108,109]. In our study, in addition to aromatic C, the POM also contained less aliphatic C–H and phenolic O–H compounds (Table 8). The POM is largely related to carbohydrates (i.e., polysaccharides) compared with MAOM because POM contains much fresh plant residues that contain polysaccharides [110]. POM with partly degraded plant residues also incorporate considerable amounts of lignified material, and lignin is only slightly degraded by microbes [6,111]. It has been reported that lignin products accumulate in the coarse POM fraction but are nearly absent in the fine-sized MAOM fraction [94,112]. The higher lignin content also causes POM to be more aromatic than MAOM (Table 8) as lignified material contains aromatic compounds, and the proportion of aliphatic compounds is low in POM compared with that of aromatic compounds. Higher aromaticity in POM indicates the presence of more lignin structures, which could be attributed to the increased input of crop residues [113]. Veum et al. [109] and Margenot et al. [61] used the aromaticity to indicate the degree of SOM decomposition; correspondingly, the POM contained more decomposed SOM (Table 8).
Higher relative absorbance of aromatic C in MAOM (Table 8) indicates more processed C [114], and higher humification is also indicated by a narrower C/N ratio in MAOM (Table 6). The organic matter associated with MAOM is primarily of microbial origin [20] and contains a relatively high proportion of polysaccharides and amino acids (proteins) but a low proportion of lignin products [115]. Thus, the absorbances of functional groups in MAOM are related to the treatment of SOM by the microbes. The greater proportion of aromatic components in MAOM than POM can, in addition to biological processes, be explained by the retention of lignin-containing dissolved organic carbon, which forms stronger surface complexes with minerals than carbohydrates [26]. In our study, the aromaticity was negatively related to aliphatic compounds (Figure 4) and was lower in the MAOM fraction (Table 8). Yeasmin et al. [62] found that aromaticity was higher in MAOM than in POM. The lower aromaticity of MAOM in our study might be because of the accumulation of long-chain aliphatics, such as cutin, suberin, and waxes, in MAOM during the final stage of decomposition [62]. Higher aliphatic C–H intensity in MAOM may be associated with the cross-linking (association) of long-chain aliphatic compounds with minerals during humification [116,117]. It has been found that humin, the most recalcitrant organic soil fraction, is composed mainly of aliphatic hydrocarbons [118]. The aliphatic compounds accumulated more in MAOM under cover cropping compared with other systems, and the organic matter in MAOM was less aromatic (Table 8). Thus, although the C/N ratio of MAOM in organic systems indicated similar humification, the FTIR spectroscopy analysis indicates that more humified organic matter was formed under cover crops regardless of manure addition.
The recalcitrance of SOM, assessed by the ratio between aliphatic and aromatic groups to oxygen-containing functional groups, was lower in POM than in MAOM (Table 8), which is consistent with previous research [17,20,119]. Thus, the more oxygen-containing functional groups, the more reactive the organic matter [120]. The resistance of the SOM to degradation increased with increasing SOC concentration (Figure 4), consistent with Margenot et al. [59]. However, the increase was fraction-dependent and was particularly pronounced in POM as the slope is higher (Figure 6). As the POM-C increased, the content of aliphatic (C–H) and aromatic compounds (C=C) increased more than the content of oxygen-containing compounds, and the recalcitrance of the organic matter increased. More recalcitrant POM was formed in organic systems, although cover cropping and manure addition had no effect. Thus, the recalcitrance of POM did not depend on the amount and properties of C input, and more favorable conditions for microbes in organic farming systems could have a greater effect than the amount of C input because there was no negative effect on microbial activity caused by use of plant protection products. Mao et al. [121] showed that the chemical composition of SOM is primarily determined by the interaction between the organisms responsible for decomposition and the mineral soil matrix and less determined by the nature of the substrate input.
The POM with the lowest resistance to degradation (with the most labile composition) was in C-control. Although the POM of the C-control treatment was the most labile, it did not appear in bulk soils. A total of 77.8% of the SOC stock of C-control was related to MAOM, and the lability of POM was not sufficient to affect the lability of the whole SOM. Fertilization with mineral N fertilizer reduced the lability of POM because it increased the C input into the soil and promoted SOM decomposition. Recalcitrance was higher in MAOM than in POM but was not treatment-dependent.
Although there were some differences between treatments (as discussed above), the PCA biplots of bulk soil and fractions (Figure 7) show that our chosen FTIR parameters were insufficient to allow identification of the effects of specific treatments on the SOM composition. The PCA biplots with the categorical factor “farming systems” (conventional and organic systems) showed some grouping (Figure 7).
In general, the organic matter of bulk soil and POM from organic farming systems are characterized by higher SOC and N concentrations, higher relative absorbances at 1409, 1365, and 3401 cm−1, and higher recalcitrance. The effect of cover crop and manure on SOM composition could not be detected. The SOM of conventional farming systems contains a higher proportion of polysaccharides. The unfertilized treatment C-control) was also characterized by a higher proportion of aliphatic C-H compounds and N-fertilized treatment (C-fertN3) by higher aromaticity and SOM with higher decomposition degree promoted by fertilization.

4. Conclusions

In this study, we investigated the SOC sequestration rate during 2008–2018 and the SOM composition in crop rotation and compared a conventional mineral fertilization system with organic systems comprising cover cropping with and without composted manure addition. After two crop rotations, we can conclude that the SOC sequestration rate was dependent on the treatment and the higher SOC sequestration rate was in the organic treatment with cover crop and composted manure addition. Depending on the treatment, 57.3–77.8% of the SOC stock was in the MAOM fraction. The ratio of POM to MAOM depended on the treatments, and mineral N fertilization and organic farming increased the SOC stock proportion of POM. Although the C input in conventional systems was comparable to the C input in organic farming, less labile POM fraction was formed in the conventional systems than in organic systems because fertilization with mineral N fertilizer promoted the decomposition of SOM. The highest proportion of SOC stock related to labile POM was in the cover cropping system, reducing the proportion of MAOM-C, but the addition of composted manure also increased the proportion of C in MAOM.
The POM and MAOM fractions differed in their composition; the MAOM fraction was characterized by higher SOC and N concentration and recalcitrance, whereas the POM fraction contained more polysaccharides having a wider C/N ratio and higher aromaticity (degree of decomposition). The SOM recalcitrance was higher in organic farming systems compared with conventional farming systems. As composted manure had no effect on SOM recalcitrance, the POM recalcitrance did not depend on the amount and properties of C input in organic systems. In conventional farming systems, mineral N fertilization increased POM recalcitrance and aromaticity (degree of decomposition). The SOM recalcitrance increased with SOC concentration and was related to the presence of aromatic compounds, which increased with C input to the soil. The aromaticity of SOM fractions was lower in the cover cropping system, and there was no detected effect of manure addition. Although the SOC sequestration rate was higher when manure was added to the soil, resulting in the highest formation of both POM and MAOM in the soil, the addition of manure had little effect on SOM composition. Our results confirm that although SOM under cover cropping had a higher proportion of labile POM, POM composition under organic farming was more resistant to degradation compared to conventional farming systems.

Supplementary Materials

The following are available online at https://www.mdpi.com/article/10.3390/agriculture11090903/s1, Figure S1: Change in the experimental design of the organic farming systems, Figure S2: Dynamics of soil organic carbon (SOC) concentration depending on treatment during 2008–2018. Error bars denote ± standard error, Figure S3: Principal component analyses of relative absorbances, C/N ratio, C and N concentrations, recalcitrance (Recalc) and aromaticity (Ar) of particulate soil organic matter (POM) and mineral-associated organic matter (MAOM) fractions, Table S1: Dry matter and carbon (C) concentrations of manure used in the period 2012–2018, Table S2: Soil organic carbon (bulk-C) and total nitrogen (bulk-N) concentrations calculated from fractions soil organic C and total N concentrations and C and N recovery depending on treatments, Table S3: Average weather conditions at the field site 2008–2014, compared with the long-term average (1969–2014), Table S4: The peak intensities (×1000) at selected wavelengths (cm−1) for bulk soil (bulk), particulate soil organic matter (POM) and mineral-associated organic matter (MAOM).

Author Contributions

Conceptualization, K.K., L.T. and A.L.; methodology, L.T., V.E. and A.L.; software, K.K. and S.P.; validation, K.K.; formal analysis, K.K. and S.P.; resources, K.K. and A.L.; data curation, K.K., S.P. and V.E.; writing—original draft preparation, K.K. and S.P.; writing—review and editing, S.P., L.T., V.E. and A.L.; visualization, K.K. and S.P.; project administration, K.K., L.T. and A.L.; funding acquisition, K.K. and A.L. All authors have read and agreed to the published version of the manuscript.

Funding

This research was funded by the Estonian Research Council, through grant PSG147 and by ERA-NET Core organic project FertilCrop.

Institutional Review Board Statement

Not applicable.

Conflicts of Interest

The authors declare no conflict of interest.

References

  1. Jobbágy, E.G.; Jackson, R.B. The vertical distribution of soil organic carbon and its relation to climate and vegetation. Ecol. Appl. 2000, 10, 423–436. [Google Scholar] [CrossRef]
  2. Lal, R.; Follet, R.F.; Stewart, B.A.; Kimble, J.M. Soil carbon sequestration to mitigate climate change and advance food security. Soil Sci. 2007, 12, 943–956. [Google Scholar] [CrossRef]
  3. Paustian, K.; Larson, E.; Kent, J.; Marx, E.; Swan, A. Soil C sequestration as a biological negative emission strategy. Front. Clim. 2019, 1, 1–11. [Google Scholar] [CrossRef]
  4. Poeplau, C.; Don, A. Carbon sequestration in agricultural soils via cultivation of cover crops—A meta-analysis. Agric. Ecosyst. Environ. 2015, 200, 33–41. [Google Scholar] [CrossRef]
  5. Lal, R. Soil carbon sequestration impacts on global climate change and food security. Science 2004, 304, 1623–1626. [Google Scholar] [CrossRef] [Green Version]
  6. Six, J.; Feller, C.; Denef, K.; Ogle, S.M.; de Moraes, J.C.; Albrecht, A. Soil organic matter, biota and aggregation in temperate and tropical soils—Effects of no-tillage. Agronomie 2002, 22, 755–775. [Google Scholar]
  7. Six, J.; Paustian, K. Aggregate-associated soil organic matter as an ecosystem property and a measurement tool. Soil Biol. Biochem. 2014, 68, A4–A9. [Google Scholar]
  8. Luo, Z.K.; Wang, E.L.; Sun, O.J. Can no-tillage stimulate carbon sequestration in agricultural soils? A meta-analysis of paired experiments. Agric. Ecosyst. Environ. 2010, 139, 224–231. [Google Scholar] [CrossRef]
  9. Tautges, N.E.; Chiartas, J.L.; Gaudin, A.C.M.; O’Geen, A.T.; Herrera, I.; Scow, K.M. Deep soil inventories reveal that impacts of cover crops and compost on soil carbon sequestration differ in surface and subsurface soils. Glob. Chang. Biol. 2019, 25, 3753–3766. [Google Scholar]
  10. Chinthapalli, B.; Dibar, D.T.; Chitra, D.S.V.; Leta, M.B. Comparative study on the effect of organic and inorganic fertilizers on agronomic performance of faba bean (Vicia faba L.) and pea (Pisum sativum L.). Agric. For. Fish. 2015, 4, 263–268. [Google Scholar]
  11. Abdalla, M.; Hastings, A.; Cheng, K.; Yue, Q.; Chadwick, D.; Espenberg, M.; Truu, J.; Rees, R.M.; Smith, P. A critical review of the impacts of cover crops on nitrogen leaching, net greenhouse gas balance and crop productivity. Glob. Chang. Biol. 2019, 25, 2530–2543. [Google Scholar] [CrossRef] [Green Version]
  12. Adetunji, A.T.; Ncube, B.; Mulidzi, R.; Lewu, F.B. Management impact and benefit of cover crops on soil quality: A review. Soil Till. Res. 2020, 204, 104717. [Google Scholar] [CrossRef]
  13. Barbieri, P.; Pellerin, S.; Seufert, T.; Nesme, V. Changes in crop rotations would impact food production in an organically farmed world. Nat. Sustain. 2019, 2, 378–385. [Google Scholar] [CrossRef]
  14. Li, J.; Ramires, G.H.; Kiani, M.; Quideau, S.; Smith, E.; Janzen, H.; Larney, F.; Puurveen, D. Soil organic matter dynamics in long-term temperate agroecosystems: Rotation and nutrient addition effects. Can. J. Soil Sci. 2018, 98, 232–245. [Google Scholar] [CrossRef] [Green Version]
  15. Yang, T.; Siddique, K.H.M.; Liu, K. Cropping systems in agriculture and their impact on soil health—A review. Glob. Ecol. Conserv. 2020, 23, e01118. [Google Scholar] [CrossRef]
  16. West, T.O.; Post, W.M. Soil organic carbon sequestration rates by tillage and crop rotation: A global data analysis. Soil Sci. Soc. Am. J. 2002, 66, 1930–1946. [Google Scholar] [CrossRef] [Green Version]
  17. Lavallee, J.M.; Soong, J.L.; Cotrufo, M.F. Conceptualizing soil organic matter into particulate and mineral-associated forms to address global change in the 21st century. Glob. Chang. Biol. 2020, 26, 261–273. [Google Scholar] [CrossRef] [Green Version]
  18. Simpson, M.J.; Simpson, A.J. The chemical ecology of soil organic matter molecular constituents. J. Chem. Ecol. 2012, 38, 768–784. [Google Scholar] [CrossRef]
  19. Deb, S.; Bhadoria, P.B.S.; Mandal, B.; Rakshit, A.; Singh, H.B. Soil organic carbon: Towards better soil health, productivity and climate change mitigation. Clim. Chang. Environ. Sust. 2015, 3, 26–34. [Google Scholar] [CrossRef]
  20. Cotrufo, M.F.; Ranalli, M.G.; Haddix, M.L.; Six, J.; Lugato, E. Soil carbon storage informed by particulate and mineral-associated organic matter. Nat. Geosci. 2019, 12, 989–994. [Google Scholar] [CrossRef]
  21. Cambardella, C.A.; Elliott, E.T. Carbon and nitrogen dynamics of soil organic matter fractions from cultivated grassland soils. Soil Sci. Soc. Am. J. 1994, 58, 123–130. [Google Scholar] [CrossRef]
  22. Haddix, M.L.; Gregorich, E.G.; Helgason, B.L.; Janzen, H.; Ellert, B.H.; Cotrufo, M.F. Climate, carbon content, and soil texture control the independent formation and persistence of particulate and mineral-associated organic matter in soil. Geoderma 2020, 363, 114160. [Google Scholar] [CrossRef]
  23. Nandan, R.; Singh, V.; Singh, S.S.; Kumar, V.; Hazra, K.K.; Nath, C.P.; Poonia, S.; Malik, R.K.; Bhattacharyya, R.; McDonald, A. Impact of conservation tillage in rice-based cropping systems on soil aggregation, carbon pools and nutrients. Geoderma 2019, 340, 104–114. [Google Scholar] [CrossRef]
  24. Christensen, B.T. Physical fractionation of soil and structural and functional complexity in organic matter turnover. Eur. J. Soil Sci. 2001, 52, 345–353. [Google Scholar] [CrossRef]
  25. Cotrufo, M.F.; Wallenstein, M.D.; Boot, C.M. The Microbial Efficiency-Matrix Stabilization (MEMS) framework integrates plant litter decomposition with soil organic matter stabilization: Do labile plant inputs form stable soil organic matter? Glob. Chang. Biol. 2013, 19, 988–995. [Google Scholar] [CrossRef] [Green Version]
  26. Kleber, M.; Eusterhues, K.; Keiluweit, M.; Mikutta, C.; Mikutta, R.; Nico, P.S. Mineral-organic associations: Formation, properties, and relevance in soil environments. Adv. Agron. 2015, 130, 1–140. [Google Scholar]
  27. Benbi, D.K.; Boparai, A.K.; Brar, K. Decomposition of particulate organic matter is more sensitive to temperature than the mineral associated organic matter. Soil Biol. Biochem. 2014, 70, 183–192. [Google Scholar] [CrossRef]
  28. Baldock, J.A.; Skjemstad, J.O. Role of the soil matrix and minerals in protecting natural organic materials against biological attack. Org. Geochem. 2000, 31, 697–710. [Google Scholar] [CrossRef]
  29. Chenu, C.; Angers, D.A.; Barré, P.; Derrien, D.; Arrouays, D.; Balesdent, J. Increasing organic stocks in agricultural soils: Knowledge gaps and potential innovations. Soil Till. Res. 2019, 188, 41–52. [Google Scholar] [CrossRef]
  30. Sequeira, C.H.; Alley, M.M.; Jones, B.P. Evaluation of potentially labile soil organic carbon and nitrogen fractionation procedures. Soil Biol. Biochem. 2011, 43, 438–444. [Google Scholar] [CrossRef]
  31. Bu, R.; Lu, J.; Ren, T.; Liu, B.; Li, X.; Cong, R. Particulate organic matter affects soil nitrogen mineralization under two crop rotation systems. PLoS ONE 2015, 10, 1–17. [Google Scholar] [CrossRef]
  32. Tian, J.; Lou, Y.; Gao, Y.; Fang, H.; Liu, S.; Xu, M.; Blagodatskaya, E.; Kuzyakov, Y. Response of soil organic matter fractions and composition of microbial community to long-term organic and mineral fertilization. Biol. Fertil. Soils 2017, 53, 523–532. [Google Scholar] [CrossRef]
  33. Malhi, S.S.; Harapiak, J.T.; Nyborg, M.; Gill, K.S.; Monreal, C.M.; Gregorich, E.G. Total and light fraction organic C in a thin Black Chernozemic grassland soil as affected by 27 annual applications of six rates of fertilizer N. Nutr. Cycl. Agroecosyst. 2003, 66, 33–41. [Google Scholar] [CrossRef]
  34. Abdelrahman, H.; Cocozza, C.; Olk, D.C.; Ventrella, D.; Montemurro, F.; Miano, T. Changes in labile fractions of soil organic matter during the conversion to organic farming. J. Soil Sci. Plant Nutr. 2020, 20, 1019–1028. [Google Scholar] [CrossRef]
  35. Poffenbarger, H.J.; Olk, D.C.; Cambardella, C.; Kersey, J.; Liebman, M.; Mallarino, A.; Six, J.; Castellano, M.J. Whole-profile soil organic matter content, composition, and stability under cropping systems that differ in belowground inputs. Agric. Ecosyst. Environ. 2020, 291, 106810. [Google Scholar] [CrossRef] [Green Version]
  36. Marriott, E.E.; Wander, M.M. Total and labile soil organic matter in organic and conventional farming systems. Soil Sci. Soc. Am. J. 2006, 70, 950–959. [Google Scholar] [CrossRef] [Green Version]
  37. Ladoni, M.; Basir, A.; Robertson, P.G.; Kravchenko, A.N. Scaling-up: Cover crops differentially influence soil carbon in agricultural fields with diverse topography. Agric. Ecosyst. Environ. 2016, 225, 93–103. [Google Scholar] [CrossRef] [Green Version]
  38. Duval, M.E.; Galantini, J.A.; Capurro, J.E.; Martinez, J.M. Winter cover crops in soybean monoculture: Effects on soil organic carbon and its fractions. Soil Till. Res. 2016, 161, 95–105. [Google Scholar] [CrossRef]
  39. Alaru, M.; Talgre, L.; Eremeev, V.; Tein, B.; Luik, A.; Nemvalts, A.; Loit, E. Crop yields and supply of nitrogen compared in conventional and organic farming systems. Agri. Food Sci. 2014, 23, 317–326. [Google Scholar] [CrossRef]
  40. Kauer, K.; Tein, B.; Sanchez de Cima, D.; Talgre, L.; Eremeev, V.; Loit, E.; Luik, A. Soil carbon dynamics estimation and dependence on farming system in a temperate climate. Soil Till. Res. 2015, 154, 53–63. [Google Scholar] [CrossRef]
  41. FAO. World Reference Base for Soil Resources 2006, World Soil Resource Report 103, 2nd ed.; Food and Agriculture Organization: Rome, Italy, 2006. [Google Scholar]
  42. Reintam, E.; Köster, T. The role of chemical indicators to correlate some Estonian soils with WRB and soil taxonomy criteria. Geoderma 2006, 136, 199–209. [Google Scholar] [CrossRef]
  43. Bolinder, M.; Janzen, H.H.; Gregorich, E.G.; Angers, D.; Vanden Bygaart, J. An approach for estimating net primary productivity and annual carbon inputs to soil for common agricultural crops in Canada. Agric. Ecosyst. Environ. 2007, 118, 29–42. [Google Scholar] [CrossRef]
  44. Bolinder, M.A.; Kätterer, T.; Andrén, O.; Parent, L.E. Estimating carbon inputs to soil in forage-based crop rotations and modeling the effects on soil carbon dynamics in a Swedish long-term field experiment. Can. J. Soil Sci. 2012, 92, 821–833. [Google Scholar] [CrossRef]
  45. Talgre, L.; Lauringson, E.; Makke, A.; Lauk, R. Biomass production and nitrogen binding of catch crop. Žemdirbyste 2011, 98, 251–258. [Google Scholar]
  46. Adams, W.A. The effect of organic matter on the bulk and true densities of some uncultivated podzolic soils. J. Soil Sci. 1973, 10, 10–17. [Google Scholar] [CrossRef]
  47. Mann, L.K. Changes in soil carbon storage after cultivation. Soil Sci. 1986, 142, 279–288. [Google Scholar] [CrossRef]
  48. Kasprzhitskii, A.; Lazorenko, G.; Khater, A.; Yavna, V. Mid-infrared spectroscopic assessment of plasticity characteristics of clay soils. Minerals 2018, 8, 184. [Google Scholar] [CrossRef] [Green Version]
  49. Gerzabek, M.H.; Antil, R.S.; Kögel-Knabner, I.; Knicker, H.; Kirchmann, H.; Haberhauer, G. How are soil use and management reflected by soil organic matter characteristics: A spectroscopic approach. Eur. J. Soil Sci. 2006, 57, 485–494. [Google Scholar] [CrossRef] [Green Version]
  50. Margenot, A.J.; Calderón, F.J.; Goyne, K.W.; Mukome, F.N.D.; Parikh, S.J. IR Spectroscopy, Soil Analysis Applications. In Encyclopedia of Spectroscopy and Spectrometry, 3rd ed.; Academic Press: Oxford, UK, 2017; pp. 448–454. [Google Scholar]
  51. Haberhauer, G.; Gerzabek, M.H. Drift and transmission FT-IR spectroscopy of forest soils: An approach to determine decomposition processes of forest litter. Vib. Spectrosc. 1999, 19, 413–417. [Google Scholar] [CrossRef]
  52. Ellerbrock, R.H.; Gerke, H.H.; Bachmann, J.; Goebel, M.-O. Composition of organic matter fractions for explaining wettability of three forest soils. Soil Sci. Soc. Am. J. 2005, 69, 57–66. [Google Scholar] [CrossRef]
  53. Janik, L.J.; Skjemstad, J.O.; Shepherd, K.D.; Spouncer, L.R. The prediction of soil carbon fractions using mid-infrared-partial least square analysis. Aust. J. Soil Res. 2007, 45, 73–81. [Google Scholar] [CrossRef] [Green Version]
  54. Egli, M.; Mavris, C.; Mirabella, A.; Giaccai, D. Soil organic matter formation along a chronosequence in the Morteratsch proglacial area (Upper Engadine, Switzerland). Catena 2010, 82, 61–69. [Google Scholar] [CrossRef] [Green Version]
  55. Lehmann, J.; Solomon, D. Organic Carbon Chemistry in Soils Observed by Synchrotron-Based Spectroscopy. In Developments in Soil Science; Singh, B., Gräfe, M., Eds.; Elsevier: London, UK, 2010; Volume 34, pp. 289–312. [Google Scholar]
  56. Baumann, K.; Schöning, I.; Schrumpf, M.; Ellerbrock, R.H.; Leinweber, P. Rapid assessment of soil organic matter: Soil color analysis and Fourier transform infrared spectroscopy. Geoderma 2016, 278, 49–57. [Google Scholar] [CrossRef]
  57. Bartos, A.; Szymański, W.; Klimek, M. Impact of conventional agriculture on the concentration and quality of water-extractable organic matter (WEOM) in the surface horizons of Retisols—A case study from the Carpathian Foothills in Poland. Soil Till. Res. 2020, 204, 104750. [Google Scholar] [CrossRef]
  58. Calderón, F.J.; Reeves, J.B.; Collins, H.P.; Paul, E.A. Chemical differences in soil organic matter fractions determined by diffuse-reflectance mid-infrared spectroscopy. Soil Sci. Soc. Am. J. 2011, 75, 568–579. [Google Scholar] [CrossRef] [Green Version]
  59. Calderón, F.J.; Mikha, M.M.; Vigil, M.F.; Nielsen, D.C.; Benjamin, J.G.; Reeves, J.B., III. Diffuse-reflectance mid-infrared spectral properties of soils under alternative crop rotations in a semi-arid climate. Commun. Soil Sci. Plant Anal. 2011, 42, 2143–2159. [Google Scholar] [CrossRef]
  60. Chefetz, B.; Hatcher, P.G.; Hadar, Y.; Chen, Y. Chemical and biological characterization of organic matter during composting of municipal solid waste. J. Environ. Qual. 1996, 25, 776–785. [Google Scholar] [CrossRef]
  61. Margenot, A.J.; Calderón, F.J.; Bowles, T.M.; Jackson, L.E. Soil organic matter functional group composition in relation to organic carbon, nitrogen, and phosphorus fractions in organically managed tomato fields. Soil Sci. Soc. Am. J. 2015, 79, 772–782. [Google Scholar] [CrossRef]
  62. Yeasmin, S.; Singh, B.; Smernik, R.J.; Johnston, C.T. Effect of land use on organic matter composition in density fractions of contrasting soils: A comparative study using 13C NMR and DRIFT spectroscopy. Sci. Total Environ. 2020, 726, 138395. [Google Scholar] [CrossRef] [PubMed]
  63. R Core Team. R: A Language and Environment for Statistical Computing; R Foundation for Statistical Computing: Vienna, Austria, 2020; Available online: https://www.R-project.org/ (accessed on 1 September 2021).
  64. Wei, T.; Simko, V. R Package “Corrplot”: Visualization of a Correlation Matrix (Version 0.84). 2017. Available online: https://github.com/taiyun/corrplot (accessed on 1 September 2021).
  65. Kassambara, A.; Mundt, F. Factoextra: Extract and Visualize the Results of Multivariate Data Analyses. R Package Version 1.0.7. 2020. Available online: https://CRAN.R-project.org/package=factoextra (accessed on 1 September 2021).
  66. Lê, S.; Josse, J.; Husson, F. FactoMineR: An r package for multivariate analysis. J. Stat. Softw. 2008, 25, 1–18. [Google Scholar] [CrossRef] [Green Version]
  67. Wickham, H. ggplot2: Elegant Graphics for Data Analysis; Springer: New York, NY, USA, 2016. [Google Scholar]
  68. Khan, K.S.; Mack, R.; Castillo, X.; Kaiser, M.; Joergensen, R.G. Microbial biomass, fungal and bacterial residues, and their relationships to the soil organic matter C/N/P/S ratios. Geoderma 2016, 271, 115–123. [Google Scholar] [CrossRef]
  69. Moeskops, B.; Buchan, D.; Van Beneden, S.; Fievez, V.; Sleutel, S.; Gasper, M.S.; D’Hose, T.; De Neve, S. The impact of exogenous organic matter on SOM contents and microbial soil quality. Pedobiologia 2012, 55, 175–184. [Google Scholar] [CrossRef]
  70. Poeplau, C.; Reiter, L.; Berti, A.; Kätterer, T. Qualitative and quantitative response of soil organic carbon to 40 years of crop residue incorporation under contrasting nitrogen fertilisation regimes. Soil Res. 2017, 55, 1–9. [Google Scholar] [CrossRef] [Green Version]
  71. Surey, R.; Lippold, E.; Heilek, S.; Sauheitl, L.; Henjes, S.; Horn, M.A.; Mueller, C.W.; Merbach, I.; Kaiser, K.; Böttcher, J.; et al. Differences in labile soil organic matter explain potential denitrification and denitrifying communities in a long-term fertilization experiment. Appl. Soil Ecol. 2020, 153, 103630. [Google Scholar] [CrossRef]
  72. Kuht, J.; Eremeev, V.; Talgre, L.; Alaru, M.; Loit, E.; Mäeorg, E.; Esmaeilzadeh-Salestani, K.; Luik, A. Changes in the soil microbial hydrolytic activity and the content of organic carbon and total nitrogen by growing spring barley undersown with red clover in different farming systems. Agric. Switz. 2019, 9, 146. [Google Scholar] [CrossRef] [Green Version]
  73. Eremeev, V.; Talgre, L.; Kuht, J.; Mäeorg, E.; Esmaeilzadeh-Salestani, K.; Alaru, M.; Loit, E.; Runno-Paurson, E.; Luik, A. The soil microbial hydrolytic activity, content of nitrogen and organic carbon were enhanced by organic farming management using cover crops and composts in potato cultivation. Acta Agric. Scand. B Soil Plant Sci. 2020, 70, 87–94. [Google Scholar] [CrossRef]
  74. Esmaeilzadeh-Salestani, K.; Bahram, M.; Seraj, R.G.M.; Gohar, D.; Tohidfar, M.; Eremeev, V.; Talgre, L.; Khaleghdoust, B.; Mirmajlessi, S.M.; Luik, A.; et al. Cropping systems with higher organic carbon promote soil microbial diversity. Agric. Ecosyst. Environ. 2021, 391, 107521. [Google Scholar] [CrossRef]
  75. Brennan, E.B.; Acosta-Martinez, V. Cover cropping frequency is the main driver of soil microbial changes during six years of organic vegetable production. Soil Biol. Biochem. 2017, 109, 188–204. [Google Scholar] [CrossRef]
  76. Prater, I.; Zubrzycki, S.; Buegger, F.; Zoor-Füllgraff, L.C.; Angst, G.; Dannenmann, M.; Mueller, C.W. From fibrous plant residues to mineral-associated organic carbon—The fate of organic matter in Arctic permafrost soils. Biogeosciences 2020, 17, 3367–3383. [Google Scholar] [CrossRef]
  77. Kauer, K.; Astover, A.; Viiralt, R.; Raave, H.; Kätterer, T. Evolution of soil organic carbon in a carbonaceous glacial till as an effect of crop and fertility management over 50 years in a field experiment. Agric. Ecosyst. Environ. 2019, 283, 106562. [Google Scholar] [CrossRef]
  78. White, K.E.; Brennan, E.B.; Cavigelli, M.A.; Smith, R.F. Winter cover crops increase readily decomposable soil carbon, but compost drives total soil carbon during eight years of intensive, organic vegetable production in California. PLoS ONE 2020, 15, 1–26. [Google Scholar] [CrossRef] [PubMed]
  79. Han, P.; Zhang, W.; Wang, G.; Sun, W.; Huang, Y. Changes in soil organic carbon in croplands subjected to fertilizer management: A global meta-analysis. Sci. Rep. 2016, 6, 1–13. [Google Scholar]
  80. Buyanovsky, G.A.; Wagner, G.H. Carbon cycling in cultivated land and its global significance. Glob. Chang. Biol. 1998, 4, 131–141. [Google Scholar] [CrossRef]
  81. Kong, A.Y.Y.; Six, J.; Bryant, D.C.; Denison, R.F.; van Kessel, C. The relationship between carbon input, aggregation, and soil organic carbon stabilization in sustainable cropping systems. Soil Sci. Soc. Am. J. 2005, 69, 1078–1085. [Google Scholar] [CrossRef]
  82. Autret, B.; Mary, B.; Chenu, C.; Balabane, M.; Girardin, C.; Bertrand, M.; Grandeau, G.; Beaudoin, N. Alternative arable cropping systems: A key to increase soil organic carbon storage? Results from a 16 year field experiment. Agric. Ecosyst. Environ. 2016, 232, 150–164. [Google Scholar] [CrossRef]
  83. Nichols, J.D. Relation of organic carbon to soil properties and climate in the southern Great Plains. Soil Sci. Soc. Am. J. 1984, 48, 1382–1384. [Google Scholar] [CrossRef]
  84. Jagadamma, S.; Lal, R. Distribution of organic carbon in physical fractions of soils as affected by agricultural management. Biol. Fertil. Soils 2010, 46, 543–554. [Google Scholar] [CrossRef]
  85. Bol, R.; Poirier, N.; Balesdent, J.; Gleixner, G. Molecular turnover time of soil organic matter in particle-size fractions of an arable soil. Rapid Commun. Mass Spectrom. 2009, 23, 2551–2558. [Google Scholar] [CrossRef]
  86. Flessa, H.; Amelung, W.; Helfrich, M.; Wiesenberg, G.L.B.; Gleixner, G.; Brodowski, S.; Rethemeyer, J.; Kramer, C.; Grootes, P.M. Storage and stability of organic matter and fossil carbon in a Luvisol and Phaeozem with continuous maize cropping: A synthesis. J. Plant. Nutr. Soil Sci. 2008, 171, 36–51. [Google Scholar] [CrossRef] [Green Version]
  87. Guo, Z.; Zhang, Z.; Zhou, H.; Wang, D.; Peng, X. The effect of 34-year continuous fertilization on the SOC physical fractions and its chemical composition in a Vertisol. Sci. Rep. 2019, 9, 1–10. [Google Scholar] [CrossRef] [Green Version]
  88. Liang, C.H.; Yin, Y.; Chen, Q. Dynamics of soil organic carbon fractions and aggregates in vegetable cropping systems. Pedosphere 2014, 24, 605–612. [Google Scholar] [CrossRef]
  89. Cavalcante, J.S.; Favaretto, N.; Dieckow, J.; Cherobim, V.F.; Barth, G. Long-term surface application of dairy liquid manure to soil under no-till improves carbon and nitrogen stocks. Eur. J. Soil Sci. 2019, 71, 1132–1143. [Google Scholar] [CrossRef]
  90. Wen, Y.; Wen, J.; Wang, Q.; Bai, L.; Wang, Y.; Su, S.; Wu, C.; Zeng, X. Organic carbon preservation promoted by aromatic compound-iron complexes through manure fertilization in red soil. J. Soils Sediments 2021, 21, 664. [Google Scholar] [CrossRef]
  91. Paustian, K.; Parton, J.W.; Persson, J. Modelling soil organic matter in organic-amended and nitrogen-fertilized long-term plots. Soil Sci. Soc. Am. J. 1992, 56, 476–488. [Google Scholar] [CrossRef]
  92. Blair, N.; Faulkner, D.R.; Till, R.A.; Poulton, R.P. Long-term management impacts on soil C, N and physical fertility: Part I: Broadbalk experiment. Soil Till. Res. 2006, 191, 30–38. [Google Scholar] [CrossRef]
  93. Castellano, M.J.; Kaye, J.P.; Lin, H.; Schmidt, J.P. Linking carbon saturation concepts to nitrogen saturation and retention. Ecosystems 2012, 15, 175–187. [Google Scholar] [CrossRef]
  94. Stewart, C.E.; Paustian, K.; Conant, R.T.; Plante, A.F.; Six, J. Soil carbon saturation: Concept, evidence and evaluation. Biogeochemistry 2007, 86, 19–31. [Google Scholar] [CrossRef]
  95. Geng, J.; Cheng, S.; Fang, H.; Pei, J.; Xu, M.; Lu, M.; Yand, Y.; Cao, X.; Li, Y. Different molecular characterization of soil particulate fractions under N deposition in a subtropical forest. Forests 2019, 10, 914. [Google Scholar] [CrossRef] [Green Version]
  96. Connin, S.L.; Feng, X.; Virginia, R.A. Isotopic discrimination during long-term decomposition in an arid land ecosystem. Soil Biol. Biochem. 2001, 33, 41–51. [Google Scholar]
  97. Vitousek, P.M.; Hättenschwiler, S.; Olander, L.; Allison, S. Nitrogen and nature. Ambio 2002, 31, 97–101. [Google Scholar] [CrossRef]
  98. Angelini, J.; Silvina, G.; Taurian, T.; Ibáñez, F.; Tonelli, M.L.; Valetti, L.; Anzuay, M.S.; Ludueña, L.; Muñoz, V.; Fabra, A. The effects of pesticides on bacterial nitrogen fixers in peanut-growing area. Arch. Microbiol. 2013, 195, 683–692. [Google Scholar] [CrossRef] [PubMed]
  99. Meena, R.S.; Kumar, S.; Datta, R.; Lal, R.; Vijayakumar, V.; Brtnicky, M.; Sharma, M.P.; Yadav, G.S.; Jhariya, M.K.; Jangir, C.K.; et al. Impact of Agrochemicals on Soil Microbiota and Management: A Review. Land 2020, 9, 34. [Google Scholar] [CrossRef] [Green Version]
  100. Lucas, S.T.; D’Angelo, E.M.; Williams, M.A. Improving soil structure by promoting fungal abundance with organic soil amendments. Appl. Soil Ecol. 2014, 75, 13–23. [Google Scholar] [CrossRef]
  101. Fan, R.; Yang, X.; Drury, C.F.; Zhang, Z. Curve-ftting techniques improve the mid-infrared analysis of soil organic carbon: A case study for Brookston clay loam particle-size fractions. Sci. Rep. 2018, 8, 12174. [Google Scholar] [CrossRef]
  102. Artz, R.R.E.; Chapman, S.J.; Campbell, C.D. Substrate utilisation profiles of microbial communities in peat are depth dependent and correlate with whole soil FTIR profiles. Soil Biol. Biochem. 2006, 38, 2958–2962. [Google Scholar] [CrossRef]
  103. Nebbioso, A.; Piccolo, A. Molecular characterization of dissolved organic matter (DOM): A critical review. Anal. Bioanal. Chem. 2013, 405, 109–124. [Google Scholar] [CrossRef]
  104. Niemeyer, J.; Chen, Y.; Bollag, J.M. Characterization of humic acids, compost, and peat by diffuse reflectance Fourier-transform infrared-spectroscopy. Soil Sci. Soc. Am. J. 1992, 56, 135–140. [Google Scholar] [CrossRef]
  105. Wander, M.M.; Traina, S.J. Organic matter fractions from organically and conventionally managed soils: I. Carbon and nitrogen distribution. Soil Sci. Soc. Am. J. 1996, 60, 1081–1087. [Google Scholar] [CrossRef]
  106. Nkwain, F.N.; Demyan, M.S.; Rasche, F.; Dignac, M.F.; Schulz, E.; Kätterer, T.; Müller, T.; Cadisch, G. Coupling pyrolysis with mid-infrared spectroscopy (Py-MIRS) to fingerprint soil organic matter bulk chemistry. J. Anal. Appl. Pyrolysis 2018, 133, 176–184. [Google Scholar] [CrossRef]
  107. Sokol, N.W.; Sanderman, J.; Bradford, M.A. Pathways of mineral-associated soil organic matter formation: Integrating the role of plant carbon source, chemistry, and point of entry. Glob. Chang. Biol. 2018, 25, 12–24. [Google Scholar] [CrossRef] [PubMed] [Green Version]
  108. Ding, G.; Novak, J.M.; Amarasiriwardena, D.; Hunt, P.G.; Xing, B. Soil organic matter as affected by tillage management. Soil Sci. Soc. Am. J. 2002, 66, 421–429. [Google Scholar] [CrossRef]
  109. Veum, K.; Goyne, K.; Kremer, R.; Miles, R.; Sudduth, K. Biological indicators of soil quality and soil organic matter characteristics in an agricultural management continuum. Biogeochemistry 2014, 117, 81–99. [Google Scholar] [CrossRef]
  110. Spaccini, R.; Piccolo, A. Molecular characteristics of humic acids extracted from compost at increasing maturity stages. Soil Biol. Biochem. 2009, 41, 1164–1172. [Google Scholar] [CrossRef]
  111. Solomon, D.; Lehmann, J.; Zech, W. Land use effects on soil organic matter properties of chromic Luvisols in semi-arid northern Tanzania: Carbon, nitrogen, lignin and carbohydrates. Agric. Ecosyst. Environ. 2000, 78, 203–213. [Google Scholar] [CrossRef]
  112. Poirier, N.; Sohi, S.P.; Gaunt, J.L.; Mahieu, N.; Randall, E.W.; Powlson, D.S.; Evershed, R.P. The chemical composition of measurable soil organic matter pools. Org. Geochem. 2005, 36, 1174–1189. [Google Scholar] [CrossRef]
  113. Wang, Q.; Huang, Q.; Zhang, L.; Zhang, J.; Shen, Q.; Ran, W. The effects of compost in a rice-wheat cropping system on aggregate size, carbon and nitrogen content of the size-density fraction and chemical composition of soil organic matter, as shown by 13C CP NMR spectroscopy. Soil Use Manag. 2012, 28, 337–346. [Google Scholar] [CrossRef]
  114. Helfrich, M.; Ludwig, B.; Buurman, P.; Flessa, H. Effect of land use on the composition of soil organic matter in density and aggregate fractions as revealed by solidstate 13C NMR spectroscopy. Geoderma 2006, 136, 331–341. [Google Scholar] [CrossRef]
  115. Grandy, A.S.; Neff, J.C. Molecular C dynamics downstream: The biochemical decomposition sequence and its impact on soil organic matter structure and function. Sci. Total Environ. 2008, 404, 297–307. [Google Scholar] [CrossRef]
  116. Kögel-Knabner, I.; Hatcher, P.G.; Tegelaar, E.W.; de Leeuw, J.W. Aliphatic components of forest soil organic matter as determined by solid-state 13C NMR and analytical pyrolysis. Sci. Total Environ. 1992, 113, 89–106. [Google Scholar] [CrossRef]
  117. Clemente, J.S.; Gregorich, E.G.; Simpson, A.J.; Kumar, R.; Courtier-Murias, D.; Simpson, M.J. Comparison of nuclear magnetic resonance methods for the analysis of organic matter composition from soil density and particle fractions. Environ. Chem. 2012, 9, 97–107. [Google Scholar] [CrossRef]
  118. Song, X.Y.; Spaccini, R.; Pan, G.; Piccolo, A. Stabilization by hydrophobic protection as a molecular mechanism for organic carbon sequestration in maize-amended rice paddy soils. Sci. Tot. Environ. 2013, 458–460, 319–330. [Google Scholar] [CrossRef] [PubMed]
  119. Pisani, O.; Hills, K.M.; Courtier-Murias, D.; Haddix, M.L.; Paul, E.A.; Conant, R.T.; Arhonditsis, G.B.; Simpson, M.J. Accumulation of aliphatic compounds in soil with increasing mean annual temperature. Org. Geochem. 2014, 76, 118–127. [Google Scholar] [CrossRef]
  120. Ding, G.; Liu, X.; Herbert, S.; Novak, J.; Amarasiriwardena, D.; Xing, B. Effect of cover crop management on soil organic matter. Geoderma 2006, 130, 229–239. [Google Scholar] [CrossRef]
  121. Mao, J.; Olk, D.C.; Fang, X.; He, Z.; Schmidt-Rohr, K. Influence of animal manure application on the chemical structures of soil organic matter as investigated by advanced solid-state NMR and FT-IR spectroscopy. Geoderma 2008, 146, 353–362. [Google Scholar] [CrossRef]
Figure 1. Soil organic carbon (SOC) (A) and nitrogen (N) (B) stocks and proportions depending on treatments. Different lowercase letters above the columns indicate a statistically significant (p < 0.05) difference between treatments within the POM or MAOM fraction.
Agriculture 11 00903 g001
Figure 2. Correlation matrices of bulk soil and fractions POM and MAOM. Blue ellipses indicate a positive correlation and red a negative correlation. The narrower the ellipse and the more intense its color, the stronger the correlation. The direction of the ellipse depends on the color.
Agriculture 11 00903 g002
Figure 3. Sample FTIR spectra of the bulk soil and particulate organic matter (POM) and mineral-associated organic matter (MAOM) fractions of the C-control and O-CC-M treatments.
Agriculture 11 00903 g003
Figure 4. Correlation matrices for (A) bulk soil, (B) POM, and (C) MAOM. Blue ellipses indicate a positive correlation and red a negative correlation. The narrower the ellipse and the more intense its color, the stronger the correlation. The direction of the ellipse depends on the color.
Agriculture 11 00903 g004
Figure 5. Principal component analysis (PCA) biplot of relative absorbances, C/N ratio, C and N concentrations, recalcitrance (Recalc), and aromaticity (Ar) of MAOM and POM fractions.
Agriculture 11 00903 g005
Figure 6. Relationships between soil organic carbon (SOC) and recalcitrance of particulate organic matter (POM) and mineral-associated organic matter (MAOM).
Agriculture 11 00903 g006
Figure 7. Principal component analysis (PCA) biplot of relative absorbances (rA) and other indices (C/N ratio, C and N concentrations, recalcitrance (Recalc), and aromaticity (Ar) of the bulk soil and fractions depending on treatment ((A) bulk soil, (B) POM and (C) MAOM) or farming system ((D) bulk soil, (E) POM, and (F) MAOM.
Agriculture 11 00903 g007
Table 1. The treatments in the organic and conventional farming systems.
CropConventional SystemsOrganic Systems
C-ControlC-fertN1C-fertN2C-fertN3O-ControlO-CCO-CC-M
Mineral fertilizers + plant protection 1 Winter cover cropWinter cover crop + manure 2
Winter wheat0 kg N ha−1
0 kg P ha−1
0 kg K ha−1
50 kg N ha−1
25 kg P ha−1
95 kg K ha−1
100 kg N ha−1
25 kg P ha−1
95 kg K ha−1
150 kg N ha−1
25 kg P ha−1
95 kg K ha−1
Winter oilseed turnip + winter rye10 t ha−1
44–54 kg N ha–1
8–16 kg P ha–1
17–34 kg K ha–1
Seed treatment: Baytan Universal 3 l t−1, since 2017 Lamrador 0.2 l t−1
Weed control: Secator OD 150 mL ha−1
Fungicide: Allegro Super 0.5 L ha−1 or Zantara 1.2 L ha−1
Pea0 kg N ha−1
0 kg P ha−1
0 kg K ha−1
20 kg N ha−1
25 kg P ha−1
95 kg K ha−1
20 kg N ha−1
25 kg P ha−1
95 kg K ha−1
20 kg N ha−1
25 kg P ha−1
95 kg K ha−1
Weed control: MCPA 750 1 l ha−1
Potato0 kg N ha−1
0 kg P ha−1
0 kg K ha−1
50 kg N ha−1
25 kg P ha−1
95 kg K ha−1
100 kg N ha−1
25 kg P ha−1
95 kg K ha−1
150 kg N ha−1
25 kg P ha−1
95 kg K ha−1
Winter rye20 t ha−1
88–108 kg N ha–1
16–32 kg P ha–1
34–86 kg K ha–1
Weed control: Titus 50 g ha−1
Insecticide: Decis Mega 50 EW 0.15 L ha−1 or
Fastac 50 0.3 L ha−1
Fungicide: Ridomil Gold 2.5 kg ha−1, since 2018 Ranman Top 0.2 L ha−1
Barley undersown with red clover0 kg N ha−1
0 kg P ha−1
0 kg K ha−1
40 kg N ha−1
25 kg P ha−1
95 kg K ha−1
80 kg N ha−1
25 kg P ha−1
95 kg K ha−1
120 kg N ha−1
25 kg P ha−1
95 kg K ha−1
10 t ha−1
44–54 kg N ha–1
8–16 kg P ha–1
17–43 kg K ha–1
Seed treatment: Baytan Universal 1.5 L t−1, since 2017 Bariton Ultra 0.5 L ha−1
Weed control: MCPA 750 1 L ha−1
Fungicide: Allegro Super 0.5 L ha−1
Red clover Red clover
1 Chemical plant protection was the same in all conventional systems; 2 application rate of manure and N, P, K amounts in manure were presented. As the content of dry matter and nutrients in the composted cattle manure were variable, the N, P, K amounts applied with manure also varied between years. In the first crop rotation period (2008–2012), fully composted cattle manure was added once during the crop cycle, before potato (40 t ha−1), N, P, K applied to the organic system in manure were N 165–179; P 75–90; K 130–145 kg ha–1.
Table 2. Relative annual plant carbon (C) allocation coefficients for the main crop (taken from Bolinder et al. [43,44]; Kauer et al. [40]).
CropRelative Annual Plant C Allocation Coefficients
RP 1RS 2RR 3RE 4
Barley0.4510.4000.0900.059
Wheat0.3220.4820.1180.078
Red clover0.5710.0000.2600.169
Potato0.7390.2360.0150.010
Pea0.2330.5770.1150.075
1 Relative C allocation to agricultural products; 2 relative C allocation to shoots; 3 relative C allocation to roots; 4 relative C allocation to exudate (65% of root biomass); RP + RS + RR + RE = 1.
Table 3. Soil organic carbon (SOC), total nitrogen (Ntot) concentrations and stocks, C/N ratio, and SOC sequestration rates depending on treatment.
ParameterYearTreatment 1
C-ControlC-fertN1C-fertN2C-fertN3O-ControlO-CCO-CC-M
SOC (g kg−1)200812.8 a2A314.2 bA14.4 bA14.3 bA 14.7 bA12.3 aA
201312.9 aA13.8 aA13.6 aA14.6 abA16.1 bcB16.2 bcB16.7 cB
201813.0 aA15.0 bcA14.2 abA13.9 abA14.7 bcA15.0 bcAB16.3 cB
SOC stock (Mg ha−1)200846.6 aA51.1 bA51.5 bA51.4 bA 52.6 bA44.9 aA
201347.0 aA49.8 abA49.2 abA52.4 bcA56.9 cdB57.1 cdAB58.6 dB
201847.2 aA53.4 bcA50.9 abA50.1 abA52.7bcA53.7 bcB57.5 cB
Ntot (g kg−1)20081.33 aB1.34 abA1.43 cC1.34 abB 1.46c B1.41 bcB
20131.14 aA1.30 bA1.28 abB1.27 abB1.36 bcB1.45 cB1.41 bcB
20181.06 abA1.19 abA1.07 abA1.02 aA1.14 abA1.15 abA1.20 bA
Ntot stock (Mg ha−1)20084.83 aC4.83 aC5.13 bC4.83 aC 5.24 bB5.17 bB
20134.15 aB4.68 bB4.63 bcB4.56 abB4.80 bcB5.12 cB4.95 bcB
20183.85 aA4.21 aA3.84 aA3.69 aA4.09 aA4.12 aA4.23 aA
C/N20089.7 bA10.6 cA10.0 bcA10.7 cA 10.0 bcA8.7 aA
201311.4 bcB10.7 abA10.6 aA11.5 cB11.9 c11.2 abcB11.8 cB
201812.3 aC13.0 abB13.4 bB13.6 bC 13.0 ab13.1 abC13.6 bC
SOC sequestration rate (Mg ha−1 y−1)2008−20130.08 abA−0.25 aA−0.47 aA0.20 abC 0.91 bB2.73 cC
2013−20180.04 abA0.71 bA0.34 abB−0.23 abA−0.84 a−0.70 aA−0.21 abA
2008−20180.06 aA0.23 aA−0.06 aAB−0.13 aAB 0.11 aAB1.26 bB
1 C-control and O-control were control treatments for conventional and organic farming systems, respectively; in systems C-fertN1, C-fertN2, and C-fertN3, the mineral fertilizers were applied with different N rates used depending on the crop; O-CC, treatment with winter cover crops in the organic system; O-CC-M, treatment with winter cover crops and manure; 2 different lowercase letters in the rows indicate statistically significant (p < 0.05) difference between treatments; 3 different capital letters within columns indicate significant (p < 0.05) difference between years.
Table 4. Carbon (C) inputs (Mg C ha−1 y−1) during 2008–2018 according to treatment.
C Input SourceDurationTreatment
C-ControlC-fertN1C-fertN2C-fertN3O-ControlO-CCO-CC-M
Main crop2008–20123.19 a 13.73 a3.41 a3.37 a3.00 a2.98 a2.90 a
2013–20172.93 a4.00 abc4.27 c4.15 bc3.00 a3.04 ab3.10 ab
2008–20173.06 ab3.87 c3.84 c3.76 bc3.00 a3.01 a3.00 a
Cover crop2008–201200000.450.560.56
2013–2017000000.800.90
2008–201700000.220.680.74
Manure2008–2012000000.16 20.49
2013–20170000000.50
2008–2017000000.820.50
Total (main crop + cover crop + manure)2008–20123.19 a3.73 a3.41 a3.37 a3.45 a3.58 a3.96 a
2013–20172.93 a4.00 ab4.27 b4.15 b3.00 a3.85 ab4.50 b
2008–20173.06 a3.87 bc3.84 bc3.76 abc3.22 ab3.78 abc4.23 c
1 Different lowercase letters in the rows indicate a statistically significant (p < 0.05) difference between treatments; 2 a third of the plot area received manure at a level of 0.16 Mg C ha−1 y−1.
Table 5. Regression equations between SOC stock and year (x).
TreatmentEquationRp
C-control−79.773 + 0.063x0.0470.490
C-fertN1−879.326 + 0.461x0.2380.0004
C-fertN2−449.308 + 0.248x0.1250.065
C-fertN3219.848 − 0.084x–0.0500.461
O-control 11205.811 − 0.572x–0.2560.002
O-CC−193.997 + 0.123x0.0680.317
O-CC-M−1582.936 + 0.813x0.4140.0000
1 2012−2018.
Table 6. Soil particulate organic matter (POM) and mineral-associated organic matter (MAOM) proportions, organic carbon fractions (POM-C and MAOM-C), total nitrogen concentrations (POM-N and MAON-N), and C/N ratios depending on the treatments.
TreatmentPOM Proportion (%)MAOM Proportion (%)POM-C
(g kg−1)
MAOM-C
(g kg−1)
POM-N
(g kg−1)
MAOM-N
(g kg−1)
POM-C/NMAOM-C/N
C-control58.0 a 142.0 d4.74 a22.6 a0.38 a2.28 a12.5 bc9.9 ab
C-fertN162.4 bc37.6 bc7.22 bc24.3 ab0.57 b2.46 bc12.7 bc9.9 ab
C-fertN260.1 ab39.9 cd5.65 ab24.7 bc0.44 ab2.42 ab13.1 c10.2 bc
C-fertN363.5 bc36.5 bc6.40 ab25.4 bcd0.54 b2.50 bc12.0 ab10.2 c
O-control63.5 bc36.5 bc8.66 cd25.6 bcd0.78 c2.62 cd11.1 a9.8 a
O-CC68.6 d31.4 a9.23 d27.1 cd0.83 c2.75 d11.2 a9.8 a
O-CC-M64.4 c35.6 b9.24 d26.6 d0.78 c2.72 d11.8 ab9.8 a
1 Different lowercase letters in the columns indicate a statistically significant (p < 0.05) difference between treatments.
Table 7. ANOVA results for soil organic carbon (SOC), total nitrogen (Ntot), C/N ratio, and relative absorbances (rA) of functional groups at different wavelengths.
F-Statistic for Factor
Fraction 1TreatmentsFraction × Treatment
SOC2624.18 ***52.35 ***2.05 *
Ntot3845.91 ***70.59 ***2.04 *
C/N271.70 ***11.60 ***5.70 **
rA1004774.00 ***22.00 ***12.00 ***
rA1409380.51 ***22.64 ***9.233 ***
rA1635806.56 ***26.72 ***13.34 ***
rA2925 + 285641.78 ***2.05711.718 ***
rA3401616.42 ***9.44 ***14.82 ***
Ar 244.44 ***10.71 ***8.260 ***
Recalc 3718.89 ***22.85 ***10.87 ***
1 fraction: bulk soil, particulate soil organic matter and mineral-associated organic matter. *, p < 0.05; **, p < 0.01; ***, p < 0.001; 2 aromaticity (Ar = 1635/(2925 + 2856 + 1409)); 3 recalcitrance (Recalc = (2925 + 2856 + 1635 + 1409)/(3401 + 1004)).
Table 8. Relative absorbances (rA) in the percentage of the sum of all selected peak heights of the FTIR spectra, aromaticity (Ar), and recalcitrance (Recalc) of bulk soil, particulate organic matter (POM), and mineral-associated organic matter (MAOM) of different treatments.
TreatmentrA1004rA1409rA1635rA2925 + 2856rA3401ArRecalc
Bulk soil
C-control96.1 c 10.56 ab2.67 a0.15 b0.54 a3.94 a0.035 a
C-fertN395.8 ab0.50 a2.97 b0.05 a0.58 ab5.59 c0.036 ab
O-control95.7 abc0.60 bc2.98 b0.03 a0.68 bc4.83 b0.037 ab
O-CC95.6 bc0.60 bc3.15 b0.04 a0.64 c5.21 bc0.039 b
O-CC-M95.4 c0.67 c3.18 b0.00 a0.71 c4.89 b0.040 b
POM
C-control98.6 c0.04 a1.07 a0.00 a0.28 a18.06 ab0.011 a
C-fertN397.5 b0.09 a1.91 b0.06 ab0.42 ab25.41 b0.021 b
O-control96.7 a0.31 bc2.34 c0.07 b0.61 cd7.10 a0.028 c
O-CC96.8 a0.35 c2.15 bc0.04 ab0.65 d7.21 a0.026 c
O-CC-M97.1 ab0.23 b2.15 bc0.06 ab0.48 bc10.42 a0.025 bc
MAOM
C-control94.4 a0.53 a3.83 a0.09 a1.15 a6.46 b0.047 a
C-fertN394.3 a0.55 a3.94 a0.11 ab1.13 a6.60 b0.048 a
O-control94.5 a0.51 a3.86 a0.08 a1.06 ab7.19 b0.046 a
O-CC94.4 a0.58 ab3.83 a0.21 c0.99 a4.92 a0.048 a
O-CC-M94.4 a0.65 b3.69 a0.19 bc1.09 ab4.48 a0.047 a
1 Different lowercase letters in the columns indicate a statistically significant (p < 0.05) difference between treatments within bulk soil or fractions.
Publisher’s Note: MDPI stays neutral with regard to jurisdictional claims in published maps and institutional affiliations.

