
Elemental Composition of Infusions of Herbs (Tisanes) of North Ossetia (the Caucasus)


 , ,
, ,  ,
,  ,
,
Abstract
:1. Introduction
2. Experimental
2.1. Study Area and Sampling
Materials
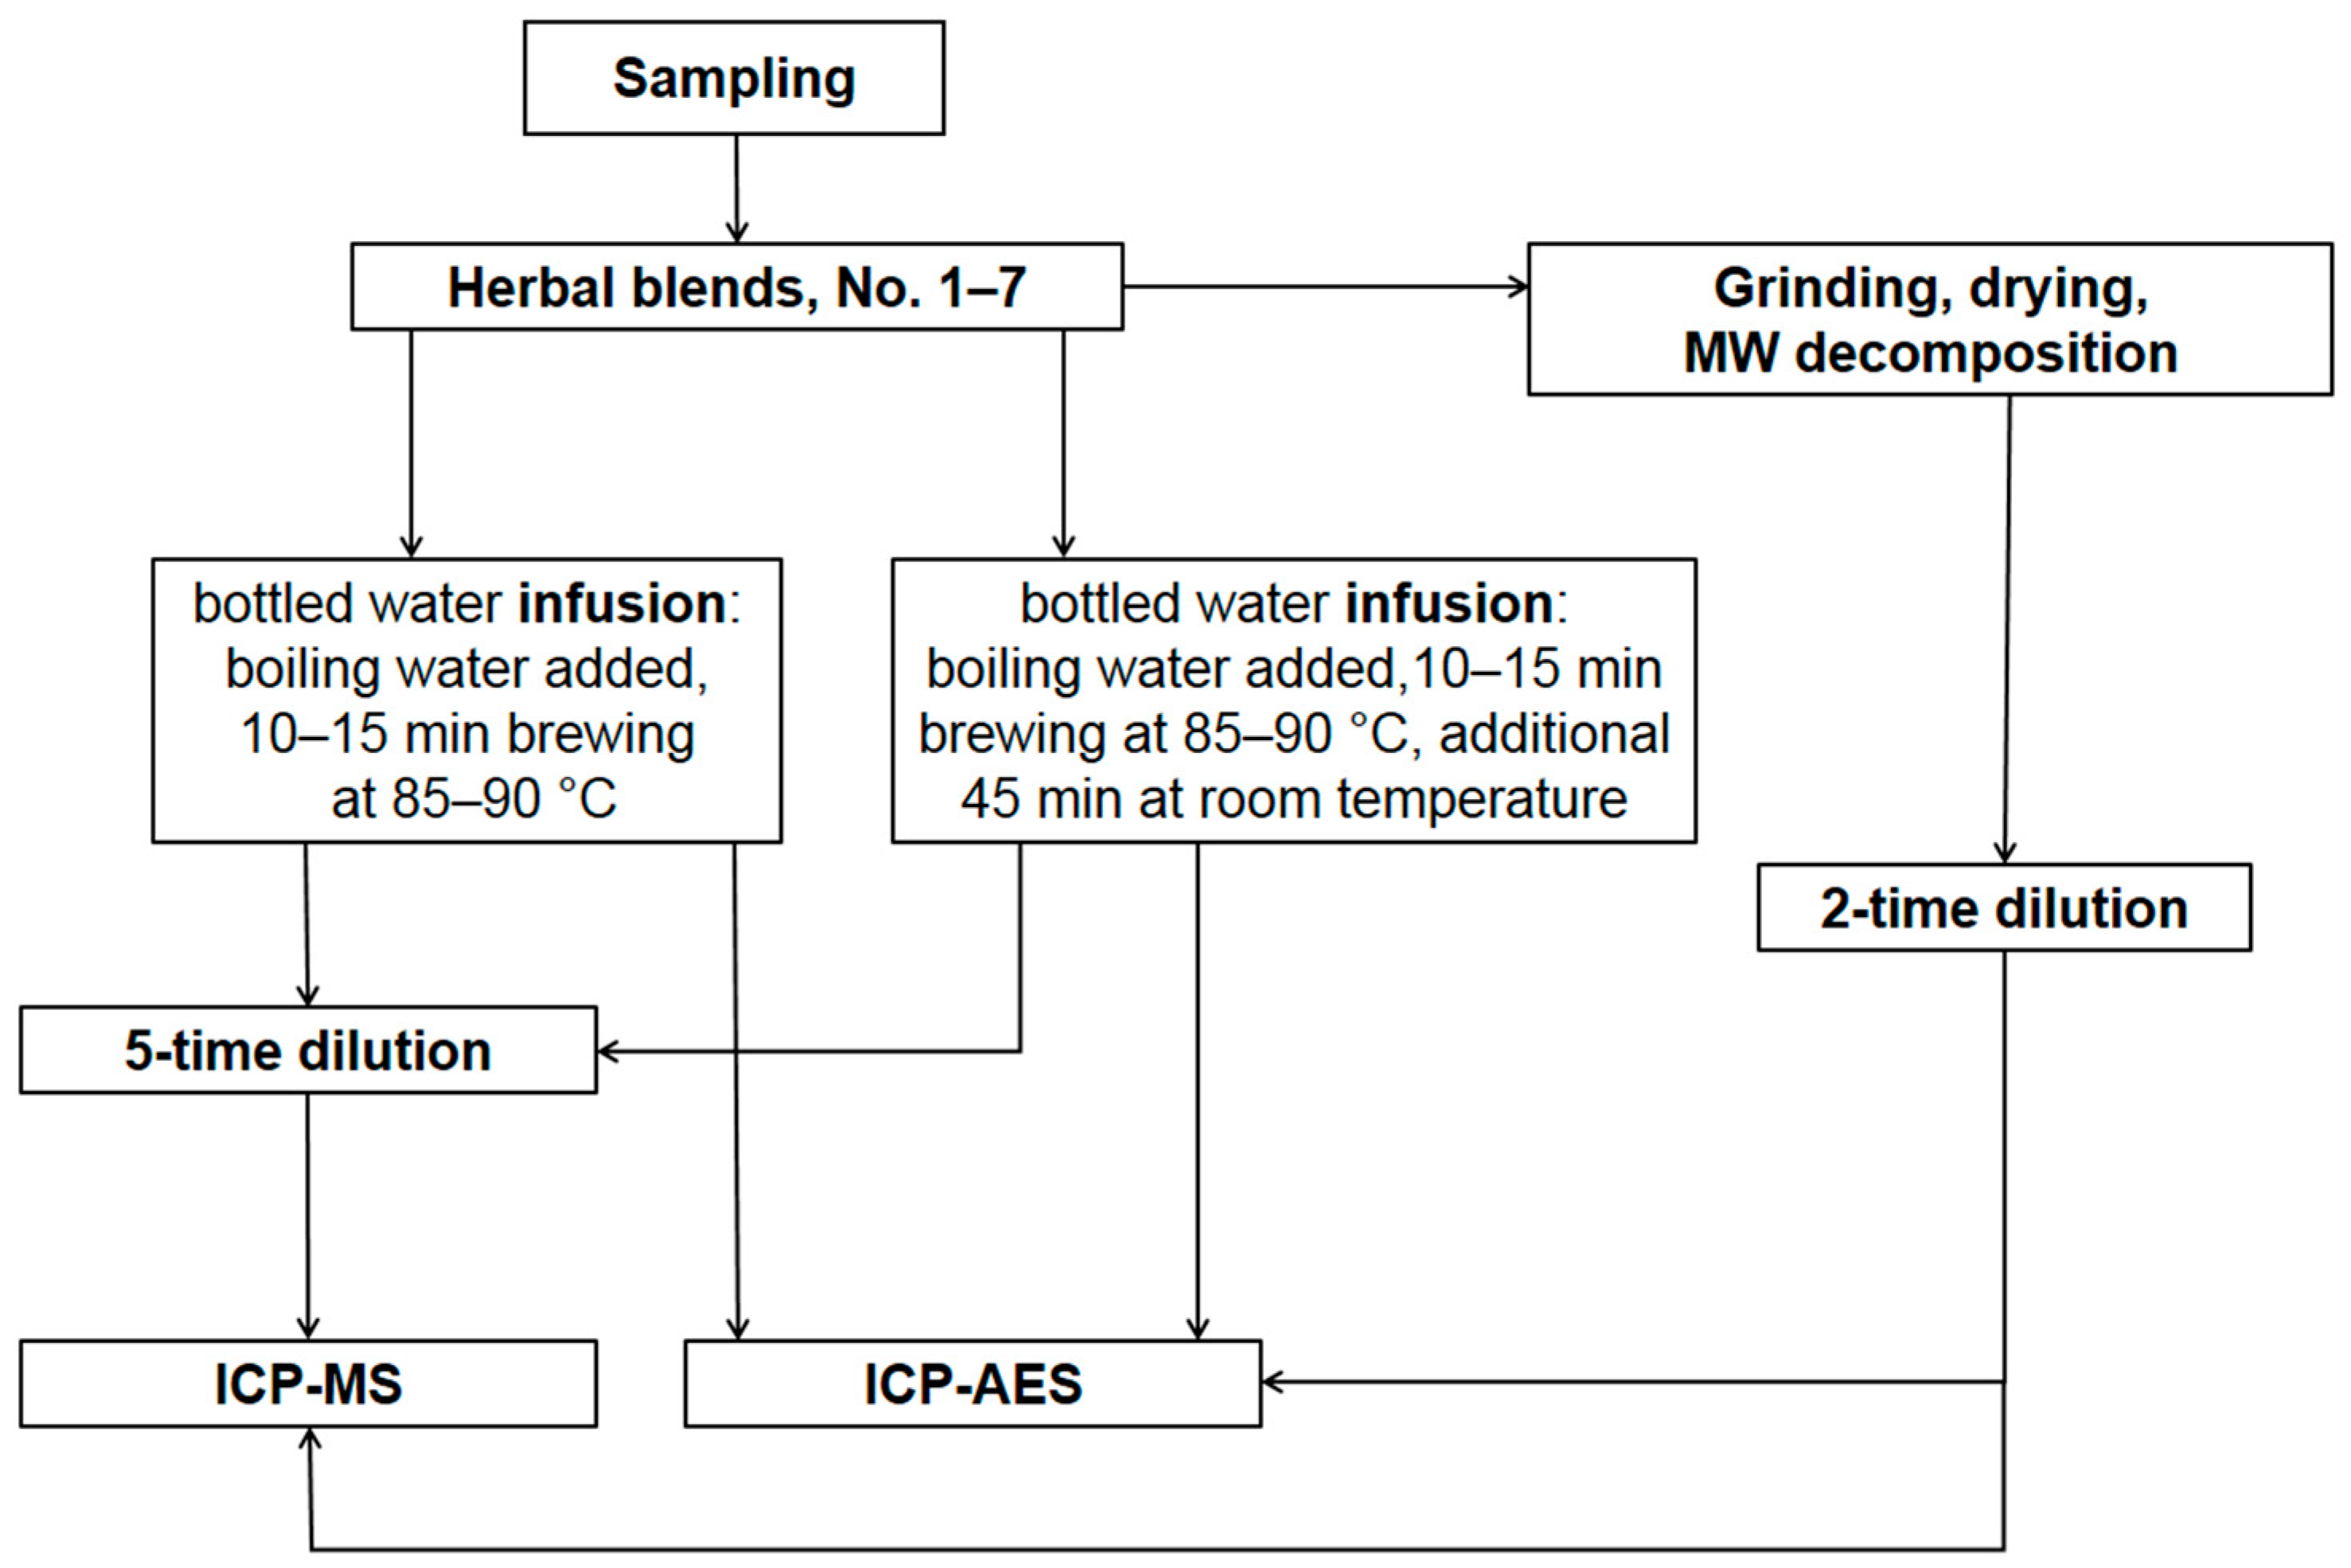
2.2. Sample Preparation
2.3. Analysis (ICP-MS and ICP-AES Techniques)
2.3.1. Mineralization of the Original Herbal Blends
2.3.2. Preparation of Solutions for Measurement by ICP-MS and ICP-AES
2.3.3. Measurement of Element Concentration by ICP-MS Method
2.3.4. Measurement of Element Concentration by ICP-AES Method
2.3.5. Verification of the Developed Analytical Procedure
3. Results and Discussion
3.1. Biological Significance
3.2. Pairwise Correlations between Elements
4. Conclusions
- -
- the combination of different raw plant materials into a single herbal blend used for brewing herbal tea provided a large set of elements recommended for daily dietary intake.
- -
- regular consumption use of the tisanes provides valuable supplementation with vital macro- and microelements.
Author Contributions
Funding
Institutional Review Board Statement
Informed Consent Statement
Acknowledgments
Conflicts of Interest
References
- Zeyuan, D.; Bingying, T.; Xiaolin, L.; Jinming, H.; Yifeng, C. Effect of green tea and black tea on the metabolisms of mineral elements in old rats. Biol. Trace Element Res. 1998, 65, 75–86. [Google Scholar] [CrossRef] [PubMed]
- Wong, M.; Zhang, Z.; Wong, J.; Lan, C. Trace Metal Contents (Al, Cu and Zn) of Tea: Tea and Soil from Two Tea Plantations, and Tea Products from Different Provinces of China. Environ. Geochem. Health 1998, 20, 87–94. [Google Scholar] [CrossRef]
- Xie, M.; Von Bohlen, A.; Klockenkämper, R.; Jian, X.; Gunther, K. Multielement analysis of Chinese tea (Camellia sinensis) by total-reflection X-ray fluorescence. Z. Für Lebensm. Forsch. A 1998, 207, 31–38. [Google Scholar] [CrossRef]
- Mehra, A.; Baker, C. Leaching and bioavailability of aluminium, copper and manganese from tea (Camellia sinensis). Food Chem. 2007, 100, 1456–1463. [Google Scholar] [CrossRef]
- Wu, Y.Z. Chinese Tea; Wu, W., Translator; Shanghai People’s Publishing House: Shanghai, China, 2009; pp. 1–160. [Google Scholar]
- Salahinejad, M.; Aflaki, F. Toxic and Essential Mineral Elements Content of Black Tea Leaves and Their Tea Infusions Consumed in Iran. Biol. Trace Element Res. 2009, 134, 109–117. [Google Scholar] [CrossRef] [PubMed]
- Aksuner, N.; Henden, E.; Aker, Z.; Engin, E.; Satik, S. Determination of essential and non-essential elements in various tea leaves and tea infusions consumed in Turkey. Food Addit. Contam. Part B 2012, 5, 126–132. [Google Scholar] [CrossRef] [PubMed]
- Szymczycha-Madeja, A.; Welna, M.; Pohl, P. Elemental analysis of teas and their infusions by spectrometric methods. TrAC Trends Anal. Chem. 2012, 35, 165–181. [Google Scholar] [CrossRef]
- Welna, M.; Szymczycha-Madeja, A.; Pohl, P. A comparison of samples preparation strategies in the multi-elemental analysis of tea by spectrometric methods. Food Res. Int. 2013, 53, 922–930. [Google Scholar] [CrossRef]
- Ravikumari, C. Review on Herbal Teas. J. Pharm. Sci. Res. 2014, 6, 236–238. [Google Scholar]
- Abdel-Aziz, S.M.; Abdel-Aziz, M.S.; Garg, N. Health Benefits of Trace Elements in Human Diseases. In Microbes in Food and Health; Garg, N., Abdel-Aziz, S., Aeron, A., Eds.; Springer: Cham, Switzerland, 2016; pp. 117–142. [Google Scholar] [CrossRef]
- Pohl, P.; Dzimitrowicz, A.; Jedryczko, D.; Szymczycha-Madeja, A.; Welna, M.; Jamroz, P. The determination of elements in herbal teas and medicinal plant formulations and their tisanes. J. Pharm. Biomed. Anal. 2016, 130, 326–335. [Google Scholar] [CrossRef]
- Schulzki, G.; Nüßlein, B.; Sievers, H. Transition rates of selected metals determined in various types of teas (Camellia sinensis L. Kuntze) and herbal/fruit infusions. Food Chem. 2017, 215, 22–30. [Google Scholar] [CrossRef]
- Baker, A.J.M. Accumulators and excluders-strategies in the response of plants to heavy metals. J. Plant Nutr. 1981, 3, 643–654. [Google Scholar] [CrossRef]
- Aggett, P. 1 Physiology and metabolism of essential trace elements: An outline. Clin. Endocrinol. Metab. 1985, 14, 513–543. [Google Scholar] [CrossRef]
- Markert, B. Establishing of? Reference Plant? For inorganic characterization of different plant species by chemical fingerprinting. Water Air Soil Pollut. 1992, 64, 533–538. [Google Scholar] [CrossRef]
- Cao, X.; Zhao, G.; Yin, M.; Li, J. Determination of ultratrace rare earth elements in tea by inductively coupled plasma mass spectrometry with microwave digestion and AG50W-x8 cation exchange chromatography. Analyst 1998, 123, 1115–1119. [Google Scholar] [CrossRef]
- Kralj, B.; Križaj, I.; Bukovec, P.; Slejko, S.; Milačič, R. Speciation of aluminium in tea infusions by use of SEC and FPLC with ICP–OES and ES–MS–MS detection. Anal. Bioanal. Chem. 2005, 383, 467–475. [Google Scholar] [CrossRef]
- Soylak, M.; Tuzen, M.; Souza, A.S.; Korn, M.D.G.A.; Ferreira, S.L.C. Optimization of microwave assisted digestion procedure for the determination of zinc, copper and nickel in tea samples employing flame atomic absorption spectrometry. J. Hazard. Mater. 2007, 149, 264–268. [Google Scholar] [CrossRef] [PubMed]
- Arpadjan, S.; Çelik, G.; Taşkesen, S.; Gucer, S. Arsenic, cadmium and lead in medicinal herbs and their fractionation. Food Chem. Toxicol. 2008, 46, 2871–2875. [Google Scholar] [CrossRef]
- Belmer, S.V.; Gasilina, T.V. Microelements and microelementoses and their importance in childhood. Quest. Mod. Pediatrics 2008, 7, 91–96. (In Russian) [Google Scholar]
- Sofuoglu, S.C.; Kavcar, P. An exposure and risk assessment for fluoride and trace metals in black tea. J. Hazard. Mater. 2008, 158, 392–400. [Google Scholar] [CrossRef] [Green Version]
- Fung, K.; Carr, H.; Poon, B.; Wong, M. A comparison of aluminum levels in tea products from Hong Kong markets and in varieties of tea plants from Hong Kong and India. Chemosphere 2009, 75, 955–962. [Google Scholar] [CrossRef]
- Desideri, D.; Meli, M.; Roselli, C.; Feduzi, L. Polarized X ray fluorescence spectrometer (EDPXRF) for the determination of essential and nonessential elements in tea. Microchem. J. 2011, 98, 186–189. [Google Scholar] [CrossRef]
- Malik, J.; Frankova, A.; Drabek, O.; Száková, J.; Ash, C.; Kokoska, L. Aluminium and other elements in selected herbal tea plant species and their infusions. Food Chem. 2013, 139, 728–734. [Google Scholar] [CrossRef] [PubMed]
- Milani, R.F.; Morgano, M.A.; Saron, E.S.; Silva, F.F.; Cadore, S. Evaluation of Direct Analysis for Trace Elements in Tea and Herbal Beverages by ICP-MS. J. Braz. Chem. Soc. 2015, 26, 1211–1217. [Google Scholar] [CrossRef]
- Platel, K.; Srinivasan, K. Bioavailability of Micronutrients from Plant Foods: An Update. Crit. Rev. Food Sci. Nutr. 2015, 56, 1608–1619. [Google Scholar] [CrossRef] [PubMed]
- Polechońska, L.; Dambiec, M.; Klink, A.; Rudecki, A. Concentrations and solubility of selected trace metals in leaf and bagged black teas commercialized in Poland. J. Food Drug Anal. 2015, 23, 486–492. [Google Scholar] [CrossRef] [Green Version]
- Zhao, J.; Deng, J.W.; Chen, Y.W.; Li, S.P. Advanced phytochemical analysis of herbal tea in China. J. Chromatogr. A 2013, 1313, 2–23. [Google Scholar] [CrossRef] [PubMed]
- Lavrinenko, Y.V.; Plieva, A.M.; Khristozova, G.Y.; Frontasieva, M.V.; Zinkovskaya, I.; Tkachenko, K.G. The elemental composition of herbal teas studied using instrumental neutron activation analysis and atomic absorption spectrometry. Chem. Veg. Raw Mater. 2020, 3, 305–314. Available online: http://journal.asu.ru/cw/article/view/7428 (accessed on 31 August 2021). (In Russian) [CrossRef]
- Tkachenko, K.; Frontasyeva, M.; Vasilev, A.; Avramov, L. Major and Trace Element Content of Wildlife Plants Chamerion angustifolium (L.) Holub. Int. J. Med. Plants Photon 2020, 114, 913–921. [Google Scholar]
- Tkachenko, K.; Frontasyeva, M.; Vasilev, A.; Avramov, L.; Shi, L. Major and Trace Element Content of Tribulus terrestris L. Wildlife Plants. Plants 2020, 9, 1764. [Google Scholar] [CrossRef]
- World Health Organization (WHO). Quality Control Methods for Medicinal Plant Materials. 1998, pp. 1–115. Available online: https://apps.who.int/iris/handle/10665/4198 (accessed on 31 August 2021).
- Herrera, T.; Aguilera, Y.; Rebollo-Hernanz, M.; Bravo, E.; Benitez, V.; Martínez-Sáez, N.; Arribas, S.M.; del Castillo, M.D.; Martín-Cabrejas, M.A. Teas and herbal infusions as sources of melatonin and other bioactive non-nutrient components. LWT 2018, 89, 65–73. [Google Scholar] [CrossRef]
- Sahu, L.; Ray, D.K.; Chand, P.K. Proton induced X-ray emission (PIXE) technique for determining multi-element composition of transformed hairy root cultures of Boerhaavia diffusa L.: An important medicinal herb. J. Radioanal. Nucl. Chem. 2014, 300, 345–354. [Google Scholar] [CrossRef]
- Konieczynski, P.; Arceusz, A.; Wesolowski, M. Essential Elements and Their Relations to Phenolic Compounds in Infusions of Medicinal Plants Acquired from Different European Regions. Biol. Trace Element Res. 2015, 170, 466–475. [Google Scholar] [CrossRef] [PubMed] [Green Version]
- European Medicines Agency/HMPC/5829/2010 Rev.1 European Medicines Agency, Committee on Herbal Medicinal Products (HMPC). Available online: https://www.ema.europa.eu/en/documents/regulatory-procedural-guideline/glossary-herbal-teas_en.pdf (accessed on 31 August 2021).
- Chizzola, R. Metallic mineral elements and heavy metals in medicinal plants. In Medicinal and Aromatic Plant Science and Biotechnology; Global Science Books (GSB): Ikenobe, Japan, 2012; pp. 39–53. [Google Scholar]
- State Pharmacopoeia of the Russian Federation/Ministry of Health of the Russian Federation, 13th ed.; The Ministry of Health of the Russian Federation: Moscow, Russia, 2015; Volume 1, pp. 1–1470.
- State Pharmacopoeia of the Russian Federation/Ministry of Health of the Russian Federation, 14th ed.; The Ministry of Health of the Russian Federation: Moscow, Russia, 2018; Volume 4, pp. 1–7019.
- Taşcioğlu, S.; Kök, E. Temperature dependence of copper, iron, nickel and chromium transfers into various black and green tea infusions. J. Sci. Food Agric. 1998, 76, 200–208. [Google Scholar] [CrossRef]
- Dalipi, R.; Borgese, L.; Tsuji, K.; Bontempi, E.; Depero, L.E. Elemental analysis of teas, herbs and their infusions by means of total reflection X-ray fluorescence. J. Food Compos. Anal. 2018, 67, 128–134. [Google Scholar] [CrossRef]
- Matsuura, H.; Hokura, A.; Katsuki, F.; Itoh, A.; Haraguchi, H. Multielement Determination and Speciation of Major-to-Trace Elements in Black Tea Leaves by ICP-AES and ICP-MS with the Aid of Size Exclusion Chromatography. Anal. Sci. 2001, 17, 391–398. [Google Scholar] [CrossRef] [PubMed] [Green Version]
- Gallaher, R.; Gallaher, K.; Marshall, A. Mineral analysis of ten types of commercially available tea. J. Food Compos. Anal. 2006, 19, S53–S57. [Google Scholar] [CrossRef]
- Samolińska, W.; Kiczorowska, B.; Kwiecień, M.; Rusinek-Prystupa, E. Determination of Minerals in Herbal Infusions Promoting Weight Loss. Biol. Trace Element Res. 2017, 175, 495–502. [Google Scholar] [CrossRef] [Green Version]
- Soliman, M.A.; Abdou, F.S.; Mohamed, N.M. Novel neutron activation analysis scheme for determination of trace elements in medicinal plants infusion. J. Radioanal. Nucl. Chem. 2020, 325, 841–846. [Google Scholar] [CrossRef]
- Pytlakowska, K.; Kita, A.; Janoska, P.; Połowniak, M.; Kozik, V. Multi-element analysis of mineral and trace elements in medicinal herbs and their infusions. Food Chem. 2012, 135, 494–501. [Google Scholar] [CrossRef]
- Costa, L.M.; Gouveia, S.T.; Nobrega, J. Comparison of Heating Extraction Procedures for Al, Ca, Mg, and Mn in Tea Samples. Anal. Sci. 2002, 18, 313–318. [Google Scholar] [CrossRef] [PubMed] [Green Version]
- Panasenko, L.M.; Kartseva, T.V.; Nefedova, Z.V.; Zadorina-Khutornaya, E.V. The role of basic minerals in children’s nutrition. In Russian Bulletin of Perinatology and Pediatrics; National Pediatric Academy of Science and Innovation: Moscow, Russian, 2018; Volume 63, pp. 122–127. [Google Scholar]
- Avtsyn, A.P.; Zhavoronkov, A.A.; Rish, M.A.; Strochkova, L.S. Human Microelementosis; Medicine: Moscow, Russian, 1991; pp. 1–496. [Google Scholar]
- Markert, B.; Fraenzle, S.; Wünschmann, S. Chemical Evolution: The Biological System of the Elements; Springer International Publishing: Berlin/Heidelberg, Germany, 2015. [Google Scholar]

| Species | Collecting Place | Time of Procurement of Raw Materials, Months | Type of Raw Material |
|---|---|---|---|
| Alchemilla sp. * | 4 | VI–VIII | Aerial part |
| Epilobium angustifolium L. (Chamaenerion angustifolium (L.) Schur) | 5 | VI–VII | Flowers |
| Crataegus sp. ** | 2 | IX–XI | Fruit |
| Dasiphora fruticosa (L.) Rydb. | 5 | VI–VII | Shoots |
| Ginkgo biloba L. | 6 | VIII–IX | Leaves |
| Elaeagnus rhamnoides (L.) A.Nelson (Hippophaë rhamnoides L.) | 2 | VIII–IX | Fruit |
| Hypericum perforatum L. | 1 | VI–VII | Aerial part |
| Malus domestica Borkh. | 6 | VIII–IX | Fruit |
| Melissa officinalis L. | 6 | VI–VII | Aerial part |
| Mentha × piperita L. | 6 | VI–VII | Leaves |
| Mentha longifolia (L.) L. | 1 | VI–VII | Leaves |
| Origanum vulgare L. | 1 | VI–VII | Aerial part |
| Pinus sylvestris var. hamata Steven (Pinus kochiana Klotzsch ex K.Koch) | 4 | VIII–IX | Plant buds |
| Ribes nigrum L. | 6 | V–VII | Leaves |
| Rosa sp. *** | 2 | VIII–IX | Fruit |
| Rubus idaeus L. (Rubus buschii (Rozanova) Grossh.) | 4 | V–VII | Leaves |
| Rubus idaeus L. (Rubus buschii (Rozanova) Grossh.) | 4 | V–VII | Shoots |
| Thymus sp. **** | 2 | VI–VIII | Aerial part |
| Tilia cordata Mill. | 4 | V–VI | Flowers |
| Trifolium pratense L. | 5 | V–VII | Inflorescences |
| Vaccinium arctostaphylos L. | 3 | VIII–IX | Leaves |
| Vaccinium arctostaphylos L. | 3 | VIII–IX | Fruit |
| No | Herbal Blends | Composition |
|---|---|---|
| 1 | “Bouquet of Vivacity” | Fruit of Rosa, leaves of Ribes, herbs of Hypericum |
| 2 | “Forest Gifts” | Fruit of Rosa, fruit of Crataegus, offshoot of Rubus, leaves of Ribes, leaves and flowers of Chamaenerion, buds of Pinus |
| 3 | “The Valley of Health” | Herb of Dasiphora fruticosa, leaves of Ginkgo biloba, flofers of Trifolium |
| 4 | “Our Canyon” | Leaves of Mentha, leaves of Ribes, herbs of Origanum, herbs of Thymus, herbs of Hypericum, leaves and flowers of Chamaenerion, leaves of Vaccinium caucasicum, herbs of Achillea |
| 5 | “Sea Buckthorn Yummy” | Fruit of Hiepophae, leaves of Rubus, herbs of Melissa, flowers of Tilia, fruit of Malus |
| 6 | “Northern Blossom” | leaves and fruit of Vaccinium caucasicum, leaves and flowers of Chamaenerion, green tea (Thea chinensis) |
| 7 | “Skifian Strength” | Herb of Dasiphora fruticosa, herbs of Thymus, fruit of Malus |
| Element | Measured Values, ppm | Certified Values, ppm |
|---|---|---|
| (n = 6), p = 0.95 | ||
| Li | 22.9 ± 0.3 | 23.0 ± 1.8 |
| V | 3 ± 0.6 | 3.08 ± 0.42 |
| Cr | 2.3 ± 0.2 | 2.59 ± 0.32 |
| Mn | 372 ± 2 | 412 ± 14 |
| Co | 0.84 ± 0.02 | 0.879 ± 0.039 |
| Ni | 5.4 ± 0.2 | 6.32 ± 0.65 |
| Cu | 13 ± 1 | 14.1 ± 0.5 |
| Zn | 43 ± 1 | 49.9 ± 2.4 |
| As | 0.58 ± 0.08 | 0.539 ± 0.06 |
| Rb | 9.2 ± 0.2 | 9.79 ± 1.27 |
| Sr | 211 ± 2 | 201 ± 20 |
| Mo | 0.28 ± 0.01 | 0.26 * |
| Cd | 1.05 ± 0.02 | 1.12 ± 0.12 |
| Sb | 0.07 ± 0.01 | 0.075 * |
| Cs | 0.162 ± 0.005 | 0.177 ± 0.022 |
| Ba | 87 ± 1 | 84.2 ± 11.5 |
| La | 1.35 ± 0.62 | 1.44 ± 0.16 |
| Ce | 2.2 ± 1.2 | 2.69 ± 0.3 |
| Sm | 0.19 ± 0.09 | 0.229 ± 0.052 |
| Eu | 0.04 ± 0.01 | 0.038 ± 0.009 |
| Tb | 0.03 ± 0.01 | 0.032 ± 0.006 |
| Yb | 0.06 ± 0.01 | 0.13 * |
| Pb | 4.4 ± 0.3 | 4.9 ± 0.8 |
| Th | 0.33 ± 0.23 | 0.348 ± 0.054 |
| U | 0.11 ± 0.03 | 0.1 * |
| Element | DL, mg/kg | Tea No. 1 | Tea No. 2 | Tea No. 3 | Tea No. 4 | Tea No. 5 | Tea No. 6 | Tea No. 7 |
|---|---|---|---|---|---|---|---|---|
| Al | 0.002 | 0.043 | 0.05 | 0.17 | 0.28 | 0.17 | 0.33 | 0.24 |
| Ca | 0.002 | 7.63 | 6.84 | 11.1 | 13.1 | 2.17 | 5.51 | 9.09 |
| Fe | 0.002 | 0.03 | 0.04 | 0.13 | 0.17 | 0.10 | 0.13 | 0.17 |
| K | 0.002 | 9.15 | 9.63 | 11.6 | 15.5 | 10.1 | 9.54 | 11.03 |
| Mg | 0.002 | 1.82 | 1.64 | 2.06 | 2.67 | 0.99 | 2.33 | 1.69 |
| P | 0.002 | 1.39 | 1.23 | 1.34 | 1.79 | 1.76 | 1.46 | 1.52 |
| S | 0.006 | 0.89 | 0.82 | 1.46 | 2.10 | 1.64 | 1.58 | 1.37 |
| Si | 0.001 | 0.21 | 0.18 | 0.61 | 0.97 | 0.39 | 0.50 | 0.80 |
| Ti | 0.05 | 2 | 3 | 6 | 9 | 5 | 8 | 10 |
| V | 0.01 | 0.05 | 0.06 | 0.24 | 0.39 | 0.23 | 0.23 | 0.33 |
| Cr | 0.01 | 0.27 | 0.36 | 0.45 | 1.1 | 0.68 | 0.64 | 1.0 |
| Mn | 0.01 | 59 | 64 | 49 | 71 | 23 | 344 | 130 |
| Co | 0.01 | 0.08 | 0.10 | 0.13 | 0.16 | 0.05 | 0.12 | 0.14 |
| Ni | 0.02 | 1.1 | 1.2 | 0.91 | 1.7 | 1.3 | 2.0 | 0.71 |
| Cu | 0.01 | 4.4 | 5.0 | 5.7 | 7.4 | 4.7 | 9.5 | 5.8 |
| Zn | 0.05 | 13 | 17 | 20 | 33 | 22 | 39 | 20 |
| Ga | 0.001 | 0.01 | 0.01 | 0.04 | 0.06 | 0.03 | 0.04 | 0.05 |
| As | 0.01 | 0.02 | 0.03 | 0.07 | 0.11 | 0.04 | 0.15 | 0.08 |
| Se | 0.1 | <DL | <DL | <DL | 0.17 | 0.31 | <DL | <DL |
| Rb | 0.005 | 6.4 | 7.9 | 5.2 | 8.0 | 9.3 | 21 | 2.8 |
| Sr | 0.01 | 39 | 33 | 44 | 50 | 11 | 16 | 31 |
| Y | 0.001 | 0.02 | 0.05 | 0.05 | 0.10 | 0.04 | 0.08 | 0.07 |
| Zr | 0.05 | <DL | <DL | 0.2 | 0.3 | 0.2 | 0.2 | 0.3 |
| Nb | 0.002 | <DL | <DL | 0.02 | 0.03 | 0.02 | 0.02 | 0.03 |
| Mo | 0.05 | 0.3 | 0.2 | 0.3 | 0.6 | 1.0 | 0.2 | 0.7 |
| Cd | 0.002 | 0.02 | 0.04 | 0.01 | 0.08 | 0.05 | 0.33 | 0.02 |
| Sb | 0.002 | 0.00 | 0.01 | 0.01 | 0.01 | 0.02 | 0.04 | 0.01 |
| Cs | 0.001 | 0.03 | 0.06 | 0.02 | 0.04 | 0.04 | 0.13 | 0.02 |
| Ba | 0.010 | 9.3 | 9.8 | 33 | 37 | 7.1 | 24 | 35 |
| La | 0.001 | 0.04 | 0.10 | 0.07 | 0.22 | 0.06 | 0.11 | 0.10 |
| Ce | 0.001 | 0.06 | 0.09 | 0.14 | 0.40 | 0.12 | 0.20 | 0.21 |
| Pr | 0.001 | 0.01 | 0.02 | 0.02 | 0.05 | 0.01 | 0.02 | 0.02 |
| Nd | 0.001 | 0.02 | 0.07 | 0.06 | 0.17 | 0.05 | 0.09 | 0.09 |
| Sm | 0.001 | <DL | 0.01 | 0.01 | 0.03 | 0.01 | 0.02 | 0.02 |
| Eu | 0.001 | <DL | <DL | 0.01 | 0.01 | <DL | 0.01 | 0.01 |
| Gd | 0.001 | <DL | 0.01 | 0.01 | 0.03 | 0.01 | 0.02 | 0.02 |
| Dy | 0.001 | <DL | 0.01 | 0.01 | 0.02 | 0.01 | 0.01 | 0.01 |
| Er | 0.001 | <DL | <DL | <DL | 0.01 | <DL | 0.01 | 0.01 |
| Yb | 0.001 | <DL | <DL | <DL | 0.01 | <DL | 0.01 | 0.01 |
| W | 0.01 | 0.04 | 0.02 | 0.02 | 0.03 | 0.18 | 0.07 | 0.04 |
| Tl | 0.001 | <DL | <DL | <DL | 0.01 | 0.01 | 0.01 | <DL |
| Pb | 0.01 | 0.10 | 0.17 | 0.46 | 0.43 | 1.2 | 1.8 | 0.69 |
| U | 0.001 | <DL | <DL | 0.01 | 0.01 | <DL | <DL | 0.01 |
| Elem | DL | Tea No. 1 | Tea No. 2 | Tea No. 3 | Tea No. 4 | Tea No. 5 | Tea No. 6 | Tea No. 7 | |||||||
|---|---|---|---|---|---|---|---|---|---|---|---|---|---|---|---|
| 15 min | 45 min | 15 min | 45 min | 15 min | 45 min | 15 min | 45 min | 15 min | 45 min | 15 min | 45 min | 15 min | 45 min | ||
| Al | 0.002 | 0.03 | 0.03 | 0.06 | 0.03 | <DL | 0.003 | 0.004 | 0.008 | 0.02 | 0.05 | 0.12 | 0.13 | <DL | <DL |
| Ca | 0.0025 | 10.52 | 11.77 | 11.74 | 12.64 | 3.31 | 5.06 | 9.27 | 10.27 | 8.78 | 10.79 | 3.68 | 4.12 | 3.69 | 4.4 |
| Fe | 0.0025 | 0.07 | 0.04 | 0.05 | 0.05 | 0.01 | 0.02 | 0.006 | 0.01 | 0.09 | 0.06 | 0.03 | 0.03 | 0.01 | 0.01 |
| K | 0.0025 | 70.54 | 69.39 | 74.14 | 75.41 | 30.74 | 32.76 | 38.86 | 40.86 | 70.71 | 72.84 | 25.26 | 20.61 | 29.61 | 28.31 |
| Mg | 0.0025 | 7.54 | 9.23 | 8.54 | 8.71 | 2.29 | 2.92 | 4.03 | 4.28 | 4.49 | 5.04 | 3.29 | 3.57 | 1.96 | 2.22 |
| P | 0.0025 | 5.97 | 6.19 | 5.59 | 5.22 | 1.71 | 1.87 | 0.44 | 2.55 | 4.78 | 5.27 | 1.7 | 1.47 | 2.16 | 2.14 |
| S | 0.0075 | 3.77 | 3.51 | 3.09 | 2.26 | 1.48 | 2.28 | <DL | 3.43 | 3.8 | 4.29 | 1.67 | 1.66 | 1.49 | 1.4 |
| Si | 0.00125 | 1.1 | 0.25 | 0.89 | <DL | <DL | 1.2 | 0.14 | 0.21 | <DL | 0.01 | 0.45 | 0.33 | 0.56 | <DL |
| Ti | 0.125 | 4.02 | 0.58 | 1.61 | 0.97 | 0.14 | 0.13 | 0.33 | 1.04 | 2.56 | 0.32 | 0.03 | 0.09 | <DL | <DL |
| V | 0.025 | 0.28 | 0.008 | 0.25 | 0.11 | 0.11 | 0.12 | 0.17 | 0.12 | 0.29 | 0.09 | 0.19 | 0.11 | 0.13 | 0.07 |
| Cr | 0.0125 | 0.91 | 0.99 | 1.07 | 1.59 | 0.19 | 0.42 | 0.21 | 0.36 | 1.41 | 1.27 | 0.31 | 0.33 | 0.25 | 0.27 |
| Mn | 0.05 | 268.19 | 304.83 | 277.16 | 317.83 | 47.19 | 54.86 | 58.91 | 71.22 | 128.54 | 157.7 | 382.45 | 380.94 | 114.27 | 147.17 |
| Co | 0.0125 | 0.44 | 0.4 | 0.53 | 0.68 | 0.19 | 0.26 | 0.23 | 0.26 | 0.2 | 0.24 | 0.13 | 0.15 | 0.18 | 0.22 |
| Ni | 0.05 | 5.19 | 5.03 | 5.99 | 7.76 | 1 | 1.76 | 2.24 | 2.8 | 4.06 | 4.88 | 3.08 | 3.08 | 4.14 | 0.65 |
| Cu | 0.125 | 16.87 | 17.19 | 16.13 | 14.37 | 5.07 | 7.97 | 4.33 | 10.48 | 6.05 | 14.10 | 7.27 | 5.24 | 5.88 | 8.17 |
| Zn | 0.5 | 35.27 | 32.01 | 50.25 | 64.61 | 22.35 | 27.87 | 21.81 | 30.22 | 85.83 | 97.29 | 26.25 | 28.33 | 22.73 | 25.21 |
| As | 0.025 | 0.16 | 0.12 | 0.200 | 0.24 | 0.09 | 0.12 | 0.12 | 0.14 | 0.33 | 0.29 | 0.31 | 0.27 | 0.08 | 0.12 |
| Rb | 0.0125 | 46.44 | 54.08 | 59.56 | 68.29 | 12.69 | 13.46 | 21.11 | 20.04 | 59.45 | 63.19 | 52.13 | 52.83 | 6.24 | 6.55 |
| Sr | 0.05 | 72.6 | 87.06 | 82.67 | 94.50 | 6.24 | 13.73 | 27.72 | 30.92 | 51.36 | 56.16 | 7.84 | 9.83 | 5.81 | 3.64 |
| Y | 0.0025 | 0.13 | 0.1 | 0.17 | 0.2 | 0.02 | 0.04 | 0.02 | 0.05 | 0.07 | 0.08 | 0.04 | 0.05 | 0.03 | 0.04 |
| Zr | 0.0025 | 0.37 | 0.64 | 0.31 | 0.21 | 0.03 | 0.25 | 0.04 | 0.13 | 0.21 | 0.11 | 0.06 | 0.22 | 0.01 | 0.04 |
| Mo | 0.05 | 0.38 | 0.39 | 0.17 | 0.06 | <DL | 0.11 | 0.25 | 0.26 | 1.77 | 1.33 | <DL | <DL | 0.12 | <DL |
| Cd | 0.005 | 0.06 | 0.05 | 0.08 | 0.13 | 0.003 | 0.02 | 0.02 | 0.04 | 0.20 | 0.24 | 0.14 | 0.17 | 0.01 | 0.01 |
| Sb | 0.00125 | 0.006 | 0.002 | 0.005 | 0.02 | <DL | 0.009 | <DL | 0.01 | 0.03 | 0.02 | 0.01 | 0.02 | 0.02 | 0.003 |
| Cs | 0.00125 | 0.237 | 0.28 | 0.39 | 0.46 | 0.03 | 0.04 | 0.07 | 0.06 | 0.21 | 0.22 | 0.28 | 0.31 | 0.02 | 0.02 |
| Ba | 0.025 | 16.62 | 24.82 | 18.59 | 27.56 | 8.96 | 19.76 | 16.47 | 29.51 | 31.82 | 39.44 | 8.57 | 12.78 | 8.77 | 16.23 |
| La | 0.0025 | 0.103 | 0.09 | 0.12 | 0.16 | 0.007 | 0.03 | 0.009 | <DL | 0.06 | 0.05 | 0.02 | 0.04 | 0.006 | 0.03 |
| Ce | 0.005 | 0.22 | 0.15 | 0.16 | 0.07 | 0.01 | 0.05 | 0.02 | 0.08 | 0.12 | 0.09 | 0.03 | 0.06 | 0.02 | 0.06 |
| Pr | 0.00125 | 0.02 | 0.02 | 0.03 | 0.04 | 0.002 | 0.008 | 0.003 | 0.01 | 0.01 | 0.01 | 0.005 | 0.009 | 0.003 | 0.007 |
| Nd | 0.0005 | 0.12 | 0.09 | 0.14 | 0.16 | 0.02 | 0.03 | 0.02 | 0.04 | 0.05 | 0.06 | 0.03 | 0.03 | 0.02 | 0.03 |
| Sm | 0.00125 | 0.02 | 0.02 | 0.03 | 0.04 | 0.003 | 0.01 | 0.003 | 0.009 | 0.01 | 0.01 | 0.006 | 0.008 | 0.003 | 0.008 |
| Eu | 0.00125 | 0.008 | 0.009 | 0.01 | 0.01 | 0.002 | 0.005 | 0.004 | 0.007 | 0.008 | 0.009 | 0.003 | 0.004 | 0.002 | 0.005 |
| Gd | 0.00025 | 0.03 | 0.02 | 0.04 | 0.04 | 0.005 | 0.01 | 0.005 | 0.01 | 0.02 | 0.02 | 0.008 | 0.009 | 0.005 | 0.009 |
| Yb | 0.0005 | 0.01 | 0.008 | 0.01 | 0.01 | 0.003 | 0.005 | 0.002 | 0.004 | 0.008 | 0.008 | 0.004 | 0.005 | 0.003 | 0.003 |
| Hf | 0.00125 | 0.013 | 0.033 | 0.009 | 0.01 | <DL | 0.009 | <DL | 0.002 | 0.007 | 0.004 | <DL | 0.003 | <DL | <DL |
| W | 0.005 | 0.013 | <DL | 0.020 | 0.013 | <DL | 0.032 | <DL | 0.01 | 0.76 | 0.68 | 0.01 | 0.01 | <DL | <DL |
| Tl | 0.00125 | 0.007 | 0.009 | 0.008 | 0.009 | 0.003 | 0.004 | 0.008 | 0.008 | 0.03 | 0.03 | 0.03 | 0.03 | 0.003 | 0.004 |
| Pb | 0.0025 | 1.95 | 0.58 | 1.03 | 0.82 | 0.42 | 0.52 | 0.77 | 0.74 | 3.32 | 1.98 | 1.36 | 0.88 | 0.51 | 0.22 |
| U | 0.00025 | <DL | <DL | 0.04 | <DL | <DL | <DL | <DL | <DL | <DL | <DL | <DL | 0.03 | <DL | <DL |
| Element | Tea No. 1 | Tea No. 2 | Tea No. 3 | Tea No. 4 | Tea No. 5 | Tea No. 6 | Tea No. 7 | |||||||
|---|---|---|---|---|---|---|---|---|---|---|---|---|---|---|
| 15 min | 45 min | 15 min | 45 min | 15 min | 45 min | 15 min | 45 min | 15 min | 45 min | 15 min | 45 min | 15 min | 45 min | |
| Al | 8 | 7 | 15 | 9 | 0 | 1 | 1 | 1 | 2 | 4 | 15 | 15 | 0 | 0 |
| Ca | 17 | 19 | 21 | 23 | 12 | 18 | 28 | 31 | 51 | 62 | 27 | 30 | 16 | 19 |
| Fe | 26 | 15 | 17 | 16 | 3 | 4 | 1 | 2 | 11 | 7 | 10 | 7 | 2 | 2 |
| K | 96 | 95 | 96 | 98 | 100 | 100 | 100 | 100 | 88 | 91 | 100 | 86 | 100 | 100 |
| Mg | 52 | 63 | 65 | 66 | 44 | 57 | 60 | 64 | 57 | 64 | 56 | 61 | 46 | 53 |
| P | 54 | 56 | 57 | 53 | 51 | 56 | 10 | 57 | 34 | 37 | 46 | 40 | 57 | 56 |
| S | 53 | 49 | 47 | 35 | 41 | 63 | 0 | 65 | 29 | 33 | 42 | 42 | 43 | 41 |
| Si | 65 | 15 | 60 | 0 | 0 | 78 | 6 | 9 | 0 | 0 | 36 | 32 | 28 | 0 |
| Ti | 26 | 4 | 7 | 4 | 1 | 1 | 1 | 5 | 6 | 1 | 0 | 0 | 0 | 0 |
| V | 76 | 2 | 54 | 23 | 18 | 20 | 18 | 12 | 16 | 5 | 32 | 18 | 15 | 9 |
| Cr | 43 | 47 | 37 | 55 | 17 | 37 | 8 | 13 | 26 | 23 | 20 | 20 | 10 | 11 |
| Mn | 57 | 65 | 54 | 62 | 38 | 45 | 33 | 40 | 70 | 86 | 44 | 44 | 35 | 45 |
| Co | 69 | 62 | 65 | 82 | 59 | 76 | 57 | 62 | 45 | 51 | 45 | 48 | 53 | 59 |
| Ni | 62 | 60 | 64 | 83 | 44 | 78 | 54 | 68 | 38 | 46 | 61 | 61 | ||
| Cu | 48 | 49 | 40 | 36 | 36 | 56 | 23 | 57 | 16 | 37 | 30 | 22 | 41 | 57 |
| Zn | 34 | 31 | 38 | 49 | 46 | 57 | 26 | 37 | 49 | 56 | 27 | 29 | 45 | 50 |
| Ga | 0 | 3 | 15 | 20 | 0 | 0 | 0 | 0 | 4 | 0 | 7 | 0 | 0 | 0 |
| As | 92 | 57 | 94 | 100 | 49 | 52 | 45 | 43 | 93 | 77 | 80 | 63 | 41 | 47 |
| Rb | 91 | 100 | 94 | 100 | 97 | 100 | 100 | 100 | 80 | 85 | 98 | 100 | 91 | 95 |
| Sr | 23 | 28 | 31 | 35 | 6 | 12 | 22 | 25 | 60 | 65 | 20 | 25 | 8 | 5 |
| Y | 78 | 58 | 43 | 50 | 19 | 36 | 7 | 19 | 21 | 23 | 21 | 25 | 15 | 24 |
| Zr | 0 | 0 | 0 | 0 | 4 | 40 | 6 | 17 | 13 | 7 | 11 | 38 | 2 | 5 |
| Mo | 15 | 13 | 9 | 1 | 0 | 7 | 16 | 13 | 21 | 15 | 0 | 0 | 7 | 0 |
| Cd | 34 | 26 | 23 | 36 | 8 | 27 | 9 | 15 | 48 | 57 | 17 | 20 | 17 | 10 |
| Sb | 24 | 9 | 6 | 18 | 0 | 43 | 0 | 53 | 22 | 16 | 13 | 22 | 47 | 9 |
| Cs | 88 | 100 | 82 | 96 | 53 | 73 | 66 | 58 | 65 | 68 | 85 | 95 | 33 | 28 |
| Ba | 22 | 33 | 24 | 35 | 11 | 24 | 18 | 32 | 56 | 69 | 14 | 21 | 10 | 18 |
| La | 30 | 28 | 15 | 21 | 4 | 16 | 2 | 0 | 13 | 11 | 6 | 13 | 2 | 11 |
| Ce | 48 | 32 | 22 | 10 | 4 | 14 | 2 | 8 | 13 | 10 | 7 | 11 | 3 | 11 |
| Pr | 43 | 37 | 21 | 27 | 6 | 17 | 3 | 9 | 11 | 12 | 10 | 14 | 5 | 11 |
| Nd | 53 | 42 | 26 | 30 | 10 | 22 | 4 | 10 | 14 | 15 | 12 | 15 | 9 | 14 |
| Sm | 0 | 0 | 29 | 35 | 11 | 27 | 4 | 10 | 13 | 16 | 12 | 15 | 6 | 14 |
| Eu | 0 | 0 | 0 | 0 | 13 | 23 | 14 | 21 | 0 | 0 | 17 | 20 | 10 | 18 |
| Gd | 0 | 0 | 34 | 39 | 16 | 30 | 6 | 14 | 19 | 18 | 17 | 21 | 11 | 19 |
| Yb | 0 | 0 | 0 | 0 | 0 | 0 | 10 | 18 | 0 | 0 | 21 | 22 | 15 | 15 |
| W | 5 | 0 | 13 | 5 | 0 | 56 | 0 | 6 | 54 | 48 | 7 | 3 | 0 | 0 |
| Tl | 0 | 0 | 0 | 0 | 0 | 0 | 54 | 46 | 68 | 69 | 79 | 84 | 0 | 0 |
| Pb | 70 | 74 | 59 | 36 | 45 | 71 | 68 | 35 | 21 | 30 | 19 | 30 | 12 | |
| Element | Pb | Cu | Zn | As | Cd |
|---|---|---|---|---|---|
| Detection limit, μg/L | 0.01 | 0.5 | 2 | 0.1 | 0.02 |
| Used water | 0.59 | 2.6 | 28 | <DL | <DL |
| Tea No 1 | 2.9 | 71 | 156 | 0.5 | 0.2 |
| Tea No 2 | 3.9 | 60 | 286 | 1 | 0.52 |
| Tea No 3 | 2.7 | 34 | 139 | 0.5 | 0.06 |
| Tea No 4 | 3.5 | 44 | 149 | 0.6 | 0.14 |
| Tea No 5 | 8.5 | 59 | 417 | 1.2 | 0.97 |
| Tea No 6 | 4.1 | 24 | 141 | 1.1 | 0.69 |
| Tea No 7 | 1.5 | 35 | 129 | 0.5 | 0.04 |
| Russia * | 300 | 3000 | 10000 | 100 | 30 |
| WHO **, mg/kg | 10 | - | - | 10 | 0.3 |
| DRI ***, mg/d ** | - | 700–900 | 8.0–11 | - | - |
| Element | Tisanes No. | Concentration, mg/g (in Dry Mix) | Content in 250 mL (Option 1) | Content in 250 mL (Option 2) | Recovery in the Infusion (Option 1) | References | |||
|---|---|---|---|---|---|---|---|---|---|
| % of Daily Needs | % of Daily Needs | Recovery in the Infusion (Option 2) | |||||||
| K mg | 1 2 3 4 5 6 7 | 9.15 9.63 11.60 15.50 10.10 9.54 11.03 | 70.54 74.14 30.74 38.86 70.71 25.26 29.61 | 2.7 2.8 1.0 1.5 2.7 0.9 1.0 | 69.39 75.41 32.76 40.86 72.84 20.61 28.31 | 2.6 2.9 1.0 1.5 2.8 0.8 1.1 | 96 96 100 100 88 100 100 | 95 98 100 100 91 86 100 | >55% [42,43] 73% [44] min 82.82– max 93.09% [45] 28% [46] |
| Mg mg | 1 2 3 4 5 6 7 | 1.82 1.64 2.06 2.67 0.99 2.33 1.69 | 7.54 8.54 2.29 4.03 4.49 3.29 1.96 | 2.3 2.6 0.7 1.3 1.4 1.0 0.6 | 9.23 8.71 2.92 4.28 5.04 3.57 2.22 | 2.8 2.7 0.9 1.3 1.5 1.0 0.6 | 52 65 44 60 57 56 46 | 63 66 57 64 64 61 53 | 48.11 min–88.41 max% [45] 38% [44] 20–55% [43] |
| Ca mg | 1 2 3 4 5 6 7 | 7.63 6.84 11.10 13.10 2.17 5.51 9.09 | 10.52 11.74 3.31 9.27 8.78 3.68 3.69 | 1.1 1.2 0.3 0.9 0.9 0.4 0.4 | 11.77 12.64 5.06 10.27 10.79 4.12 4.40 | 1.2 1.3 0.5 1.0 1.1 0.4 0.4 | 17 21 12 28 51 27 16 | 19 23 18 31 62 30 19 | 19 min–54.8 max% [45] 18%–[44] |
| P mg | 1 2 3 4 5 6 7 | 1.39 1.23 1.34 1.79 1.76 1.46 1.52 | 5.97 5.59 1.71 0.44 4.78 1.70 2.16 | 0.9 0.8 0.2 0.1 0.7 0.2 0.3 | 6.19 5.22 1.87 2.55 5.27 1.47 2.14 | 0.9 0.7 0.3 0.4 0.8 0.2 0.3 | 54 57 51 10 34 46 57 | 56 53 56 57 37 40 56 | 43%–[44] 20–55%–[43] |
| Fe mg | 1 2 3 4 5 6 7 | 0.03 0.04 0.13 0.17 0.10 0.13 0.17 | 0.07 0.05 0.01 0.01 0.09 0.03 0.01 | 0.8 0.7 0.1 0.1 1.1 0.4 0.1 | 0.04 0.05 0.02 0.01 0.06 0.03 0.01 | 0.5 0.7 0.2 0.1 0.8 0.3 0.2 | 26 17 3 1 11 10 2 | 15 16 4 2 7 7 2 | 1.12 min–7.95 max% [45] 10%–[44] |
| Cr mg | 1 2 3 4 5 6 7 | 0.27 0.36 0.45 1.10 0.68 0.64 1.00 | 0.91 1.07 0.19 0.21 1.41 0.31 0.25 | 3.6 4.2 0.8 0.8 5.6 1.2 1.0 | 0.99 1.59 0.42 0.36 1.27 0.33 0.27 | 3.9 6.3 1.7 1.4 5.0 1.3 1.0 | 43 37 17 8 26 20 10 | 47 55 37 13 23 20 11 | 20–55% [42] |
| Cu mg | 1 2 3 4 5 6 7 | 4.4 5.0 5.7 7.4 4.7 9.5 5.8 | 16.87 16.13 5.07 4.33 6.05 7.27 5.88 | 1.8 1.7 0.5 0.47 0.67 0.80 0.64 | 17.19 14.37 7.97 10.48 14.10 5.24 8.17 | 1.9 1.6 0.9 1.2 1.6 0.6 0.9 | 48 40 36 23 16 30 41 | 49 36 56 57 37 22 57 | 11.04 min–70.11 max% [45] 33% [44] 20–55% [42] |
| Mn μg | 1 2 3 4 5 6 7 | 59 64 49 71 23 344 130 | 268.19 277.16 47.19 58.91 128.54 382.45 114.27 | 14.9 15.39 2.62 3.27 7.14 21.24 6.34 | 304.83 317.83 54.86 71.22 157.70 380.94 147.17 | 16.0 17.6 3.0 3.9 8.7 21.1 8.2 | 57 54 38 33 70 44 35 | 65 62 45 40 86 44 45 | min 29.48–max 60.15% [45] 24% [44] 20–55% [43] 20–55% [42] |
| Mo μg | 1 2 3 4 5 6 7 | 0.3 0.2 0.3 0.6 1.0 0.2 0.7 | 0.38 0.17 0.000 0.25 1.77 0.00 0.12 | 0.84 0.386 0.00 0.564 3.93 0.00 0.27 | 0.39 0.06 0.11 0.26 1.33 0.00 0.00 | 0.9 0.1 0.2 0.6 2.9 0.0 0.0 | 15 9 0 16 21 0 7 | 13 1 7 13 15 0 0 | <20% [43] |
| Zn μg | 1 2 3 4 5 6 7 | 13 17 20 33 22 39 20 | 35.27 50.25 22.35 21.81 85.83 26.25 22.73 | 0.44 0.63 0.27 0.27 1.07 0.30 0.28 | 32.01 64.61 27.87 30.22 97.29 28.33 25.21 | 0.4 0.8 0.4 0.4 1.2 0.4 0.3 | 34 38 46 26 49 27 45 | 31 49 57 37 56 29 50 | 36% [44] 4.6–73.7% [45] 20–55% [43] |
| Se μg | 1 2 3 4 5 6 7 | <DL <DL <DL 0.17 0.31 <DL <DL | 0.00 0.00 0.00 0.00 0.00 0.00 0.00 | 0.000 0.000 0.000 0.000 0.000 0.000 0.000 | 0.00 0.00 0.00 0.00 0.59 0.00 0.00 | 0.0 0.0 0.0 0.0 1.1 0.0 0.0 | 0 0 0 0 0 0 0 | 0 0 0 0 23 0 0 |
| Element | Ca | Fe | K | Mg | P | S | Si | Mn | Co | Ni | Cu | Zn | Se | Mo |
|---|---|---|---|---|---|---|---|---|---|---|---|---|---|---|
| Ca | 1 | |||||||||||||
| Fe | 0.77 | 1.00 | ||||||||||||
| K | 0.95 | 0.89 | 1.00 | |||||||||||
| Mg | 0.90 | 0.76 | 0.89 | 1.00 | ||||||||||
| P | 0.92 | 0.87 | 0.97 | 0.92 | 1.00 | |||||||||
| S | 0.84 | 0.66 | 0.81 | 0.64 | 0.78 | 1.00 | ||||||||
| Si | −0.18 | −0.25 | −0.17 | −0.12 | −0.22 | 0.04 | 1.00 | |||||||
| Mn | 0.44 | 0.59 | 0.46 | 0.68 | 0.52 | 0.22 | −0.15 | 1.00 | ||||||
| Co | 0.81 | 0.65 | 0.80 | 0.86 | 0.75 | 0.41 | −0.09 | 0.53 | 1.00 | |||||
| Ni | 0.87 | 0.89 | 0.89 | 0.91 | 0.85 | 0.59 | −0.20 | 0.67 | 0.87 | 1.00 | ||||
| Cu | 0.95 | 0.78 | 0.96 | 0.91 | 0.97 | 0.84 | −0.11 | 0.46 | 0.77 | 0.80 | 1.00 | |||
| Zn | 0.70 | 0.90 | 0.81 | 0.52 | 0.72 | 0.72 | −0.23 | 0.31 | 0.49 | 0.72 | 0.68 | 1.00 | ||
| Se | −0.65 | −0.48 | −0.62 | −0.58 | −0.57 | −0.69 | −0.25 | −0.52 | −0.55 | −0.51 | −0.70 | −0.52 | 1.00 | |
| Mo | 0.47 | 0.65 | 0.57 | 0.24 | 0.56 | 0.74 | −0.21 | −0.05 | 0.00 | 0.34 | 0.50 | 0.79 | −0.20 | 1.00 |
| Element | Y | La | Ce | Pr | Nd | Sm | Eu | Gd | Tb | Dy | Ho | Er | Tm | Yb | Lu |
|---|---|---|---|---|---|---|---|---|---|---|---|---|---|---|---|
| Y | 1.00 | ||||||||||||||
| La | 0.96 | 1.00 | |||||||||||||
| Ce | 0.45 | 0.43 | 1.00 | ||||||||||||
| Pr | 0.99 | 0.95 | 0.47 | 1.00 | |||||||||||
| Nd | 1.00 | 0.95 | 0.47 | 1.00 | 1.00 | ||||||||||
| Sm | 0.99 | 0.97 | 0.47 | 0.99 | 1.00 | 1.00 | |||||||||
| Eu | 0.92 | 0.81 | 0.67 | 0.91 | 0.92 | 0.90 | 1.00 | ||||||||
| Gd | 1.00 | 0.96 | 0.48 | 1.00 | 1.00 | 1.00 | 0.91 | 1.00 | |||||||
| Tb | 0.97 | 0.96 | 0.39 | 0.98 | 0.97 | 0.97 | 0.84 | 0.97 | 1.00 | ||||||
| Dy | 1.00 | 0.95 | 0.46 | 1.00 | 1.00 | 0.99 | 0.91 | 1.00 | 0.96 | 1.00 | |||||
| Ho | 1.00 | 0.96 | 0.48 | 0.99 | 1.00 | 0.99 | 0.92 | 0.99 | 0.97 | 0.99 | 1.00 | ||||
| Er | 1.00 | 0.96 | 0.44 | 0.99 | 0.99 | 0.99 | 0.91 | 0.99 | 0.97 | 1.00 | 0.99 | 1.00 | |||
| Tm | 0.55 | 0.58 | −0.36 | 0.56 | 0.55 | 0.55 | 0.25 | 0.54 | 0.68 | 0.53 | 0.56 | 0.55 | 1.00 | ||
| Yb | 0.98 | 0.93 | 0.48 | 0.96 | 0.97 | 0.97 | 0.94 | 0.97 | 0.93 | 0.98 | 0.98 | 0.99 | 0.46 | 1.00 | |
| Lu | 0.75 | 0.75 | −0.19 | 0.76 | 0.75 | 0.74 | 0.48 | 0.74 | 0.82 | 0.74 | 0.75 | 0.75 | 0.95 | 0.68 | 1.00 |
Publisher’s Note: MDPI stays neutral with regard to jurisdictional claims in published maps and institutional affiliations. |
© 2021 by the authors. Licensee MDPI, Basel, Switzerland. This article is an open access article distributed under the terms and conditions of the Creative Commons Attribution (CC BY) license (https://creativecommons.org/licenses/by/4.0/).
Share and Cite
Lavrinenko, Y.; Plieva, A.; Zinicovscaia, I.; Hristozova, G.; Frontasyeva, M.; Tkachenko, K.; Dogadkin, D.N.; Gromyak, I.N.; Kolotov, V.P. Elemental Composition of Infusions of Herbs (Tisanes) of North Ossetia (the Caucasus). Agriculture 2021, 11, 841. https://doi.org/10.3390/agriculture11090841
Lavrinenko Y, Plieva A, Zinicovscaia I, Hristozova G, Frontasyeva M, Tkachenko K, Dogadkin DN, Gromyak IN, Kolotov VP. Elemental Composition of Infusions of Herbs (Tisanes) of North Ossetia (the Caucasus). Agriculture. 2021; 11(9):841. https://doi.org/10.3390/agriculture11090841
Chicago/Turabian StyleLavrinenko, Yuliya, Anna Plieva, Inga Zinicovscaia, Gergana Hristozova, Marina Frontasyeva, Kirill Tkachenko, Denis N. Dogadkin, Irina N. Gromyak, and Vladimir P. Kolotov. 2021. "Elemental Composition of Infusions of Herbs (Tisanes) of North Ossetia (the Caucasus)" Agriculture 11, no. 9: 841. https://doi.org/10.3390/agriculture11090841
APA StyleLavrinenko, Y., Plieva, A., Zinicovscaia, I., Hristozova, G., Frontasyeva, M., Tkachenko, K., Dogadkin, D. N., Gromyak, I. N., & Kolotov, V. P. (2021). Elemental Composition of Infusions of Herbs (Tisanes) of North Ossetia (the Caucasus). Agriculture, 11(9), 841. https://doi.org/10.3390/agriculture11090841