
Context Specificity and Time Dependency in Classifying Sub-Saharan Africa Dairy Cattle Farmers for Targeted Extension Farm Advice: The Case of Uganda

 , , , and
Abstract
:1. Introduction
2. Materials and Methods
2.1. Data Collection and Study Area
2.2. Variable Selection
2.3. Statistical Analyses
3. Results
3.1. General Characteristics of the Dairy Cattle Farmers
3.2. Identification of Current Dairy Cattle Production Systems
3.2.1. Cluster 1
3.2.2. Cluster 2
3.2.3. Cluster 3
4. Discussion
5. Conclusions
Author Contributions
Funding
Institutional Review Board Statement
Informed Consent Statement
Data Availability Statement
Conflicts of Interest
References
- Aker, J.C. Dial “A” for agriculture: A review of information and communication technologies for agricultural extension in developing countries. Agric. Econ. 2011, 42, 631–647. [Google Scholar] [CrossRef]
- Kondylis, F.; Mueller, V.; Zhu, J. Seeing is believing? Evidence from an extension network experiment. J. Dev. Econ. 2017, 125, 1–20. [Google Scholar] [CrossRef] [Green Version]
- McIntyre, B.D.; Herren, H.R.; Wakhungu, J.; Watson, R.T. Agriculture at a crossroads: Global report. In International Assessment of Agricultural Knowledge, Science and Technology for Development (IAASTD); Island Press: Washington, DC, USA, 2009. [Google Scholar]
- Ssozi, J.; Asongu, S.; Amavilah, V.H. The effectiveness of development aid for agriculture in Sub-Saharan Africa. J. Econ. Stud. 2019, 46, 284–305. [Google Scholar] [CrossRef] [Green Version]
- Brandt, P.; Yesuf, G.; Herold, M.; Rufino, M.C. Intensification of dairy production can increase the GHG mitigation potential of the land use sector in East Africa. Glob. Chang. Biol. 2020, 26, 568–585. [Google Scholar] [CrossRef] [PubMed] [Green Version]
- Britt, J.; Cushman, R.; Dechow, C.; Dobson, H.; Humblot, P.; Hutjens, M.; Jones, G.A.; Ruegg, P.S.; Sheldon, I.M.; Stevenson, J.S. Invited review: Learning from the future—A vision for dairy farms and cows in 2067. J. Dairy Sci. 2018, 101, 3722–3741. [Google Scholar] [CrossRef] [Green Version]
- Adzawla, W.; Sawaneh, M.; Yusuf, A.M. Greenhouse gasses emission and economic growth nexus of sub-Saharan Africa. Sci. Afr. 2019, 3, e00065. [Google Scholar] [CrossRef]
- Riggs, P.K.; Fields, M.J.; Cross, H.R. Food and Nutrient Security for a Growing Population. Anim. Front. 2018, 8, 3–4. [Google Scholar] [CrossRef] [PubMed]
- Fróna, D.; Szenderák, J.; Harangi-Rákos, M. The challenge of feeding the world. Sustainability 2019, 11, 5816. [Google Scholar] [CrossRef] [Green Version]
- Hatab, A.A.; Cavinato, M.E.R.; Lagerkvist, C.J. Urbanization, livestock systems and food security in developing countries: A systematic review of the literature. Food Secur. 2019, 11, 279–299. [Google Scholar] [CrossRef] [Green Version]
- Herrero, M.; Havlik, P.; McIntire, J.; Palazzo, A.; Valin, H. African Livestock Futures: Realizing the Potential of Livestock for Food Security, Poverty Reduction and the Environment in Sub-Saharan Africa; Office of the Special Representative of the UN Secretary General for Food Security and Nutrition and the United Nations System Influenza Coordination (UNSIC): Geneva, Switzerland, 2014. [Google Scholar]
- Thornton, P.K.; Jones, P.G.; Ericksen, P.J.; Challinor, A.J. Agriculture and food systems in sub-Saharan Africa in a 4 C+ world. Philos. Trans. R. Soc. A Math. Phys. Eng. Sci. 2011, 369, 117–136. [Google Scholar] [CrossRef] [PubMed] [Green Version]
- Rosegrant, M.W.; Fernández, M.; Sinha, A.; Alder, J.; Ahammad, H.; Fraiture, C.; Eickhout, B.; Fonseca, J.; Huang, J. Looking into the Future for Agriculture and AKST (Agricultural Knowledge Science and Technology); Island Press: Washington, DC, USA, 2009; pp. 307–376. [Google Scholar]
- Shiferaw, B.; Hellin, J.; Muricho, G. Improving market access and agricultural productivity growth in Africa: What role for producer organizations and collective action institutions? Food Secur. 2011, 3, 475–489. [Google Scholar] [CrossRef]
- Asfaw, S.; Shiferaw, B.; Simtowe, F.; Lipper, L. Impact of modern agricultural technologies on smallholder welfare: Evidence from Tanzania and Ethiopia. Food Policy 2012, 37, 283–295. [Google Scholar] [CrossRef] [Green Version]
- Elias, A.; Nohmi, M.; Yasunobu, K.; Ishida, A. Effect of agricultural extension program on smallholders’ farm productivity: Evidence from three peasant associations in the highlands of Ethiopia. J. Agric. Sci. 2013, 5, 163. [Google Scholar] [CrossRef] [Green Version]
- Kansiime, M.K.; Alawy, A.; Allen, C.; Subharwal, M.; Jadhav, A.; Parr, M. Effectiveness of mobile agri-advisory service extension model: Evidence from Direct2Farm program in India. World Dev. Perspect. 2019, 13, 25–33. [Google Scholar] [CrossRef]
- Mariyono, J. Farmer training to simultaneously increase productivity of soybean and rice in Indonesia. Int. J. Product. Perform. Manag. 2019, 68, 1120–1140. [Google Scholar] [CrossRef]
- Danso-Abbeam, G.; Ehiakpor, D.S.; Aidoo, R. Agricultural extension and its effects on farm productivity and income: Insight from Northern Ghana. Agric. Food Secur. 2018, 7, 74. [Google Scholar] [CrossRef]
- Butt, T.M.; Mahmood, K.; Muhammad, S. Working of commodity specialized extension approach followed by sugar mills in Faisalabad, Pakistan. J. Agric. Soc. Sci. 2005, 1, 252–254. [Google Scholar]
- Wossen, T.; Abdoulaye, T.; Alene, A.; Haile, M.G.; Feleke, S.; Olanrewaju, A.; Manyong, V. Impacts of extension access and cooperative membership on technology adoption and household welfare. J. Rural Stud. 2017, 54, 223–233. [Google Scholar] [CrossRef] [PubMed]
- Agbarevo, M.N.B. Farmers’ perception of effectiveness of agricultural extension delivery in cross-river state, Nigeria. IOSR J. Agric. Vet. Sci. 2013, 2, 1–7. [Google Scholar] [CrossRef]
- Feder, G.; Birner, R.; Anderson, J.R. The private sector’s role in agricultural extension systems: Potential and limitations. J. Agribus. Dev. Emerg. Econ. 2011, 1, 31–54. [Google Scholar] [CrossRef]
- Elahi, E.; Abid, M.; Zhang, L.; Ul Haq, S.; Sahito, J.G.M. Agricultural advisory and financial services; farm level access, outreach and impact in a mixed cropping district of Punjab, Pakistan. Land Use Policy 2018, 71, 249–260. [Google Scholar] [CrossRef]
- Nettle, R.; Crawford, A.; Brightling, P. How private-sector farm advisors change their practices: An Australian case study. J. Rural. Stud. 2018, 58, 20–27. [Google Scholar] [CrossRef]
- Davis, K. Extension in sub-Saharan Africa: Overview and assessment of past and current models and future prospects. J. Int. Agric. Ext. Educ. 2008, 15, 15–28. [Google Scholar]
- Rivera, W.M.; Qamar, M.K.; Van Crowder, L. Agricultural and rural extension worldwide: Options for institutional reform in the developing countries. In Agricultural and Rural Extension Worldwide: Options for Institutional Reform in the Developing Countries; FAO: Rome, Italy, 2002; p. 54. [Google Scholar]
- Davis, K.; Nkonya, E.; Kato, E.; Mekonnen, D.A.; Odendo, M.; Miiro, R.; Nkuba, J. Impact of farmer field schools on agricultural productivity and poverty in East Africa. World Dev. 2012, 40, 402–413. [Google Scholar] [CrossRef] [Green Version]
- Baloch, M.A.; Thapa, G.B. Review of the agricultural extension modes and services with the focus to Balochistan, Pakistan. J. Saudi Soc. Agric. Sci. 2019, 18, 188–194. [Google Scholar] [CrossRef]
- Goswami, R.; Chatterjee, S.; Prasad, B. Farm types and their economic characterization in complex agro-ecosystems for informed extension intervention: Study from coastal West Bengal, India. Agric. Food Econ. 2014, 2, 5. [Google Scholar] [CrossRef] [Green Version]
- Hernández-Castellano, L.E.; Nally, J.E.; Lindahl, J.; Wanapat, M.; Alhidary, I.A.; Fangueiro, D.; Grace, D.; Ratto, M.; Bambou, J.C.; De Almeida, A.M. Dairy Science and Health in the Tropics: Challenges and Opportunities for the Next Decades; Springer: Berlin/Heidelberg, Germany, 2019. [Google Scholar]
- Opoola, O.; Mrode, R.; Banos, G.; Ojango, J.; Banga, C.; Simm, G.; Chagunda, M.G.G. Current situations of animal data recording, dairy improvement infrastructure, human capacity and strategic issues affecting dairy production in sub-Saharan Africa. Trop. Anim. Health Prod. 2019, 51, 1699–1705. [Google Scholar] [CrossRef] [PubMed] [Green Version]
- Temoso, O.; Villano, R.; Hadley, D. Evaluating the productivity gap between commercial and traditional beef production systems in Botswana. Agric. Syst. 2016, 149, 30–39. [Google Scholar] [CrossRef]
- Köbrich, C.; Rehman, T.; Khan, M. Typification of farming systems for constructing representative farm models: Two illustrations of the application of multi-variate analyses in Chile and Pakistan. Agric. Syst. 2003, 76, 141–157. [Google Scholar] [CrossRef]
- Thornton, P.K.; van de Steeg, J.; Notenbaert, A.; Herrero, M. The impacts of climate change on livestock and livestock systems in developing countries: A review of what we know and what we need to know. Agric. Syst. 2009, 101, 113–127. [Google Scholar] [CrossRef]
- Descheemaeker, K.; Ronner, E.; Ollenburger, M.; Franke, A.C.; Klapwijk, C.J.; Falconnier, G.N.; Wichern, J.; Giller, K.E. Which options fit best? Operationalizing the socio-ecological niche concept. Exp. Agric. 2019, 55, 169–190. [Google Scholar] [CrossRef] [Green Version]
- Ibidhi, R.; Frija, A.; Jaouad, M.; Salem, H.B. Typology analysis of sheep production, feeding systems and farmers strategies for livestock watering in Tunisia. Small Rumin. Res. 2018, 160, 44–53. [Google Scholar] [CrossRef]
- Otte, J.; Chilonda, P. Classification of cattle and small ruminant production systems in sub-Saharan Africa. Outlook Agric. 2003, 32, 183–190. [Google Scholar] [CrossRef]
- Riveiro, J.; Mantecón, A.; Álvarez, C.; Lavín, P. A typological characterization of dairy Assaf breed sheep farms at NW of Spain based on structural factor. Agric. Syst. 2013, 120, 27–37. [Google Scholar] [CrossRef]
- Toro-Mujica, P.; Aguilar, C.; Vera, R.; Rivas, J.; García, A. Sheep production systems in the semi-arid zone: Changes and simulated bio-economic performances in a case study in Central Chile. Livest. Sci. 2015, 180, 209–219. [Google Scholar] [CrossRef]
- De Figueiredo, G.R.; Lima, A.M.C.; Alves, J.R.A.; da Costa, D.F.; Pinheiro, R.R.; Alves, F.S.F.; de Azevedo, S.S.; Alves, C.J. Characterization and typology of sheep and goat production systems in the State of Paraíba, a semi-arid region of northeastern Brazil. Semin. Ciências Agrárias 2017, 38, 2163–2178. [Google Scholar]
- Gelasakis, A.; Rose, G.; Giannakou, R.; Valergakis, G.; Theodoridis, A.; Fortomaris, P.; Arsenos, G. Typology and characteristics of dairy goat production systems in Greece. Livest. Sci. 2017, 197, 22–29. [Google Scholar] [CrossRef]
- Gelasakis, A.I.; Valergakis, G.; Arsenos, G.; Banos, G. Description and typology of intensive Chios dairy sheep farms in Greece. J. Dairy Sci. 2012, 95, 3070–3079. [Google Scholar] [CrossRef] [PubMed]
- Rivas, J.; Perea, J.; Angón, E.; Barba, C.; Morantes, M.; Dios-Palomares, R.; García, A. Diversity in the dry land mixed system and viability of dairy sheep farming. Ital. J. Anim. Sci. 2015, 14, 3513. [Google Scholar] [CrossRef]
- Castel, J.; Mena, Y.; Delgado-Pertıñez, M.; Camúñez, J.; Basulto, J.; Caravaca, F.; Guerrero, Y.M.; Alcalde, M.J. Characterization of semi-extensive goat production systems in southern Spain. Small Rumin. Res. 2003, 47, 133–143. [Google Scholar] [CrossRef]
- De Glanville, W.A.; Davis, A.; Allan, K.J.; Buza, J.; Claxton, J.R.; Crump, J.A.; Halliday, J.E.; Johnson, P.C.; Kibona, T.J.; Mmbaga, B.T.; et al. Classification and characterisation of livestock production systems in northern Tanzania. PLoS ONE 2020, 15, e0229478. [Google Scholar] [CrossRef]
- Hammond, J.; Rosenblum, N.; Breseman, D.; Gorman, L.; Manners, R.; van Wijk, M.T.; Sibomana, M.; Remans, R.; Vanlauwe, B.; Schut, M. Towards actionable farm typologies: Scaling adoption of agricultural inputs in Rwanda. Agric. Syst. 2020, 183, 102857. [Google Scholar] [CrossRef]
- Alvarez, S.; Timler, C.J.; Michalscheck, M.; Paas, W.; Descheemaeker, K.; Tittonell, P.; Andersson, J.A.; Groot, J.C. Capturing farm diversity with hypothesis-based typologies: An innovative methodological framework for farming system typology development. PLoS ONE 2018, 13, e0194757. [Google Scholar] [CrossRef] [PubMed] [Green Version]
- Kuivanen, K.; Alvarez, S.; Michalscheck, M.; Adjei-Nsiah, S.; Descheemaeker, K.; Mellon-Bedi, S.; Groot, J.C. Characterising the diversity of smallholder farming systems and their constraints and opportunities for innovation: A case study from the Northern Region, Ghana. NJAS-Wagening. J. Life Sci. 2016, 78, 153–166. [Google Scholar] [CrossRef]
- Defante, L.; Damasceno, J.C.; Bánkuti, F.I.; Ramos, C.E.C.O. Typology of dairy production systems that meet Brazilian standards for milk quality. Rev. Bras. Zootec. 2019, 48. [Google Scholar] [CrossRef] [Green Version]
- Genís, J.M.C.; Madry, W.; Gozdowski, D.; Roszkowska-Madra, B.; Dabrowski, M.; Lupa, W.; Guerrero, Y.M. Family dairy farms in the Podlasie province, Poland: Farm typology according to farming system. Span. J. Agric. Res. 2010, 8, 946–961. [Google Scholar]
- Maseda, F.; Dıaz, F.; Alvarez, C. Family dairy farms in Galicia (NW Spain): Classification by some family and farm factors relevant to quality of life. Biosyst. Eng. 2004, 87, 509–521. [Google Scholar] [CrossRef]
- Ramírez-Rivera, E.; Rodríguez-Miranda, J.; Huerta-Mora, I.; Cárdenas-Cágal, A.; Juárez-Barrientos, J.M. Tropical milk production systems and milk quality: A review. Trop. Anim. Health Prod. 2019, 51, 1295–1305. [Google Scholar] [CrossRef]
- Klerkx, L.; Landini, F.; Santoyo-Cortés, H. Agricultural Extension in Latin America: Current Dynamics of Pluralistic Advisory Systems in Heterogeneous Contexts. J. Agric. Educ. Ext. 2016, 22, 389–397. [Google Scholar] [CrossRef] [Green Version]
- Lacoste, M.; Lawes, R.; Ducourtieux, O.; Flower, K. Assessing regional farming system diversity using a mixed methods typology: The value of comparative agriculture tested in broadacre Australia. Geoforum 2018, 90, 183–205. [Google Scholar] [CrossRef]
- Gonzalez-Mejia, A.; Styles, D.; Wilson, P.; Gibbons, J. Metrics and methods for characterizing dairy farm intensification using farm survey data. PLoS ONE 2018, 13, e0195286. [Google Scholar]
- Bánkuti, F.; Prizon, R.; Damasceno, J.; De Brito, M.; Pozza, M.; Lima, P. Farmers’ actions toward sustainability: A typology of dairy farms according to sustainability indicators. Animal 2020, 14, s417–s423. [Google Scholar] [CrossRef] [PubMed]
- Baral, S.; Bardhan, D. Multivariate Typology of Milk Producing Households in Uttarakhand Hills: Explaining Profitability in Dairy Farming. Indian J. Agric. Econ. 2016, 71, 160–175. [Google Scholar]
- López, C.J.Á.; Valiño, J.A.R.; Pérez, M.M. Typology, classification and characterization of farms for agricultural production planning. Span. J. Agric. Res. 2008, 6, 125–136. [Google Scholar] [CrossRef] [Green Version]
- Belanche, A.; Martín-García, A.I.; Fernández-Álvarez, J.; Pleguezuelos, J.; Mantecón, Á.R.; Yáñez-Ruiz, D.R. Optimizing management of dairy goat farms through individual animal data interpretation: A case study of smart farming in Spain. Agric. Syst. 2019, 173, 27–38. [Google Scholar] [CrossRef]
- Alemu, A.W.; Amiro, B.D.; Bittman, S.; MacDonald, D.; Ominski, K.H. A typological characterization of Canadian beef cattle farms based on a producer survey. Can. J. Anim. Sci. 2016, 96, 187–202. [Google Scholar] [CrossRef]
- Gökdai, A.; Magrin, L.; Sakarya, E.; Contiero, B.; Gottardo, F. Characterization and typologies of dairy goat farms in the Mediterranean region: A case of Italy and Turkey. Small Rumin. Res. 2020, 191, 106196. [Google Scholar] [CrossRef]
- Bereda, A.; Yilma, Z.; Nurfeta, A. Dairy production system and constraints in Ezha districts of the Gurage zone, Southern Ethiopia. Glob. Vet. 2014, 12, 181–186. [Google Scholar]
- Kostrowicki, J. Agricultural typology concept and method. Agric. Syst. 1977, 2, 33–45. [Google Scholar] [CrossRef]
- Valbuena, D.; Groot, J.C.; Mukalama, J.; Gérard, B.; Tittonell, P. Improving rural livelihoods as a “moving target”: Trajectories of change in smallholder farming systems of Western Kenya. Reg. Environ. Chang. 2015, 15, 1395–1407. [Google Scholar] [CrossRef] [Green Version]
- Landais, E. Modelling farm diversity: New approaches to typology building in France. Agric. Syst. 1998, 58, 505–527. [Google Scholar] [CrossRef]
- Steinfeld, H.; Wassenaar, T.; Jutzi, S. Livestock production systems in developing countries: Status, drivers, trends. Rev. Sci. Tech. 2006, 25, 505–516. [Google Scholar] [CrossRef] [PubMed]
- Marshall, K.; Gibson, J.P.; Mwai, O.; Mwacharo, J.M.; Haile, A.; Getachew, T.; Mrode, R.; Kemp, S.J. Livestock genomics for developing countries–African examples in practice. Front. Genet. 2019, 10, 297. [Google Scholar] [CrossRef] [PubMed] [Green Version]
- Gerssen-Gondelach, S.J.; Lauwerijssen, R.B.; Havlík, P.; Herrero, M.; Valin, H.; Faaij, A.P.; Wicke, B. Intensification pathways for beef and dairy cattle production systems: Impacts on GHG emissions, land occupation and land use change. Agric. Ecosyst. Environ. 2017, 240, 135–147. [Google Scholar] [CrossRef]
- Hanrahan, L.; McHugh, N.; Hennessy, T.; Moran, B.; Kearney, R.; Wallace, M.; Shalloo, L. Factors associated with profitability in pasture-based systems of milk production. J. Dairy Sci. 2018, 101, 5474–5485. [Google Scholar] [CrossRef] [Green Version]
- Rolesu, S.; Loi, F.; Cappai, S.; Coccollone, A.; Cataldi, M.; Usala, P.; Podda, A.; Deliperi, S.; Oppia, P.; Natale, A.; et al. Description and typology of dairy sheep farm management profiles in Sardinia. Small Rumin. Res. 2018, 164, 39–47. [Google Scholar] [CrossRef]
- Yerou, H.; Homrani, A.; Benhanassali, A.; Boussedra, D. Typological assessment of dairy farms systems in semi-arid Mediterranean region of western Algeria. Biotechnol. Anim. Husb. 2019, 35, 335–346. [Google Scholar] [CrossRef]
- Anderberg, M.R. Cluster Analysis for Applications: Probability and Mathematical Statistics: A Series of Monographs and Textbooks; New York Academic Press: New York, NY, USA, 2014. [Google Scholar]
- Kaiser, H.F. Varimax solution for primary mental abilities. Psychometrika 1960, 25, 153–158. [Google Scholar] [CrossRef]
- Mądry, W.; Mena, G.Y.; Roszkowska-Madra, B.; Gozdowski, R.; Hryniewski, R.; Castel, G.J.M. An overview of farming system typology methodologies and its use in the study of pasture-based farming system: A review. Span. J. Agric. Res. 2013, 11, 316–326. [Google Scholar] [CrossRef] [Green Version]
- Kamadi, V.V.; Allam, A.R.; Thummala, S.M. A computational intelligence technique for the effective diagnosis of diabetic patients using principal component analysis (PCA) and modified fuzzy SLIQ decision tree approach. Appl. Soft Comput. 2016, 49, 137–145. [Google Scholar] [CrossRef]
- Arouna, A.; Michler, J.D.; Yergo, W.G.; Saito, K. One size fits all? Experimental evidence on the digital delivery of personalized extension advice in Nigeria. Am. J. Agric. Econ. 2021, 103, 596–619. [Google Scholar] [CrossRef]
- Lacombe, C.; Couix, N.; Hazard, L. Designing agroecological farming systems with farmers: A review. Agric. Syst. 2018, 165, 208–220. [Google Scholar] [CrossRef]
- Dixon, J.A.; Gibbon, D.P.; Gulliver, A. Food and Agriculture Organization of the United Nations. Farming Systems and Poverty: Improving Farmers’ Livelihoods in a Changing World; FAO: Rome, Italy; World Bank: Washington, DC, USA, 2001. [Google Scholar]
- Sraïri, M.; Lyoubi, R. Typology of dairy farming systems in Rabat Suburban region, Morocco. Arch. Zootec. 2003, 52, 47–58. [Google Scholar]
- Birner, R.; Davis, K.; Pender, J.; Nkonya, E.; Anandajayasekeram, P.; Ekboir, J.; Mbabu, A.; Spielman, D.J.; Horna, D.; Benin, S.; et al. From best practice to best fit: A framework for designing and analyzing pluralistic agricultural advisory services worldwide. J. Agric. Educ. Ext. 2009, 15, 341–355. [Google Scholar] [CrossRef] [Green Version]
- Ronner, E.; Sumberg, J.; Glover, D.; Descheemaeker, K.; Almekinders, C.; Haussmann, B.; Kuyper, T.; Posthumus, H.; Ebanyat, P.; Giller, K. Basket of options: Unpacking the concept. Outlook Agric. 2021, 50, 116–124. [Google Scholar] [CrossRef]
- Giller, K.E.; Tittonell, P.; Rufino, M.C.; Van Wijk, M.T.; Zingore, S.; Mapfumo, P.; Adjei-Nsiah, S.; Herrero, M.; Chikowo, R.; Corbeels, M. Communicating complexity: Integrated assessment of trade-offs concerning soil fertility management within African farming systems to support innovation and development. Agric. Syst. 2011, 104, 191–203. [Google Scholar] [CrossRef]
- Mwanga, G.; Mujibi, F.; Yonah, Z.; Chagunda, M. Multi-country investigation of factors influencing breeding decisions by smallholder dairy farmers in sub-Saharan Africa. Trop. Anim. Health Prod. 2019, 51, 395–409. [Google Scholar] [CrossRef] [Green Version]
- Martin-Collado, D.; Byrne, T.; Amer, P.; Santos, B.; Axford, M.; Pryce, J. Analyzing the heterogeneity of farmers’ preferences for improvements in dairy cow traits using farmer typologies. J. Dairy Sci. 2015, 98, 4148–4161. [Google Scholar] [CrossRef] [Green Version]
- Sanchez, F.M.A.; Restuccia, D.; Rud, J.P. Are small farms really more productive than large farms? Natl. Bur. Econ. Res. 2019. [Google Scholar] [CrossRef] [Green Version]
- Fan, S.; Chan-Kang, C. Is small beautiful? Farm size, productivity, and poverty in Asian agriculture. Agric. Econ. 2005, 32, 135–146. [Google Scholar] [CrossRef] [Green Version]
- Poczta-Wajda, A.; Sapa, A.; Stępień, S.; Borychowski, M. Food insecurity among small-scale farmers in Poland. Agriculture 2020, 10, 295. [Google Scholar] [CrossRef]
- Davidova, S.; Fredriksson, L.; Bailey, A. Subsistence and semi-subsistence farming in selected EU new member states. Agric. Econ. 2009, 40, 733–744. [Google Scholar] [CrossRef] [Green Version]
- Rada, N.E.; Fuglie, K.O. New perspectives on farm size and productivity. Food Policy 2019, 84, 147–152. [Google Scholar] [CrossRef]
- Lipton, M. Staples production: Efficient “subsistence” smallholders are key to poverty reduction, development, and trade. In Agriculture and Rural Development in a Globalizing World; Routledge: London, UK, 2017; pp. 82–102. [Google Scholar]
- Melcher, A.J.; Khouja, M.; Booth, D.E. Toward a production classification system. Bus. Process. Manag. J. 2002, 8, 53–79. [Google Scholar] [CrossRef]
- Kokic, P.; Davidson, A.; Boero Rodriguez, V. Australia’s grains industry: Factors influencing productivity growth. Aust. Commod. Forecast. Issues 2006, 13, 705–712. [Google Scholar]
- Sheng, Y.; Zhao, S.; Nossal, K.; Zhang, D. Productivity and farm size in Australian agriculture: Reinvestigating the returns to scale. Aust. J. Agric. Resour. Econ. 2015, 59, 16–38. [Google Scholar] [CrossRef]
- Sheng, Y.; Davidson, A.; Fuglie, K.; Zhang, D. Input substitution, productivity performance and farm size. Aust. J. Agric. Resour. Econ. 2016, 60, 327–347. [Google Scholar] [CrossRef] [Green Version]
- Jayne, T.S.; Muyanga, M.; Wineman, A.; Ghebru, H.; Stevens, C.; Stickler, M.; Chapoto, A.; Anseeuw, W.; Van der Westhuizen, D.; Nyange, D. Are medium-scale farms driving agricultural transformation in sub-Saharan Africa? Agric. Econ. 2019, 50, 75–95. [Google Scholar] [CrossRef] [Green Version]
- Ahikiriza, E.; Van Meensel, J.; Gellynck, X.; Lauwers, L. Heterogeneity in frontier analysis: Does it matter for benchmarking farms? J. Product. Anal. 2021, 1–16. [Google Scholar] [CrossRef]
- Andreoli, M.; Gouerec, N. Tradition and Modernization in the Agricultural Development of a Tuscan (Central Italy) Marginal Area: The Role of Advisory and Extension Services. In Development Issues in Marginal Regions; Routledge: New York, USA, 2019; pp. 193–209. [Google Scholar]
- Fraval, S.; Hammond, J.; Wichern, J.; Oosting, S.J.; De Boer, I.J.; Teufel, N.; Lannerstad, M.; Waha, K.; Pagella, T.; Rosenstock, T.S. Making the most of imperfect data: A critical evaluation of standard information collected in farm household surveys. Exp. Agric. 2019, 55, 230–250. [Google Scholar] [CrossRef] [Green Version]
- Ronner, E. From Targeting to Tailoring: Baskets of Options for Legume Cultivation among African Smallholders. Ph.D. Thesis, Wageningen University, Wageningen, The Netherlands, 2018. [Google Scholar]
- Kuehne, G.; Llewellyn, R.; Pannell, D.J.; Wilkinson, R.; Dolling, P.; Ouzman, J.; Ewing, M. Predicting farmer uptake of new agricultural practices: A tool for research, extension and policy. Agric. Syst. 2017, 156, 115–125. [Google Scholar] [CrossRef]
- Rogers, E.M.; Singhal, A.; Quinlan, M.M. Diffusion of Innovations; Routledge: New York, NY, USA, 2014. [Google Scholar]
- Glover, D.; Sumberg, J.; Ton, G.; Andersson, J.; Badstue, L. Rethinking technological change in smallholder agriculture. Outlook Agric. 2019, 48, 169–180. [Google Scholar] [CrossRef] [Green Version]
- Rogers, E.M. Diffusion of Innovations; Simon and Schuster: New York, USA, 2010. [Google Scholar]

| District | Farmers Interviewed | Percentage (%) | Farmers Considered for Analysis | Percentage (%) |
|---|---|---|---|---|
| Ibanda | 112 | 23.2 | 111 | 23.5 |
| Kabarole | 128 | 26.6 | 124 | 26.3 |
| Kamwenge | 121 | 25.1 | 118 | 25.1 |
| Mbarara | 121 | 25.1 | 118 | 25.1 |
| Total | 482 | 100.0 | 471 | 100.0 |
| Variable Name | Min | Max | Mean ± S.E | SD | CV (%) |
|---|---|---|---|---|---|
| Age of the major dairy farming decision maker (years) | 23.00 | 94.00 | 56.58 ± 0.63 | 13.64 | 24.1 |
| Dairy farming experience (years) | 1.00 | 70.00 | 28.18 ± 0.65 | 14.17 | 50.3 |
| Household size | 2.00 | 20.00 | 8.73 ± 0.16 | 3.45 | 39.5 |
| Household land owned (acres) | 1.00 | 300.00 | 44.40 ± 2.53 | 54.95 | 123.8 |
| Land allocated to dairy farming | 1.00 | 260.00 | 31.04 ± 1.98 | 43.07 | 138.8 |
| Milk cow−1 day−1 in dry season (L) | 0.50 | 19.70 | 6.36 ± 0.17 | 3.70 | 58.2 |
| Milk cow−1day−1 in wet season (L) | 1.00 | 22.00 | 8.13 ± 0.21 | 4.27 | 52.5 |
| Milk produced day−1 (L) | 1.00 | 380.00 | 43.95 ± 2.41 | 52.41 | 119.2 |
| Milk sold day−1 (L) | 0.00 | 371.00 | 34.32 ± 2.11 | 46.00 | 134.0 |
| Milk price L−1 in dry season (USD) | 0.10 | 0.33 | 0.23 ± 0.001 | 0.04 | 17.4 |
| Milk price L−1 in wet season (USD) | 0.05 | 0.33 | 0.15 ± 0.002 | 0.05 | 33.3 |
| Monthly milk sales (USD) | 0.00 | 2566.65 | 235.10 ± 14.74 | 320.41 | 136.3 |
| Number of dairy cows | 2.00 | 210.00 | 25.78 ± 1.27 | 27.48 | 106.6 |
| Number of lactating cows | 1.00 | 70.00 | 7.29 ± 0.34 | 7.40 | 101.5 |
| Lactating cows/Dairy cows owned | 0.05 | 1.00 | 0.33 ± 0.007 | 0.15 | 45.5 |
| Calving interval (months) | 10.00 | 21.00 | 13.75 ± 0.11 | 2.44 | 17.7 |
| Age at first service (years) | 1.00 | 3.00 | 2.12 ± 0.02 | 0.37 | 17.5 |
| Lactation period (months) | 5.00 | 18.00 | 9.25 ± 0.12 | 2.66 | 28.8 |
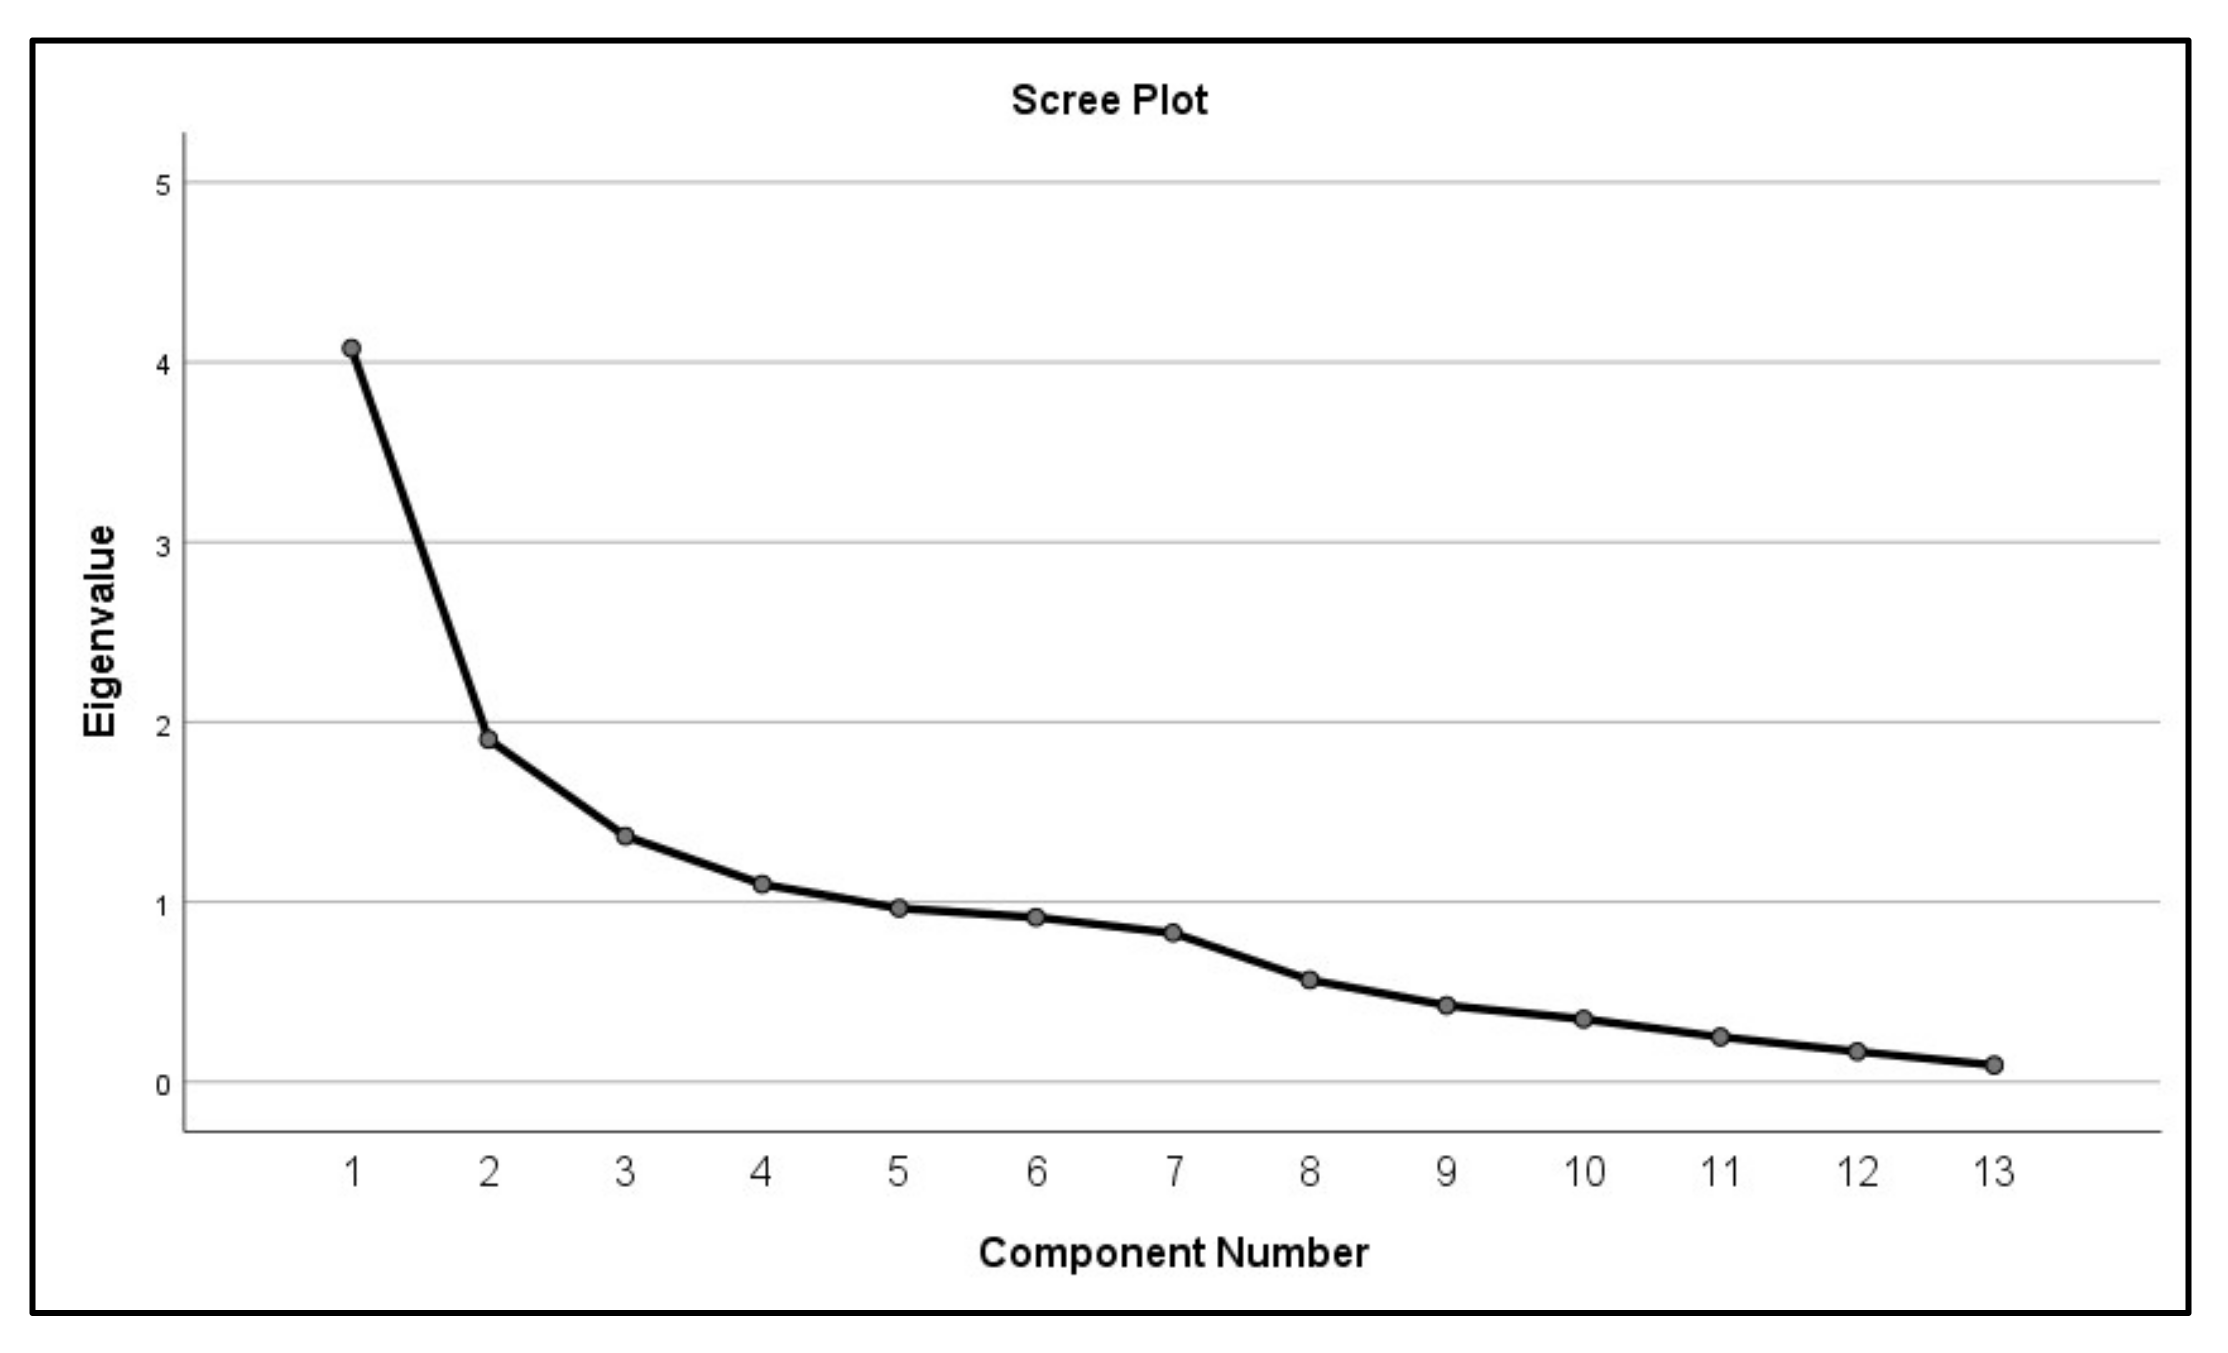
| Initial Eigenvalues | Rotation Sums of Squared Loadings | |||||
|---|---|---|---|---|---|---|
| Principal Components (PC) | Total Eigen Values | Percentage of Variance (%) | Cumulative Percentage of Variance (%) | Total Eigen Values | Percentage of Variance (%) | Cumulative Percentage of Variance (%) |
| 1 | 4.08 | 31.36 | 31.36 | 2.72 | 20.95 | 20.95 |
| 2 | 1.90 | 14.64 | 46.00 | 2.54 | 19.53 | 40.49 |
| 3 | 1.37 | 10.51 | 56.51 | 1.98 | 15.25 | 55.74 |
| 4 | 1.10 | 8.45 | 64.96 | 1.20 | 9.22 | 64.96 |
| Variables | PC1 | PC2 | PC3 | PC4 |
|---|---|---|---|---|
| Land for growing fodder and legume pastures (acres) | 0.770 | |||
| Number of dairy cows | 0.632 | |||
| Monthly milk sales (USD) | 0.647 | |||
| Monthly household income (USD) | 0.554 | |||
| Monthly permanent hired labor costs (USD) | 0.817 | |||
| Land owned by the household (acres) | 0.868 | |||
| Own land allocated to dairy farming (acres) | 0.881 | |||
| Stocking rate | 0.710 | |||
| Milk produced cow−1 day−1 (dry season) | 0.901 | |||
| Milk produced cow−1 day−1 (wet season) | 0.893 | |||
| Calving interval (months) | 0.544 | |||
| Age at first service/mating (years) | 0.622 | |||
| Dairy farming experience (years) | 0.574 |
| Principal Component | Cluster 1 | Cluster 2 | Cluster 3 |
|---|---|---|---|
| 1 | −0.24856 | −0.16130 | 2.99817 |
| 2 | −0.27822 | −2.22415 | −0.32931 |
| 3 | −0.00353 | 0.05564 | −0.05104 |
| 4 | 0.02410 | −0.13174 | −0.07568 |
| Variable Name | Characteristic (%) | Cluster 1 (n = 389) | Cluster 2 (n = 54) | Cluster 3 (n = 28) | Sig (2 Sided) |
|---|---|---|---|---|---|
| Keeping records | Yes | 54.2 | 72.2 | 96.4 | 0.000 |
| Use of permanent hired labor | Yes | 75.5 | 92.6 | 96.4 | 0.001 |
| Education level of the main decision maker at the farm | No formal education | 10.9 | 22.2 | 7.4 | 0.002 |
| Primary education | 35.8 | 22.2 | 14.8 | ||
| Secondary education | 26.5 | 22.2 | 18.5 | ||
| Tertiary education | 26.8 | 33.3 | 59.3 | ||
| Use of artificial insemination | Yes | 5.6 | 10.0 | 28.6 | 0.004 |
| Growing fodder and legume pastures on the farm | Yes | 29.6 | 43.7 | 64.3 | 0.010 |
| Grazing system | Tethering with no supplementary feeding | 0.8 | 0 | 0 | 0.727 |
| Tethering with irregular supplementary feeding | 0.3 | 0 | 0 | 0.900 | |
| Tethering with regular supplementary feeding | 1.5 | 0 | 3.6 | 0.437 | |
| Herding on own unfenced land with no supplementary feeding | 22.2 | 18.5 | 3.6 | 0.204 | |
| Herding on own unfenced land with supplementary feeding | 17.8 | 20.3 | 10.6 | 0.027 | |
| Own fenced paddocks with no supplementary feeding | 28.0 | 38.9 | 17.9 | 0.014 | |
| Own fenced paddocks with supplementary feeding | 29.4 | 20.4 | 64.3 | 0.009 | |
| Exclusive zero-grazing | 1.8 | 1.9 | 0.0 | 0.949 | |
| WTP for extension services | Yes | 79.7 | 75.5 | 89.3 | 0.336 |
| Smartphone ownership | Yes | 33.5 | 50.0 | 64.3 | 0.001 |
| Tools/equipment | Feed troughs | 42.6 | 45.5 | 46.4 | 0.983 |
| Strip cup | 1.0 | 5.6 | 14.3 | 0.000 | |
| Chaff cutter | 3.6 | 7.4 | 21.4 | 0.000 | |
| Solar powered/electric water pump | 1.8 | 5.6 | 11.1 | 0.008 | |
| Facilities | Milking shed/parlor | 20.3 | 27.8 | 71.4 | 0.000 |
| Calf pen | 47.3 | 68.5 | 50.0 | 0.014 | |
| Feed stores | 9.8 | 16.7 | 46.4 | 0.000 | |
| Milk marketing channel | Middlemen | 34.4 | 25.9 | 32.1 | 0.144 |
| Cooperative society | 26.7 | 50.0 | 50.0 | 0.000 | |
| Local consumers | 36.5 | 18.5 | 14.3 | 0.017 | |
| Institution | 0.8 | 3.7 | 3.6 | 0.000 |
| Name of the Variables. | Cluster 1 (n = 389) | Cluster 2 (n = 54) | Cluster 3 (n= 28) | Sample Mean (SD) | ||||||
|---|---|---|---|---|---|---|---|---|---|---|
| Min | Mean (SD) | Max | Min | Mean (SD) | Max | Min | Mean (SD) | Max | ||
| Age of the major dairy farming decision maker (years) | 23.0 | 56.0 a (13.3) | 92.0 | 27.0 | 60.4 a (15.0) | 93.0 | 32.0 | 58.6 a (14.8) | 94.0 | 56.6 (13.6) |
| Dairy farming experience (years) | 1.0 | 26.9 a (14.0) | 67.0 | 6.0 | 36.1 b (14.1) | 70.0 | 3.0 | 31.3 a,b (11.9) | 58.0 | 28.2 (14.2) |
| Monthly milk sales (USD) | 0.0 | 144.7 a (121.5) | 803.1 | 34.3 | 421.0 b (353.5) | 1787.3 | 465.2 | 1135.8 c (552.1) | 2566.7 | 235.0 (320.7) |
| Average monthly household income (USD) | 27.2 | 324.5 a (311.5) | 2720.4 | 122.4 | 662.1 b (588.7) | 2720.4 | 136.0 | 2134.5 c (933.0) | 4080.5 | 404.4 (452.2) |
| Land owned by the household (acres) | 1.5 | 27.6 a (26.7) | 200.0 | 30 | 157.4 b (71.7) | 300 | 7.0 | 61.4 c (48.9) | 260.0 | 44.5 (55.0) |
| Land allocated to dairy farming (acres) | 1.0 | 17.9 a (17.2) | 100.0 | 23.0 | 121.0 b (64.5) | 260.0 | 4.0 | 41.75 c (33.3) | 108.0 | 31.1 (43.1) |
| Land for fodder and pasture legumes (acres) | 0.0 | 0.3 a (0.9) | 7.0 | 0.0 | 1.2 b (3.1) | 15.0 | 0.0 | 3.3 c (4.1) | 20.0 | 0.56 (1.8) |
| Stocking rate | 0.3 | 1.70 a (1.7) | 13.0 | 0.1 | 0.52 b (0.4) | 2.6 | 0.7 | 2.46 a (1.8) | 7.5 | 1.61 (1.66) |
| Lactation period (months) | 2.0 | 9.0 a (2.7) | 15 | 4.0 | 8.3 a (2.5) | 14 | 5.0 | 9.6 a (2.3) | 18.0 | 8.9 (2.7) |
| Number of dairy cows | 2.0 | 18.2 a (14.4) | 100.0 | 4.0 | 58.4 b (39.6) | 136.0 | 13.0 | 68.4 b (46.5) | 210.0 | 25.8 (27.4) |
| Milk cow−1 day−1 in wet season (L) | 0.5 | 7.0 a (4.4) | 20.0 | 0.5 | 7.5 a (4.4) | 21.0 | 3.0 | 12.5 b (5.7) | 22.0 | 7.4 (4.7) |
| Milk per cow−1 day−1 in dry season (L) | 0.5 | 5.9 a (3.5) | 18.0 | 0.5 | 6.6 a (3.9) | 18.0 | 1.0 | 10.4 b (4.6) | 19.7 | 6.3 (3.8) |
| Milk fed to the calves−1 (L) | 0.0 | 1.5 a (4.1) | 30.0 | 0.0 | 2.0 a (7.8) | 45.0 | 0.0 | 25.1 b (25.4) | 104.0 | 3.0 (9.4) |
| Calving interval (months) | 10.0 | 13.8 a (2.5) | 21.0 | 10.0 | 13.0 b (2.0) | 18.0 | 10.0 | 13.2 a,b (2.1) | 18.0 | 13.8 (2.4) |
| Age of first mating/service (years) | 1.0 | 2.1 a (0.4) | 3.0 | 1.0 | 2.0 b (0.4) | 3.0 | 1.0 | 2.0 b (0.2) | 2.5 | 2.1 (0.4) |
| Milk price liter−1 (wet season) (USD) | 0.05 | 0.15 a (0.05) | 0.33 | 0.08 | 0.12 b (0.04) | 0.27 | 0.05 | 0.18 c (0.06) | 0.27 | 0.15 (0.05) |
| Milk price liter−1 (dry season) (USD) | 0.10 | 0.23 a (0.04) | 0.33 | 0.16 | 0.22 b (0.03) | 0.33 | 0.19 | 0.25 c (0.03) | 0.33 | 0.23 (0.4) |
| Annual cost of pests and diseases management (USD) | 32.6 | 333.0 a (235.6) | 1392.8 | 81.6 | 676.5 b (429.7) | 1469.0 | 217.3 | 594.0 a (282.9) | 1305.8 | 387.9 (293) |
| Annual costs of pest and diseases cow−1 (USD) | 1.1 | 23.7 a (17.4) | 163.2 | 1.5 | 15.68 b (11.4) | 70.7 | 2.5 | 12.6 b (11.4) | 61.2 | 22.1 (16.9) |
| Annual animal sales in 2019 (USD) | 0.0 | 1697.8 a (2777.5) | 33405.9 | 0.0 | 6025.72 b (13,528.6) | 91,893.4 | 0.0 | 4305.92 c (4357.5) | 16,668.2 | 2350.4 (5502.5) |
| No. of people permanently hired for dairy farming | 0.0 | 1.1 a (1.1) | 3.0 | 0.0 | 2.6 b (2.9) | 7.0 | 1.0 | 3.8 b (2.2) | 9.0 | 1.4 (1.6) |
| Monthly hired labor costs (USD) | 0.0 | 31.6 a (41.0) | 331.9 | 0.0 | 92.7 b (96.1) | 448.9 | 13.6 | 189.6 c (327.7) | 1768.2 | 48.1 (101.6) |
| Monthly hired labor costs cow−1 (USD) | 0.0 | 1.8 a (2.1) | 17.5 | 0.0 | 1.8 a (1.5) | 7.4 | 0.10 | 3.1 a (3.9) | 19.7 | 1.9 (2.2) |
| Household size | 2.0 | 8.6 a (3.4) | 20.0 | 2.0 | 9.4 a (3.9) | 20.0 | 4.0 | 9.2 a (3.8) | 17.0 | 8.7 (3.4) |
| Distance from home to the nearest trading center (km) | 0.5 | 7.3 a (37.0) | 50.0 | 0.5 | 29.0 b (52.7) | 65.0 | 1.0 | 2.5 a (2.7) | 13.0 | 9.6 (51.6) |
| Rate of using modern farm tools and infrastructure (scale of 1–7) | 1.5 | 3.4 a (1.7) | 5.5 | 2.0 | 4.4 b (1.8) | 6.0 | 3.0 | 5.9 c (1.9) | 6.0 | 3.7 (1.8) |
| Amount farmers are willing to pay for dairy advisory services (USD) | 0.27 | 9.6 a (13.0) | 136.0 | 0.27 | 9.7 a (8.8) | 54.4 | 2.7 | 19.9 b (26.7) | 136.0 | 10.3(14.1) |
| Amount paid to the extension agent at the last visit (USD) | 0.5 | 14.3 a (17.0) | 163.2 | 1.1 | 21.4 a (26.5) | 136.0 | 5.4 | 24.2 a (30.2) | 136.0 | 15.7 (19.5) |
Publisher’s Note: MDPI stays neutral with regard to jurisdictional claims in published maps and institutional affiliations. |
© 2021 by the authors. Licensee MDPI, Basel, Switzerland. This article is an open access article distributed under the terms and conditions of the Creative Commons Attribution (CC BY) license (https://creativecommons.org/licenses/by/4.0/).
Share and Cite
Ahikiriza, E.; Wesana, J.; Gellynck, X.; Van Huylenbroeck, G.; Lauwers, L. Context Specificity and Time Dependency in Classifying Sub-Saharan Africa Dairy Cattle Farmers for Targeted Extension Farm Advice: The Case of Uganda. Agriculture 2021, 11, 836. https://doi.org/10.3390/agriculture11090836
Ahikiriza E, Wesana J, Gellynck X, Van Huylenbroeck G, Lauwers L. Context Specificity and Time Dependency in Classifying Sub-Saharan Africa Dairy Cattle Farmers for Targeted Extension Farm Advice: The Case of Uganda. Agriculture. 2021; 11(9):836. https://doi.org/10.3390/agriculture11090836
Chicago/Turabian StyleAhikiriza, Elizabeth, Joshua Wesana, Xavier Gellynck, Guido Van Huylenbroeck, and Ludwig Lauwers. 2021. "Context Specificity and Time Dependency in Classifying Sub-Saharan Africa Dairy Cattle Farmers for Targeted Extension Farm Advice: The Case of Uganda" Agriculture 11, no. 9: 836. https://doi.org/10.3390/agriculture11090836
APA StyleAhikiriza, E., Wesana, J., Gellynck, X., Van Huylenbroeck, G., & Lauwers, L. (2021). Context Specificity and Time Dependency in Classifying Sub-Saharan Africa Dairy Cattle Farmers for Targeted Extension Farm Advice: The Case of Uganda. Agriculture, 11(9), 836. https://doi.org/10.3390/agriculture11090836