Article

Spatial Analysis of Agronomic Data and UAV Imagery for Rice Yield Estimation

GIS Research Unit, Laboratory of Soils and Agricultural Chemistry, Department of Natural Resources and Agricultural Engineering, Agricultural University of Athens, 118 55 Athens, Greece
*
Author to whom correspondence should be addressed.
Agriculture 2021, 11(9), 809; https://doi.org/10.3390/agriculture11090809
Submission received: 19 June 2021 / Revised: 4 August 2021 / Accepted: 24 August 2021 / Published: 26 August 2021

Abstract

:
In this study, a spatial analysis of agronomic and remote sensing data is carried out to derive accurate rice crop yield estimation. The variability of a series of vegetation indices (VIs) was calculated from remote sensing data obtained via a commercial UAS platform (e-Bee) at four dates (per stage of development), and the development of estimation models was conducted. The study area is located in the region of Chalastra (municipality of Thessaloniki, North Greece) and the primary data were obtained during the 2016 growing season. These data include ultra-high resolution remote sensing multispectral images of 18 plots totaling 58 hectares of Ronaldo and Gladio rice crop varieties, 97 sample point data related to yield, and many other pieces of information recorded in the producer’s field log. Ten simple and compound VIs were calculated, and the evolution of their values during the growing season as well as their comparative correlation were studied. A study of the usability of each VI was conducted for the different phenological stages of the cultivation and the variance of VIs and yield; the more correlated VIs were identified. Furthermore, three types of multitemporal VI were calculated from combinations of VIs from different dates, and their contribution to improving yield prediction was studied. As Ronaldo is a Japonica type of rice variety and Gladio is Indica type, they behave differently in terms of maturation time (Gladio is approximately 20 days earlier) and the value of every VI is affected by changes in plant physiology and phenology. These differences between the two varieties are reflected in the multitemporal study of the single-date VIs but also in the study of the values of the multitemporal VIs. In conclusion, Ronaldo’s yield is strongly dependent on multitemporal NDVI (VI6th July + VI30 Aug, R2 = 0.76), while Gladio’s yield is strongly dependent on single-date NDVI (6 July, R2 = 0.88). The compound VIs RERDVI and MCARI1 have the highest yield prediction (R2 = 0.77) for Ronaldo (VI6th July + VI30 Aug) and Gladio (R2 = 0.95) when calculated in the booting stage, respectively. For the Ronaldo variety, the examination of the multitemporal VIs increases yield prediction accuracy, while in the case of the Gladio variety the opposite is observed. The capabilities of multitemporal VIs in yield estimation by combining UAVs with more flights during the different growth stages can improve management and the cultivation practices.

1. Introduction

The rice crop exceeds 500 million tons per year and was the dominant food for 2.7 billion people in 2010 [1] and 3.5 billion people in 2017 [2]. In global rice yield, rice from Indica-type varieties represented 85.4% of the yield in 2017, and Japonica rice accounted for 14.6% of the world’s rice production [3]. In Greece, rice production reached 220,930 tons in a cultivation area of 29,860 ha [4] and represents 1.4% of the total cultivation area of the country [5]. The 25,000 ha are in the region of Central Macedonia, west of Thessaloniki in the deltas of three rivers. Due to the extremely great importance of rice cultivation both from a nutritional and economic point of view, from the 1990s onwards a significant effort has been made by the scientific community to develop yield estimation models in combination with remote sensing [6], or estimation of plant traits and phenology [7].
Traditionally, the estimation of crop yield derived from crop data collected in situ by agronomists. This technique is usually subjective, time-consuming, and often leads to erroneous estimations [8]; additionally, the different methods for calculating yield and extrapolating lead to different results. The term “estimation model” usually includes an algorithm that quantifies and dynamically interprets the process of plant growth, yield, and interaction with environmental factors [9].
Vegetation indices (VIs) are quantitative expressions that are calculated from the reflectance values of remote sensing data and are mainly related to the vegetation status or biomass [10]. The correlation between photosynthetic activity and VIs is important in environmental monitoring with remote sensing and has been extensively studied [10].
In addition to the common VIs that derive from one date, there are also the multitemporal VIs [11], which are calculated from the use of data obtained from more than one date. It appears from the literature that these multitemporal vegetation indices are important in the study of growth, for example, in phenological characteristics. Multitemporal VIs were initially used to improve yield estimation [12], and for wheat yield estimation in Kansas and Ukraine a multitemporal NDVI was successfully used [13]. Other researchers [14] estimated wheat yield with multitemporal VIs such as ΣNDVI and ΣRVI acquired from remote sensing data from the tillering phenological stage up to the grain-filling stage and achieved greater estimation accuracy than single-date VIs. In addition, single-date VIs are more sensitive to cultivation practices [15], while multitemporal VIs minimize the yield estimation errors that derive from the date of data acquisition, the process method being used and the established cultivation practices [16]. A multitemporal VI considered in this study is the cumulative index SUM (VI) resulting from the sum of each vegetation index between two dates.
The study focuses on two rice varieties, Ronaldo and Gladio; both varieties were cultivated with the wet paddy rice cultivation technique. The Ronaldo [17] variety is a short grain japonica type (O. sativa subsp. Japonica) with mean cultivar height of 90 cm at full growth; a life cycle of 150 days (from seeding to maturity, under northern Greece’s climatic conditions); high resistance to rice blast disease (caused by the fungus Pyricularia oryzae), Brown Spot disease (caused by the fungus Helminthosporium oryzae) and stem bending (despite the elongated stems); high resistance to cold conditions; high tillering capacity; delayed growth; and very high yield capability. Its grains’ mean dimensions are 6.5 × 2.9 mm and they contain 18% amylose. The Ronaldo variety is considered to have semi-dwarf grain, suitable for para-boiling, with a very low percentage of defective grains, featuring a very high production capacity and semi-precocious cycle resistant to lodging and diseases.
The Gladio [18] variety is a short grain japonica type (O. sativa subsp. Indica) with short cultivar height at full growth, short stem length, a life cycle of 130 days (from seeding to maturity), high resistance to rice blast disease, adequate resistance to Brown Spot disease, high resistance to and stem bending, high resistance to cold conditions, high tillering capacity, delayed growth and usually high yield capability. Its grains’ mean dimensions are 7.5 × 2.3 mm and they contain 27% amylose. It adapts to a great variety of growing environments and conditions, and its short stem and early maturing cycle enables the reduction of risks at the time of harvesting and drying costs, respectively. It does not usually require fungicide treatments because of its high resistance to most rice-seedling pathogens and diseases.
This study’s main scope is to investigate, for rice cultivation, the variability of a series of vegetation indices calculated from remote sensing data derived from a modern, commercial UAV platform and their optimal correlation with the yield. The above scope is divided into four objectives: (a) the correlation of yield with vegetation indices, (b) the identification of the best vegetation indices for estimating yield and the monitoring of vegetation indices over time with the best correlation with the yield during a growing season and for the various phenological stages of cultivation, and (c) to find the optimal combination of vegetation indices and remote sensing data acquisition time with higher accuracy in yield estimation.

2. Materials and Methods
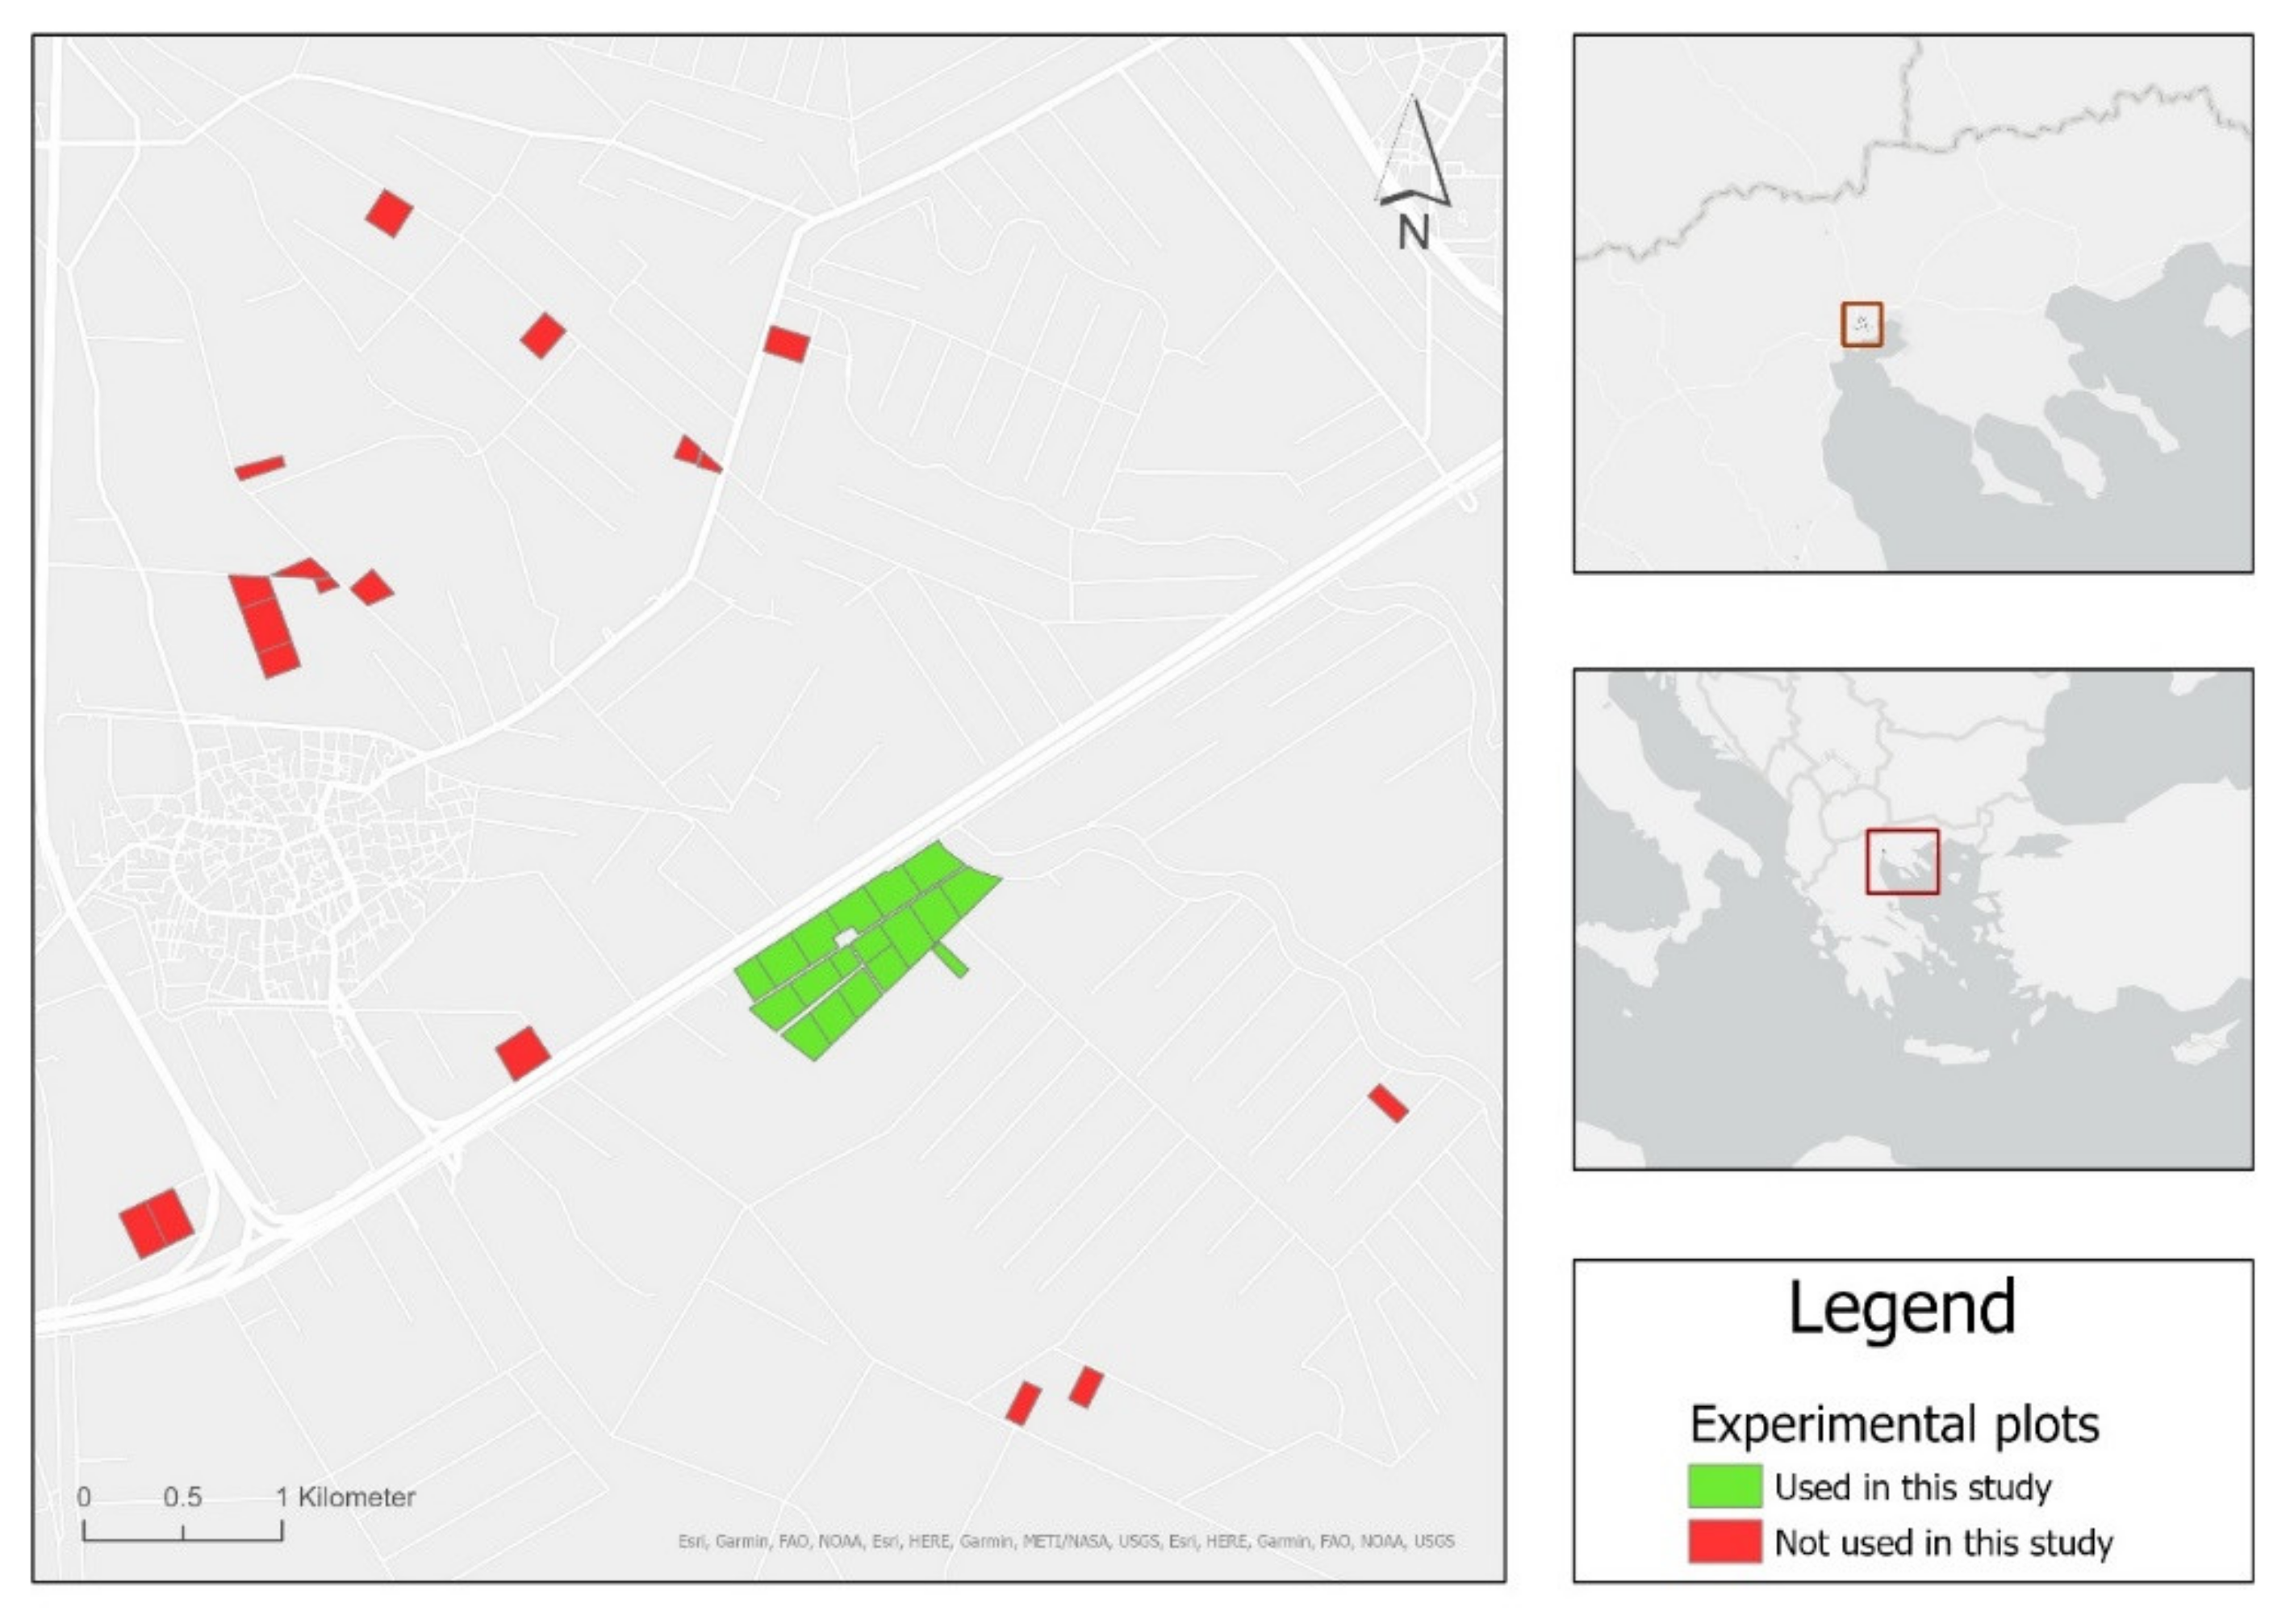
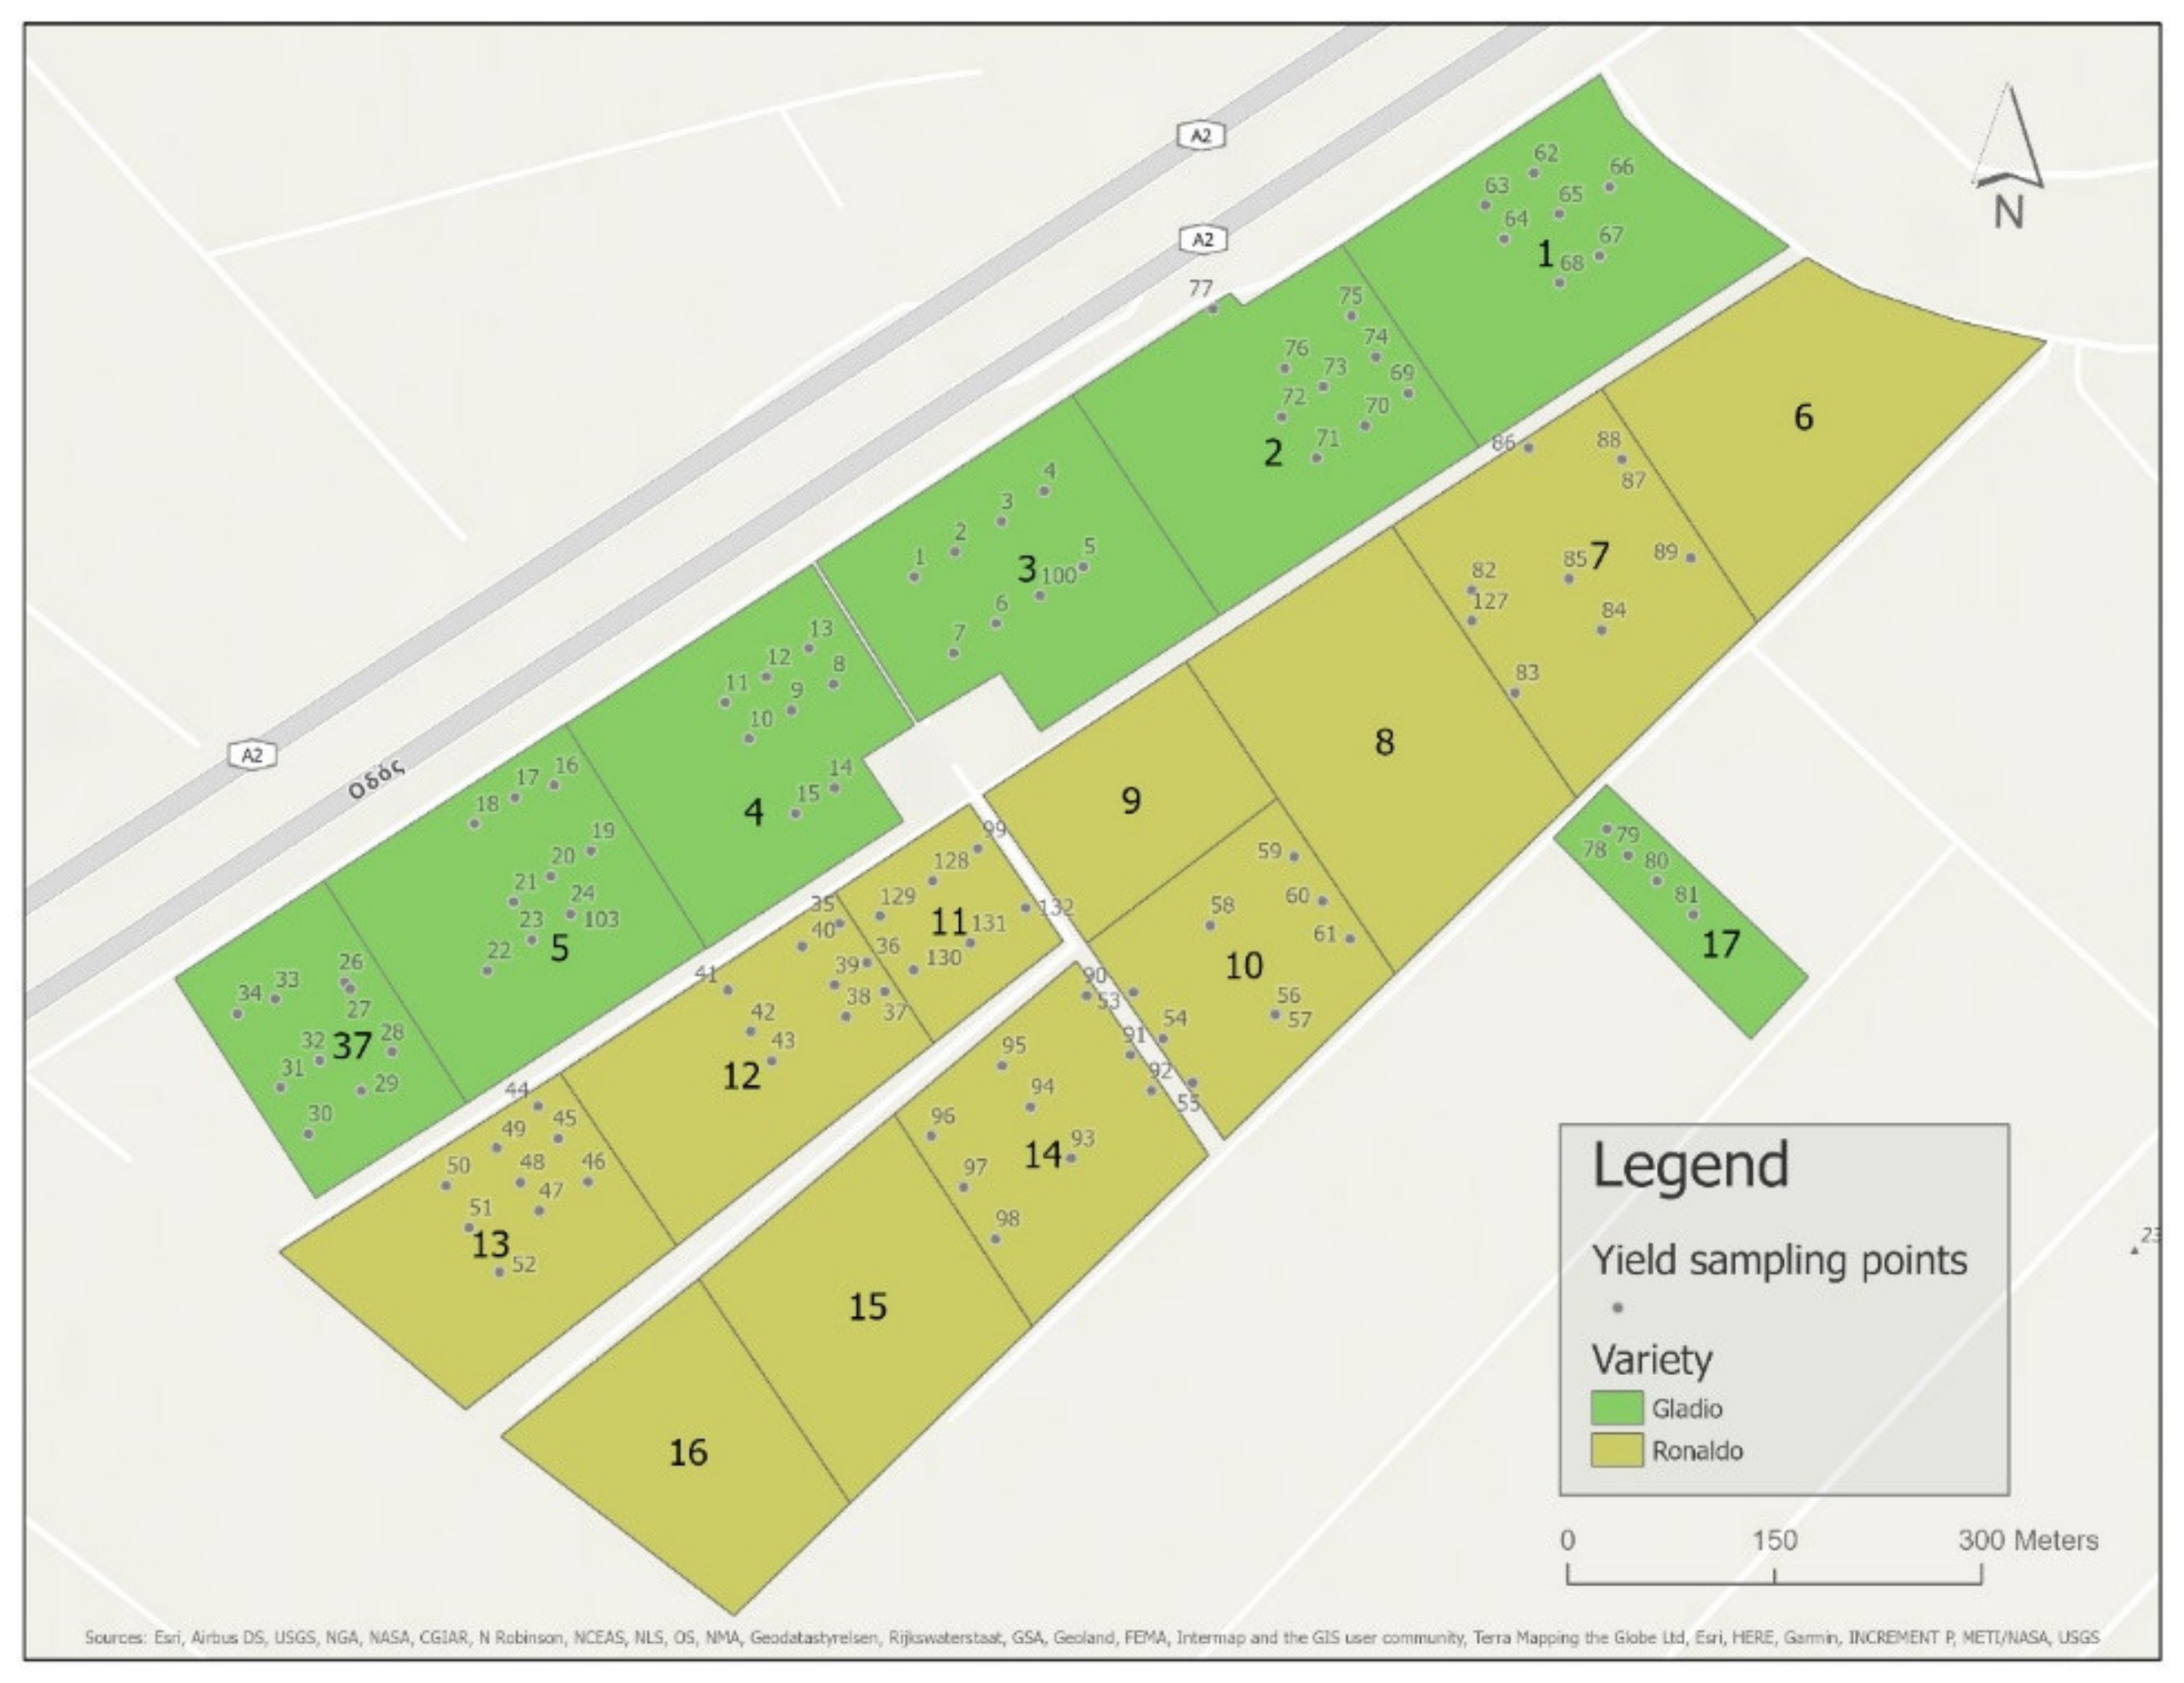
2.1. Study Area

This study was conducted in the rice fields of Chalastra, in the prefecture of Thessaloniki, in northern Greece (Figure 1). Primary data were used that are part of a larger experiment conducted in 2016 in the context of the research of the ECODEVELOPMENT company in the field of precision agriculture.
Data from in situ rice weight measurements were obtained mainly from the central area consisting of 18 plots (Figure 2) with a total area of 58 ha, of which in 11 plots the Ronaldo variety is cultivated and in the remaining 7 the Gladio variety is cultivated. Τhe equable sowing seed density in combination with the germination capacity were verified so that the same vegetation percentage (>95%) was achieved in all fields and for each of the two varieties.

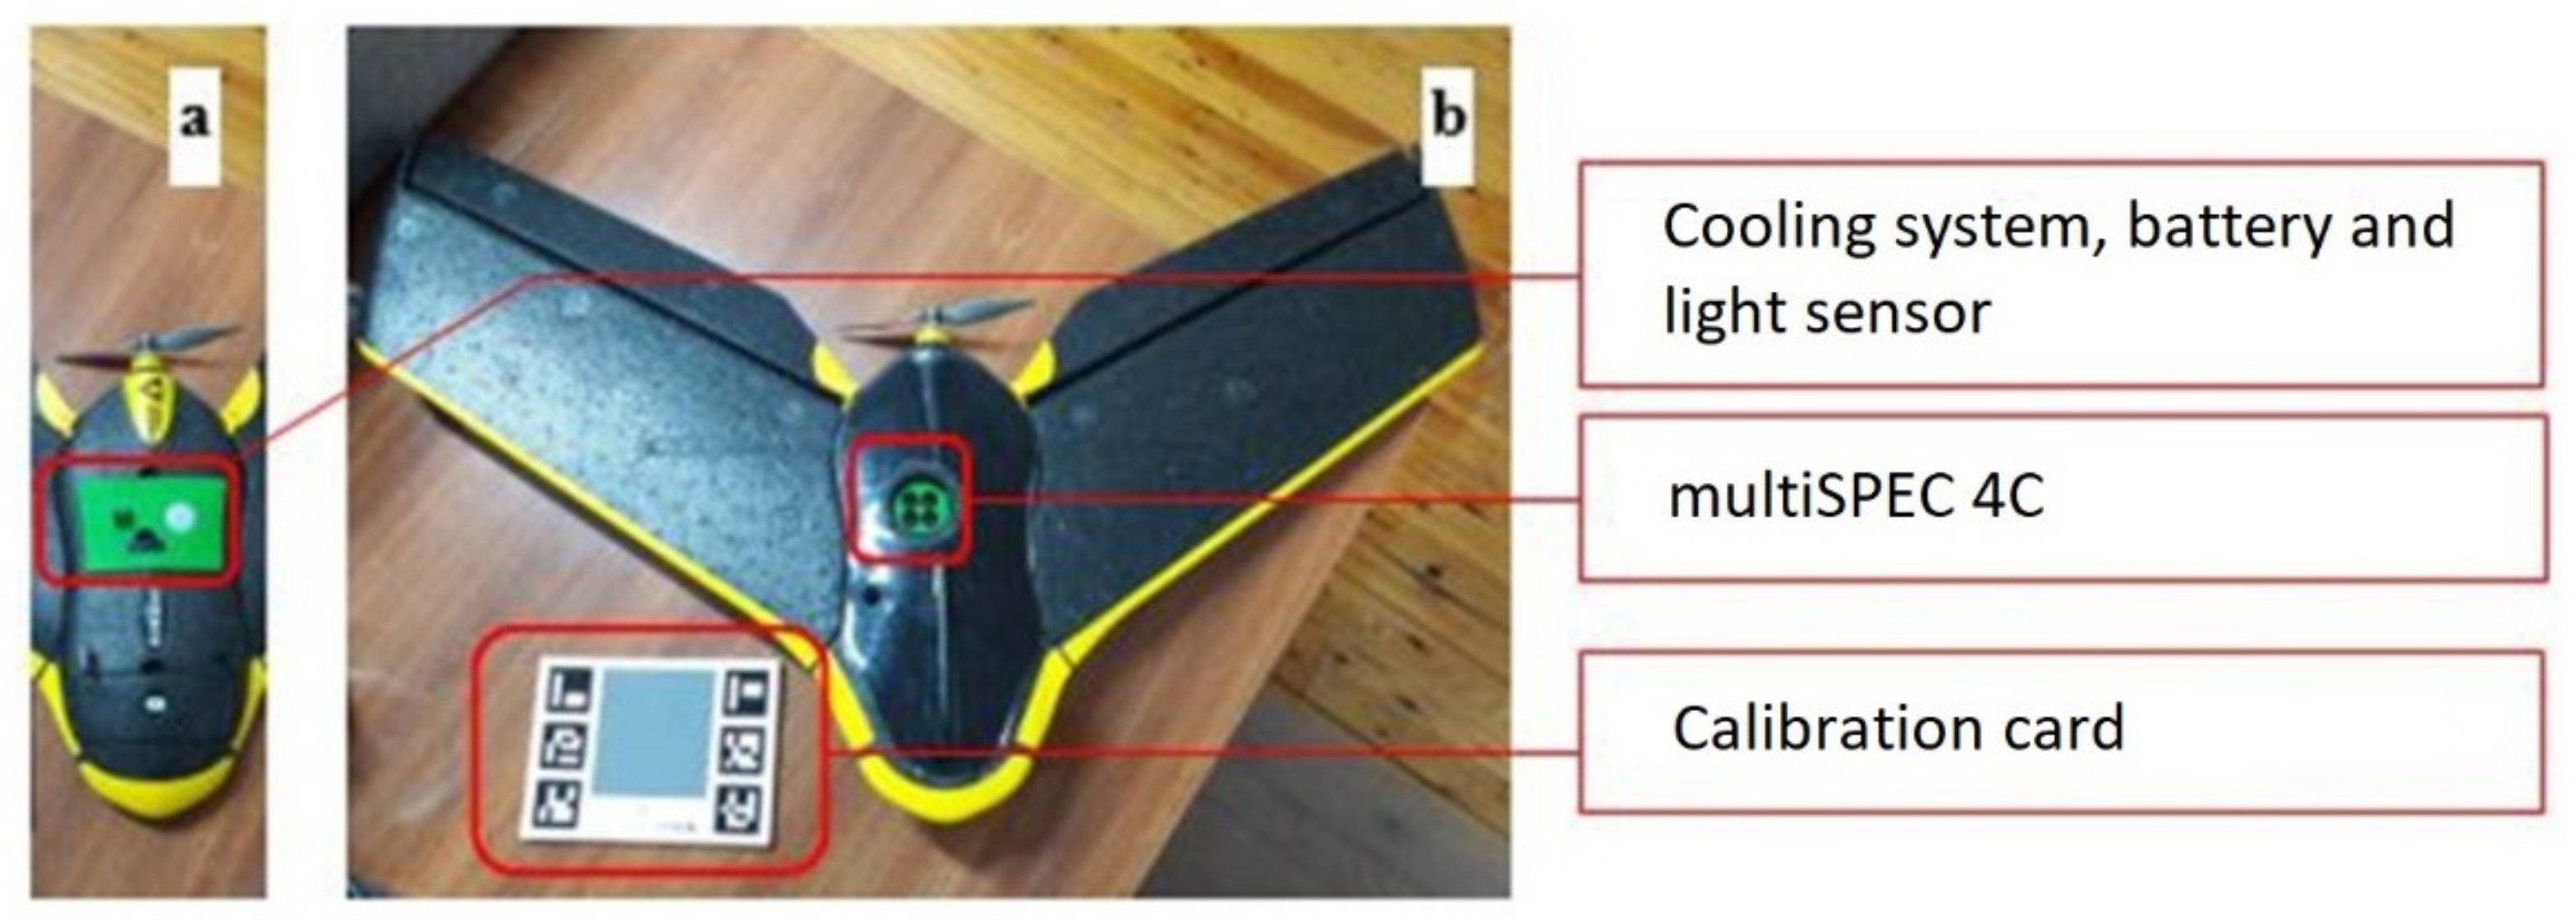
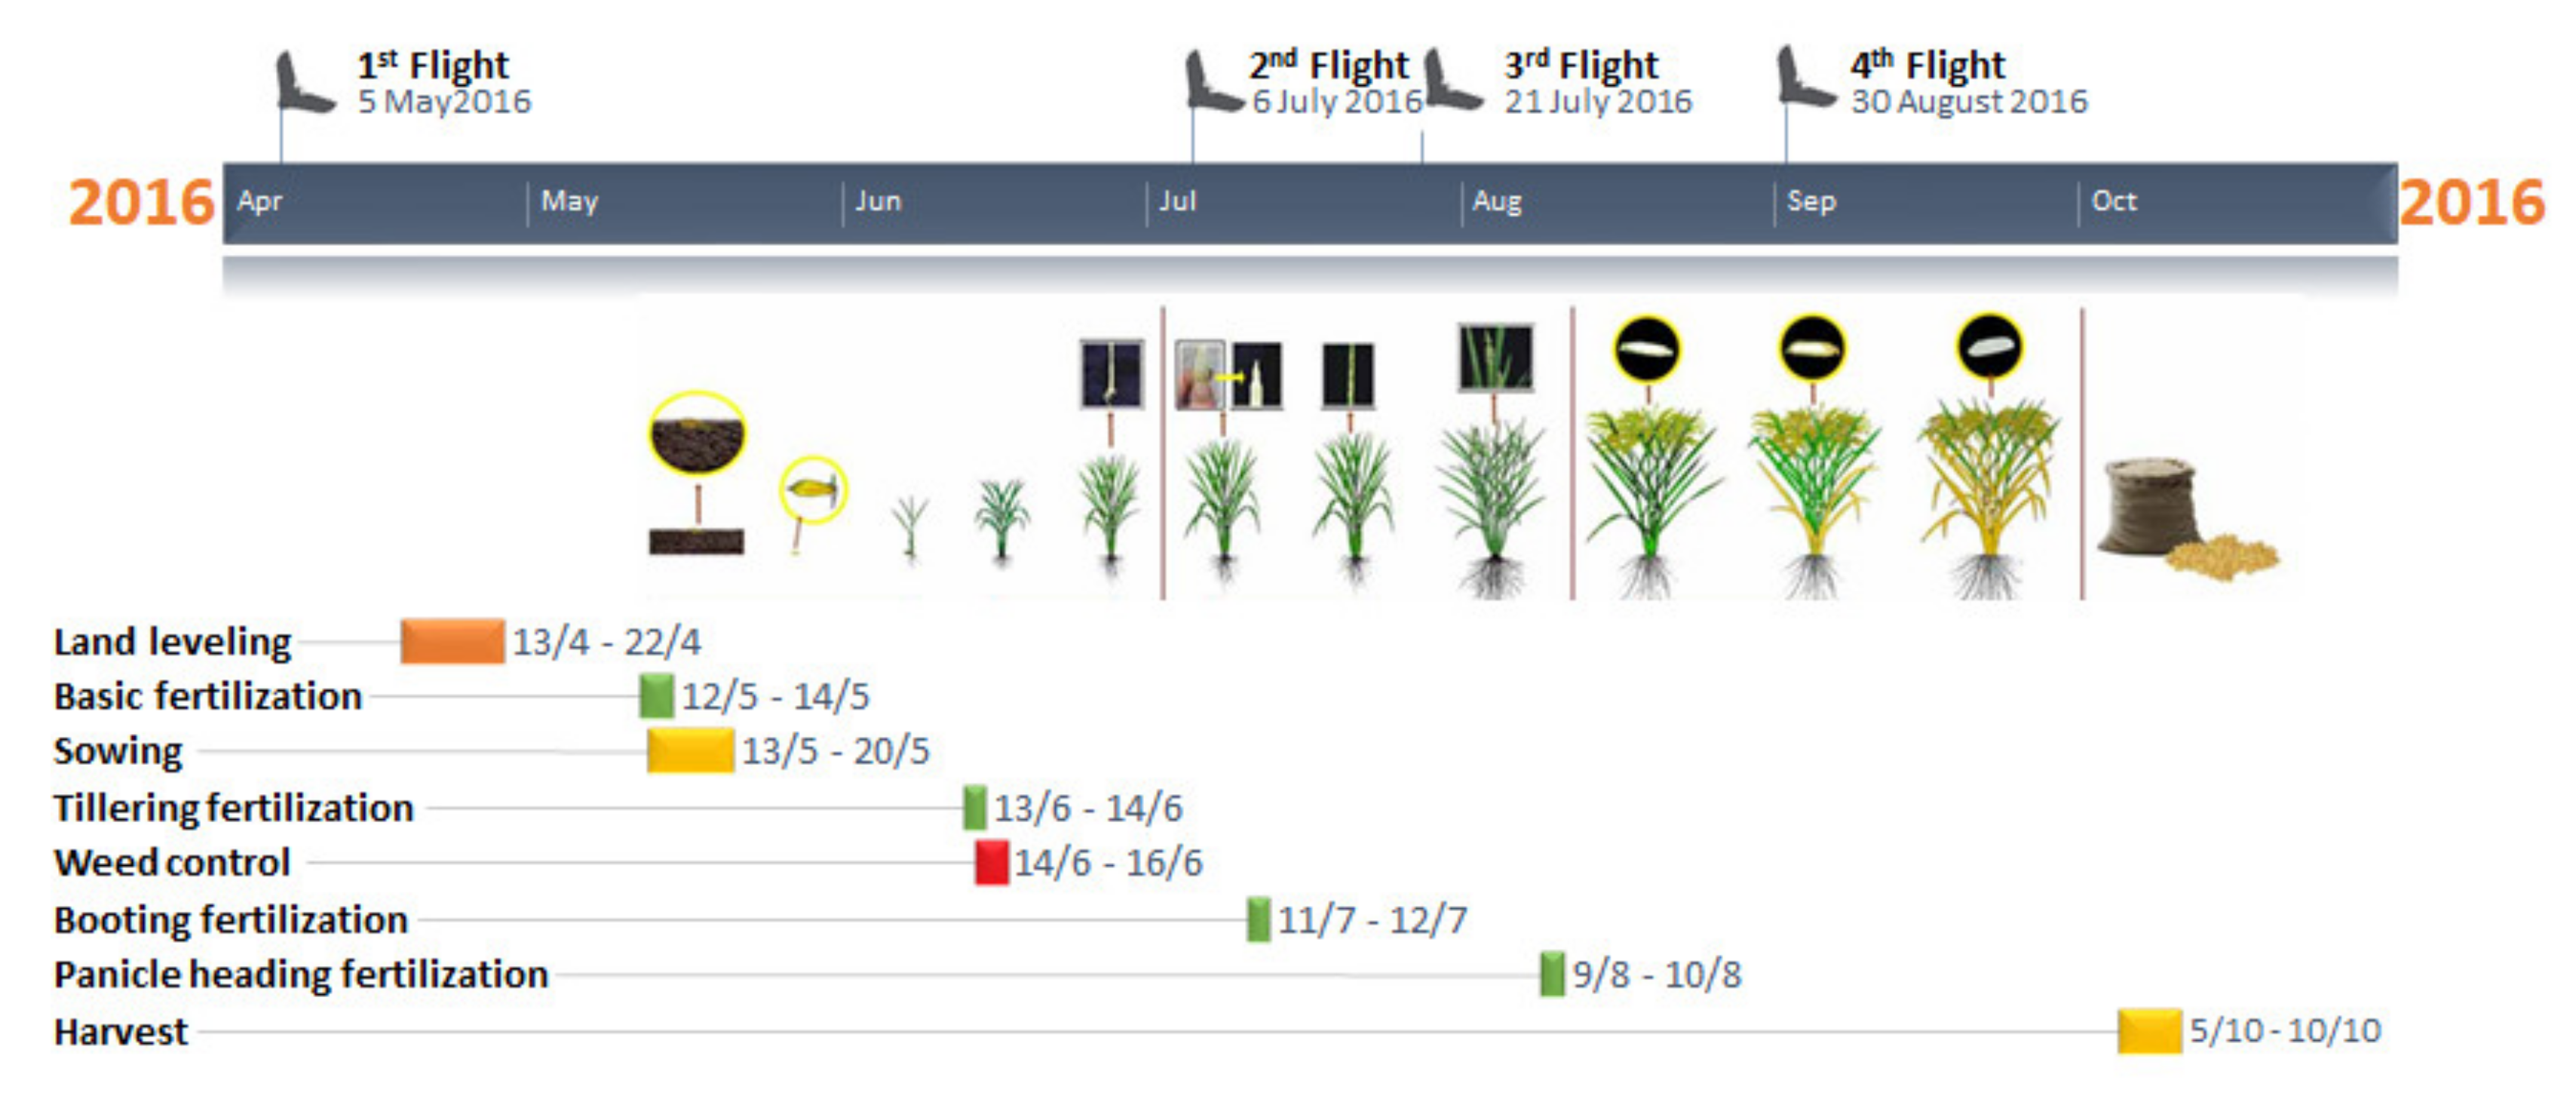
2.2. Remote Sensing and In-Situ Data

The remote sensing data were obtained with UAV (Figure 3) and specifically with the eBee model of SenseFly [19]. The mounted camera is a modified multiSPEC 4C [20] for the needs of research in precision agriculture with four spectral bands at the following wavelengths: 550, 660, 710 and 790 nm (green, red, red edge and near infrared).
The four flights were designed with eMotion software and were taken as much as possible at similar hours of the day (Figure 4), with 20 cm pixel resolution. In addition to multispectral images, 97 samples of point yield data were used in the study from 13 out of 18 rice plots. To collect the rice yield point samples, a cubic metal mesh with a side length of 50 cm was constructed (Figure 5). From the 97 samples, a few days before the start of the harvest, a collection of taxa was carried out, while at the same time the position of each point was recorded with hand GPS. For each plot but also for each of the 97 samples, the yield was calculated by kilograms per hectare, while other information about the crop and cultivation practices was recorded by the producer, such as dates and type of fertilization, crop care, etc. From these primary data, after processing emerged the dataset used for statistical analysis.

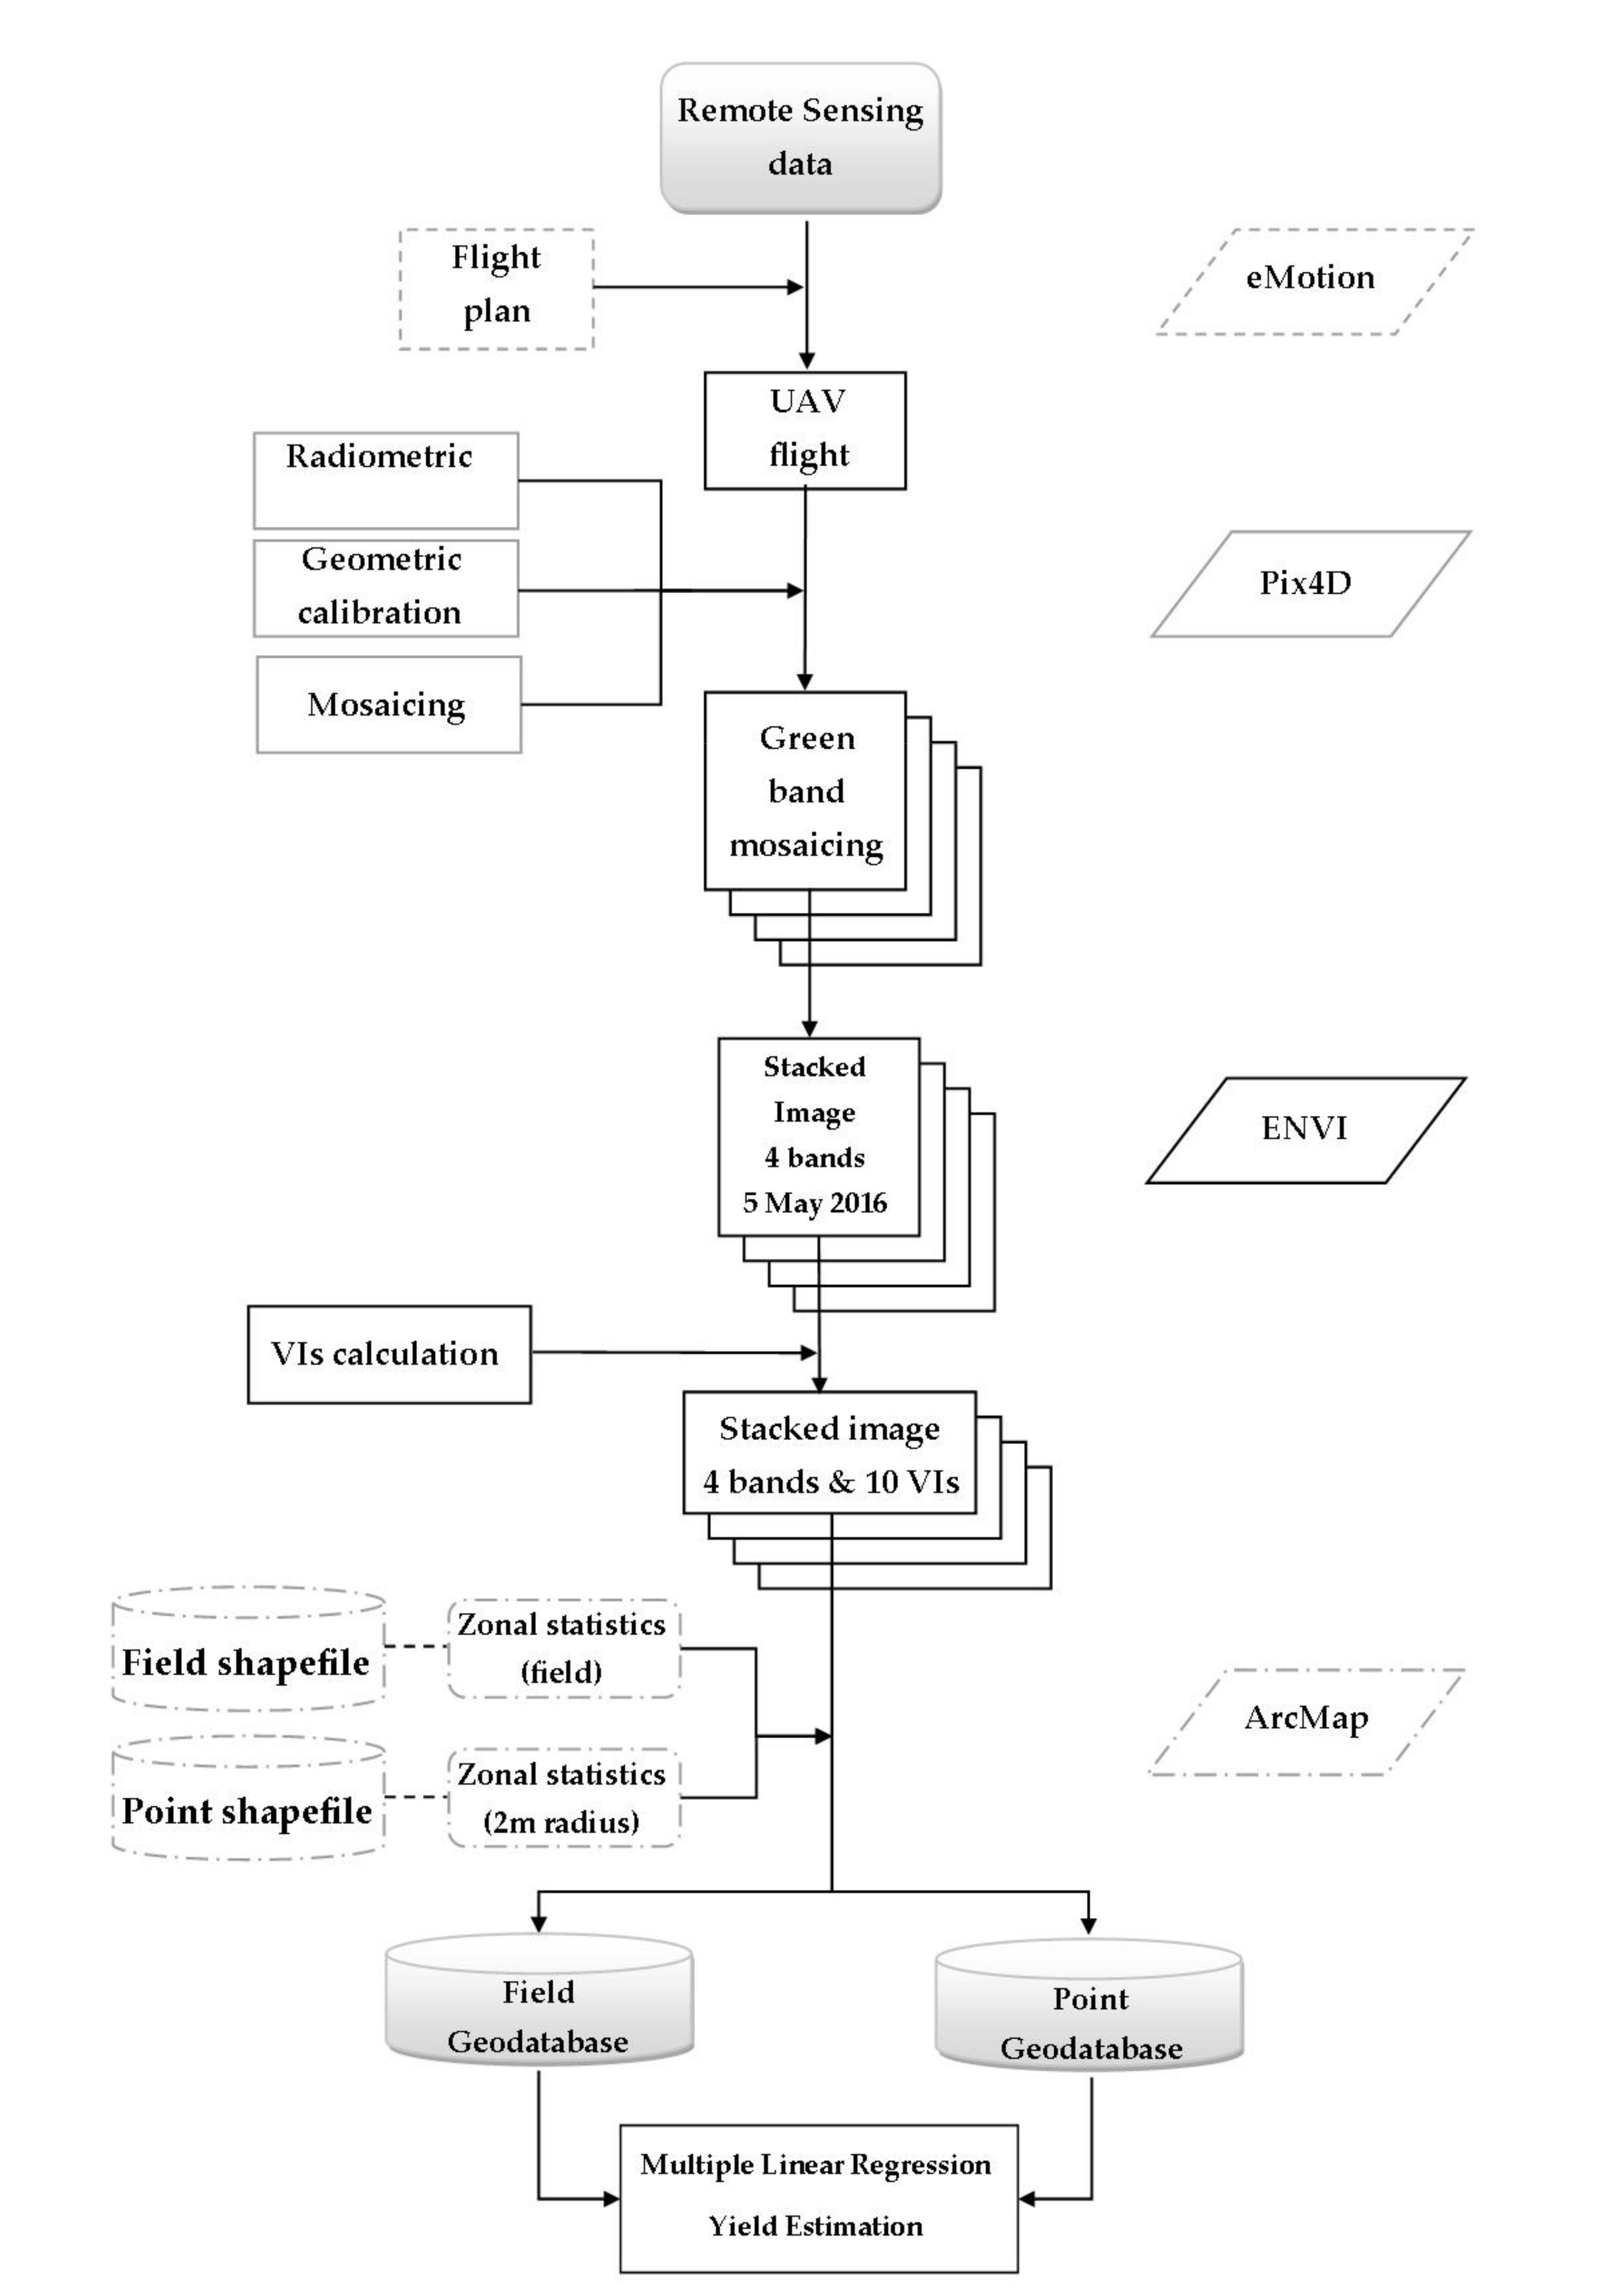
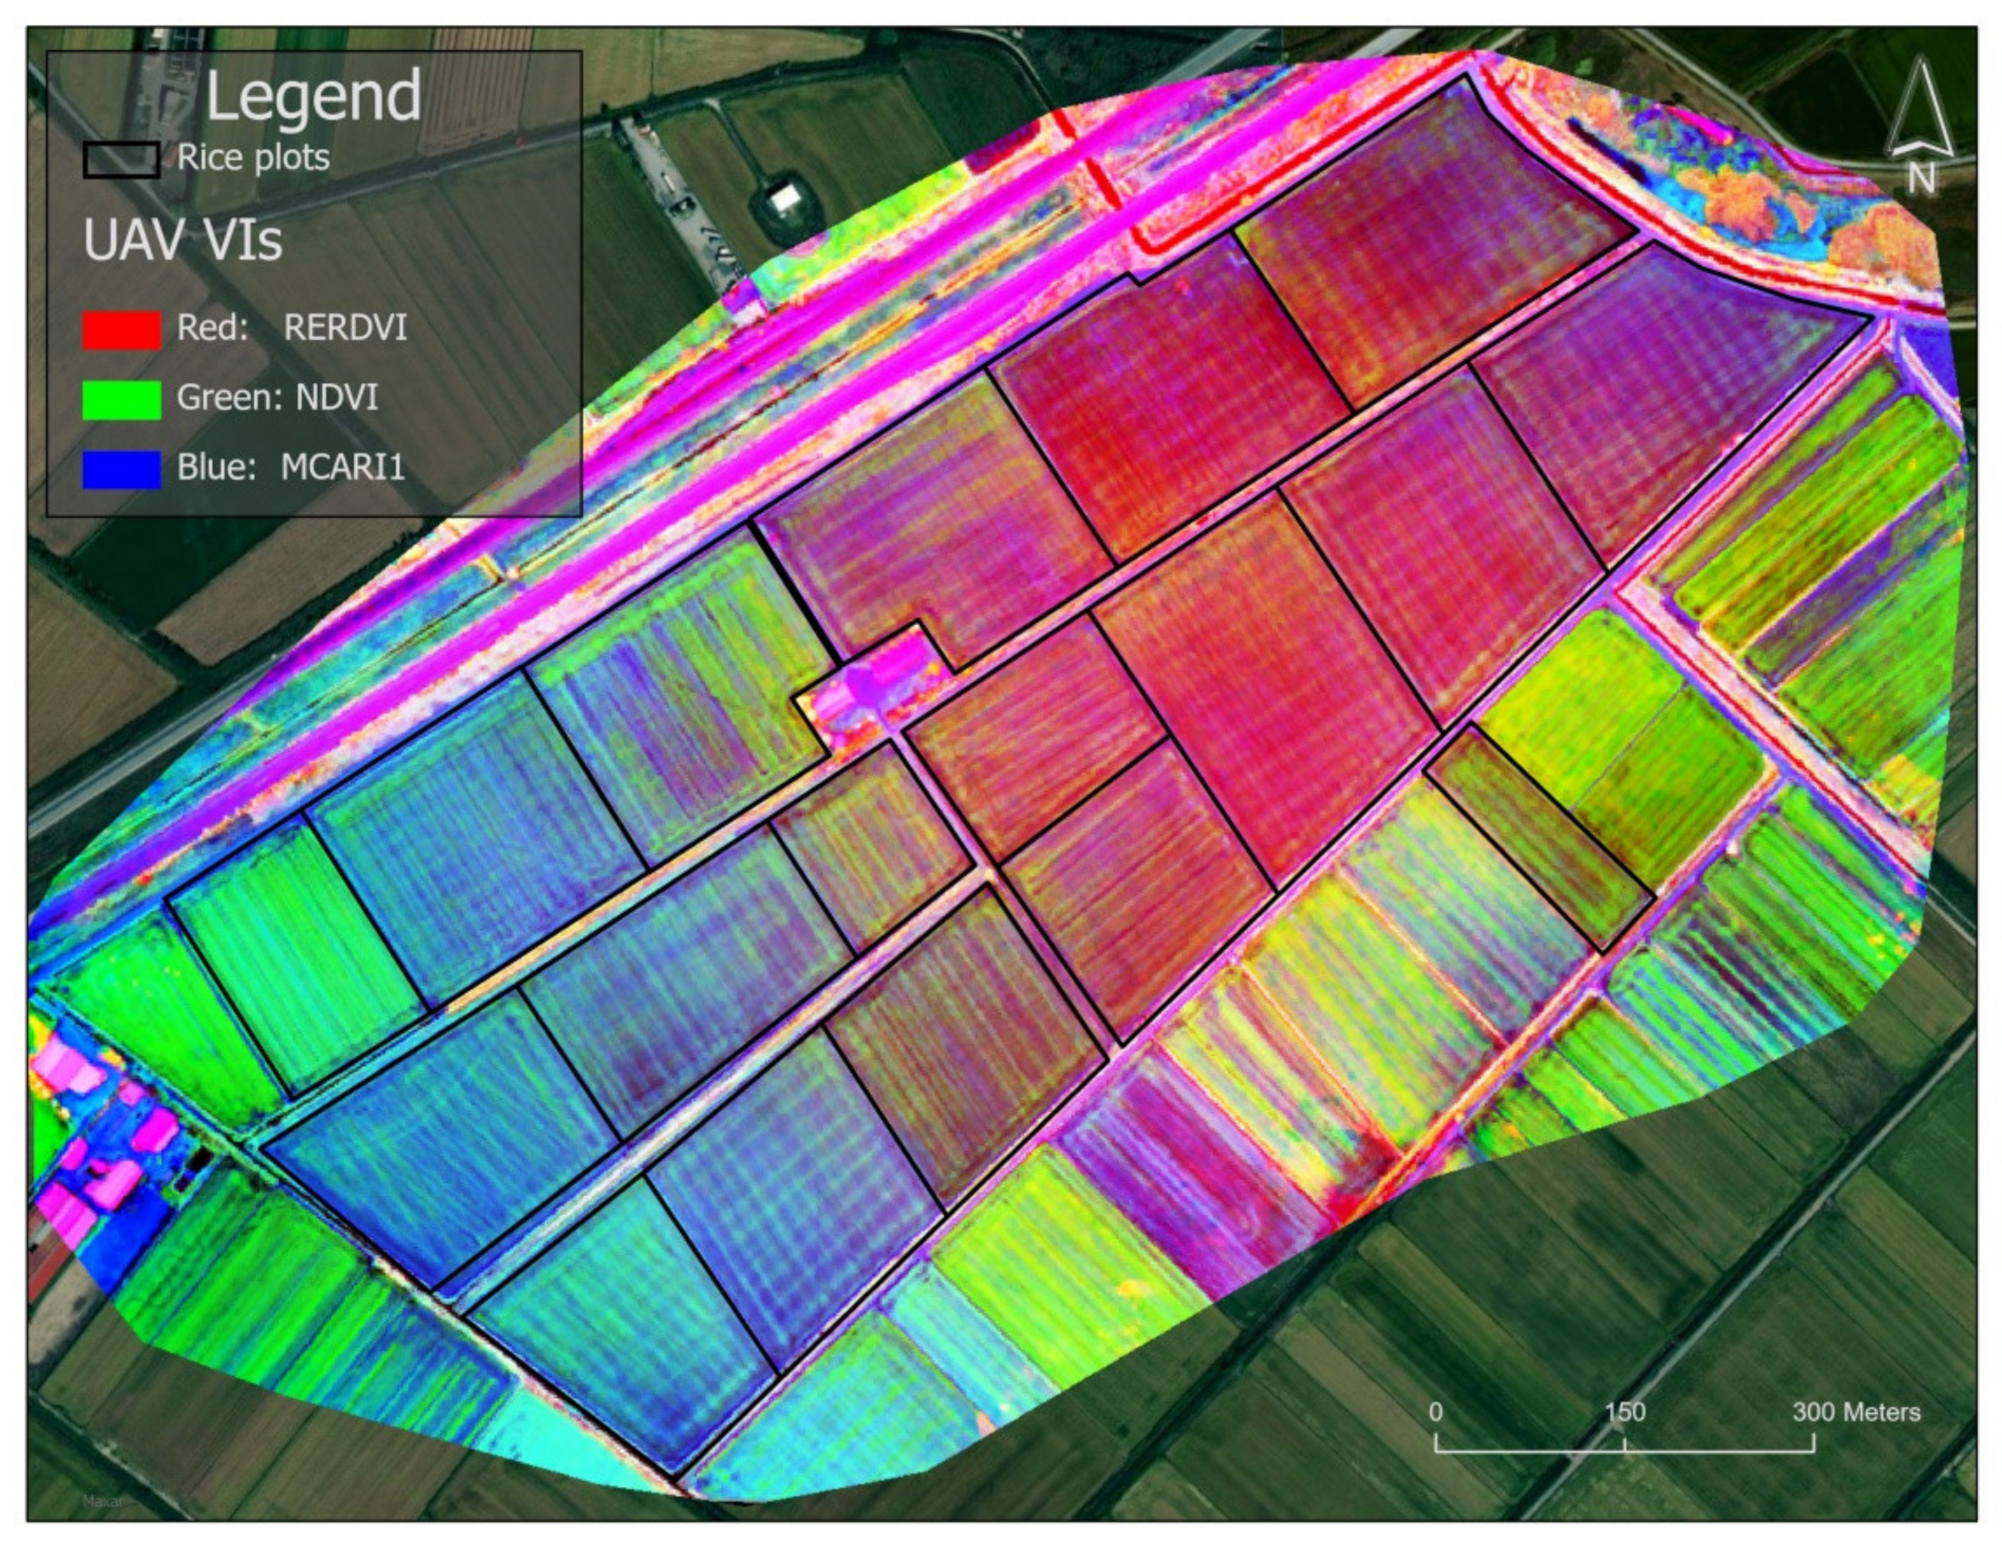
2.3. Image Analysis and Vegetation Indices

The flowchart of the data processing methodology (Figure 6) demonstrates all stages, from remote sensing data acquirement to the final mean value datasets of VIs, per field or sample data area.
The flight plan was designed with eMotion software for each date of UAV flight in the rice fields. With the Pix4D software, the production of the mosaics was automated, after setting some basic parameters. Pix4D radiometric corrections were applied to transform the pixel digital numbers (DNs) to reflectance values using information and data from the calibration card of eBee.
The mosaics were georeferenced, but a further correction was needed to achieve the accuracy of studying the Vis–yield correlation. The rectification step was carried out with a 3rd-degree polynomial function (RMSE < 1.2) using a sufficient number (~30) of fixed ground points (crossroads, building corners, electricity poles, trees, etc.) and with the red band as a background, on which all the other bands “matched” for each shooting date. The co-registration between the composite images of the four dates was carried out with this reference image of 6 July. Beyond that, the bands were stacked on four multispectral images to calculate the VIs.
Many VIs were investigated, incorporating the red edge spectrum. Comparison of complex vegetation indices with spectral bands at 705, 750, 670 and 800 nm in terms of their correlation with chlorophyll content in rice showed a strong correlation when the VIs included red edge and near infrared or some combination of them (at 710 nm and 800 nm) [21]. Due to the low absorption of chlorophyll in the red edge spectrum, its use in the calculation of vegetation indices reduces the saturation often observed at high values of the leaf mass index (LAI), and the reflectivity remains sensitive to the absorption of chlorophyll in medium and high values [22].
The vegetation indices (Table 1) with the multispectral images were stacked in four images with 14 bands (4 spectral bands and 10 VIs). From these four images, firstly the average value was calculated for each field with zonal statistics for the correlation with the mean yield of each plot. In addition to correlating the point yield samples with the VΙs, zonal statistics from a buffer zone of 2 m around each point were made of Vis’ values of an area of approximately 12.5 m2 consisting of 315 pixels (20 cm), to deal with the GPS error due to the low accuracy (1.5 m–2.5 m) around the 97 points.
Preliminary analysis of the existing correlation between yield data and VIs was conducted at 2 “spatial levels” or scales for which data were obtained:
  • At plot scale.
  • At sub-plot scale derived from point data related to yield.
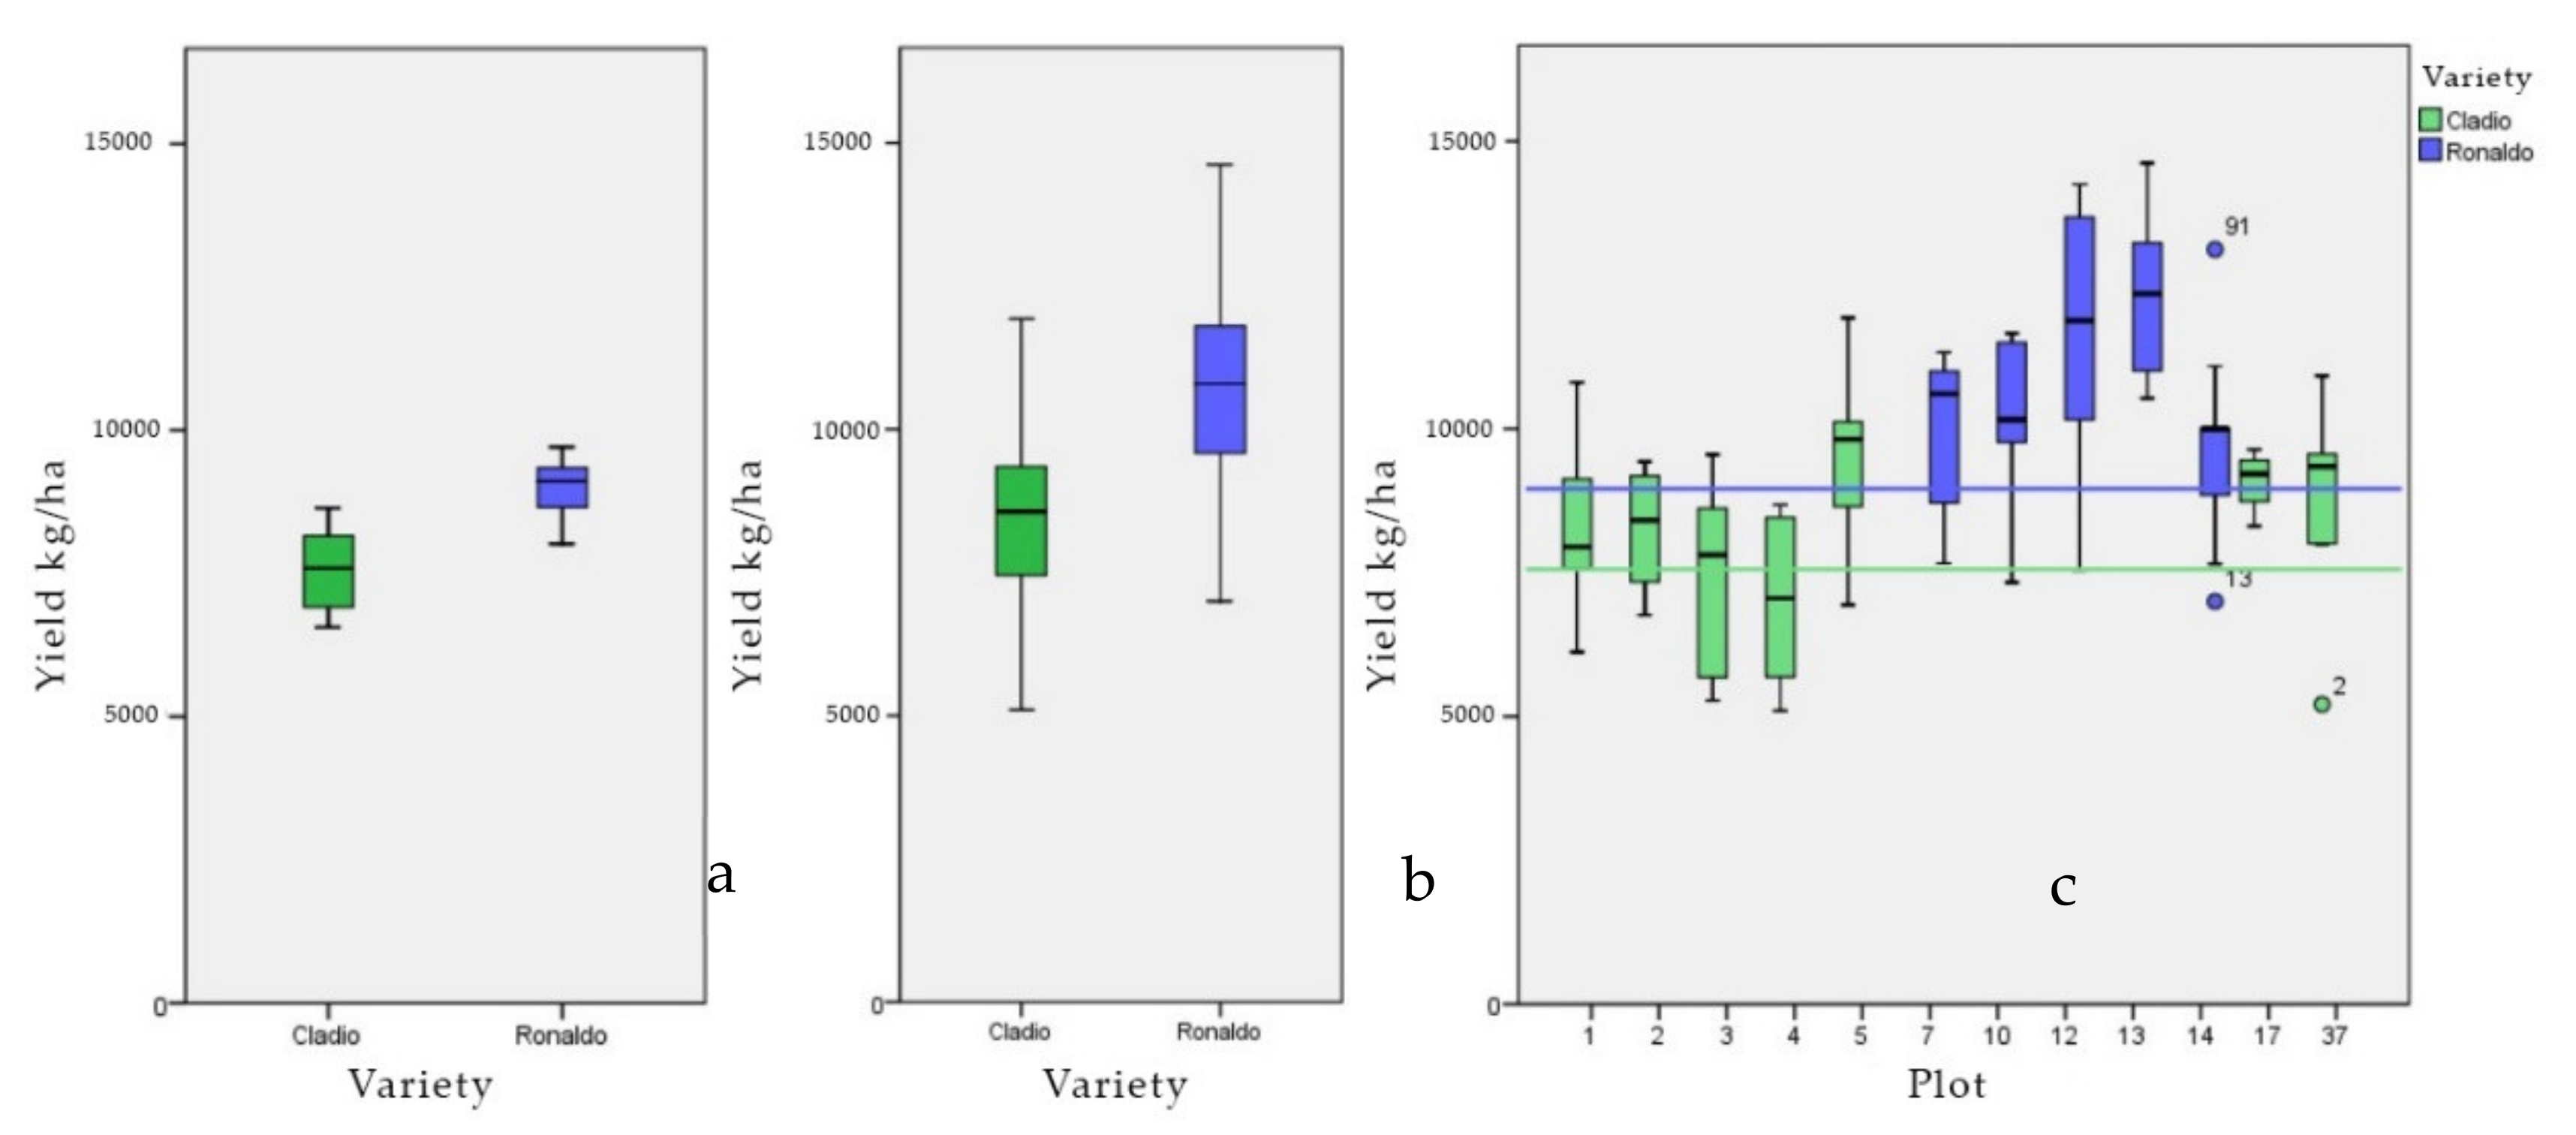
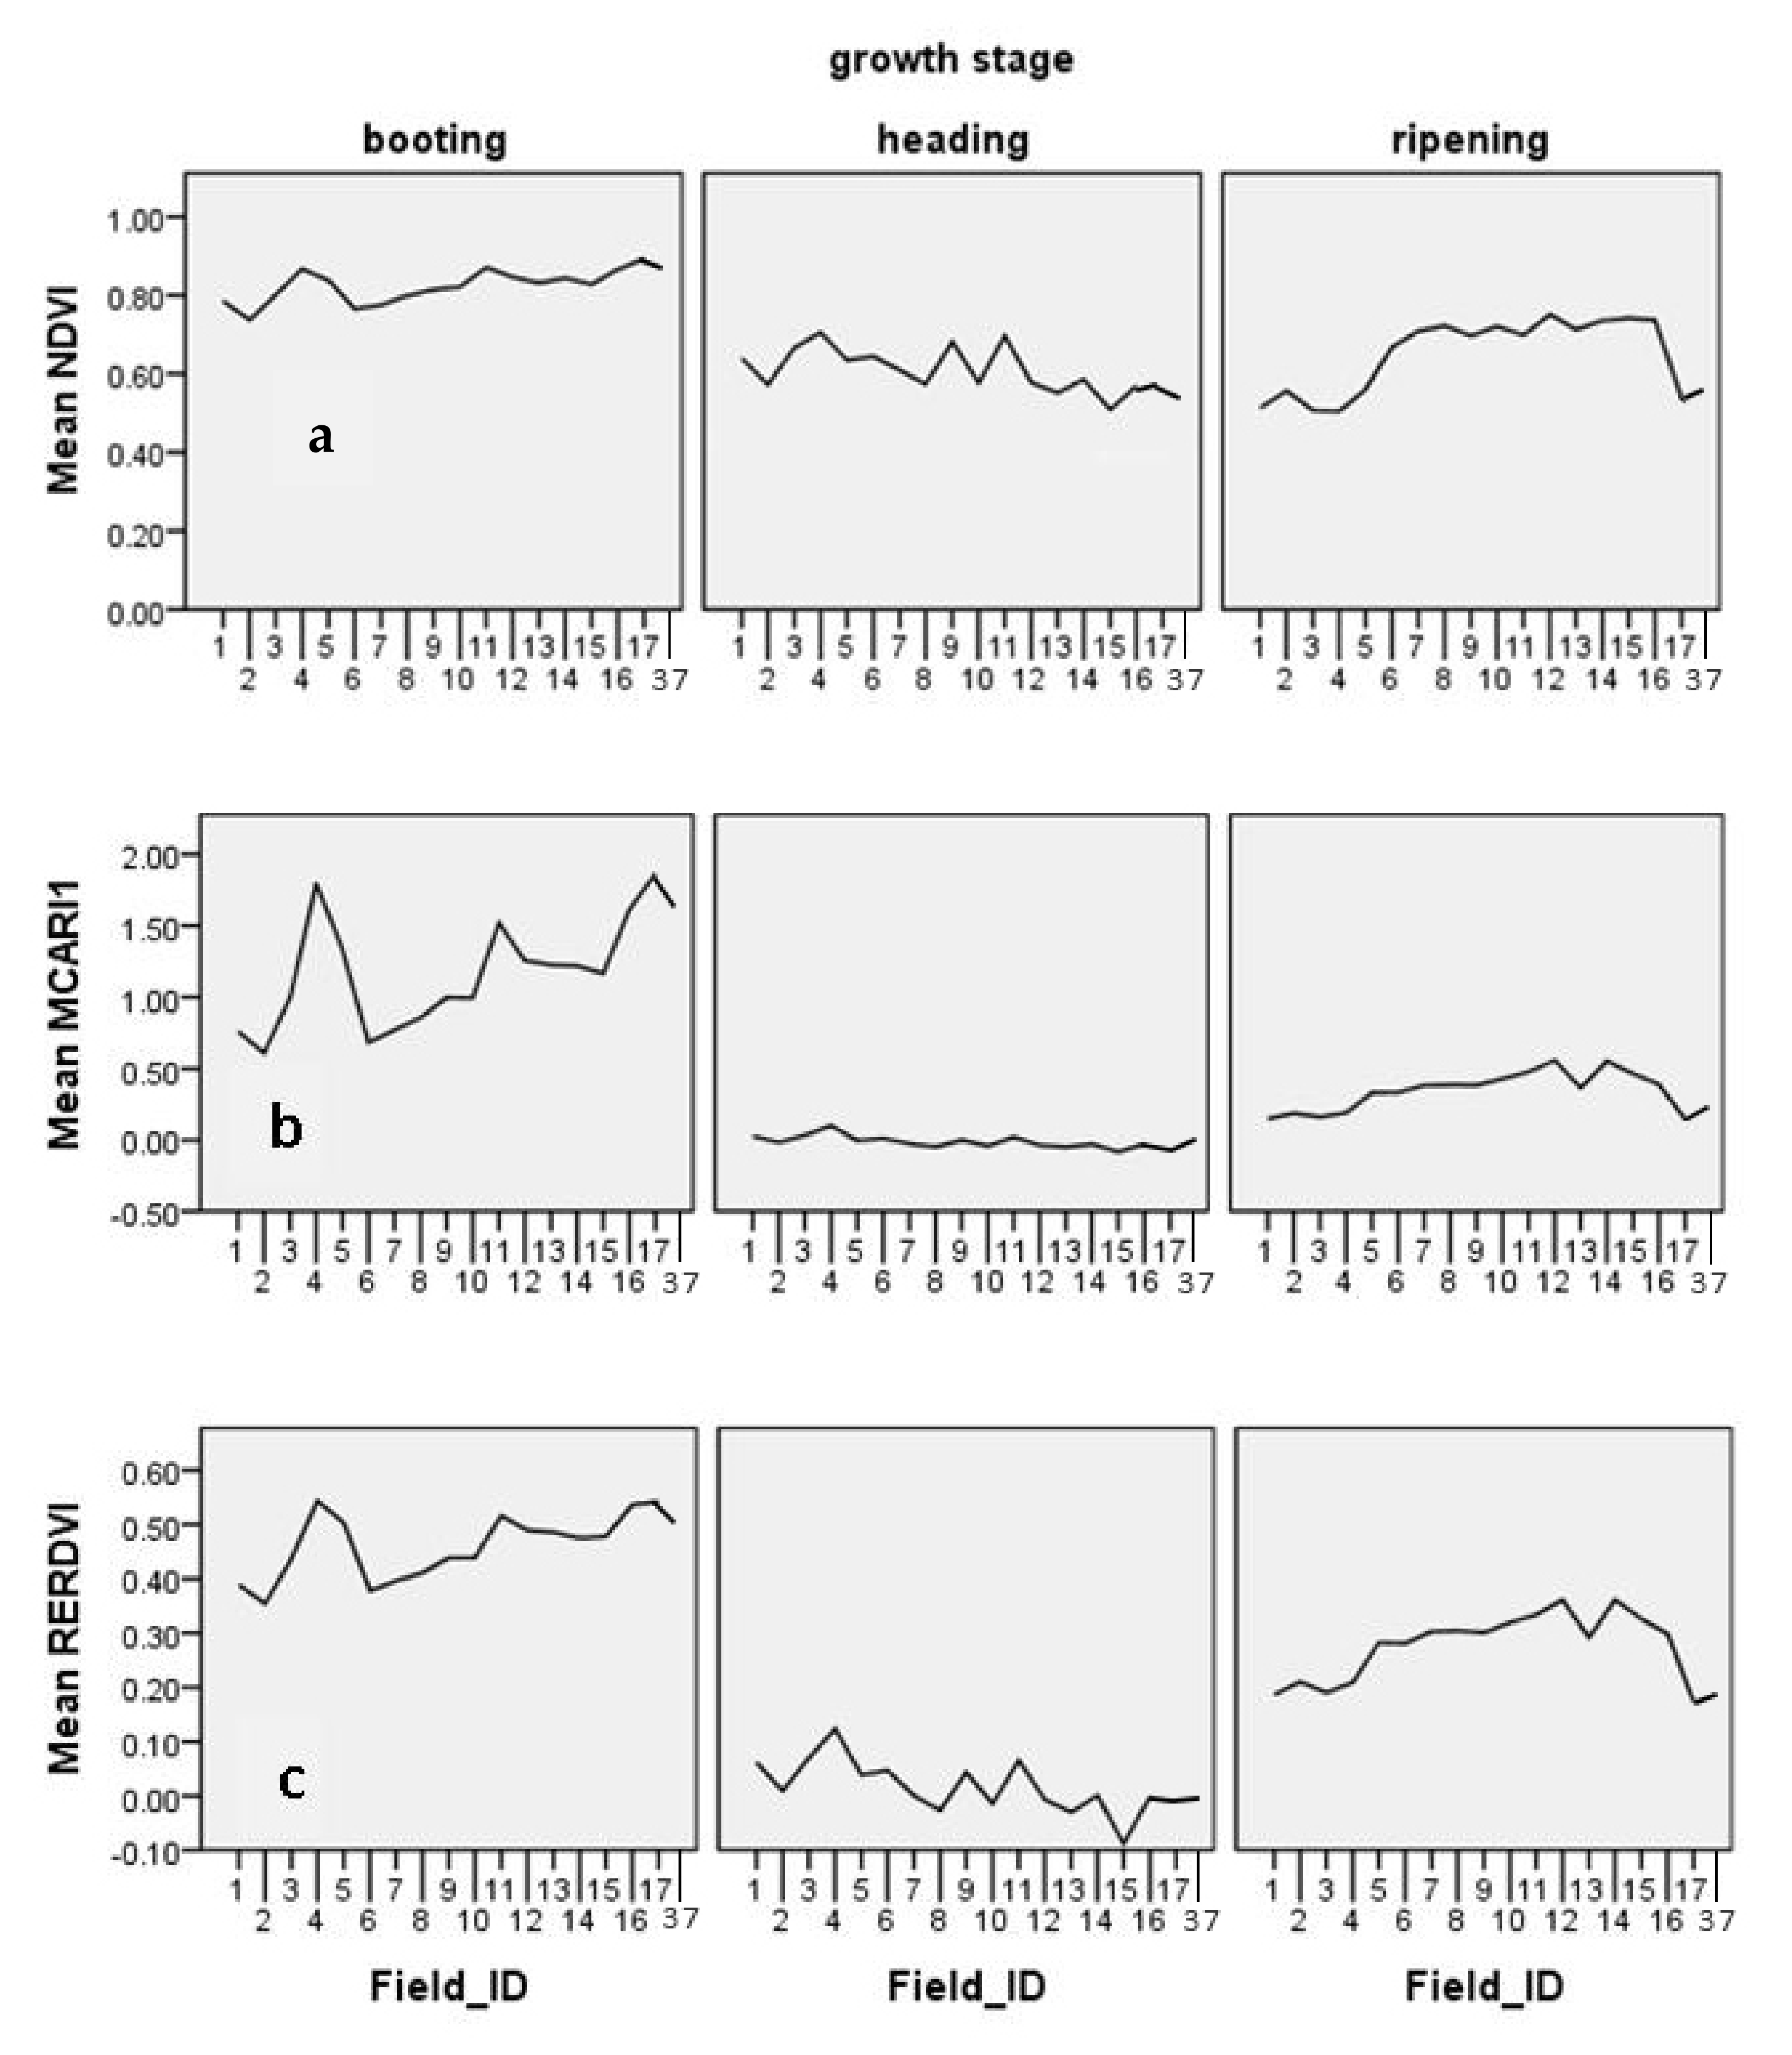
Subsequently, the yield estimation in relation to VIs and multitemporal VIs was based on multiple linear regressions on the different datasets.
In this study, 10 VIs were selected for further analysis, with the first VI being NDVI [23]. It was used in this work as a benchmark, as it has been adequately studied by many researchers and has been known for many years for its correlation with many parameters of plant growth. The second VI (NNIR) is a complex index, as it includes 3 spectral bands. Due to the use of reflectance in the green band, it was found to be strongly correlated with the absorption of nitrogen, which in turn affects the nutrition and ultimately the yield [24]. To reduce NDVI’s observed saturation at the growth stages of maturity and achieve a linear correlation of the biophysical parameters of VI, the REDVI (Renormalized Difference Vegetation Index) was proposed, which combines the advantages of DVI and NDVI [25] and was further improved with the addition of red edge [26]. NDRE (Normalized Difference Red Edge) [27] is essentially the index that occurs after replacing the red band with that of the red edge on the NDVI index. NDRE is a better index of the plant tissue health/vitality than NDVI for mid-to-late-stage crops, where they have accumulated high levels of chlorophyll in their leaves, because the red edge band is penetrates more so the leaves than red light and so is less absorbed. It is more suitable than NDVI for high-yield crops throughout the growing season, because NDVI often loses sensitivity after the plants have accumulated a critical level of leaf cover or chlorophyll content. The Chlorophyll red edge Index (CIre) [28] is used to estimate the total chlorophyll content of leaves. The green and red bands’ reflectance values are sensitive to small changes in chlorophyll. The total chlorophyll content is linearly correlated with this index. Therefore, it is widely used, especially in large crops. MCARI1 [29] is a vegetation index that belongs to the category of solid line vegetation indices. It has a very high correlation with the leaf area index (LAI) and removes interference from the reflectivity of the soil. It also includes the red edge range, so it is considered useful for the study of crops with varying percentages of vegetation and even in the middle-late stage [30]. The RESAVI [26] vegetation index is a variation of the soil adjusted vegetation index (SAVI) and its improved version of OSAVI. RESAVI is resistant to the variability of soil reflectivity and has increased sensitivity to high LAI and vegetation cover greater than 50%. This index is best used in areas with relatively sparse vegetation where the soil is visible through the crown of the plants [31]. The red edge Re-normalized Different Vegetation Index (RERDVI) [26] is an improvement of the Normalized difference Red Edge (NDRE). It is an index for the study of the vitality of the vegetation with mid-late growth when the plant tissues have accumulated high levels of chlorophyll content. The red edge wavelength it uses penetrates more so the leaves than red and is thus less absorbed [32]. The TVI [33] index is calculated as the area of a hypothetical triangle in the spectral space that connects the maximum reflection region in green, the minimum chlorophyll absorption region, and the NIR. When chlorophyll absorption causes a decrease in reflectance in the red spectrum and the abundance of leaves causes an increase in reflectance in the NIR, the total area of the triangle and therefore the value of the index increases. It is good for estimating LAI, but its sensitivity to chlorophyll increases with increasing crown density [34]. The MTVI2 [29] VI is a variant of MTVI and in essence an improvement of TVI. It is considered to be strongly correlated with LAI and corrects soil reflectivity at very low LAI values. Its values are influenced by structural elements of plant tissues and are also related to the quality characteristics of the plant. In Figure 7, three Vis are demonstrated with RGB, where red is RERDVI, green is NDVI and blue is MCARI1.
Further to the above VIs, 3 multitemporal VIs [11] were also calculated:
MRL(VI) = a xi + b xj + c
SUM(VI) = xi + xj
MAX(VI) = Max (xi, xj)
where xi and xj represent the values of vegetation indices at two different stages of development. For the experiment of this work, the method of calculating the multitemporal vegetation indices is described in Table 2.

3. Results

In the present experiment, one factor that exists is the different rice variety. The following graphs were designed to visually investigate how rice production is affected by varieties (Figure 8).
In addition, the range of yield for each variety, as shown by the yield point data, appears to be significantly larger than that obtained from the average yields for each variety. This indicates the existence of variability within the parcels that affect yield.
Figure 8a shows the difference in yield between the two rice varieties, which is also proved statistically (F = 19.323, Sig = 0.000) while the descriptive statistics are shown in the Table 3.
Moreover, it can be seen in Figure 8b that the point yield data, when viewed by variety, are slightly biased upwards. In other words, it seems that the average value of the yield (in kg/ha) is higher in both varieties than that which results from the total yield of the parcels. This is because the sampler chose for the yield samples areas where the cultivation did not present any problems. However, the averages of the plots also take into account areas with stressed vegetation, such as those near the boundaries of the plots or areas where the vegetation has been degraded by other factors (diseases, reduced plant density, etc.).
Additionally, the spatial variability is recognized in many cases from other similar experiments in Greece, even in small plots of land of 1 hectare. It is therefore common practice to test NDVI at the beginning of the growing season to assess this variability [35]. The assumption of existing soil variability was taken into account and effort was made in order to observe it. To investigate this hypothesis from the two data sets, Pearson’s linear correlation values were initially calculated for the general population and each variety separately (Table 4). Of the ten VIs that were calculated during the phenological stages of booting, panicle heading and ripening, three VIs were selected for further analysis: NDVI (as a benchmark), RERDVI (due to the best correlation with yield for the Ronaldo variety) and MCARI1 (due to the best correlation with yield for the Gladio variety) (Table 4).
The difference between the two varieties is demonstrated. For Ronaldo, the vegetation indices at the stage of panicle heading are not correlated at all with the yield, while both at the stage of booting and ripening are very strongly correlated. Conversely, for Gladio, a strong correlation emerges for the first two stages (booting and panicle heading), while on the ripening it seems that the vegetation indices cannot estimate the yield with accuracy.
In Figure 9 the NDVI between the three dates appears different. On the 6 July, on the phenological stage of booting the average values are in the range 0.74–0.89, but without signs of saturation (which is presented a little earlier at the stage of maximum tillering). On 21 July, the heading stage had a lower average value, while on 30 August the NDVI maintained its low values. These values are expected, as at the stage of booting has already formed and the crop is close to flowering, where the germination as reflected by other parameters (LAI, fpar, etc.) goes down, to have its lowest average value (of the three examined dates) on 30 August when rice cultivation is at the beginning of ripening.
We also notice that both MCARI1 and especially RERDVI increase their value on all plots, especially at the ripening stage. This is explained by the fact that these indices utilize the red edge spectrum and are therefore more sensitive to the ripening stage of the crop, at which time the chlorination of the plants has declined significantly.
The above observation can be explained by the physiology of the plants of each variety in combination with the theory behind the vegetation indices and the correlation of VIs with rice growth cycle [36]. The Ronaldo is a late-maturing variety, of low vivacity, especially after the stage of panicle heading, which grows very tall, has long internodes in the flowering stem and gives a very large yield [37]. The stage of heading begins around the time of taking the multispectral image (21 July) and for lasts many days after. During this stage, the plant is stressed, as it was preceded by fertilization to help the booting (on 11 July) with fast absorption fertilizer, while the next fertilization (at the peak of this stage) took place on 10 August. On the other hand, the Gladio variety is premature, about 20 days earlier and livelier, with short internodes, and on 21 July it has completed the vegetative stage of growth and booting has already formed. The yield seems to be more strongly correlated with the vegetation indices as it does not face the delay in Ronaldo’s growth. In Gladio, however, due to prematurity, the multispectral image of 30 August cannot be correlated with yield, as the plants are already at the stage of fruit filling and have been fertilized a few days before (10 August).
The results of the linear regression analysis using the multitemporal vegetation indices [11] as independent variables and the yield as dependent are summarized in Table 5 and the regression models on Supplementary Material. As shown, yield from both varieties is strongly correlated with the VIs already from the first acquiring date of remote sensing data, something that is not captured for the next data acquisition dates.
For the Ronaldo variety the yield has a strong dependence on multitemporal NDVI from the first and third flight (on 6 July and 30 August) (R2 = 0.76), while there is a weak dependence on NDVI from the other 2 days. However, there is also a significant dependence on the use of the multitemporal index SUM (VI) concerning the third date of any combination of dates, while the Ronaldo’s yield dependence on the multitemporal index MRL is high (R2 = 0.75). In addition, the dependence of yield from the RERDVI index (R2 = 0.77) is achieved by utilizing data from the first and last flight (on 6 July and 30 August). RERDVI utilizes data from the red edge band, which is sensitive to parameters such as N uptake and yield [38]. However, there is a significant improvement in the dependence of yield with the multitemporal index SUM (VI) concerning data of the first and third flights, while the maximum yield dependence is achieved with the multitemporal index MRL (R2 = 0.81).
The yield of the Gladio variety has a strong dependence on NDVI and MCARI1 (NDVI R2 = 0.88, MCARI1 R2 = 0.95) by using data from the first flight (on 6 July), while there is weak dependence for the last date. Contrary to what happens in the Ronaldo variety, there is no improvement with the use of the SUM (VI) index over a single date, whatever combination of dates is chosen.

4. Discussion

It is generally accepted that no yield estimation model is accurate locally unless developed and tested locally [39]. Some of these models are integrated into broader decision support systems that are currently in the form of software and being developed directly for farmers so that they can implement optimal management, save money and apply them to crop management information systems [40].
The results of this study showed that the yield prediction varies according to the rice variety; therefore, the R2 values are improved with multitemporal VIs and they can give better results, as mentioned in the literature [41]. This study captured that a single-date VI can be used for yield estimation but varies considerably depending on the variety and the VI, while the estimation is focused on one field. In future research, VIs that have the green band in the calculation may be further exploited to identify management zones [42] or to assess crop characteristics of differing physiology and phenology [43].
The main problems regarding yield prediction with VIs are that the VIs lose sensitivity in the last growth stages and they saturate at dense vegetation [44]. In this study we were not faced with the saturation error mainly because of the red-edge usage on VIs which have great potential for yield estimation [45] and rice growth monitoring [46], while the used VIs remained sensitive in all acquisition dates. The strongest correlation of VIs with yield was on the booting stage of Ronaldo and booting and heading for Gladio variety, something that is also confirmed in the literature [11,47,48]. In addition, it is common to use different wavelengths’ VIs for each growth stage [49], since the sensitivity of VIs changes at different stages of rice plant growth.
As already seen from the preliminary statistical and qualitative analysis of the data, all vegetation indices depend on physiology and phenology of rice plants. This is to be expected, as the reflectance values of the radiation at the wavelengths are included and determine the values of VIs. In essence, they are affected by the type of plant tissue (crop or weeds), the structure of the plant tissues and their proportion (chlorophyll content, N, etc.), the soil parameters and the vegetation density.
In conclusion, the UAV with the ability to acquire multispectral imagery according to the phonological stage of the rice plants can be used for precision agriculture applications with single-date VIs or multitemporal VIs [11]. Additionally, UAV imagery is more applicable for field-scale rice yield estimation with pixel size of 10–30 cm, bypassing cloud cover problems, in contrast to remote sensing platforms with lower resolution [50]. The yield estimation models at any growth stage are useful for farm risk management, and it can be a decision support system for rice plant cultivation practices [51]. Finally, the purpose of UAVs is to replace field measurements for rice growth monitoring, yield estimation and crop needs, which has not yet reached the level set by the research community [44].

5. Conclusions

The optimal correlation of VIs studied with the yield is achieved using linear regression, although in the literature some non-normalized VIs would be expected to behave differently. The variability within the parcels attributed to the soil composition and the nutrition of the plants predictably affects the most sensitive vegetation indices of the present study. This variability is highlighted even by the qualitative examination of the Vis’ maps of the parcels, the soil maps and the yield maps.
NDVI is strongly correlated with the yield level for each plot regardless of variety, even when it is calculated at an early stage (6 July). Of the remaining VIs, RERDVI for Ronaldo and MCARI1 for Gladio have the highest correlation coefficients with yield, even when calculated at the booting stage.
The multitemporal VIs calculated by combinations of VIs from different stages have an increased correlation with the yield, although again the variety has a very large effect here as well. In particular, for the Ronaldo variety, the examination of the multitemporal VIs increases the estimation accuracy of the crop at all stages (R2 increases up to 0.63), while in the Gladio variety there is an improvement only at the stage of crop maturation.
Utilization of the largest number of measurements of yield point data did not contribute positively to the improvement of the correlation of the Vis with yield. This is attributed to the accumulation of systematic errors in the calculation of VIs and the spectral outliers. These systematic errors are attributed to position errors in the field. It seems that more precision is required when receiving field data, possibly using RTK GPS.
In conclusion, the calculation of multitemporal VIs from several dates, e.g., per week, is feasible using the UAVs and may further improve yield estimation accuracy and accurately identify the crop development stages that are most important for its estimation to improve management and cultivation practices.

Supplementary Materials

The following are available online at https://www.mdpi.com/article/10.3390/agriculture11090809/s1. Supplementary Material–Linear regression models.

Author Contributions

Conceptualization, N.P. and D.K.; methodology, N.P. and D.K.; formal analysis and investigation, N.P.; data curation, N.P.; and R.G.; writing—original draft preparation, N.P.; and R.G.; writing—review and editing, N.P., R.G. and D.K.; visualization, R.G.; supervision and project administration, D.K. All authors have read and agreed to the published version of the manuscript.

Funding

This research received no external funding.

Informed Consent Statement

Not applicable.

Conflicts of Interest

The authors declare no conflict of interest.

References

  1. Godfray, H.C.J.; Beddington, J.R.; Crute, I.R.; Haddad, L.; Lawrence, D.; Muir, J.F.; Pretty, J.; Robinson, S.; Thomas, S.M.; Toulmin, C. Food Security: The Challenge of Feeding 9 Billion People. Science 2010, 327, 812–818. [Google Scholar] [CrossRef] [PubMed] [Green Version]
  2. Ricepedia. Available online: https://ricepedia.org/rice-as-food/the-global-staple-rice-consumers (accessed on 8 February 2018).
  3. Koizumi, T.; Furuhashi, G. Global Rice Market Projections Distinguishing Japonica and Indica Rice under Climate Change. Jpn. Agric. Res. Q. 2020, 54, 63–91. [Google Scholar] [CrossRef] [Green Version]
  4. FAOSTAT. Available online: http://www.fao.org/faostat/en/#data/QC (accessed on 21 July 2021).
  5. Arable Land (Hectares)—Greece|Data. Available online: https://data.worldbank.org/indicator/AG.LND.ARBL.HA?end=2018&locations=GR&start=1961&view=chart (accessed on 21 July 2021).
  6. Mosleh, M.; Hassan, Q.; Chowdhury, E. Application of Remote Sensors in Mapping Rice Area and Forecasting Its Production: A Review. Sensors 2015, 15, 769–791. [Google Scholar] [CrossRef] [PubMed] [Green Version]
  7. Muharam, F.M.; Nurulhuda, K.; Zulkafli, Z.; Tarmizi, M.A.; Abdullah, A.N.H.; Che Hashim, M.F.; Mohd Zad, S.N.; Radhwane, D.; Ismail, M.R. UAV- and Random-Forest-AdaBoost (RFA)-Based Estimation of Rice Plant Traits. Agronomy 2021, 11, 915. [Google Scholar] [CrossRef]
  8. Reynolds, C.A.; Yitayew, M.; Slack, D.C.; Hutchinson, C.F.; Huete, A.; Petersen, M.S. Estimating Crop Yields and Production by Integrating the FAO Crop Specific Water Balance Model with Real-Time Satellite Data and Ground-Based Ancillary Data. Int. J. Remote Sens. 2000, 21, 3487–3508. [Google Scholar] [CrossRef]
  9. Curry, B.R. Dynamic Simulation of Plant Growth—Part I. Development of a Model. Trans. ASAE 1971, 14, 946–0949. [Google Scholar] [CrossRef]
  10. Hatfield, J.L.; Prueger, J.H.; Sauer, T.J.; Dold, C.; O’Brien, P.; Wacha, K. Applications of Vegetative Indices from Remote Sensing to Agriculture: Past and Future. Inventions 2019, 4, 71. [Google Scholar] [CrossRef] [Green Version]
  11. Zhou, X.; Zheng, H.B.; Xu, X.Q.; He, J.Y.; Ge, X.K.; Yao, X.; Cheng, T.; Zhu, Y.; Cao, W.X.; Tian, Y.C. Predicting Grain Yield in Rice Using Multi-Temporal Vegetation Indices from UAV-Based Multispectral and Digital Imagery. J. Photogramm. Remote Sens. 2017, 130, 246–255. [Google Scholar] [CrossRef]
  12. Xue, L.-H.; Cao, W.-X.; Yang, L.-Z. Predicting Grain Yield and Protein Content in Winter Wheat at Different N Supply Levels Using Canopy Reflectance Spectra. Pedosphere 2007, 17, 646–653. [Google Scholar] [CrossRef]
  13. Becker-Reshef, I.; Vermote, E.; Lindeman, M.; Justice, C. A Generalized Regression-Based Model for Forecasting Winter Wheat Yields in Kansas and Ukraine Using MODIS Data. Remote Sens. Environ. 2010, 114, 1312–1323. [Google Scholar] [CrossRef]
  14. Wang, L.; Tian, Y.; Yao, X.; Zhu, Y.; Cao, W. Predicting Grain Yield and Protein Content in Wheat by Fusing Multi-Sensor and Multi-Temporal Remote-Sensing Images. Field Crops Res. 2014, 164, 178–188. [Google Scholar] [CrossRef]
  15. Torres-Sánchez, J.; Peña, J.M.; de Castro, A.I.; López-Granados, F. Multi-Temporal Mapping of the Vegetation Fraction in Early-Season Wheat Fields Using Images from UAV. Comput. Electron. Agric. 2014, 103, 104–113. [Google Scholar] [CrossRef]
  16. Pradhan, S.; Bandyopadhyay, K.K.; Sahoo, R.N.; Sehgal, V.K.; Singh, R.; Gupta, V.K.; Joshi, D.K. Predicting Wheat Grain and Biomass Yield Using Canopy Reflectance of Booting Stage. J. Indian Soc. Remote Sens. 2014, 42, 711–718. [Google Scholar] [CrossRef]
  17. Lugano Leonardo. Available online: http://www.lugano.it/en/products/ronaldo (accessed on 18 June 2021).
  18. Almosementi|Gladio; Almo S.p.A.: Mortara, Pavia, Italy.
  19. EBee X Fixed-Wing Mapping and Surveying Drone—SenseFly. Available online: https://www.sensefly.com/drone/ebee-x-fixed-wing-drone/ (accessed on 16 June 2021).
  20. User Manual MultiSPEC 4C Camera; senseFly Ltd: Cheseaux, Switzerland, 2014.
  21. Xu, X.; Gu, X.; Song, X.; Li, C.; Huang, W. Assessing Rice Chlorophyll Content with Vegetation Indices from Hyperspectral Data. In Proceedings of the Computer and Computing Technologies in Agriculture IV, Nanchang, China, 22–25 October 2010; Li, D., Liu, Y., Chen, Y., Eds.; Springer: Berlin/Heidelberg, Germany, 2011; pp. 296–303. [Google Scholar]
  22. Gitelson, A.; Merzlyak, M.N. Spectral Reflectance Changes Associated with Autumn Senescence of Aesculus Hippocastanum L. and Acer Platanoides L. Leaves. Spectral Features and Relation to Chlorophyll Estimation. J. Plant Physiol. 1994, 143, 286–292. [Google Scholar] [CrossRef]
  23. Rouse, W.J.; Haas, H.R.; Schell, A.J.; Deering, W.D. Monitoring Vegetation Systems in the Great Plains with ERTS. Third ERTS Symp. 1973, 1, 309–317. [Google Scholar]
  24. Sripada, R.P.; Heiniger, R.W.; White, J.G.; Meijer, A.D. Aerial Color Infrared Photography for Determining Early In-Season Nitrogen Requirements in Corn. Agron. J. 2006, 98, 968–977. [Google Scholar] [CrossRef]
  25. Roujean, J.-L.; Breon, F.-M. Estimating PAR Absorbed by Vegetation from Bidirectional Reflectance Measurements. Remote Sens. Environ. 1995, 51, 375–384. [Google Scholar] [CrossRef]
  26. Cao, Q.; Miao, Y.; Wang, H.; Huang, S.; Cheng, S.; Khosla, R.; Jiang, R. Non-Destructive Estimation of Rice Plant Nitrogen Status with Crop Circle Multispectral Active Canopy Sensor. Field Crops Res. 2013, 154, 133–144. [Google Scholar] [CrossRef]
  27. Barnes, E.; Clarke, T.R.; Richards, S.E.; Colaizzi, P.; Haberland, J.; Kostrzewski, M.; Waller, P.; Choi, C.; Riley, E.; Thompson, T.L. Coincident Detection of Crop Water Stress, Nitrogen Status, and Canopy Density Using Ground Based Multispectral Data. In Proceedings of the Fifth International Conference on Precision Agriculture, Bloomington, MN, USA, 16–19 July 2000; ASA-CSSA-SSSA: Madison, WI, USA, 2000. [Google Scholar]
  28. Gitelson, A.A. Remote Estimation of Canopy Chlorophyll Content in Crops. Geophys. Res. Lett. 2005, 32, L08403. [Google Scholar] [CrossRef] [Green Version]
  29. Haboudane, D. Hyperspectral Vegetation Indices and Novel Algorithms for Predicting Green LAI of Crop Canopies: Modeling and Validation in the Context of Precision Agriculture. Remote Sens. Environ. 2004, 90, 337–352. [Google Scholar] [CrossRef]
  30. Xiao, Y.; Zhao, W.; Zhou, D.; Gong, H. Sensitivity Analysis of Vegetation Reflectance to Biochemical and Biophysical Variables at Leaf, Canopy, and Regional Scales. IEEE Trans. Geosci. Remote Sens. 2014, 52, 4014–4024. [Google Scholar] [CrossRef]
  31. Huang, S.; Miao, Y.; Zhao, G.; Yuan, F.; Ma, X.; Tan, C.; Yu, W.; Gnyp, M.; Lenz-Wiedemann, V.; Rascher, U.; et al. Satellite Remote Sensing-Based In-Season Diagnosis of Rice Nitrogen Status in Northeast China. Remote Sens. 2015, 7, 10646–10667. [Google Scholar] [CrossRef] [Green Version]
  32. Cao, Q.; Miao, Y.; Shen, J.; Yu, W.; Yuan, F.; Cheng, S.; Huang, S.; Wang, H.; Yang, W.; Liu, F. Improving In-Season Estimation of Rice Yield Potential and Responsiveness to Topdressing Nitrogen Application with Crop Circle Active Crop Canopy Sensor. Precis. Agric. 2016, 17, 136–154. [Google Scholar] [CrossRef]
  33. Deering, D.W.; Rouse, J.W.; Haas, R.H.; Schell, J.A. Measuring Forage Production of Grazing Units from Landsat MSS Data. In Proceedings of the 10th International Symposium of Remote Sensing of Environment, Ann Arbor, MI, USA, 6 October 1975; Volume 2, pp. 1169–1178. [Google Scholar]
  34. Hunt, E.R.; Doraiswamy, P.C.; McMurtrey, J.E.; Daughtry, C.S.T.; Perry, E.M.; Akhmedov, B. A Visible Band Index for Remote Sensing Leaf Chlorophyll Content at the Canopy Scale. Int. J. Appl. Earth Obs. Geoinf. 2013, 21, 103–112. [Google Scholar] [CrossRef] [Green Version]
  35. Gemtos, T.; Fountas, S.; Tagarakis, A.; Liakos, V. Precision Agriculture Application in Fruit Crops: Experience in Handpicked Fruits. Procedia Technol. 2013, 8, 324–332. [Google Scholar] [CrossRef] [Green Version]
  36. Nuarsa, I.W.; Nishio, F.; Hongo, C. Spectral Characteristics and Mapping of Rice Plants Using Multi-Temporal Landsat Data. J. Agric. Sci. 2011, 3, 54. [Google Scholar] [CrossRef] [Green Version]
  37. Angelova, K.; Ilieva, V.; Markova Ruzdik, N.; Karov, I.; Mihajlov, L.; Ilievski, M. Examination on Yield and Some Yield Associated Parameters in Different Rice Genotypes. J. Agric. Plant Sci. 2018, 16, 21–25. [Google Scholar]
  38. Kanke, Y.; Tubaña, B.; Dalen, M.; Harrell, D. Evaluation of Red and Red-Edge Reflectance-Based Vegetation Indices for Rice Biomass and Grain Yield Prediction Models in Paddy Fields. Precis. Agric. 2016, 17, 507–530. [Google Scholar] [CrossRef]
  39. Shresthan, R.P.; Naikaset, S. Agro-Spectral Models for Estimating Dry Season Rice Yield in the Bangkok Plain of Thailand. Asian J. Geoinform. 2003, 4, 11–19. [Google Scholar]
  40. Fountas, S.; Carli, G.; Sørensen, C.G.; Tsiropoulos, Z.; Cavalaris, C.; Vatsanidou, A.; Liakos, B.; Canavari, M.; Wiebensohn, J.; Tisserye, B. Farm Management Information Systems: Current Situation and Future Perspectives. Comput. Electron. Agric. 2015, 115, 40–50. [Google Scholar] [CrossRef] [Green Version]
  41. Duan, B.; Fang, S.; Gong, Y.; Peng, Y.; Wu, X.; Zhu, R. Remote Estimation of Grain Yield Based on UAV Data in Different Rice Cultivars under Contrasting Climatic Zone. Field Crops Res. 2021, 267, 108148. [Google Scholar] [CrossRef]
  42. Tamás, J.; Nagy, A.; Farkasné Gálya, B. Beyond NDVI- Spectral Indexing of Biomass. J. Agric. Inform. 2019, 10, 28–36. [Google Scholar] [CrossRef]
  43. Hatfield, J.L.; Prueger, J.H. Value of Using Different Vegetative Indices to Quantify Agricultural Crop Characteristics at Different Growth Stages under Varying Management Practices. Remote Sens. 2010, 2, 562–578. [Google Scholar] [CrossRef] [Green Version]
  44. Wan, L.; Cen, H.; Zhu, J.; Zhang, J.; Zhu, Y.; Sun, D.; Du, X.; Zhai, L.; Weng, H.; Li, Y.; et al. Grain Yield Prediction of Rice Using Multi-Temporal UAV-Based RGB and Multispectral Images and Model Transfer—A Case Study of Small Farmlands in the South of China. Agric. Forest Meteorol. 2020, 291, 108096. [Google Scholar] [CrossRef]
  45. Wang, F.; Wang, F.; Zhang, Y.; Hu, J.; Huang, J.; Xie, J. Rice Yield Estimation Using Parcel-Level Relative Spectral Variables From UAV-Based Hyperspectral Imagery. Front. Plant Sci. 2019, 10, 453. [Google Scholar] [CrossRef] [PubMed] [Green Version]
  46. Jiang, X.; Fang, S.; Huang, X.; Liu, Y.; Guo, L. Rice Mapping and Growth Monitoring Based on Time Series GF-6 Images and Red-Edge Bands. Remote Sens. 2021, 13, 579. [Google Scholar] [CrossRef]
  47. Wan, L.; Cen, H.; Zhu, J.; Li, Y.; Zhu, Y.; Sun, D.; Weng, H.; He, Y. Combining UAV-Based Vegetation Indices, Canopy Height and Canopy Coverage to Improve Rice Yield Prediction under Different Nitrogen Levels. In Proceedings of the 2019 ASABE Annual International Meeting, Boston, MA, USA, 7–10 July 2019; American Society of Agricultural and Biological Engineers: St. Joseph, MI, USA, 2019. [Google Scholar]
  48. Duan, B.; Fang, S.; Zhu, R.; Wu, X.; Wang, S.; Gong, Y.; Peng, Y. Remote Estimation of Rice Yield With Unmanned Aerial Vehicle (UAV) Data and Spectral Mixture Analysis. Front. Plant Sci. 2019, 10, 204. [Google Scholar] [CrossRef] [Green Version]
  49. Wang, F.; Wang, F.; Zhang, Y.; Hu, J.; Huang, J.; Xie, L.; Xie, J. Rice Yield Estimation at Pixel Scale Using Relative Vegetation Indices from Unmanned Aerial Systems. In Proceedings of the 2019 8th International Conference on Agro-Geoinformatics (Agro-Geoinformatics), Istanbul, Turkey, 16–19 July 2019; pp. 1–4. [Google Scholar]
  50. Peter, B.G.; Messina, J.P.; Carroll, J.W.; Zhi, J.; Chimonyo, V.; Lin, S.; Snapp, S.S. Multi-Spatial Resolution Satellite and SUAS Imagery for Precision Agriculture on Smallholder Farms in Malawi. Photogramm. Eng. Remote Sens. 2020, 86, 107–119. [Google Scholar] [CrossRef]
  51. Islam, M.M.; Matsushita, S.; Noguchi, R.; Ahamed, T. Development of Remote Sensing-Based Yield Prediction Models at the Maturity Stage of Boro Rice Using Parametric and Nonparametric Approaches. Remote Sens. Appl. Soc. Environ. 2021, 22, 100494. [Google Scholar] [CrossRef]
Figure 1. Map of study area and rice fields.
Agriculture 11 00809 g001
Figure 2. Study plots with the varieties investigated and yield sampling points.
Agriculture 11 00809 g002
Figure 3. Top (a) and bottom (b) of eBee with details of components.
Agriculture 11 00809 g003
Figure 4. Stages of development of rice cultivation, cultivation practices of the Chalastra area, and the dates of the UAV flights.
Agriculture 11 00809 g004
Figure 5. Procedure for obtaining point yield data: field sampling frame (a) and rice grains’ detail (b).
Agriculture 11 00809 g005
Figure 6. Flowchart of data processing.
Agriculture 11 00809 g006
Figure 7. UAV vegetation indices imagery of rice plots (red band = RERDVI, green band = NDVI, blue band = MCARI), with color rendering representing the highest VI in each area.
Agriculture 11 00809 g007
Figure 8. Boxplot (a) of yield (in kg/ha) per variety as derived from yield data of 18 the parcels, (b) of yield (in kg/ha) per variety as derived from the mean yield data of the 97 sample points, (c) of yield (in kg/ha) per variety and plot as derived from the mean yield data of the 97 sample points.
Agriculture 11 00809 g008
Figure 9. The average values of NDVI and the two VIs with the highest correlation with yield (MCARI1 for Gladio and RERDVI for Ronaldo) per plot and for the three dates (a = 6 July, b = 21 July, c = 30 August).
Agriculture 11 00809 g009
Table 1. Vegetation indices used in this study (G = green, R = red, RE = red edge, NIR = near infrared).
Vegetation IndexFormulaReferenceScale of
Application
Estimated Parameter
Normalized difference vegetation index (NDVI) N I R R N I R + R [23]CrownBiomass, vegetation density
Normalized NIR index (NNIR) N I R N I R + R E + G [24]CrownVegetation density
Red edge difference vegetation index (REDVI) N I R R E [26] Vegetation coverage
Normalized difference red edge (NDRE) N I R R E N I R + R E [27]LeavesBiomass
Red edge chlorophyll index (CIre) N I R R E 1 [28] Chlorophyll
Modified chlorophyll absorption in reflectance index 1 (MCARI1) N I R R E 0.2 × N I R G × N I R R E [26]LeavesChlorophyll, LAI
Red edge soil adjusted vegetation index (RESAVI) 1.5 × N I R R E N I R + R E + 0.5 [26]CrownBiophysical parameters
Red edge re-normalized different vegetation index (RERDVI) N I R R E N I R + R E [26] Chlorophyll
Transformed vegetation index (TVI) N I R R N I R + R + 0.5 [33]CrownChlorophyll
Modified transformed vegetation index 2 (MTVI2) 1.5 × 1.2 × N I R G 2.5 × R G 2 N I R + 1 2 6 N I R 5 R 0.5 [29]CrownChlorophyll
Table 2. Multitemporal vegetation indices and calculation methodology.
Vegetation IndicesCalculation Methodology
VIA6 July, booting
VIB21 July, panicle heading
VIC30 August, ripening
MRL(VI)Is calculated on a case-by-case based on linear regression of one VI in 2 or 3 dates.
SUM (VI AB)VIA + VIB
SUM (VI AC)VIA + VIC
SUM (VI BC)VIB + VIC
MAX (VI)Max (VIA, VIB, VIC)
Table 3. Yield descriptive statistics for rice varieties.
NRangeMinimumMaximumMeanStd. DeviationVarianceCV%
StatisticStd. Error
General183150656097108418.3224.53952.609074.50011.32
Gladio7208656086407560304.70806.166499.00010.66
Ronaldo11169802097108964.5167.56555.723088.2736.20
Table 4. Pearson’s correlation coefficient between the 10 examined vegetation indices and the yield (mean value for each plot), for each variety separately (the average best correlation for Ronaldo and G, respectively, are presented in bold).
General (Ν = 18)Ronaldo (Ν = 11)Gladio (Ν = 7)
Vegetation IndicesBootingPanicleRipeningBootingPanicle
Heading
RipeningBootingPanicle
Heading
Ripening
Heading
NDVI0.2680.0540.510 *0.781 **−0.0640.620 *0.939 **0.835 *−0.370
NNIR0.2240.0170.3330.781 **−0.0980.668 *0.942 **0.874 *−0.101
REDVI0.451−0.2300.604 **0.698 *−0.0090.612 *0.921 **0.836 *0.178
NDRE0.287−0.2420.609 **0.731 **−0.0340.783 **0.946 **0.846 *−0.215
CΙre0.382−0.2270.685 **0.752 **−0.0590.735 *0.946 **0.855 *−0.190
MCARI10.464−0.2290.740 **0.722 *−0.0580.697 **0.975 **0.830 *0.009
RESAVI0.386−0.2370.611 **0.754 **−0.0240.784 **0.940 **0.843 *−0.046
RERDVI0.390−0.2360.614 **0.744 **−0.0210.771 **0.941 **0.842 *0.003
TVI0.1880.1200.614 **0.783 **−0.0610.771 **0.936 **0.816 *0.003
MTVI2−0.557 *−0.048−0.433 **−0.691 *−0.177−0.453−0.924 **−0.854 *−0.519
** Correlation is significant at the 0.01 level (two-tailed), * Correlation is significant at the 0.05 level (two-tailed).
Table 5. R2 of linear regression models for Ronaldo and Gladio variety using multitemporal VIs as independent variables and the yield as dependent.
RonaldoGladio
NDVIRERDVINDVIMCARI1
CBA CBA CBA CBA
A0.760.610.60A0.770.340.55A0.010.010.88A0.360.270.95
B0.670.000.61B0.170.000.61B0.010.700.14B0.100.690.54
C0.380.670.66C0.590.500.80C0.130.530.70C0.000.540.59
Max (NDVI) = 0.60Max (RERDVI) = 0.59Max (NDVI) = 0.88Max (MCARI1) = 0.94
MRLABC = 0.75 *MRLABC = 0.81 *MRLABC = 0.78 *MRLABC = 0.61 *
* Reference on Supplementary Material
Legend
CBAMAX(VI) = MAX(VIA, VIB, VIC)R2
AVIA+VIC *VIA+ VIB *VIAMRLABC = aVIA+bVIB+cVIC+d1 A: 06 July 2016
BVIB+ VIC*VIBVIBA*** Reference on Supplementary Material0.5 B: 21 July 2016
C VICVI CB **  VI CA **** Reference on Table 20 C: 30 August 2016
Publisher’s Note: MDPI stays neutral with regard to jurisdictional claims in published maps and institutional affiliations.

