Article

Response of Hops to Algae-Based and Nutrient-Rich Foliar Sprays

by
Sandra Afonso
1,2,
Margarida Arrobas
1 and
M. Ângelo Rodrigues
1,*
1
Centro de Investigação de Montanha, Instituto Politécnico de Bragança, Campus de Santa Apolónia, 5300-253 Bragança, Portugal
2
Faculdade de Ciências, Universidade do Porto, Rua do Campo Alegre, s/n, 4169-007 Porto, Portugal
*
Author to whom correspondence should be addressed.
Agriculture 2021, 11(8), 798; https://doi.org/10.3390/agriculture11080798
Submission received: 8 July 2021 / Revised: 31 July 2021 / Accepted: 18 August 2021 / Published: 20 August 2021
(This article belongs to the Section Agricultural Systems and Management)

Abstract

:
Over recent years, some hopyards of northeast Portugal have presented poorly developed plants and reduced productivity. In this study, an attempt was made to improve the homogeneity of hop fields and restore their productivity by using plant biostimulants as foliar sprays. The experimental apparatus included four field trials carried out in four plots of different plant vigour, as evaluated by farmers over previous years (weak, fair, good and very good). The experiments were arranged as a factorial of foliar treatment (two plant biostimulants containing extracts of seaweed algae and an untreated control) and year (2017 and 2018). The plot and the year influenced greatly almost all the measured variables related to tissue nutrient concentration and crop performance. In the control plots, cone dry matter (DM) yield varied from 83.3 to 394.4 g plant−1 from the weak to the very good plots. In 2018, cone DM yield was significantly higher than in 2017. The use of foliar sprays influenced less the elemental composition of plant tissue than the plot or the year. The use of foliar sprays only increased significantly crop yield in the plot of weak plant vigour. The foliar treatments did not increase α- and β-acid concentration in the cones; in the control treatment of the most productive plot, the values were, respectively, 11.2 and 3.9%. Although seaweed extracts tend to help plants cope with several abiotic and biotic stresses, they showed to be effective in mitigating the stress that is affecting these plants, which probably is poor soil drainage caused by the flooding irrigation system, only under conditions of severe stress.

1. Introduction

A common way to meet crop nutritional requirements and improve crop productivity is through the application of conventional fertilizers to the soil. However, nutrient uptake can also take place via leaf surface, stomata and other specialized cells, which allows the use of foliar sprays as fertilizing materials [1]. In general, both macro and micronutrients can be applied as foliar sprays. However, the restricted amounts of nutrients that can be supplied by foliar sprays make this strategy more attractive for the application of micronutrients, especially when the application to the soil is of little effect, such as in acidic or alkaline soils [2].
The range of fertilizer formulations for foliar application is currently huge, and their use is expected to increase at a compound annual growth rate of 4% until 2028 [3]. In addition to macro and micronutrients essential to plants, many products for foliar application contain substances of differing natures with the potential to have a biostimulating effect on plants. A plant biostimulant has been defined as a substance or microorganism applied to the soil, seeds or plants with the aim of enhancing nutritional efficiency, abiotic stress tolerance and/or crop quality, regardless of its nutrient content [4,5]. Some commercial products can, however, be formulated as mixtures of more than one plant biostimulant substance [6,7]. The European Union has recently recognized plant biostimulants as a distinct category within fertilizer products, in a regulation published on 25 June 2019 in the Official Journal of the European Union [Regulation (EU) 2019/1009]. Several substances have been recognized as having a plant biostimulant effect, namely humic and fulvic acids, seaweed and plant extracts, chitosan and other biopolymers, various inorganic compounds, such as phosphite and silicon, and beneficial microorganisms [5,6,7]. Among these groups, seaweed extracts, in particular those obtained from Ascophyllum nodosum (L.), are the most studied and widespread in agriculture [8,9,10].
Seaweed algae extracts are complex products, containing plant hormones, brassinosteroids, betaines, polyamines, polymers and also macro and micronutrients [11]. Although the complexity of their composition tends to make it difficult to clarify their mode of action [6,9,12], several studies have shown beneficial effects from the use of seaweed extracts for the alleviation of abiotic [13,14,15] and biotic [16,17] stresses, and in increasing crop productivity and/or product quality [18,19,20], even if they provide minute quantities of nutrients [5].
Hop is an important crop in several European countries, such as Germany and the Czech Republic, and also in the United States of America [21]. In southern Europe, hop is less popular, but still important in countries like Spain, Italy and Portugal [21]. Studies in southern Europe have been mainly focused on the difficulties imposed by the Mediterranean climate on hop cultivation [22,23,24] and on the adaptation of hop cultivars to new areas under cultivation [22,25,26]. In Portugal, hop is currently only grown in the Northeast [27]. Some farmers in this region have found that their fields have heterogeneous plant development, some with well-developed plants and others with obvious productivity problems, although the cropping techniques are similar. In a previous study, Afonso, et al. [28] reported that the heterogeneity in hop fields is mainly due to poor soil drainage and aeration, caused by the irrigation system, which consists of flooding the space between the rows. Farmers, however, perhaps because it is easier than changing the expensive irrigation system, are using conventional micronutrient-rich foliar sprays to try to mitigate the problem.
Thus, and in view of the increasing range of innovative products for foliar applications that are being used in the region on several other crops, it is hypothesized for this study that foliar sprays containing seaweed extracts of A. nodosum algae, which are known for their biostimulating effect on plants, could have a beneficial effect on hop productivity, in particular on the yield restoration of plots that have shown poor development over recent years. To evaluate the formulated hypothesis, four field trials were installed in plots of different yield potential. Based on the productivity of the last years, plots classified by farmers as having weak, fair, good and very good vigour plants were chosen. From the experimental apparatus, specific objectives were set to assess the effect of treatments on the nutritional status and photosynthetic performance of plants, on total and cone dry matter yield, and on α- and β-acid content in the cones.

2. Materials and Methods

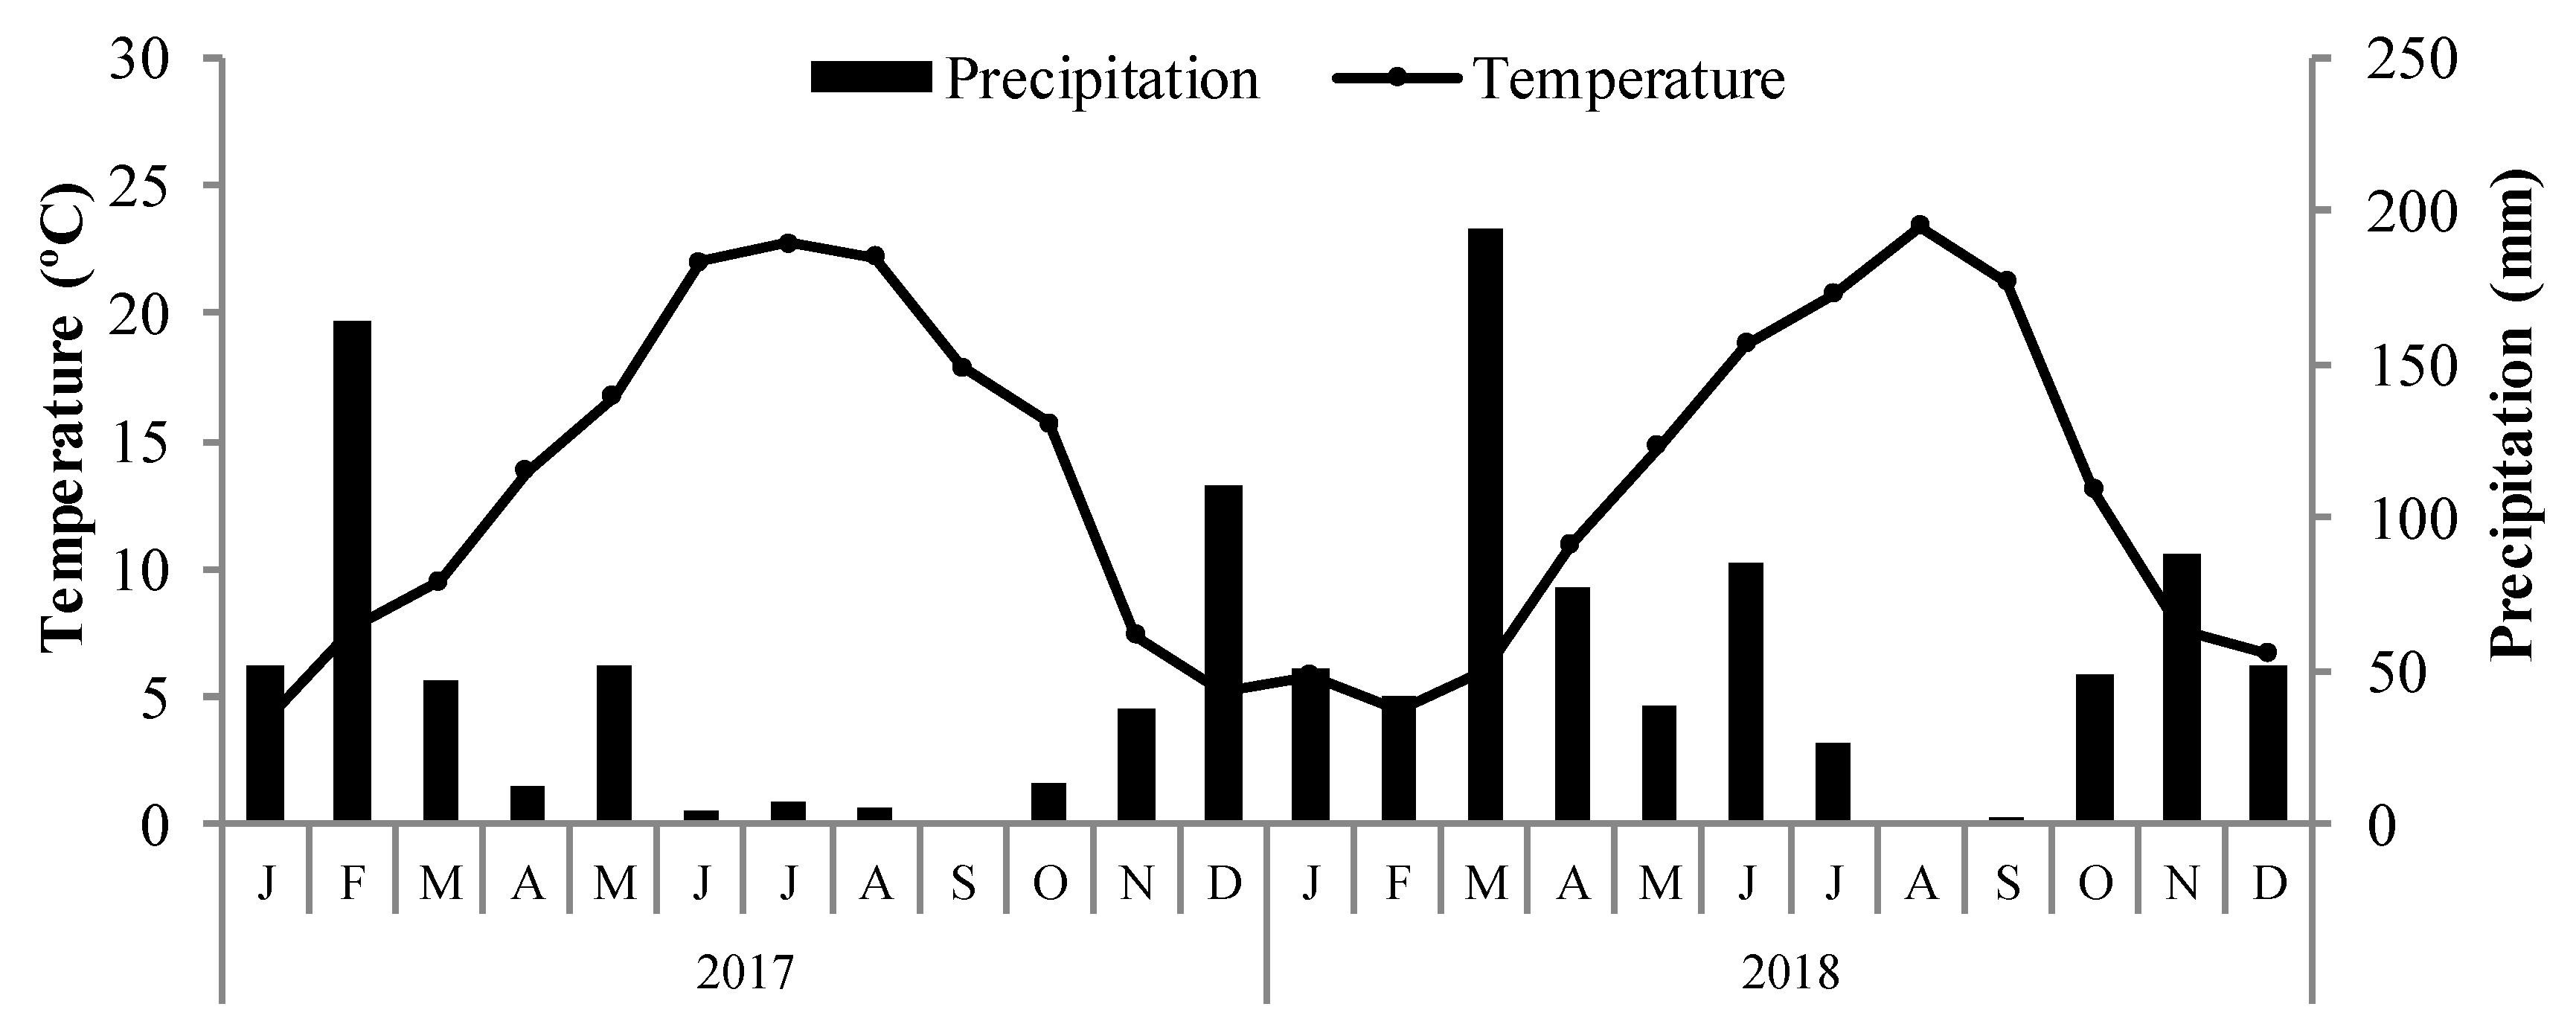
2.1. Field Experiments Characterization

A field trial was conducted during two growing seasons (2017 and 2018) in hop plots of the cultivar Nugget, located in Bragança, NE Portugal. The region benefits from a Mediterranean-type climate, with an average annual air temperature of 12.7 °C and annual precipitation of 772.8 mm. Meteorological data recorded during the experimental period at the weather station of Sta Apolónia farm in Bragança is shown in Figure 1.
The hop plots are arranged in a 7 m conventional high trellis system, with concrete poles, connected with cables, in a “V” design system. The plantations were installed about 20 years ago. In the original plantation, the rhizomes were spaced 2.8 m × 1.6 m between rows and within rows, respectively. From each position of an original rhizome, a double tutor thread was placed in “V” connecting the plants (groups of 3 to 4 stems) to the upper wire structure, which set up a density of ~2232 plants ha−1.
The hop plots were selected according to their yield potential as recorded in the previous seasons by the farmers. Four extreme situations were considered adequate for this study, from the poorer to the better plots found in the region. With the help of the farmers, the plots of different yield potential were named as weak (Plot 1), fair (Plot 2), good (Plot 3) and very good (Plot 4). The soils of the different plots used in this experiment were sampled before the trial started for characterization of the growing conditions. Three composite soil samples (15 sampling points) were taken between the rows on 2 June 2016, at 0–20 cm depth in each one of the plots. The soil textures varied from clay loam (Plots 1 and 2), to sandy clay loam (Plot 3) and sandy loam (Plot 4). More details on the chemical soil properties determined from these samples are provided in Table 1.

2.2. Experimental Design and Treatment Application

Four similar and independent field trials corresponding to the plots of weak, fair, good and very good vigour plants were arranged as a factorial design, to accommodate two experimental factors, foliar fertilization (three levels) and year (two levels, 2017 and 2018), in six replicates. As foliar fertilization, two commercial plant biostimulants were used as foliar sprays to which a non-fertilized control was added.
One of the plant biostimulants is particularly rich in nutrients (Folivex Crescimento®) and was named in this study as Fnut. It combines several macro and micronutrients and a small portion of an extract of the algae A. nodosum (1.4% w/w). Fnut contains (w/w) 12% N, 6% P2O5, 4% K2O, 0.025% B, 0.1% Fe-Ethylenediaminetetraacetic acid (EDTA), 0.05% Cu-EDTA, 0.05% Zn-EDTA, and 0.05% Mn-EDTA. The second plant biostimulant (Fitoalgas Green®) was selected due to its high content (15% w/w) of A. nodosum, and the treatment was named ‘Algae’. The foliar sprays were applied at the rates recommended by the manufacturers. Fnut was applied at a rate of 3.5 L ha−1, diluted in 1500 L water, three times during the growing season (20 June, 10 July and 27 July 2017, and 20 June, 8 July and 24 July 2018). The first foliar treatment was done when the plants of Plot 4 had reached 80% of the top wire height, the second at the end of bine growth, and the third during the enlargement of inflorescence buds. Algae was applied at a rate of 2 L ha−1, also diluted in 1500 L of water, on the same dates mentioned for Fnut.
Each replication consisted of six twin canopies of three plants (in the “V” design system). These plants were marked when those in Plot 4 (very good) were ~3 m tall. In the other plots, plants with height within the plot pattern were selected.
All the plots received the basal fertilization plan usually used in the region, consisting of a compound NPK (7:14:14) fertilizer applied late in winter at a rate of ~500 kg ha−1, and two side dress N applications performed during the growing season, the first with ~200 kg ha−1 of nitromagnesium (27% NH4NO3 + 3.5% MgO + 3.5% CaO) and the second with ~450 kg ha−1 of calcium nitrate (15.5% NO3 + 27% CaO). The farmers manage their fields with a surface irrigation system, consisting of regular flooding of the space between rows. Several tillage passes (3 to 4) were performed every year to remove the crusts and allow water infiltration.

2.3. Data Acquisition in the Field and Tissue Sampling

Leaf greenness was measured by using the SPAD (Soil and Plant Analysis Development)-502 Plus chlorophyll meter (Spectrum Technologies, Inc., Aurora, IL, USA). For each sampling date, treatment and replicate, thirty readings were taken (to create the average values), from the distal lobe of young, fully expanded leaves. The readings were performed on 17 July 2017 and 16 July 2018. A Normalized Difference Vegetation Index (NDVI) was determined by the hand held FieldScout CM 1000 (Spectrum Technologies, Inc.). The measurements were taken from the same leaf parts and dates as the SPAD readings. Chlorophyll a fluorescence and OJIP transient was determined by using the dark adaptation protocols FV/FM, FV/F0 and the advanced OJIP test by using the OS-30p+ fluorometer (Opti-sciences, Inc.). FM, F0 and FV are, respectively, maximum, minimum and variable fluorescence from dark adapted leaves, and FV/FM = (FM−F0)/FM and FV/F0 = (FM−F0)/F0. The OJIP test provides origin fluorescence at 20 μs (O), fluorescence at 2 ms (J), fluorescence at 30 ms (I) and maximum fluorescence (P, or FM). Measurements were taken from the distal lobe of fully expanded young leaves, after a period of dark adaptation greater than 35 min.
In the middle of the growing season (15 July 2017 and 16 July 2018), samples of 20 leaves per replication were taken at ~2 m height for elemental analysis. At hop harvest (28 to 31 August 2017 and 27 to 31 August 2018), the aboveground biomass was cut at ground level and separated into two samples of leaves (bottom and top halves), stems, and cones, and weighed fresh. Subsamples of each plant part were weighed again, oven dried at 70 °C and weighed dry for determination of DM yield of the different plant parts. Additionally, a subsample of 30 dried cones was randomly selected for determination of the dry mass of individual cones.

2.4. Laboratory Analyses

The soil samples were firstly oven-dried (40 °C) and sieved (2 mm). Thereafter, they were analysed for pH (H2O and KCl) (soil: solution, 1:2.5), cation-exchange capacity (ammonium acetate, pH 7.0), organic C (wet digestion, Walkley-Black method) and extractable P and K (Egner-Rhiem method). Extractable P was also determined by the Olsen method. Soil B was extracted by hot water and the extracts analysed by the azomethine-H method. For more details on these analytical procedures, the reader is referred to Van Reeuwijk [29]. The availability of other micronutrients (Cu, Fe, Zn, and Mn) in the soil was determined by atomic absorption spectrometry after extraction with ammonium acetate and EDTA, according to the method described by Lakanen and Erviö [30].
Elemental tissue analyses were performed by Kjeldahl (N), colorimetry (B and P), flame emission spectrometry (K) and atomic absorption spectrophotometry (Ca, Mg, Cu, Fe, Zn and Mn) methods after nitric digestion of the samples [31]. Bitter acids (α and β) in hop cones were extracted with methanol and diethyl ether by high performance liquid chromatography (HPLC), according to the Analytica European Brewery Convention (EBC) 7.7. method [32].

2.5. Data Analysis

Data was analysed for normality and homogeneity of variances using the Shapiro-Wilk and Bartlett’s test, respectively. The analysis of variance was performed according to the experimental design as a two-way ANOVA. When significant differences were found between experimental treatments, the means were separated by the Tukey HSD test [for the factor of three levels (Foliar treatment)] or Student’s t-test [for the factor of two levels (Year)] (α = 0.05).

3. Results

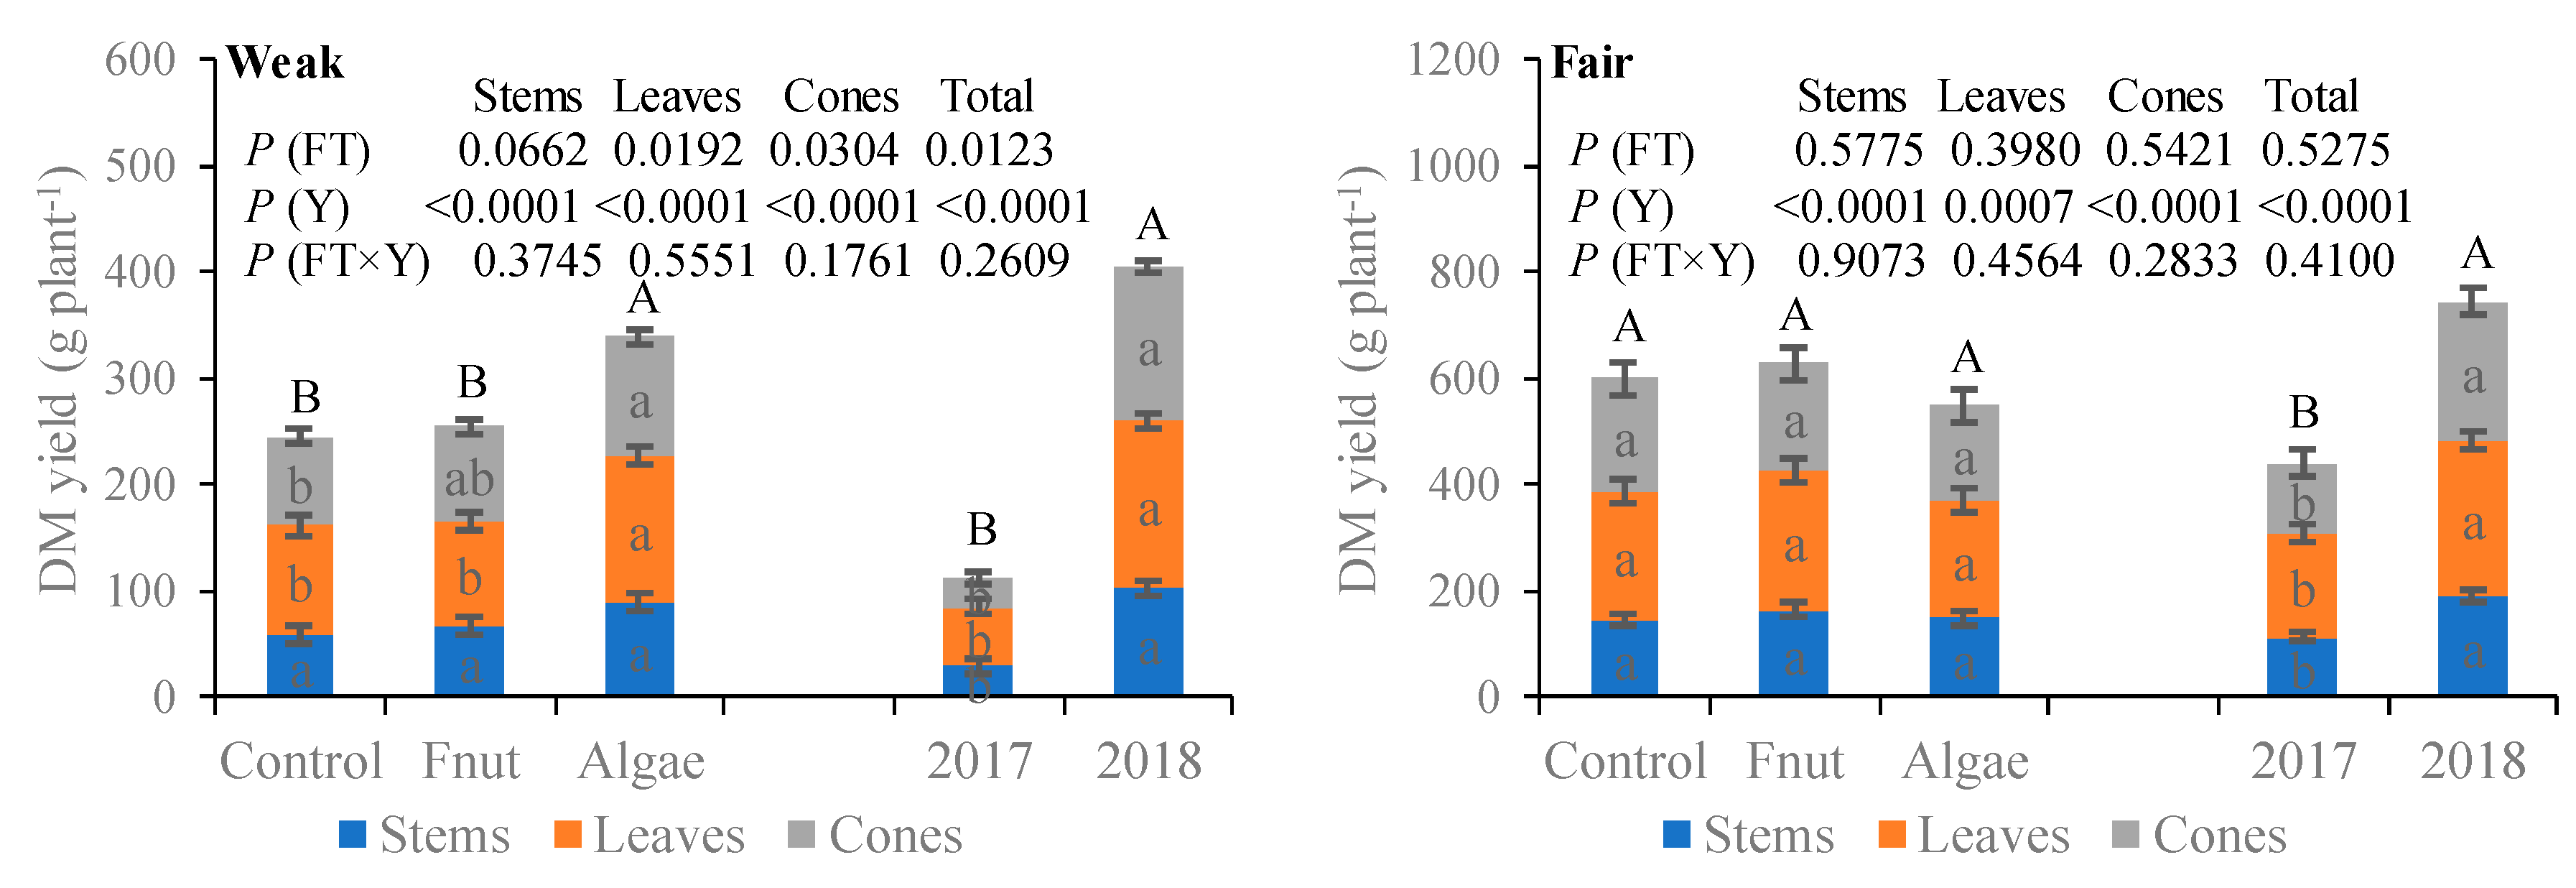
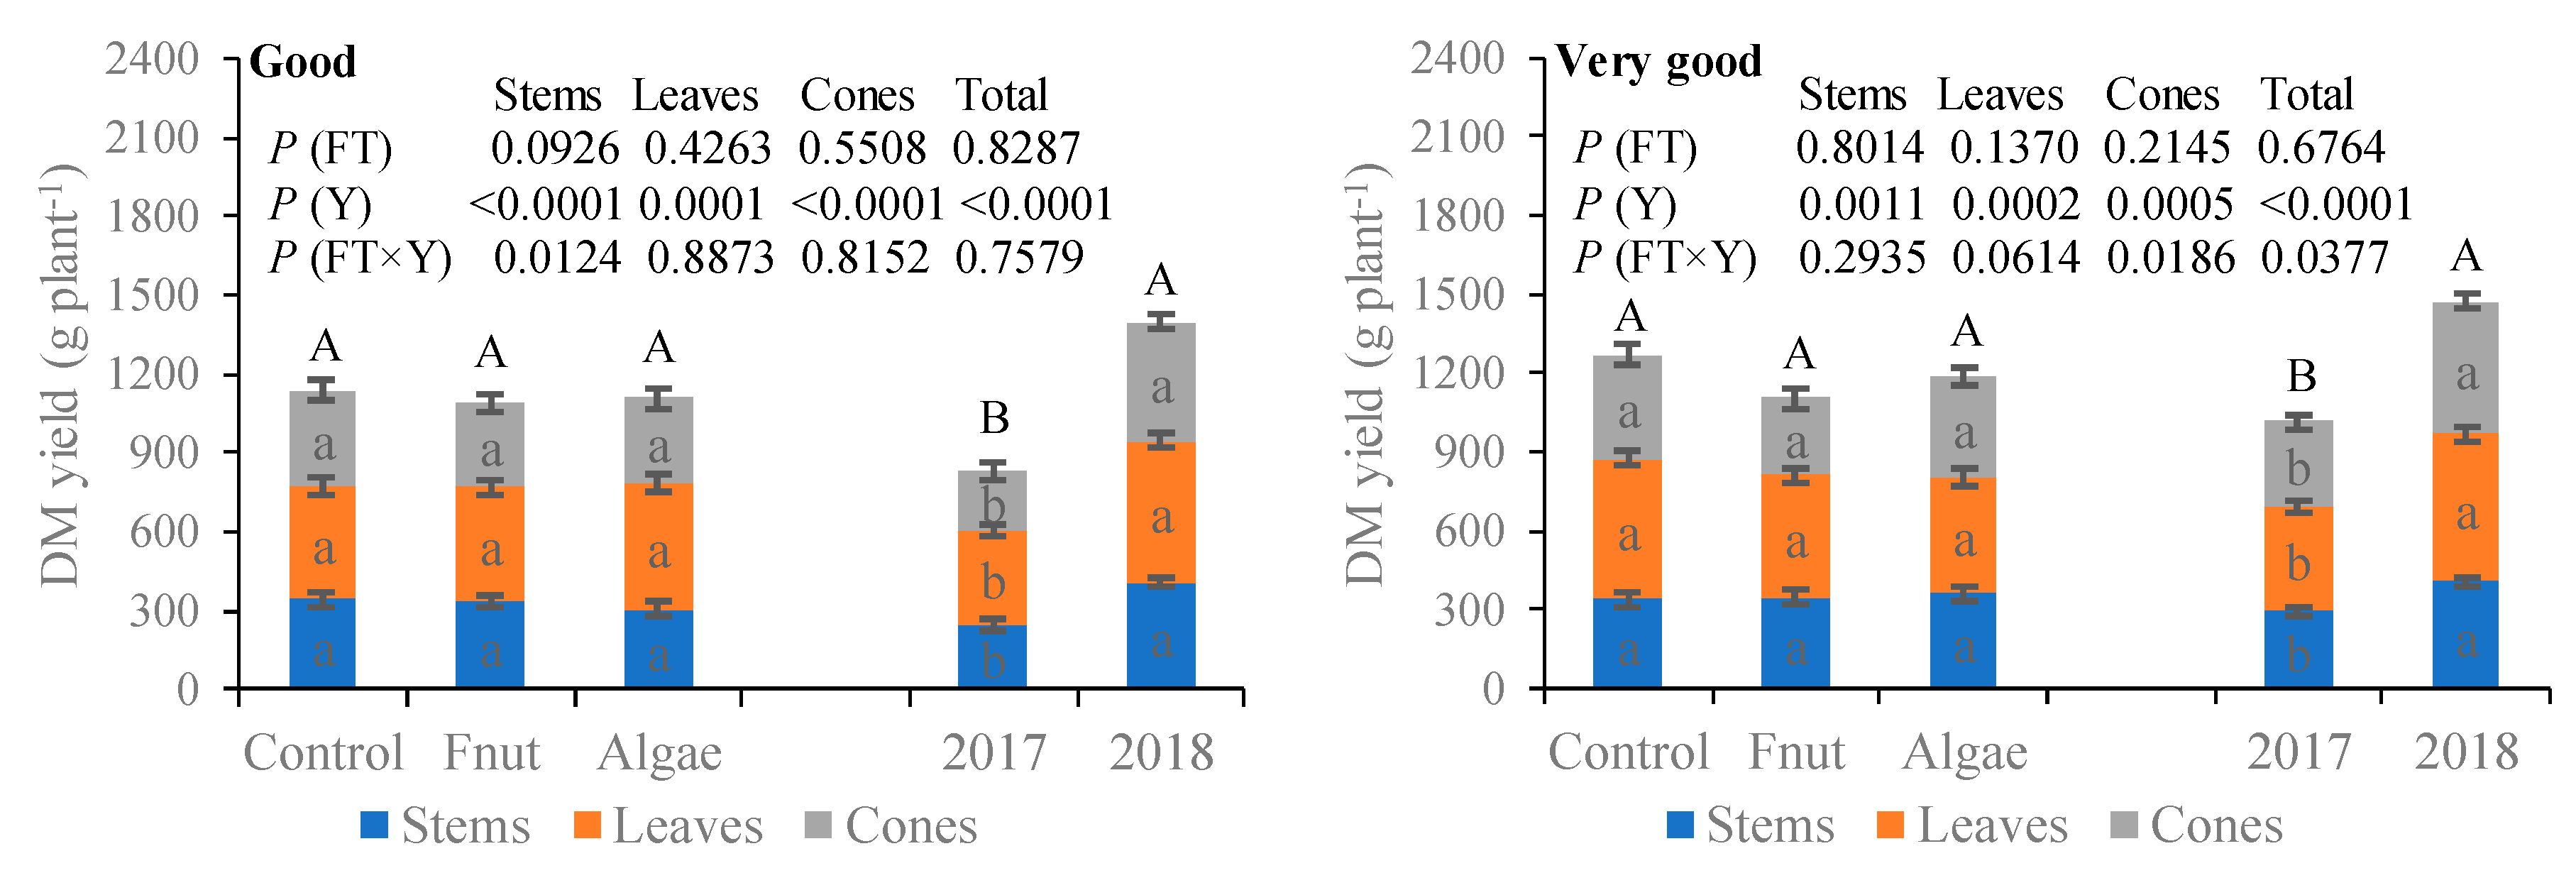
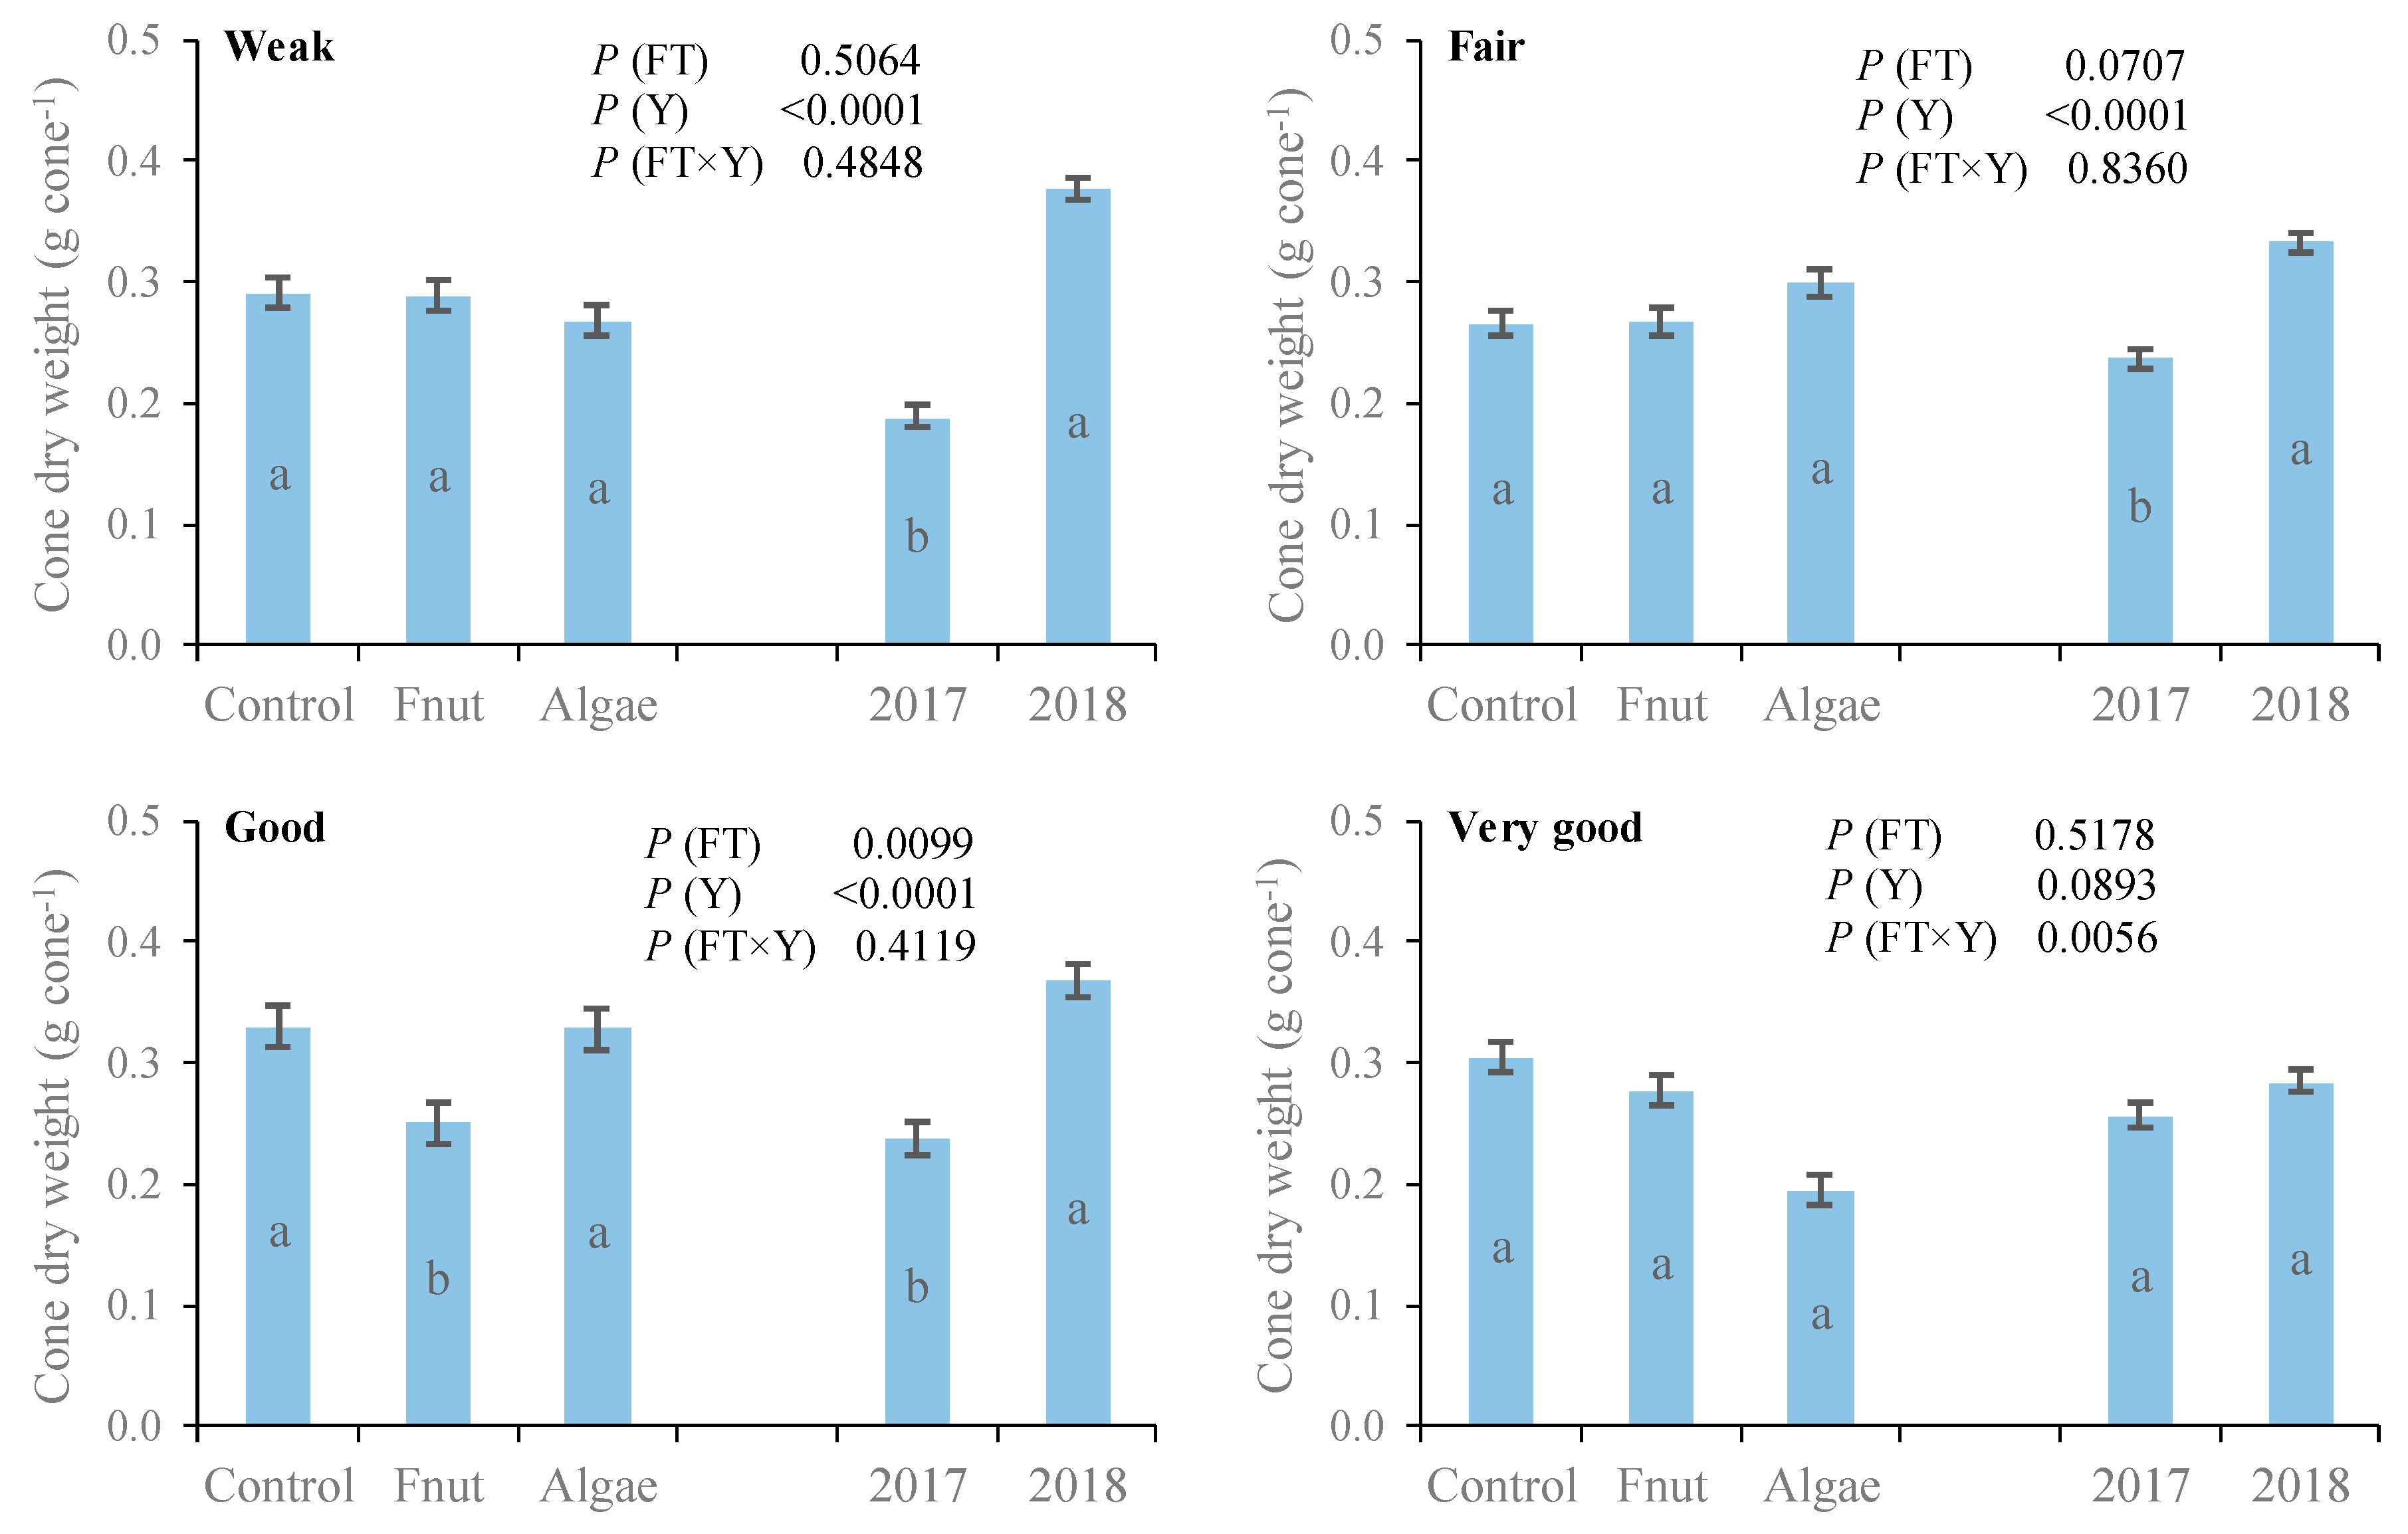
3.1. Plant Dry Matter Yield

The total aboveground DM yield, and DM yield of the different plant parts (stems, leaves or cones), varied between plots of different plant vigour, the former from ~300 (weak) to ~1200 (very good) g plant−1 (Figure 2). The result was expected since the plot selection took into account the vigour of the plants in previous years. The nutrient-rich foliar spray did not significantly influence the total DM yield or any of its components, including the DM yield of the cones. Algae gave significantly higher values of cone and total aboveground biomass in comparison to the other treatments only in the plots of weak vigour plants. In 2018, the DM yield was significantly higher for all plant parts in comparison to 2017. Significant interaction between the two factors was not usually observed, thus not deserving particular attention.
Plant vigour had little influence on the size of the cones (Figure 3). The foliar treatment also did not significantly influence the size of the cones in most of the plots. However, in the plot of good vigour plants, cone dry weight was found to be significantly lower in the Fnut treatment. The year had a great influence on the size of the cones. Significant differences were found in the plots of weak, fair and good vigour plants, with 2018 showing the higher values.

3.2. Tissue Nutrient Concentrations

The concentration of nutrients in the leaves varied greatly between plant vigour plots in the leaf samples taken at ~2 m height in July (Table 2). The leaf concentrations of N, Ca, and particularly K, were remarkably higher in the plot of very good plant vigour. In contrast, average leaf P and Mg concentrations were significantly lower in the plot of high vigour plants. The results of the plots of fair and good plant vigour were very close to those recorded in the plot of weak plant vigour. The effect of the foliar treatments was smaller for macronutrients, in spite of significant differences being found for P and Mg in the plot of weak vigour plants and for Ca in the plot of very good vigour plants. Significant differences between foliar treatments in fair and good plots were not common, nor did they show a consistent trend with the results of weak and very good plots (data not shown). The years showed a large variation in the concentration of the macronutrients in the leaves, particularly for K, Ca and Mg. Leaf K levels were particularly high in 2018 and Ca levels in 2017. Significant interactions between foliar treatment and year was neither frequent nor consistent between plots for a given nutrient.
The micronutrients Mn, Zn and B were particularly high in the leaves of the plots of higher vigour plants in comparison to the others (Table 2). The foliar treatments had little effect on the concentration of micronutrients in the leaves. Only leaf B levels were found to be significantly higher in the Algae in comparison to the other treatments. The year significantly influenced the concentration of most of the micronutrients in the leaves, although some were higher in 2017 and others in 2018.
The plant tissues analysed at harvest (top and bottom leaves and stems) showed many differences in comparison to the leaves sampled in July, related to the date of sampling, the position in the canopy and type of tissue, but maintained the trend of the effect of the treatments of the samples taken in July (data not shown). In comparison to the July samples, the leaves at harvest from the bottom half of the plants showed low levels of N and P and higher levels of Ca, Mg and B. As observed for the July samples, leaf concentrations of all nutrients varied greatly between plant vigour plots. Leaf concentrations of some nutrients also varied significantly with the foliar treatments. However, in general terms, the control did not show lower values than the fertilized treatments. The year effect was statistically significant for most of the nutrients, some being higher in 2018 and others in 2017. In the top half leaves, the concentrations of N, K and B were markedly higher and P and Mg markedly lower in the very good vigour plants, in comparison to the weak vigour plants. Although significant differences between foliar treatments were found for some nutrients, a clear pattern distinguishing between the results of the fertilized and the non-fertilized plots was not observed. The year again showed a marked influence on leaf nutrient concentrations. Stem nutrient concentrations were markedly lower for the majority of macro and micronutrients in comparison to the values found in the leaves. Significant differences between foliar treatments were also often found for some nutrients, but the control did not display significantly lower values than the fertilized treatments. The effect of the year was statistically significant for most of the nutrients, as observed for leaf analysis.
The concentration of the majority of the macro and micronutrients in the cones was markedly different from leaves and stems (Table 3). The levels of P and K were markedly higher in the cones in comparison to those of leaves or stems. The levels of Ca, Mg and B, for instance, were lower in the cones in comparison to the leaves. The cone levels of N were similar to that of the leaves. The range of variation for each nutrient seemed to be lower than that observed for leaves.
However, as observed for leaves, great differences between plant vigour plots were found for all nutrients. Very high vigour plants showed lower levels of N, P, Mg and Cu in the cones in comparison to the weaker plants. K and B, for instance, were significantly higher in the very good vigour plants than in the weaker plants.
The effect of the foliar treatments on cone nutrient concentration was small, and not consistent between the different plots.
Once again, the year showed a marked influence on tissue plant composition. Significant differences were found for almost all the nutrients, with the concentration of some to be found higher in 2017 and others in 2018.

3.3. SPAD Readings, NDVI and Chlorophyll Fluorescence

SPAD, NDVI and chlorophyll a fluorescence varied greatly among plant vigour plots (Table 4). A tendency for a significant increase was found in these tests from the weaker to the higher vigour plants.
In turn, the foliar sprays did not have a great effect on these indices of nutritional status and photosynthetic performance of plants, the most important exception being the higher SPAD values in the Algae treatment in the plot of weak vigour plants. The year seemed to influence some of those variables, but with little consistency between plots and DM yield. NDVI, however, showed higher values in 2018, the most productive year.

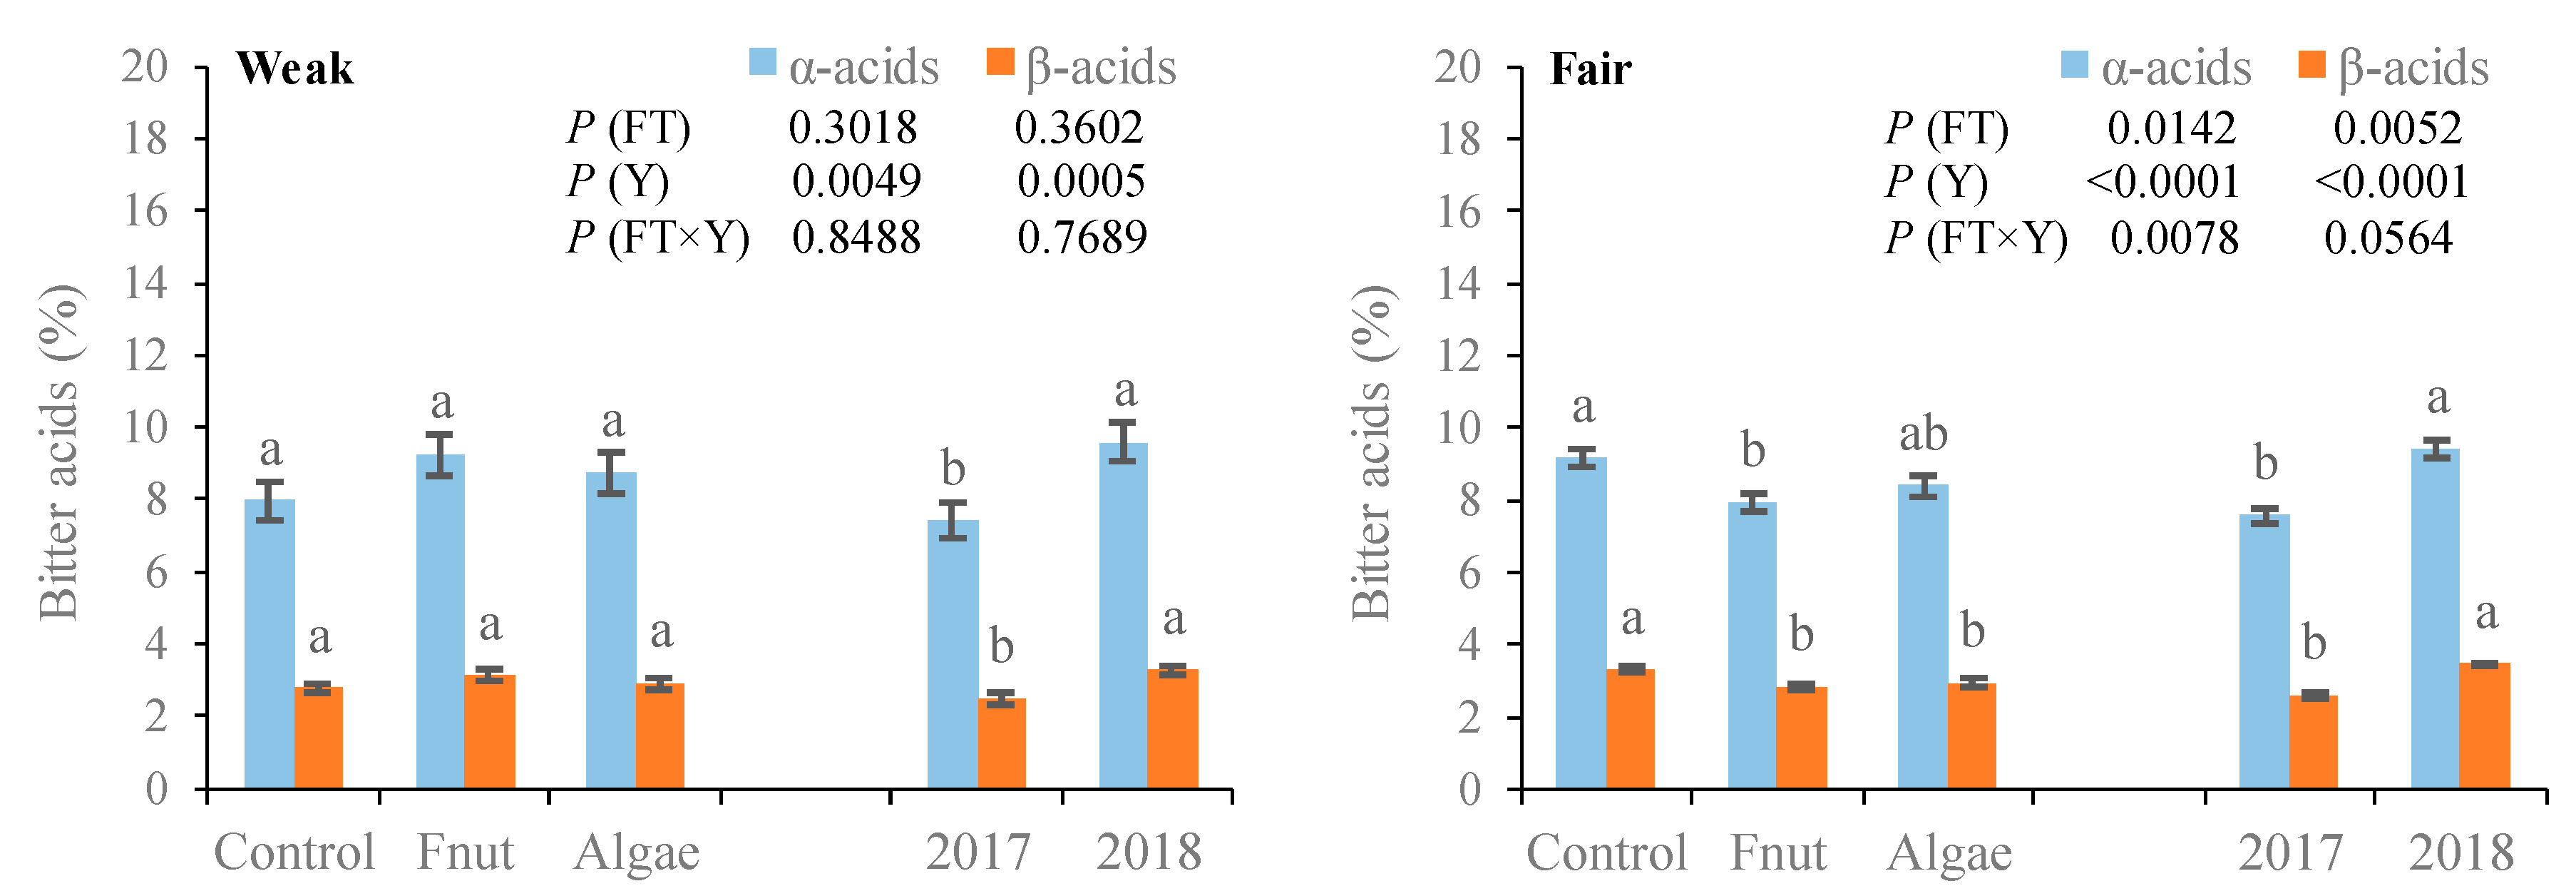
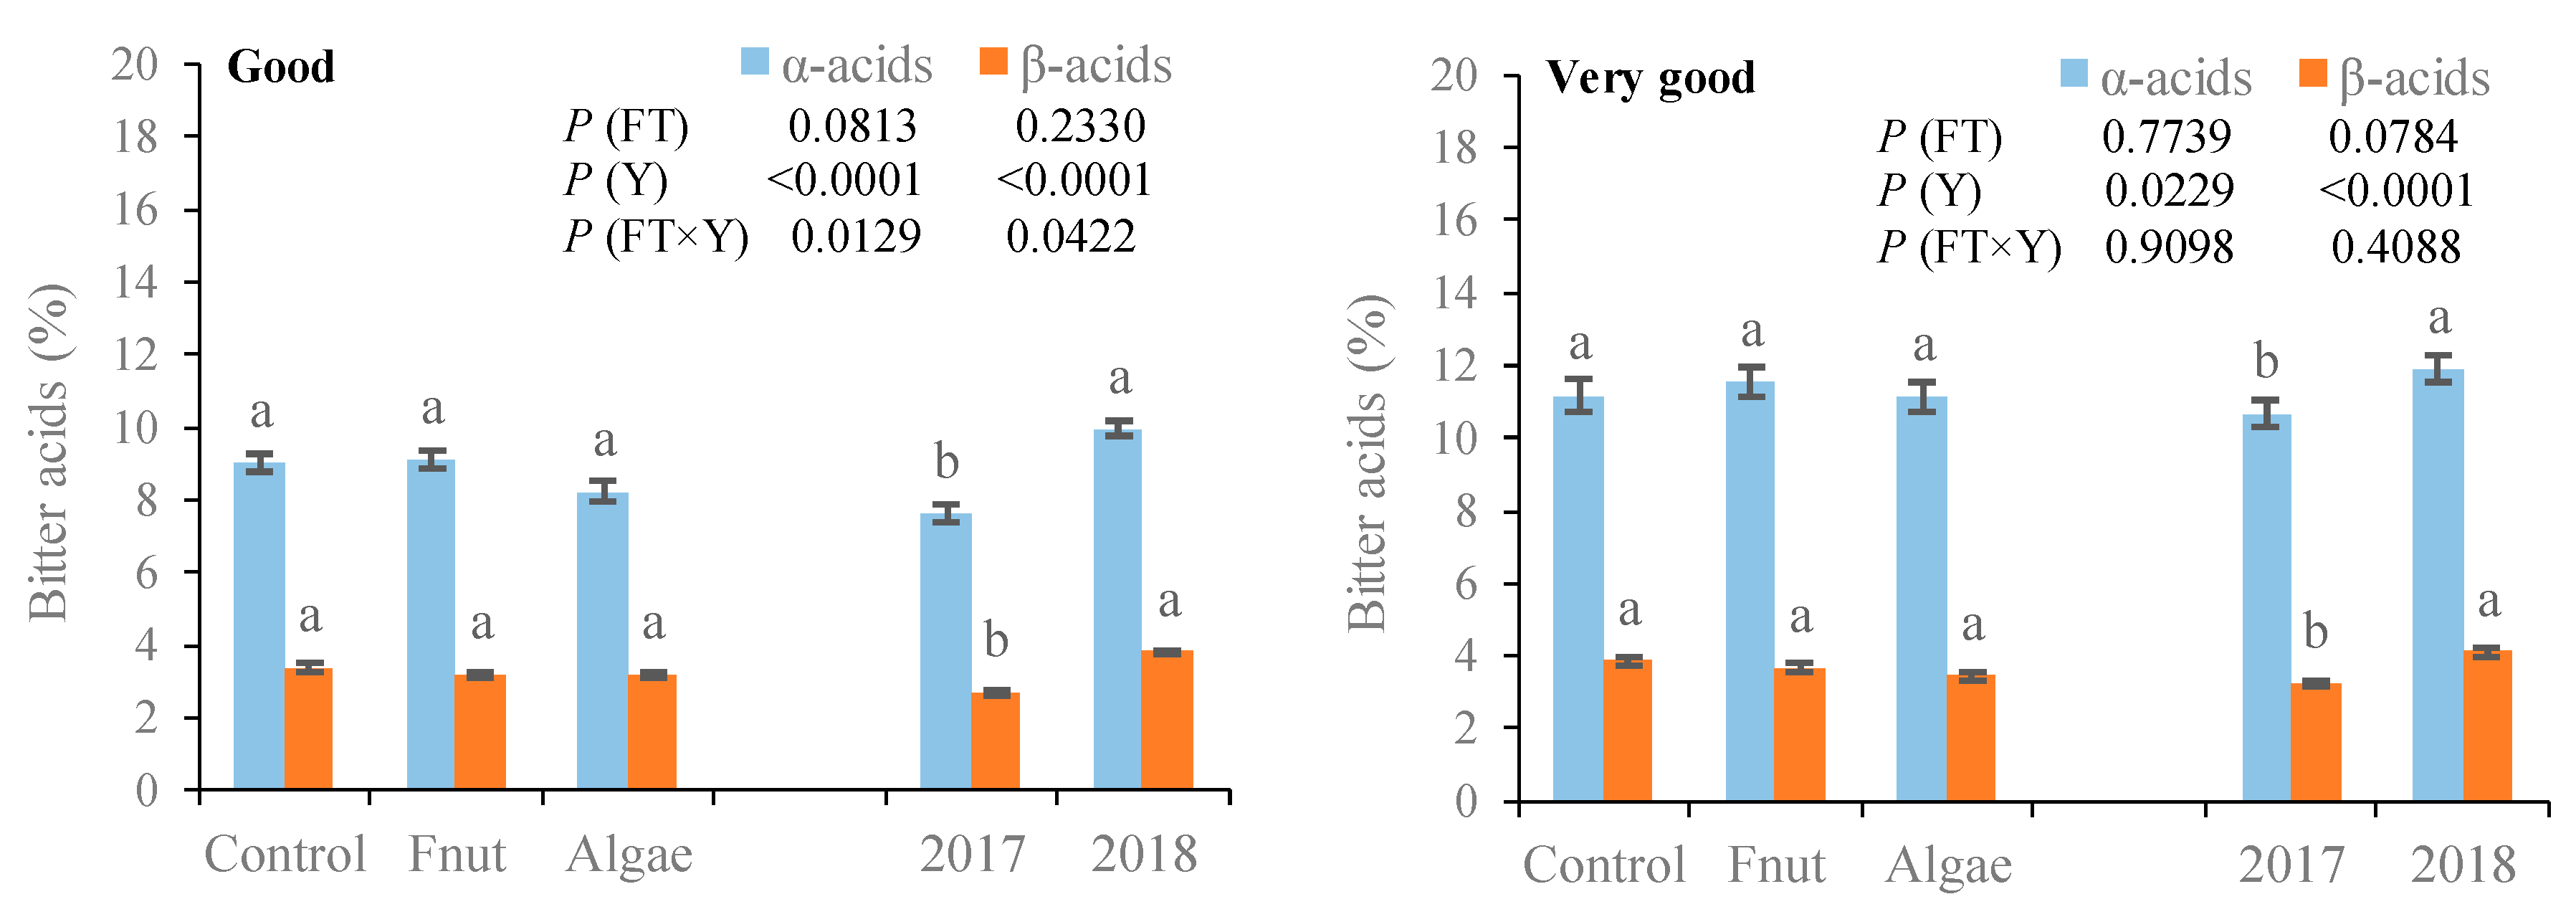
3.4. Concentration of Bitter Acids in the Cones

The concentrations of α- and β-acids in the cones were higher in the plants of very good vigour than in the plants of lower vigour (Figure 4). Foliar sprays did not significantly increase the concentrations of α- and β-acids in the cones in comparison to the control. The year had a marked effect on the cone composition; the values of α- and β-acids were significantly higher in 2018 in comparison to 2017. Significant interaction of foliar treatment × year was found to α-acid concentrations in the fair and good vigour plots and β-acid concentration in good vigour plot.

4. Discussion

The plots identified by farmers as the most productive in previous years (very good vigour plants) produced more biomass in all the plant parts (stems, leaves and cones) than the other plots. The cone size, however, did not differ between the different plots. The concentration of nutrients in plant tissues varied greatly with the vigour of the plants. Some nutrients were found at higher levels in the most productive plots, but the concentrations in plant tissues of many other nutrients were higher in the less productive plots. However, no evidence was found that the nutritional status of plants had been an important factor influencing DM yield, since most of the nutrients were found within or close to their sufficiency ranges as reported by Bryson et al. [33]. These variations in tissue nutrient concentrations were probably the result of dilution and concentration effects, which have been well-known for a long time [34], and/or antagonism and synergism in plant nutrient uptake [35]. SPAD and NDVI usually provide a good indication of the greenness of the leaves and general plant health [36,37]. In this study, however, only NDVI values were associated with the most productive plots. Chlorophyll fluorescence ratios (FV/FM and FV/F0) and OJIP transient are usually seen as important tests to assess stresses that affect the function of photosystem II, and are also usually related to crop productivity [38,39]. In this study, these tests showed little sensitivity in discriminating between the different plant vigour plots.
In 2018, the DM yield of all plant parts was significantly higher than in 2017. The spring and summer of 2017 were warmer and drier than in 2018, accentuating the Mediterranean characteristics of the regional climate, which usually reduce the performance of hop crops [23,24]. The concentration of almost all the nutrients analysed varied significantly with the year, irrespective of plant tissue and sampling date. This great dynamic in tissue nutrient concentrations depends on diverse factors; one of the most relevant of these is the dilution/concentration effect related to nutrient uptake and carbon assimilation, and plant growth [34,40], which does not justify further development here. SPAD readings and chlorophyll fluorescence and OJIP transient variables presented inconclusive results, they too are probably related to the concentration of nutrients in the tissues and dilution/concentration effects [37]. NDVI, in turn, showed consistently higher values in 2018, the most productive year. The most productive year displayed significantly higher α- and β-acid concentrations in the cones, showing that the conditions promoting plant growth also enhanced the accumulation of bitter acids in the hop cones. Hop-acids are soft resins produced by hop plants as secondary metabolites. The impact of the weather conditions during the two-week period before harvest have a strong influence on the accumulation of α-acids [41]. This is probably the reason explaining the greatest effect of the year in comparison to the plot or the foliar treatment.
The foliar sprays did not produce a significant effect on total DM yield or on DM yield of any of the different plant parts, including the cones in fair, good and very good vigour plots. However, in the plot of weak vigour plants, cone and total DM yields were significantly higher in the Algae in comparison to the other treatments. Due to the high amount of tissues analysed for their elemental composition, sometimes significant differences between treatments were observed but, in these cases, the control treatment never showed lower values. The fertilizer treatments also did not significantly influence the variables related to the photosynthetic performance of the plants, nor did they influence the levels of α- and β-acids in the cones in comparison to the control. Other studies can be found in the literature in which the application of algae extracts did not increase productivity or improve the quality of products [42,43,44]. The efficacy of plant biostimulants can vary greatly depending on the conditions of application (concentration of active ingredients, phenological state of plant, etc.), including the competition for uptake by microorganisms in the phyllosphere (or rhizosphere, if the products are applied to the soil), an aspect that is recognized as needing further investigation [4,45]. However, it is usually under stressful conditions that the use of algae extracts tend to give better results [13,14,15], which is in agreement with the observations in this study. The subject has been under intense investigation during the last decades with numerous reviews updating the current knowledge [5,6,7]. The use of seaweed extracts has been highlighted since these products are the most commonly used and those that usually present favourable results on crop growth [8,9,10].
Plant biostimulants have been shown to act as elicitors, enhancing plant growth and triggering stress responses by activating molecular and biochemical pathways [5,11], so it should be emphasized that, in this study, significant effects on the elemental composition of plants by the application of foliar sprays were not observed. Extensive research on the topic has shown that the beneficial role of plant biostimulants, and in particular those made from algae extracts, has been observed mainly under harsh environmental conditions, such as drought [14,46,47], heat [15] or saline [13] stress. In a first analysis, none of these stresses can be identified in these hop fields, which may help to explain the absence of a significant effect by the application of the plant biostimulants on crop productivity in the plots of fair, good and very good vigour plants. A previous study in this region reported poor soil drainage and aeration as the main reason for the heterogeneity observed in hop fields, which is exacerbated by the irrigation method, consisting of flooding the spaces between the rows [28]. Thus, under these conditions, the algae extract was only beneficial on highly stressed plants.

5. Conclusions

Under the conditions of this experiment, two plant biostimulants containing seaweed algae extracts did not positively influence the mineral composition of hop plants, indices of crop nutritional status and photosynthetic efficiency or the α- and β-acid concentrations in the cones. Crop yield was only significantly increased with the use of algae extract in the plot of weak plant vigour. However, almost all those variables changed greatly with the effect of plot and year. This poor effect on crop performance might have been due to the type of stress that limits plant growth, which is probably poor drainage and deficient soil aeration. Although the effectiveness of seaweed extracts in improving plant performance under conditions of drought, heat and salt stress is well known, they had little effect under the conditions of this experiment. Only on highly stressed plants did the positive effect of the algae extract prove to be significant. Thus, to help farmers to overcome the problem, other avenues should be explored, such as the use of different plant biostimulants and/or testing different conditions of application.

Author Contributions

Conceptualization, M.Â.R.; methodology, M.A. and S.A.; formal analysis, S.A.; investigation, S.A.; resources, M.Â.R. and M.A.; data curation, S.A.; writing—original draft preparation, S.A.; writing—review and editing, M.Â.R.; supervision, M.Â.R. and M.A.; project administration, M.Â.R.; funding acquisition, M.Â.R. and M.A. All authors have read and agreed to the published version of the manuscript.

Funding

The authors are grateful to the Foundation for Science and Technology (FCT, Portugal) for financial support from national funds FCT/MCTES, to CIMO (UIDB/AGR/00690/2020) and for Sandra Afonso’s doctoral scholarship (BD/116593/2016).

Institutional Review Board Statement

Not applicable.

Informed Consent Statement

Not applicable.

Data Availability Statement

No new data was created or analysed in this study. Data sharing is not applicable to this article.

Conflicts of Interest

The authors declare no conflict of interest.

References

  1. Weil, R.R.; Brady, N.C. The Nature and Properties of Soils, 15th ed.; Global Edition: London, UK, 2017. [Google Scholar]
  2. Havlin, J.L.; Tisdale, S.L.; Nelson, W.L.; Beaton, J.D. Soil Fertility and Fertilizers: An Introduction to Nutrient Management, 8th ed.; Pearson: Boston, MA, USA, 2014. [Google Scholar]
  3. Dean, L. Foliar Fertilizer Market Witnessing Increasing Penetration of Nitrogen-Based Variants. Available online: www.worldfertilizer.com/special-reports/22102019/foliar-fertilizer-market-witnessing-increasing-penetration-of-nitrogen-based-variants/ (accessed on 15 February 2020).
  4. Colla, G.; Rouphael, Y. Biostimulants in horticulture. Sci. Hortic. 2015, 196, 1–2. [Google Scholar] [CrossRef]
  5. Du Jardin, P. Plant biostimulants: Definition, concept, main categories and regulation. Sci. Hortic. 2015, 196, 3–14. [Google Scholar] [CrossRef] [Green Version]
  6. Du Jardin, P.; Xu, L.; Geelen, D. Agricultural functions and action mechanisms of plant biostimulants (PBs). In The Chemical Biology of Plant Biostimulants; John Wiley & Sons: Hoboken, NJ, USA, 2020; pp. 1–30. [Google Scholar]
  7. Rouphael, Y.; Colla, G. Editorial: Biostimulants in agriculture. Front Plant. Sci. 2020, 11, 40. [Google Scholar] [CrossRef] [Green Version]
  8. Battacharyya, D.; Babgohari, M.Z.; Rathor, P.; Prithiviraj, B. Seaweed extracts as biostimulants in horticulture. Sci. Hortic. 2015, 196, 39–48. [Google Scholar] [CrossRef]
  9. De Saeger, J.; Van Praet, S.; Vereecke, D.; Park, J.; Jacques, S.; Han, T.; Depuydt, S. Toward the molecular understanding of the action mechanism of Ascophyllum nodosum extracts on plants. J. Appl. Phycol. 2020, 32, 573–597. [Google Scholar] [CrossRef] [Green Version]
  10. Shukla, P.S.; Mantin, E.G.; Adil, M.; Bajpai, S.; Critchley, A.T.; Prithiviraj, B. Ascophyllum nodosum-based biostimulants: Sustainable applications in agriculture for the stimulation of plant growth, stress tolerance, and disease management. Front Plant. Sci. 2019, 10, 655. [Google Scholar] [CrossRef] [Green Version]
  11. Stirk, W.A.; Rengasamy, K.R.R.; Kulkarni, M.G.; van Staden, J. Plant biostimulants from seaweed. In The Chemical Biology of Plant Biostimulants; John Wiley & Sons: Hoboken, NJ, USA, 2020; pp. 31–55. [Google Scholar]
  12. Wozniak, E.; Blaszczak, A.; Wiatrak, P.; Canady, M. Biostimulant mode of action. In The Chemical Biology of Plant Biostimulants; John Wiley & Sons: Hoboken, NJ, USA, 2020; pp. 229–243. [Google Scholar]
  13. Al-Ghamdi, A.A.; Elansary, H.O. Synergetic effects of 5-aminolevulinic acid and Ascophyllum nodosum seaweed extracts on Asparagus phenolics and stress related genes under saline irrigation. Plant. Physiol. Biochem. 2018, 129, 273–284. [Google Scholar] [CrossRef]
  14. Goñi, O.; Quille, P.; O’Connell, S. Ascophyllum nodosum extract biostimulants and their role in enhancing tolerance to drought stress in tomato plants. Plant. Physiol. Biochem. 2018, 126, 63–73. [Google Scholar] [CrossRef] [PubMed]
  15. Carmody, N.; Goni, O.; Langowski, L.; O’Connell, S. Ascophyllum nodosum extract biostimulant processing and its impact on enhancing heat stress tolerance during tomato fruit set. Front Plant. Sci. 2020, 11, 807. [Google Scholar] [CrossRef]
  16. Gunupuru, L.R.; Patel, J.S.; Sumarah, M.W.; Renaud, J.B.; Mantin, E.G.; Prithiviraj, B. A plant biostimulant made from the marine brown algae Ascophyllum nodosum and chitosan reduce Fusarium head blight and mycotoxin contamination in wheat. PLoS ONE 2019, 14, e0220562. [Google Scholar] [CrossRef]
  17. Patel, J.S.; Selvaraj, V.; Gunupuru, L.R.; Rathor, P.K.; Prithiviraj, B. Combined application of Ascophyllum nodosum extract and chitosan synergistically activates host-defense of peas against powdery mildew. BMC Plant. Biol. 2020, 20, 113. [Google Scholar] [CrossRef]
  18. Procházka, P.; Štranc, P.; Pazderů, K.; Vostřel, J.; Řehoř, J. Use of biologically active substances in hops. Plant Soil Environ. 2018, 64, 626–632. [Google Scholar] [CrossRef] [Green Version]
  19. Taskos, D.; Stamatiadis, S.; Yvin, J.-C.; Jamois, F. Effects of an Ascophyllum nodosum (L.) Le Jol. extract on grapevine yield and berry composition of a Merlot vineyard. Sci. Hortic. 2019, 250, 27–32. [Google Scholar] [CrossRef]
  20. Viencz, T.; Oliari, I.C.R.; Ayub, R.A.; Faria, C.M.D.R.; Botelho, R.V. Postharvest quality and brown rot incidence in plums treated with Ascophyllum nodosum extract Qualidade pós-colheita e incidência de podridão parda em ameixas tratadas com extrato de Ascophyllum nodosum. Cienc. Agrar. 2020, 41, 753–766. [Google Scholar] [CrossRef]
  21. FAOSAT. Production: Crops. Available online: www.fao.org/faostat/en/#data/QC (accessed on 13 November 2020).
  22. Ruggeri, R.; Loreti, P.; Rossini, F. Exploring the potential of hop as a dual purpose crop in the Mediterranean environment: Shoot and cone yield from nine commercial cultivars. Eur. J. Agron. 2018, 93, 11–17. [Google Scholar] [CrossRef]
  23. Marceddu, R.; Carrubba, A.; Sarno, M. Cultivation trials of hop (Humulus lupulus L.) in semi-arid environments. Heliyon 2020, 6, e05114. [Google Scholar] [CrossRef]
  24. Rossini, F.; Virga, G.; Loreti, P.; Provenzano, M.E.; Danieli, P.P.; Roberto, R. Beyond beer: Hop shoot production and nutritional composition under Mediterranean climatic conditions. Agronomy 2020, 10, 1547. [Google Scholar] [CrossRef]
  25. Rossini, F.; Loreti, P.; Provenzano, M.E.; De Santis, D.; Ruggeri, R. Agronomic performance and beer quality assessment of twenty hop cultivars grown in Central Italy. Ital. J. Agron. 2016, 11, 180–187. [Google Scholar] [CrossRef] [Green Version]
  26. Forteschi, M.; Porcu, M.C.; Fanari, M.; Zinellu, M.; Secchi, N.; Buiatti, S.; Passaghe, P.; Bertoli, S.; Pretti, L. Quality assessment of Cascade Hop (Humulus lupulus L.) grown in Sardinia. Eur. Food Res. Technol. 2019, 245, 863–871. [Google Scholar] [CrossRef]
  27. Rodrigues, M.Â.; Morais, J.; Castro, J.P. O lúpulo: Da cultura ao extrato. Técnica cultural tradicional. In Livro de Atas das Jornadas do Lúpulo e da Cerveja: Novas Oportunidades de Negócio; Instituto Politécnico: Bragança, Portugal, 2015; pp. 1–10. [Google Scholar]
  28. Afonso, S.; Arrobas, M.; Rodrigues, M.Â. Soil and plant analyses to diagnose hop fields irregular growth. J. Soil Sci. Plant. Nut. 2020, 20, 1999–2013. [Google Scholar] [CrossRef]
  29. Van Reeuwijk, L. Procedures for Soil Analysis, Technical Paper 9; International Soil Reference and Information Centre: Wageningen, The Netherlands, 2002; p. 120. [Google Scholar]
  30. Lakanen, E.; Erviö, R. A comparison of eight extractants for the determination of plant available micronutrients in soils. Hels. Yliop. Rehtorin Profr. Erkki Kivisen Juhlajulkaisu Viljo Puustjarvi 1971, 123, 223–232. [Google Scholar]
  31. Walinga, I.; Van Vark, W.; Houba, V.; Van der Lee, J. Soil and Plant Analysis, Part 7: Plant Analysis Procedures; Wageningen Agricultural University: Wageningen, The Netherlands, 1989. [Google Scholar]
  32. EBC Analysis Committee, Analytica EBC. Hans Carl Getränke Fachverlag. Nürenberg Method 1998, 7, 7. [Google Scholar]
  33. Bryson, G.; Mills, H.; Sasseville, D.; Jones, J.B., Jr.; Barker, A. Plant Analysis Handbook III: A Guide to Sampling, Preparation, Analysis and Interpretation for Agronomic and Horticultural Crops; Micro-Macro Publishing: Athens, GA, USA, 2014; Volume VIII. [Google Scholar]
  34. Jarrell, W.M.; Beverly, R.B. The dilution effect in plant nutrition studies. In Advances in Agronomy; Brady, N.C., Ed.; Academic Press: Cambridge, MA, USA, 1981; Volume 34, pp. 197–224. [Google Scholar]
  35. Marschner, P.; Rengel, Z. Nutrient availability in soils. In Marschner’s Mineral Nutrition of Higher Plants, 3rd ed.; Marschner, P., Ed.; Academic Press: San Diego, CA, USA, 2012; pp. 315–330. [Google Scholar]
  36. Kalaji, H.M.; Oukarroum, A.; Alexandrov, V.; Kouzmanova, M.; Brestic, M.; Zivcak, M.; Samborska, I.A.; Cetner, M.D.; Allakhverdiev, S.I.; Goltsev, V. Identification of nutrient deficiency in maize and tomato plants by in vivo chlorophyll a fluorescence measurements. Plant Physiol. Biochem. 2014, 81, 16–25. [Google Scholar] [CrossRef] [PubMed]
  37. Afonso, S.; Arrobas, M.; Ferreira, I.Q.; Rodrigues, M.Â. Assessing the potential use of two portable chlorophyll meters in diagnosing the nutritional status of plants. J. Plant Nutr. 2018, 41, 261–271. [Google Scholar] [CrossRef] [Green Version]
  38. Dinis, L.-T.; Ferreira, H.; Pinto, G.; Correia, C.; Moutinho Pereira, J. Kaolin-based, foliar reflective film protects photosystem II structure and function in grapevine leaves exposed to heat and high solar radiation. Photosynthetica 2016, 54, 47–55. [Google Scholar] [CrossRef]
  39. Kalaji, H.M.; Jajoo, A.; Oukarroum, A.; Brestic, M.; Zivcak, M.; Samborska, I.A.; Cetner, M.D.; Łukasik, I.; Goltsev, V.; Ladle, R.J. Chlorophyll a fluorescence as a tool to monitor physiological status of plants under abiotic stress conditions. Acta Physiol. Plant 2016, 38, 102. [Google Scholar] [CrossRef] [Green Version]
  40. Arrobas, M.; Ferreira, I.Q.; Afonso, S.; Rodrigues, M.Â. Sufficiency ranges and crop nutrient removals for peppermint (Mentha X piperita L.) established from field and pot fertilizer experiments. Comm. Soil Sci. Plant Anal. 2018, 49, 1719–1730. [Google Scholar] [CrossRef] [Green Version]
  41. MacKinnon, D.; Pavlovič, V.; Čeh, B.; Naglič, B.; Pavlovič, M. The impact of weather conditions on alpha-acid content in hop (Humulus lupulus L.) cv. Aurora. Plant Soil Environ. 2020, 10, 519–525. [Google Scholar] [CrossRef]
  42. Mallarino, A.P.; Haq, M.U.; Wittry, D.; Bermudez, M. Variation in soybean response to early season foliar fertilization among and within fields. Agron. J. 2001, 93, 1220–1226. [Google Scholar] [CrossRef]
  43. Amiri, M.E.; Fallahi, E.; Golchin, A. Influence of foliar and ground fertilization on yield, fruit quality, and soil, leaf, and fruit mineral nutrients in apple. J. Plant Nutr. 2008, 31, 515–525. [Google Scholar] [CrossRef]
  44. Di Stasio, E.; Van Oosten, M.J.; Silletti, S.; Raimondi, G.; Dell’Aversana, E.; Carillo, P.; Maggio, A. Ascophyllum nodosum-based algal extracts act as enhancers of growth, fruit quality, and adaptation to stress in salinized tomato plants. J. Appl. Phycol. 2018, 30, 2675–2686. [Google Scholar] [CrossRef]
  45. Yakhin, O.I.; Lubyanov, A.A.; Yakhin, I.A.; Brown, P.H. Biostimulants in plant science: A global perspective. Front Plant Sci. 2016, 7, 2049. [Google Scholar] [CrossRef] [PubMed] [Green Version]
  46. Xu, C.P.; Leskovar, D.I. Effects of A. nodosum seaweed extracts on spinach growth, physiology and nutrition value under drought stress. Sci. Hortic. 2015, 183, 39–47. [Google Scholar] [CrossRef]
  47. Frioni, T.; VanderWeide, J.; Palliotti, A.; Tombesi, S.; Poni, S.; Sabbatini, P. Foliar vs. soil application of Ascophyllum nodosum extracts to improve grapevine water stress tolerance. Sci. Hortic. 2021, 277, 109807. [Google Scholar] [CrossRef]
Figure 1. Average monthly temperature and precipitation during the experimental period.
Agriculture 11 00798 g001
Figure 2. Dry matter (DM) yield of hop plant parts (average ± standard error) in the different plant vigour plots (Weak Fair, Good and Very good), as a function of foliar treatment (Fnut, nutrient-rich foliar spray; Algae, algae-rich foliar spray; and Control) and year. Within each plant part (lowercase letters) or total DM yield (uppercase letters), means followed by the same letter are not statistically different (α = 0.05) by Tukey HSD test (Foliar treatment) or Student’s t-test (Year).
Agriculture 11 00798 g002aAgriculture 11 00798 g002b
Figure 3. Dry weight of individual cones (average ± standard error) in the different plant vigour plots (Weak, Fair, Good and Very good) as a function of foliar treatment (Fnut, nutrient-rich foliar spray; Algae, algae-rich foliar spray; and Control) and year. Means followed by the same letter are not statistically different (α = 0.05) by Tukey HSD (Foliar treatment) or t-Student (Year) tests.
Agriculture 11 00798 g003
Figure 4. Cone α- and β-acid concentrations (average ± standard error) in the different plant vigour plots (Weak, Fair, Good and Very good), as a function of foliar treatment (Fnut, nutrient-rich foliar spray; Algae, algae-rich foliar spray; and Control) and year. Means followed by the same letter are not statistically different (α = 0.05) by Tukey HSD tests (Foliar treatment) or Student’s t-tests (Year).
Agriculture 11 00798 g004aAgriculture 11 00798 g004b
Table 1. Soil properties (average ± standard deviation) determined from soil samples collected between rows at 0–20 cm depth on 2 June 2016.
Plot 1Plot 2Plot 3Plot 4
Soil PropertiesPlant VigourWeakFairGoodVery Good
pHH2O5.8 ± 0.125.8 ± 0.045.5 ± 0.105.1 ± 0.13
pHKCl4.8 ± 0.124.7 ± 0.044.4 ± 0.084.3 ± 0.13
Organic C (g kg−1) a13.4 ± 0.2015.7 ± 0.107.6 ± 0.0414.5 ± 0.20
Extract. P (mg P2O5 kg−1) b283.0 ± 44.7451.8 ± 33.5191.1 ± 27.9212.6 ± 28.2
Extract. K (mg K2O kg−1) b115.9 ± 7.8193.0 ± 8.6111.0 ± 5.9286.0 ± 5.0
Exchan. Ca (cmolc kg−1) c14.8 ± 1.8423.3 ± 1.3910.7 ± 0.172.7 ± 0.46
Exchan. Mg (cmolc kg−1) c4.8 ± 0.849.5 ± 1.222.7 ± 0.070.5 ± 0.04
Exchan. K (cmolc kg−1) c0.3 ± 0.020.5 ± 0.040.2 ± 0.010.5 ± 0.08
Exchan. Na (cmolc kg−1) c0.2 ± 0.050.6 ± 0.050.1 ± 0.010.3 ± 0.06
Exchan. acidity (cmolc kg−1) c0.3 ± 0.030.3 ± 0.020.2 ± 0.030.6 ± 0.13
Cation-exch. capacity (cmolc kg−1)20.7 ± 2.6434.4 ± 2.5614.0 ± 0.215.1 ± 0.37
Extract. B (mg kg−1) d0.7 ± 0.141.2 ± 0.100.8 ± 0.130.6 ± 0.09
Extract. Fe (mg kg−1) e293.5 ± 30.50272.6 ± 29.11114.2 ± 6.75105.7 ± 4.41
Exctract. Mn (mg kg−1) e250.7 ± 28.95179.9 ± 14.02224.1 ± 10.2457.4 ± 7.89
Extract. Zn (mg kg−1) e9.8 ± 0.6611.7 ± 0.807.2 ± 0.193.9 ± 0.46
Extract. Cu (mg kg−1) e16.3 ± 1.4316.9 ± 1.0910.1 ± 0.394.3 ± 0.77
a Wet oxidation (Walkley-Black); b Egner-Riehm; c Ammonium acetate, pH 7; d Hot water, azomethine-H; e Ammonium acetate and ethylenediaminetetraacetic acid (EDTA).
Table 2. Leaf concentrations of macro and micronutrients (average ± standard error) in July from samples taken at 2 m height in the plots of weak and very good vigour plants as function of foliar treatment (Fnut, nutrient-rich foliar spray; Algae, algae-rich foliar spray; and Control), and year. Means followed by the same letter are not statistically different (α = 0.05) by Tukey HSD (Foliar treatment) or t-Student t (Year) tests.
NitrogenPhosphorusPotassiumCalciumMagnesiumIronManganeseCopperZincBoron
(g kg−1)(mg kg−1)
Foliar treatment (FT)Weak
Control30.6 ± 2.15 a1.6 ± 0.10 a4.3 ± 1.00 a12.2 ± 1.70 a11.8 ± 3.95 b181.7 ± 91.6 a49.4 ± 4.4 b5.6 ± 0.88 a18.5 ± 1.49 a34.9 ± 11.86 b
Fnut29.1 ± 2.09 a1.4 ± 0.14 b4.0 ± 0.63 a12.4 ± 3.18 a10.1 ± 1.81 b169.0 ± 41.2 a43.2 ± 12.5 b5.1 ± 0.46 a17.2 ± 1.61 a30.4 ± 9.86 b
Algae31.5 ± 1.96 a1.6 ± 0.14 a4.5 ± 0.85 a14.0 ± 1.75 a14.8 ± 4.68 a127.5 ± 18.9 a58.8 ± 8.7 a4.8 ± 0.47 a17.9 ± 3.11 a44.7 ± 7.97 a
Year (Y)
201730.9 ± 1.84 a1.6 ± 0.14 a3.6 ± 1.51 b14.2 ± 2.01 a9.2 ± 1.54 b195.1 ± 76.3 a53.2 ± 3.8 a4.9 ± 0.47 a16.3 ± 1.85 b29.1 ± 9.19 b
201829.8 ± 2.47 a1.5 ± 0.11 b4.9 ± 0.43 a11.5 ± 1.81 b15.2 ± 3.35 a123.8 ± 16.0 b47.7 ± 14.8 b5.5 ± 0.79 a19.4 ± 1.01 a44.2 ± 7.39 a
Prob. (FT)0.12820.01650.09340.13620.00010.19190.00080.08720.33890.0030
Prob. (Y)0.25550.0078<0.00010.0028<0.00010.01100.04240.06650.00090.0001
Prob. (FT×Y)0.11670.54430.21540.04020.00600.22890.00050.47870.39770.3045
Foliar treatment (FT)Very good
Control33.9 ± 2.17 a1.4 ± 0.06 a24.3 ± 9.48 a21.5 ± 7.43 a1.19 ± 0.63 a100.9 ± 15.2 a356.0 ± 88.9 ab4.3 ± 1.29 a76.7 ± 7.82 a70.5 ± 9.50 a
Fnut35.4 ± 2.43 a1.5 ± 0.18 a26.1 ± 12.05 a17.6 ± 4.54 b4.6 ± 1.06 a113.2 ± 18.7 a367.5 ± 36.3 a4.7 ± 1.86 a78.9 ± 40.29 a64.4 ± 10.20 b
Algae35.4 ± 1.60 a1.6 ± 0.19 a24.4 ± 7.20 a19.4 ± 6.22 ab4.6 ± 0.66 a96.6 ± 16.6 a285.7 ± 49.4 b5.5 ± 1.88 a71.8 ± 23.60 a62.5 ± 7.63 b
Year (Y)
201733.3 ± 1.69 b1.4 ± 0.21 a16.5 ± 1.74 b24.8 ± 3.73 a4.1 ± 0.69 b114.9 ± 18.6 a309.4 ± 73.7 b3.7 ± 1.6164.8 ± 15.86 a73.4 ± 6.34 a
201836.4 ± 1.04 a1.5 ± 0.12 a33.4 ± 4.12 a14.2 ± 1.04 b5.6 ± 0.58 a92.2 ± 5.7 b363.4 ± 51.2 a6.0 ± 0.4886.8 ± 29.97 a58.2 ± 3.66 b
Prob. (FT)0.06970.05700.45580.02750.19250.08990.03430.23640.87720.0082
Prob. (Y)<0.00010.3468<0.0001<0.00010.00020.00200.04410.00090.0792<0.0001
Prob. (FT×Y)0.11720.02850.03370.22360.68470.36240.20020.42130.22580.1930
Sufficiency range[32–56][2.7–5.4][16–34][10–26][2.9–6.7][44–98][45–125][8–29][23–108][18–63]
Table 3. Cone concentrations of macro and micronutrients (average ± standard error) in the plots of weak and very good vigour plants as a function of foliar treatment (Fnut, nutrient-rich foliar spray; Algae, algae-rich foliar spray; and Control), and year. Means followed by the same letter are not statistically different (α = 0.05) by Tukey HSD tests (Foliar treatment) or Student’s t-tests (Year).
NitrogenPhosphorusPotassiumCalciumMagnesiumIronManganeseCopperZincBoron
(g kg−1)(mg kg−1)
Foliar treatment (FT)Weak
Control30.41 ± 5.81 a3.63 ± 0.38 a9.36 ± 2.01 a3.53 ± 1.11 a3.49 ± 0.70 a236.07 ± 137.4 a42.26 ± 7.36 ab8.86 ± 1.21 a31.99 ± 4.91 b18.91 ± 4.59 a
Fnut27.61 ± 2.58 b3.28 ± 0.32 a10.73 ± 2.94 a3.43 ± 1.23 a3.28 ± 0.60 a198.64 ± 20.6 a36.34 ± 9.99 b8.33 ± 1.52 a34.53 ± 5.61 ab18.62 ± 3.22 a
Algae28.80 ± 3.98 ab3.60 ± 0.32 a9.73 ± 2.69 a3.71 ± 1.61 a3.43 ± 0.78 a275.19 ± 132.7 a49.99 ± 7.94 a9.05 ± 1.54 a38.50 ± 11.85 a20.53 ± 3.90 a
Year (Y)
201732.92 ± 3.27 a3.64 ± 0.39 a7.62 ± 1.26 b4.89 ± 0.65 a3.98 ± 0.49 a168.96 ± 27.5 b39.33 ± 12.04 a8.66 ± 1.57 a40.95 ± 8.27 a19.10 ± 4.62 a
201825.96 ± 1.67 b3.40 ± 0.31 a11.68 ± 1.63 a2.56 ± 0.29 b2.97 ± 0.39 b287.38 ± 122.0 a45.51 ± 7.40 a8.82 ± 1.32 a30.55 ± 4.51 b19.55 ± 3.61 a
Prob. (FT)0.01030.05980.27940.41190.64230.44010.00400.53150.04750.3316
Prob. (Y)<0.00010.0803<0.0001<0.00010.00010.00780.06190.80590.00040.7716
Prob. (FT×Y)0.00620.06910.55850.15710.44370.13960.04240.25940.04070.0182
Foliar treatment (FT)Very good
Control25.5 ± 1.33 ab2.9 ± 0.35 a20.3 ± 2.75 a4.1 ± 1.93 a2.0 ± 0.24 a151.1 ± 29.6 a77.3 ± 15.94 a6.7 ± 0.57 a33.7 ± 3.80 a27.8 ± 2.53 a
Fnut26.2 ± 1.15 a2.8 ± 0.18 a21.1 ± 3.24 a4.0 ± 1.77 a2.2 ± 0.26 a144.0 ± 17.8 a83.0 ± 12.07 a6.4 ± 0.58 a32.2 ± 2.51 a25.8 ± 1.24 ab
Algae24.3 ± 1.00 b2.8 ± 0.35 a19.4 ± 2.48 a3.7 ± 1.60 a2.0 ± 0.12 a128.0 ± 9.3 a61.8 ± 5.90 b6.3 ± 0.89 a30.6 ± 0.94 a25.1 ± 1.76 b
Year (Y)
201725.7 ± 1.28 a3.0 ± 0.23 a18.0 ± 1.47 b5.6 ± 0.5 a2.0 ± 0.17 b138.6 ± 9.0 a68.5 ± 11.81 b6.5 ± 0.45 a32.3 ± 3.21 a27.2 ± 2.03 a
201825.0 ± 1.43 a2.6 ± 0.12 b22.5 ± 1.81 a2.3 ± 0.39 b2.1 ± 0.25 a143.6 ± 30.4 a79.5 ± 15.65 a6.4 ± 0.89 a32.0 ± 2.62 a25.2 ± 1.92 b
Prob. (FT)0.01120.41080.55950.29990.07680.10510.00400.50880.10330.0125
Prob. (Y)0.1509<0.0001<0.0001<0.00010.04560.56480.02690.74360.74420.0097
Prob. (FT×Y)0.34970.04520.83450.39950.71580.35330.84850.38550.38270.6418
Table 4. SPAD (Soil and Plant Analysis Development) readings, NDVI (Normalized Difference Vegetation Index) and chlorophyll a fluorescence (average ± standard error) on July in the plots of weak and very good vigour plants as a function of foliar treatment (Fnut, nutrient-rich foliar spray; Algae, algae-rich foliar spray; and Control) and year. Means followed by the same letter are not statistically different (α = 0.05) by Tukey HSD tests (Foliar treatment) or Student’s t-tests (Year).
SPADNDVIOJIPFV/FMFV/F0
Foliar treatment (FT)Weak
Control33.5 ± 2.81 b0.72 ± 0.08 a256 ± 20 a362 ± 15 a503 ± 56 a631 ± 39 b0.74 ± 0.02 a2795 ± 238 a
Fnut33.2 ± 3.06 b0.73 ± 0.04 a265 ± 37 a389 ± 54 a561 ± 63 a714 ± 65 a0.76 ± 0.02 a3265 ± 295 a
Algae36.4 ± 2.42 a0.74 ± 0.02 a256 ± 53 a372 ± 81 a532 ± 53 a697 ± 46 a0.77 ± 0.03 a3338 ± 598 a
Year (Y)
201735.1 ± 1.92 a0.69 ± 0.03 b273 ± 44 a397 ± 71 a566 ± 45 a708 ± 54 a0.75 ± 0.02 a3035 ± 354 a
201833.6 ± 3.78 a0.77 ± 0.03 a244 ± 22 b352 ± 14 b498 ± 54 b653 ± 57 b0.76 ± 0.03 a3230 ± 545 a
Prob. (FT)0.01720.58640.90390.70450.11600.00990.09970.0840
Prob. (Y)0.1029<0.00010.13610.11130.00730.013380.42740.3344
Prob. (FT×Y)0.00310.00310.74540.65580.31100.19900.42310.4405
Foliar treatment (FT)Very good
Control42.6 ± 2.75 a0.77 ± 0.05 ab256 ± 11 a402 ± 21 a705 ± 64 a877 ± 88 a0.81 ± 0.02 a4291 ± 536 a
Fnut43.7 ± 1.99 a0.77 ± 0.03 a250 ± 16 a378 ± 16 a722 ± 67 a900 ± 55 a0.82 ± 0.01 a4547 ± 272 a
Algae43.1 ± 2.66 a0.75 ± 0.04 b252 ± 17 a399 ± 25 a694 ± 70 a886 ± 72 a0.82 ± 0.02 a4484 ± 454 a
Year (Y)
201745.1 ± 1.16 a0.73 ± 0.02 b245 ± 9 b389 ± 18 a729 ± 44 a922 ± 65 a0.82 ± 0.01 a4650 ± 407 a
201841.2 ± 1.51 b0.80 ± 0.01 a259 ± 15 a396 ± 26 a691 ± 74 a862 ± 64 a0.81 ± 0.02 a4284 ± 386 b
Prob. (FT)0.38790.01880.72420.09410.85140.82810.46690.5198
Prob. (Y)<0.0001<0.00010.03760.46520.20040.05580.05910.0488
Prob. (FT×Y)0.42890.15550.77810.68260.35360.28640.27270.2393
Publisher’s Note: MDPI stays neutral with regard to jurisdictional claims in published maps and institutional affiliations.

