1. Introduction
Corn (
Zea mays L.) is one of the most versatile cereal crops, and has multiple applications as food consumption, industrial raw material, and feeding stuff. The rapid increase of corn acreage results in a higher requirement for corn harvest quality [
1]. Corn peeling is the key link in corn ear harvest, and directly affects the storage and follow-up processing of corn ears [
2,
3]. However, ears are often subjected to excessive extrusion and friction due to an inappropriate parameter setting of the peeling unit, which leads to serious mechanical damage [
4,
5]. Mechanical damage caused by external loading is the main factor behind a decline in quality and the total production of corn, and can cause serious financial losses in the corn industry [
6]. Therefore, under the premise of bract removal, an investigation into how to reduce and prevent the mechanical damage caused by excessive peeling force deserves special attention.
Mechanical properties of plant leaves are crucial to understanding leaf fracture mechanisms and the designs of leaf removal machinery [
7,
8].
Figure 1 shows a schematic diagram of corn peeling. During the peeling operation, two peeling rollers rotate toward each other and tilt downward at a specific angle. In the direction parallel to the axis of the peeling roller, the corn ear slides down along the groove of two rollers under its own gravity and the force of delivery device, while the corn bract is subjected to an upward friction force. Meanwhile, in the direction perpendicular to the axis of the peeling roller, the relative rotating peeling rollers apply different friction torques to the corn ear due to the different materials and surface morphologies, which makes the corn ear rotate around its axis. In the process of movement, the peeling rollers grab and pull the bract under the action of friction. Once the force provided by the rollers is greater than the fracture force of the bract, the bract is pulled off and separated from the corn ear. Consequently, testing the mechanical properties of corn bract and determining the mechanical conditions for completing the peeling operation are of great significance to realizing high efficiency and low loss during corn peeling.
Several research efforts have reported on the mechanical properties of various plant leaves. Researchers believe that plant leaves are usually anisotropic in different directions, thus their mechanical properties rest with the position and direction of the applied load [
9]. Kohyama et al. [
10] revealed that the mechanical strength of a cabbage leaf depends on vein orientation, and that strength proved to be greater when the vein orientation was parallel to the test direction. The same result was found by Toole for lettuce [
11]. On the other hand, there is some controversy regarding the influence of moisture content on the mechanical properties of biomass in the literature. Kneebone et al. [
12] proposed that dry or withered leaves tend to be somewhat stronger than succulent leaves. On the contrary, Tang et al. [
13] pointed out the mean tensile strength of a rice leaf gradually decreases with decreasing moisture content. In other respects, Jacobs et al. [
14] found that the cross-sectional area was the main factor affecting the differences of fracture force and fracture energy among species. Overall, the mechanical properties of plant leaves are highly influenced by moisture content, the cross-sectional area, and the position and direction of the applied load. To our knowledge, relatively few comprehensive studies have been done on the tensile properties of corn bract that could help realize bract removal with minimum energy performance to reduce ear mechanical damage during peeling operations [
15,
16].
To address the above issues, the physical and tensile properties of corn bract were tested using two corn varieties after entering the harvest period. The purpose of this study was to quantify and compare the effects of bract moisture content, bract thickness, and tensile loading direction on the tensile properties of leaf blades and sheaths throughout the harvest period. Mathematical models were established for the fracture force, tensile strength, and fracture energy of the leaf blades and sheaths depending on bract moisture content and bract thickness. The models may be used to guide the design and parameter setting of corn peeling devices. In addition, the fracture modes and fracture mechanisms of the leaf blades and sheaths under different tensile loading directions are expressed from the perspectives of plant physiological and morphological characteristics.
2. Materials and Methods
2.1. Corn Materials
Two corn varieties (Feitian 358 and Jidan 558) that are widely planted in Northeast China were selected as experimental varieties. Feitian 358 was cultivated by the Dunhuang Seed Industry Co., Ltd., Wuhan, China. Jidan 558 is a native corn variety bred by the Corn Research Institute of Jilin Academy of Agricultural Sciences, Jilin, China. The two corn varieties are generally sown in late April to early May, and it takes 128–131 days from seedling emergence to maturity. After corn grains had fully matured, the corn ears with bracts used in this study were harvested on five different days in harvest season (24 September, 1 October, 8 October, 15 October and 22 October 2020) from the Agricultural Experimental Base of Jilin University (N 43°56′, E 125°14′) in Changchun, Jilin province, China. The harvested ears were stored in a sealed bag in a shaded place. All tensile tests were completed within two days of harvesting.
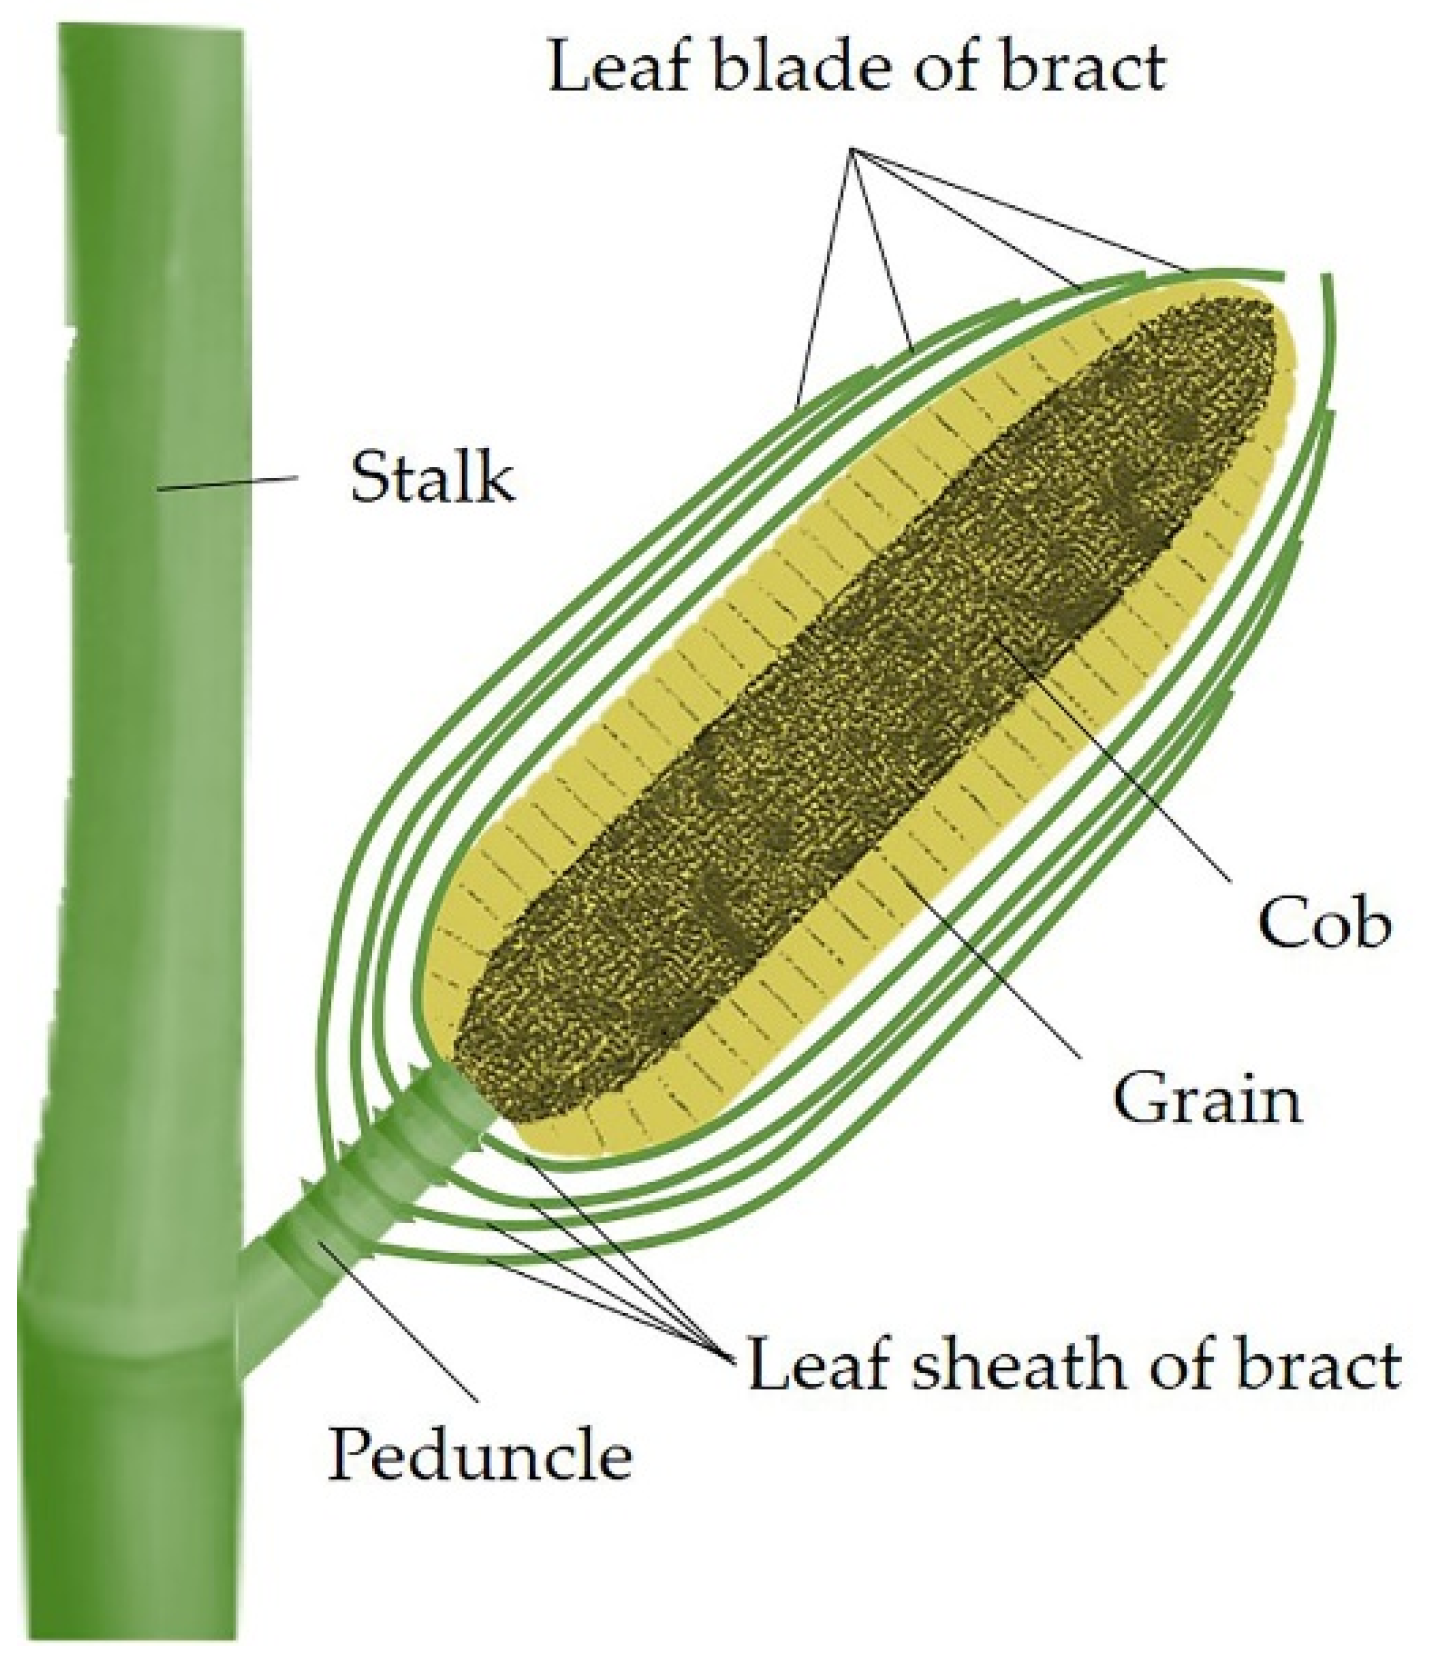
As shown in
Figure 2, a corn bract is composed of leaf blades and leaf sheaths [
17]. Overlapped bracts grow on the peduncle nodes and wrap the bare ear. Field investigation revealed that the fracture positions of the bract mainly occurred somewhere on the leaf blade or at the junction between leafs and peduncle during the peeling operation [
18]. Therefore, in this study, the leaf blades and leaf sheaths of corn bracts were selected as two test positions for the tensile test.
2.2. Equipment and Methods
2.2.1. Physical Properties Test Method
To determine the physical properties of corn materials, 50 ears each of Feitian 358 and Jidan 558 were randomly selected for measuring from five harvest days. For each corn ear, the length, width at half-length, blade thickness, sheath thickness of the third bract, and the total number of bracts were measured. The mean value and standard deviation (SD) were calculated. Meanwhile, the moisture content (w.b.) (i.e., wet basis) of the kernel, bract, and peduncle from five harvest days were determined by using a DZF-6050 electric thermostatic drying oven (Rongshida Electric Equipment Co., Ltd., Kunshan, China) at 105 ± 1 °C during 24 h. In addition, to compare the physical properties of different layers of bract, the blade thickness, sheath thickness, and moisture content (w.b.) of the second to sixth bracts of the two varieties harvested on 1 October 2020 were measured.
2.2.2. Tensile Test Method
Tensile test is the most common and effective method for studying the tensile properties of materials [
19,
20,
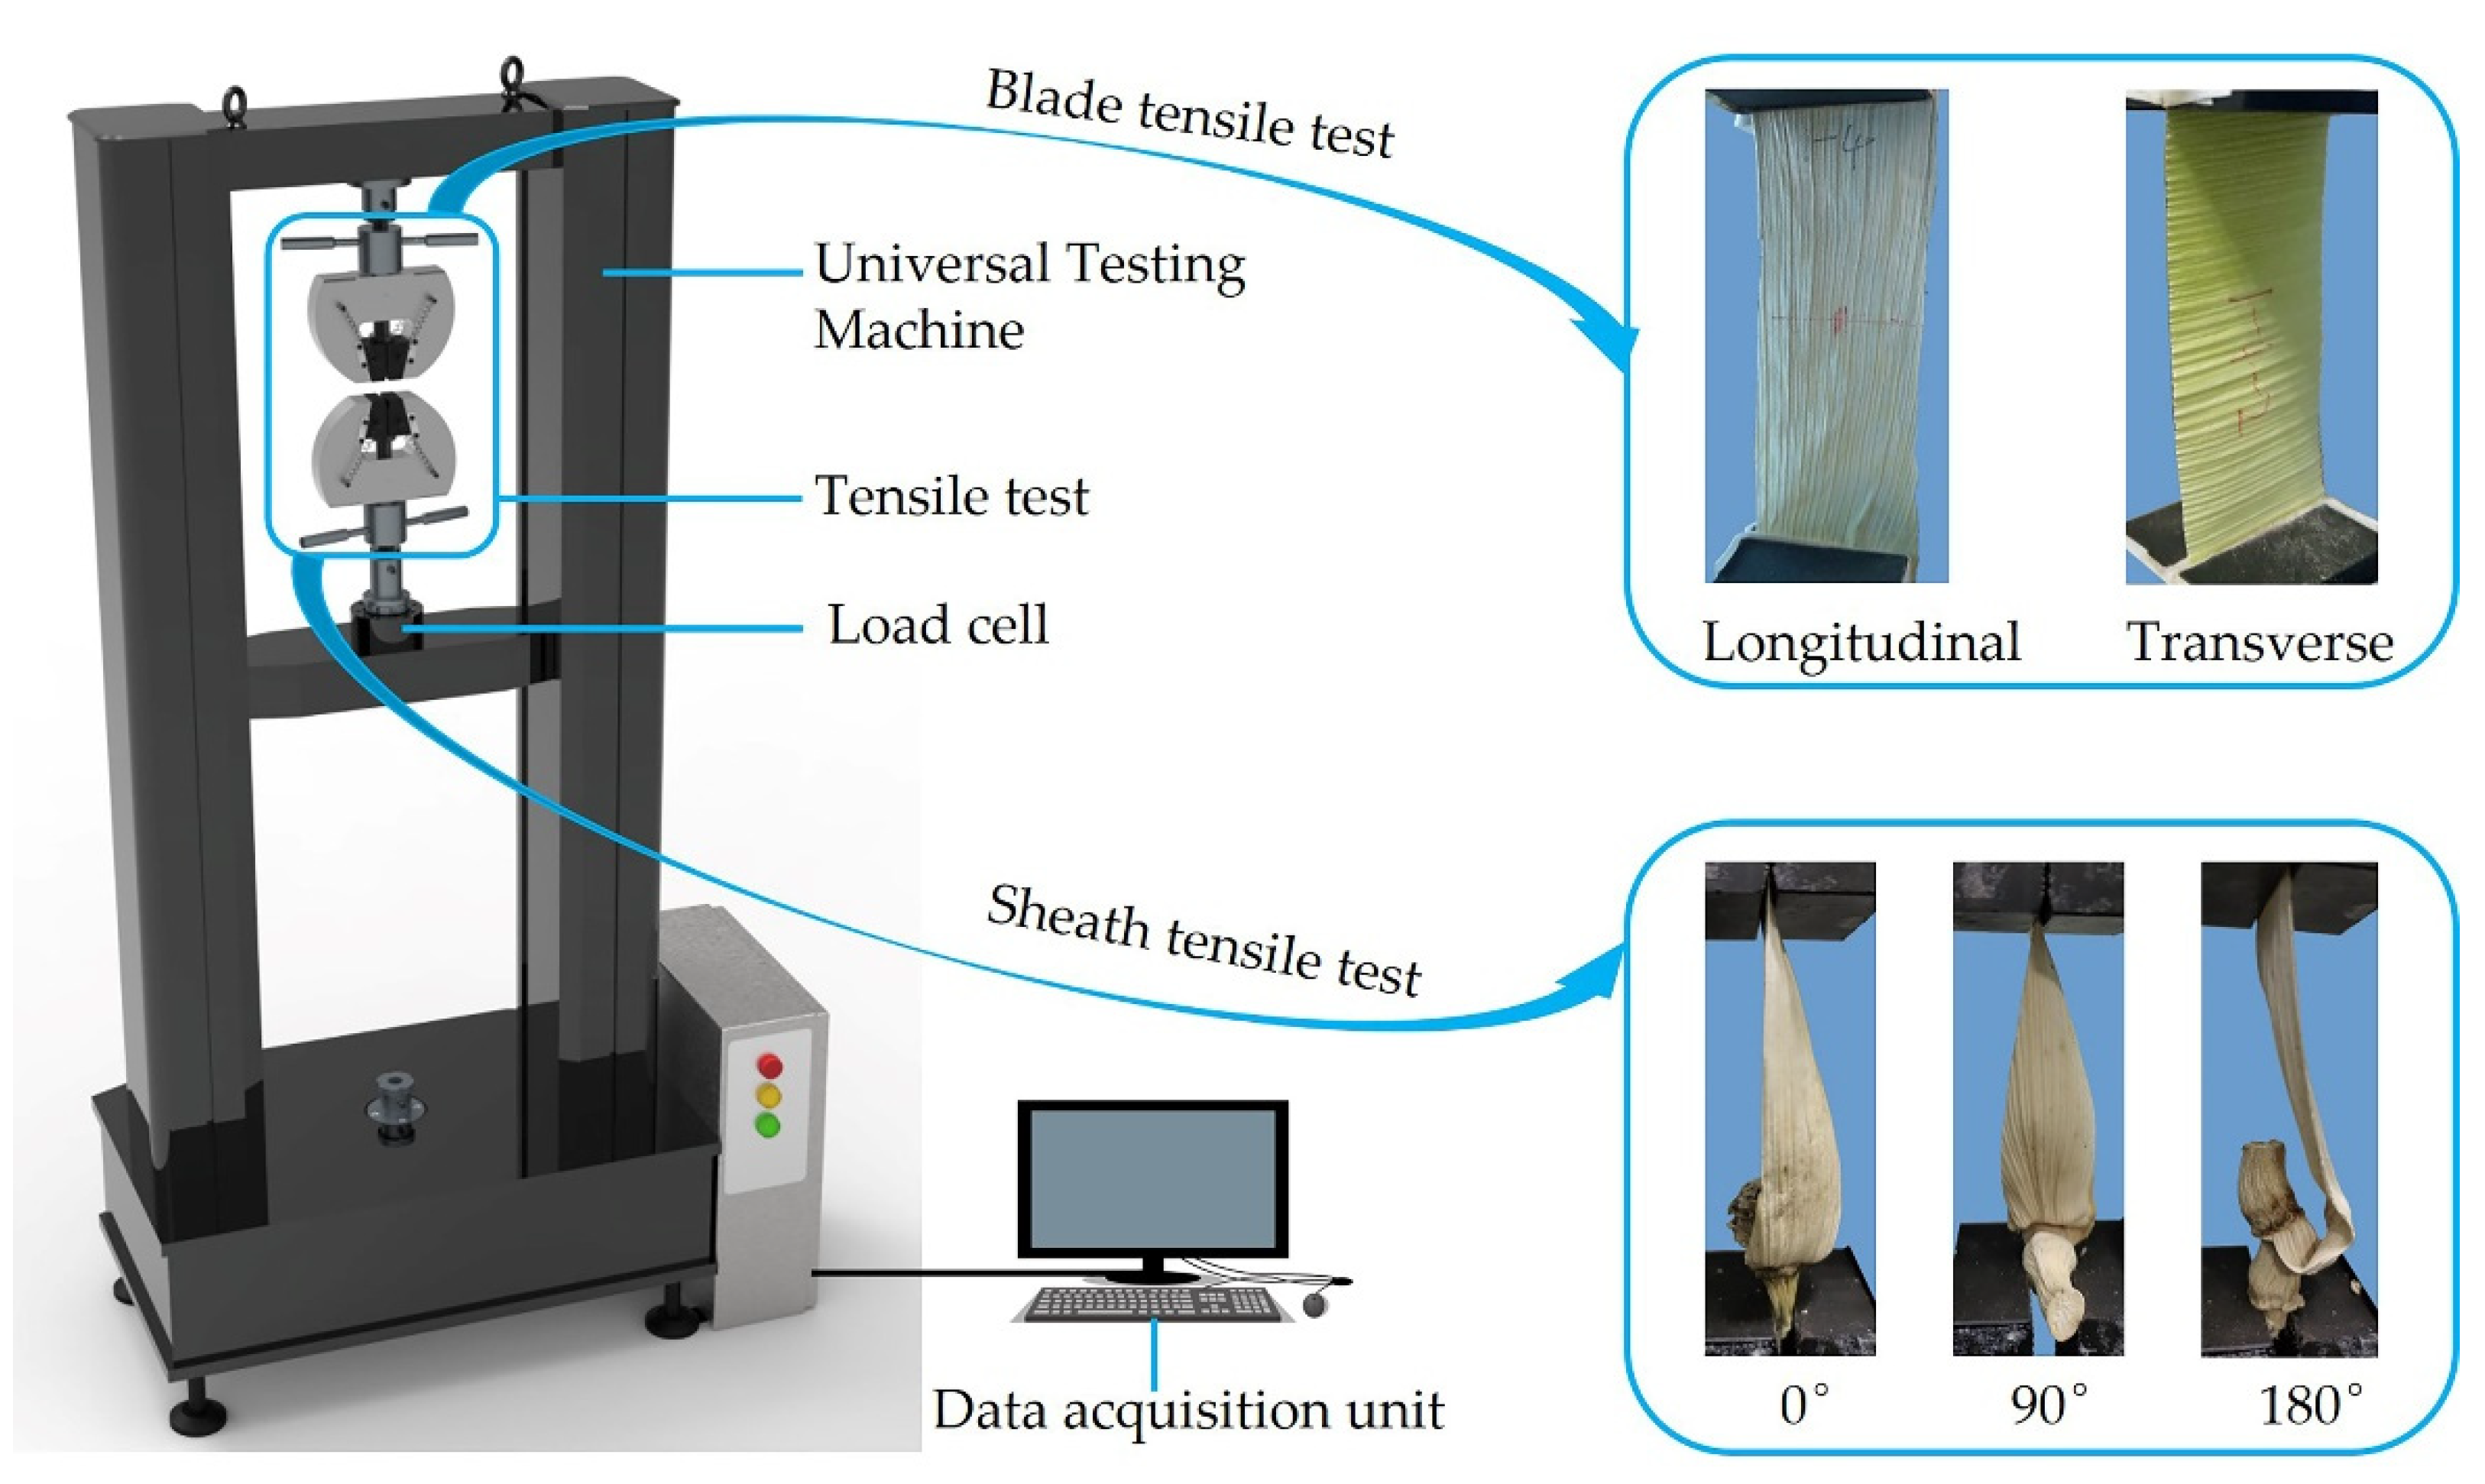
21]. The specimen preparation process of this study was as follows: each leaf blade was cut into two specimens for the blade tensile test. A rectangular specimen (30 mm in width and 120 mm in length) was cut along the longitudinal vein direction from the central part of the top leaf blade for the longitudinal tensile test (LTT). Another rectangular specimen (30 mm in width and 90 mm in length) was taken perpendicular to the longitudinal vein direction from the central part of the remaining leaf blade for the transverse tensile test (TTT). Next, a peduncle was taken off the ear along with bract for the sheath tensile test. The connection length between leaf sheath and peduncle was controlled at 10 mm, and other redundant bracts were removed. Ten test specimens were prepared for each test group. The prepared specimens were sequentially labelled and sealed in airtight bags, then stored at the optimum condition of 4 °C to retain moisture.
The tensile tests were performed on a Universal Testing Machine (D-NS type, Changchun Institute of Mechanical Science Co., Ltd., Jilin, China), which attached to a load cell (range of 10 kN, accuracy of 0.5%), as shown in
Figure 3. The test specimen was fixed to the upper beam and the moving beam of the testing machine by a mechanical fixture. The moving beam moved downward at a constant speed of 10 mm/min until the specimen fractured. A test in which the specimen slid off the fixture or broke in the fixture was considered invalid. The single trial was repeated 10 times, and the mean value and standard deviation of each test index were calculated. The load-displacement curve was plotted for each effective test, from which the fracture force (
Fb), tensile strength (
σt), and fracture energy (
Eg) were determined.
Fracture force is the maximum force born by a specimen at fracture failure under the tensile condition. Tensile strength is defined as the fracture force per unit cross-sectional area of specimen. Thereinto, the product of the average thickness (leaf blade or leaf sheath) and the specimen width was used as the estimated value of original cross-sectional area of the specimen. Tensile strength was calculated using the following equation [
9,
19,
22].
where
σt is the tensile strength (MPa),
Fb is the fracture force (N),
w is the specimen width (mm), and
t is the average specimen thickness (mm).
Fracture energy is the energy consumption required for material fracture, and it is the internal energy caused by material deformation under an external load. Fracture energy is described as the area under the load-displacement curve between the test origin and maximum load point. It may be expressed mathematically as follows [
14,
23,
24]:
where
Eg is the fracture energy (J),
Fn and
Fn+1 are values of tensile load (N), and
Dn and
Dn+1 are values of the specimen’s elongation (mm).
2.3. Statistical Analysis
Experimental data were analyzed applying regression analysis and one-way analysis of variance (ANOVA) using SPSS 24 software (SPSS Inc., Chicago, IL, USA). Duncan’s multiple range test was used to compare the mean values, and the significance level was set at 0.05 [
20].
3. Results and Discussion
3.1. Physical Properties of Corn Materials
The physical properties of Feitian 358 and Jidan 558 are presented in
Table 1. From 24 September to 22 October 2020, the moisture contents of the kernel, bract and peduncle decreased by 41.82%, 68.21%, and 21.94% for Feitian 358, respectively, and showed a decrease of 44.95%, 75.63%, and 33.33% for Jidan 558, respectively. With the delay of harvest day, the moisture content of each part of the ear showed a decreasing trend.
The length, width, blade thickness, and sheath thickness of the third bract all decreased with the delay of harvest day for both corn varieties, which might have been caused by the decrease in bract moisture content. An explanation for this could be that the pore spaces of leaf are filled with water when leaf moisture content is high, while the water in the pores dries when leaf moisture content decreases, so the leaf size becomes smaller [
25]. Vincent et al. [
21] reported a similar conclusion that ryegrass leaves thinned as the leaves dried.
The average thickness and moisture content of the second to sixth bracts measured on 1 October 2020 are listed in
Table 2. For the two varieties, the average thicknesses of leaf blades and sheaths decreased gradually from outer to inner layers, whereas the average moisture content increased firstly and then decreased from outer to inner layers.
The total number of bracts for Feitian 358 was between 6 to 10 layers, and 76% of the ears had 7 layers. The total number of bracts for Jidan 558 ranged from 6 to 11 layers, and 52% of the ears had 8 layers. The outermost bract was often damaged by direct contact with the external environment. Therefore, the second to sixth bracts were used to study the effect of bract thickness on the tensile properties.
3.2. Tensile Properties
In this section, the tensile properties, fracture modes, and fracture mechanisms of leaf blades and leaf sheaths are described. The effect of bract moisture content, bract thickness, and tensile loading direction are analyzed.
3.2.1. Tensile Test Results of Leaf Blade
The values of mean fracture force, tensile strength, and fracture energy of leaf blades under two directions, as well as the mathematical models of these properties as a function of moisture content and blade thickness, are presented in
Table 3 and
Table 4.
Tensile Properties of the Third Leaf Blade in Different Harvest Days
The longitudinal and transverse tensile properties of leaf blades of the two cultivars showed the same change rule with the delay of harvest day (
Table 3). The mean fracture force and tensile strength increased, while the mean fracture energy increased firstly then decreased. With decreasing moisture content, the leaves became more brittle and more sensitive, and decreased in tensile properties, which were considered as a product of analysis [
13]. During the harvest period of this study, the bract moisture contents decreased by 68.21% and 75.63% for Feitian 358 and Jidan 558, respectively, while the mean tensile strengths of leaf blades in the LTT increased by 1.69 and 2.53 times, respectively, and those in the TTT ere increased by 2.62 and 2.79 times, respectively. Fiber almost never became brittle by drying [
12]. One possible explanation was that, due to water scarcity, the maximum lignification of the vascular system resulted in thickening of the secondary wall, thereby increasing the mechanical strength of the bract [
26].
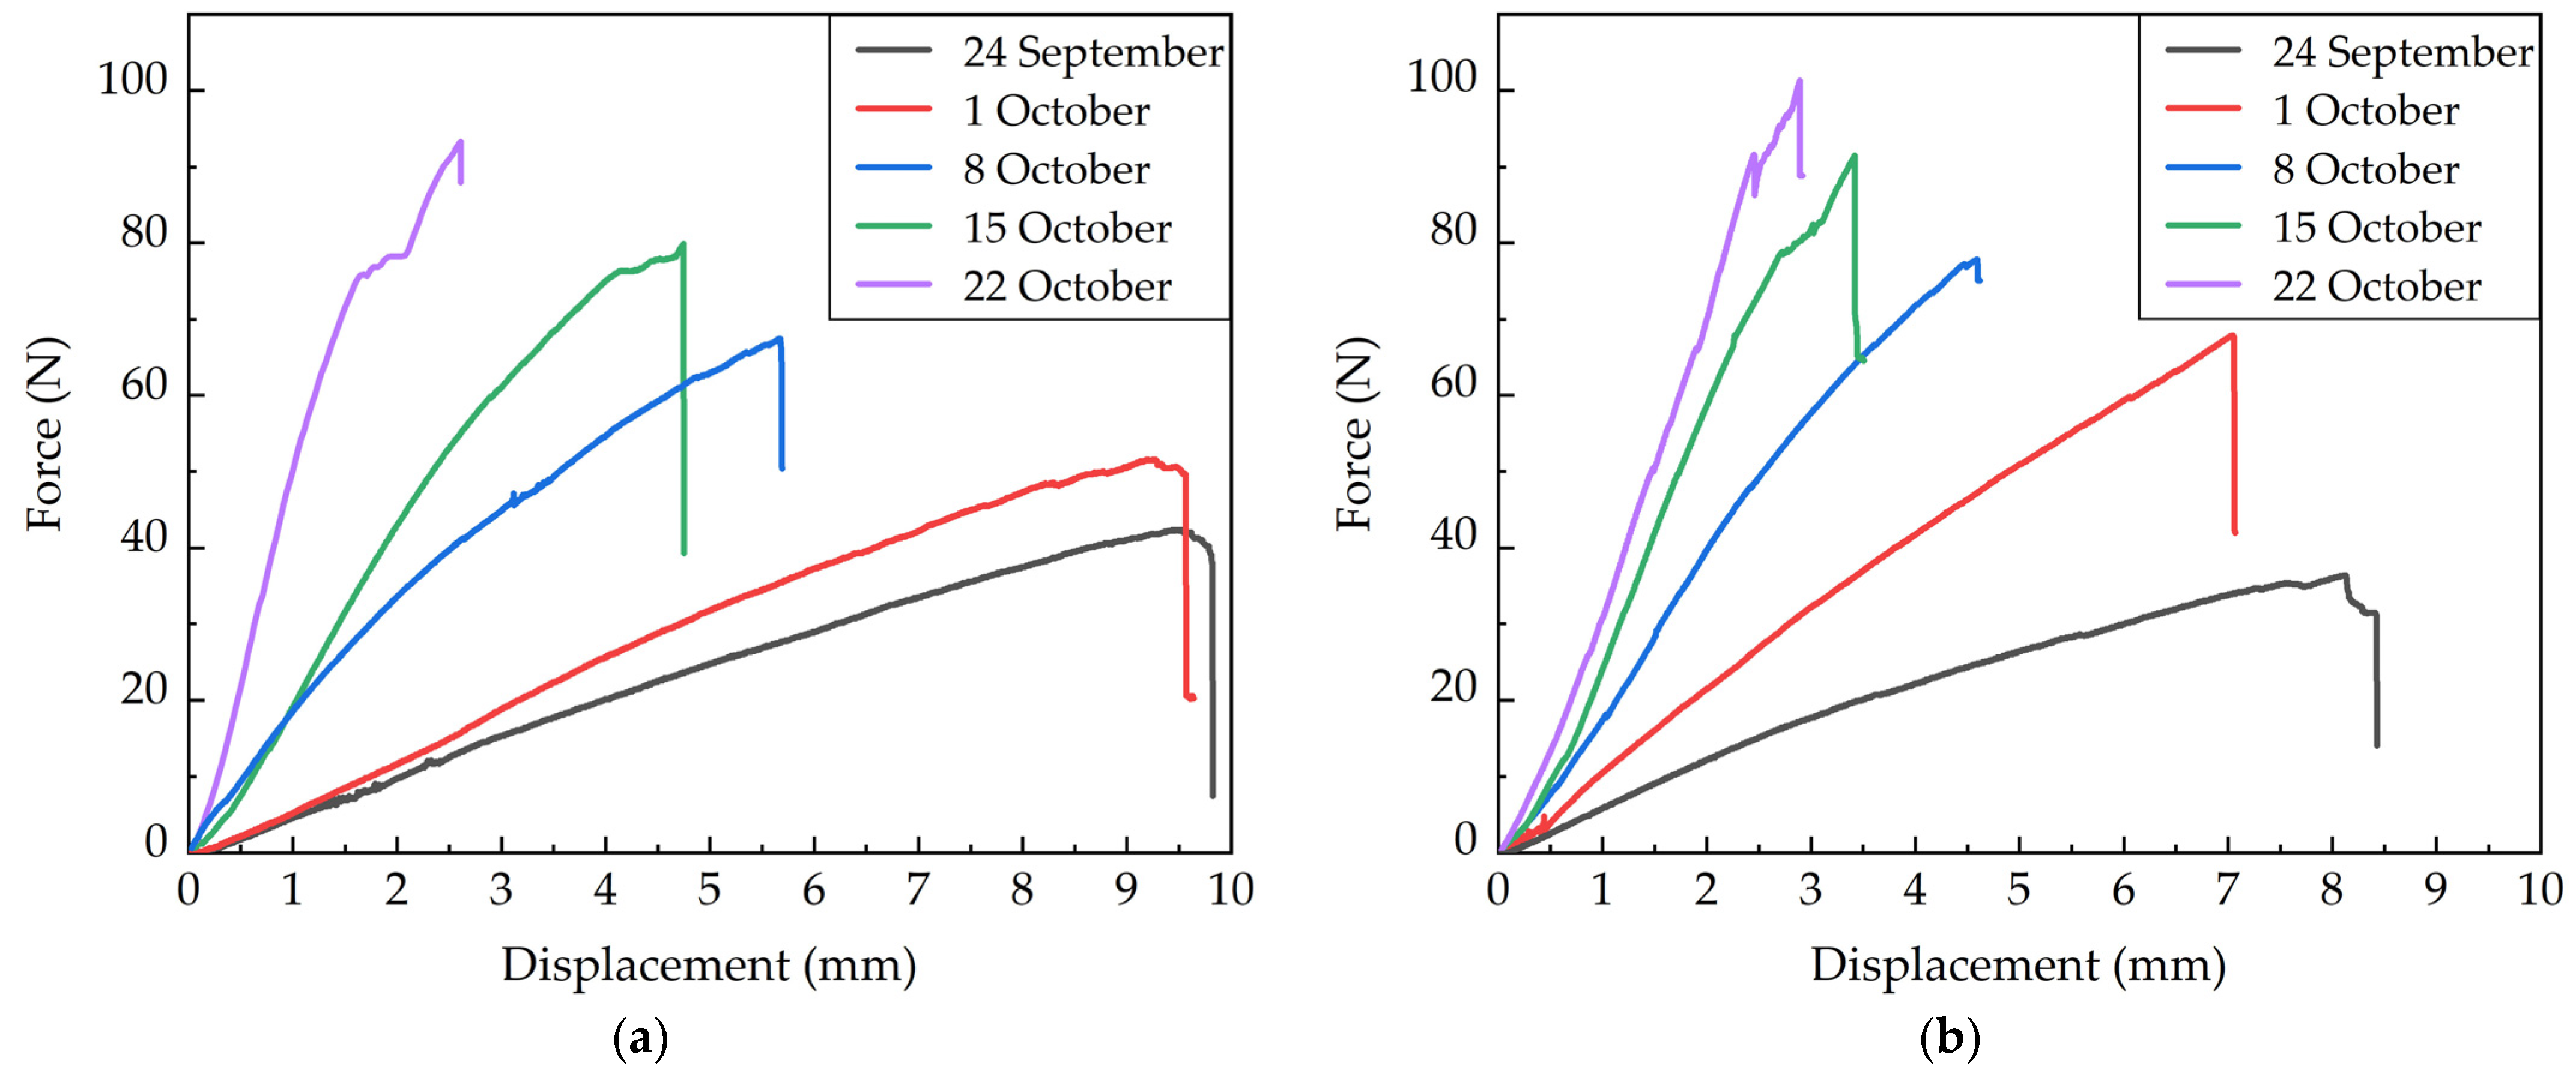
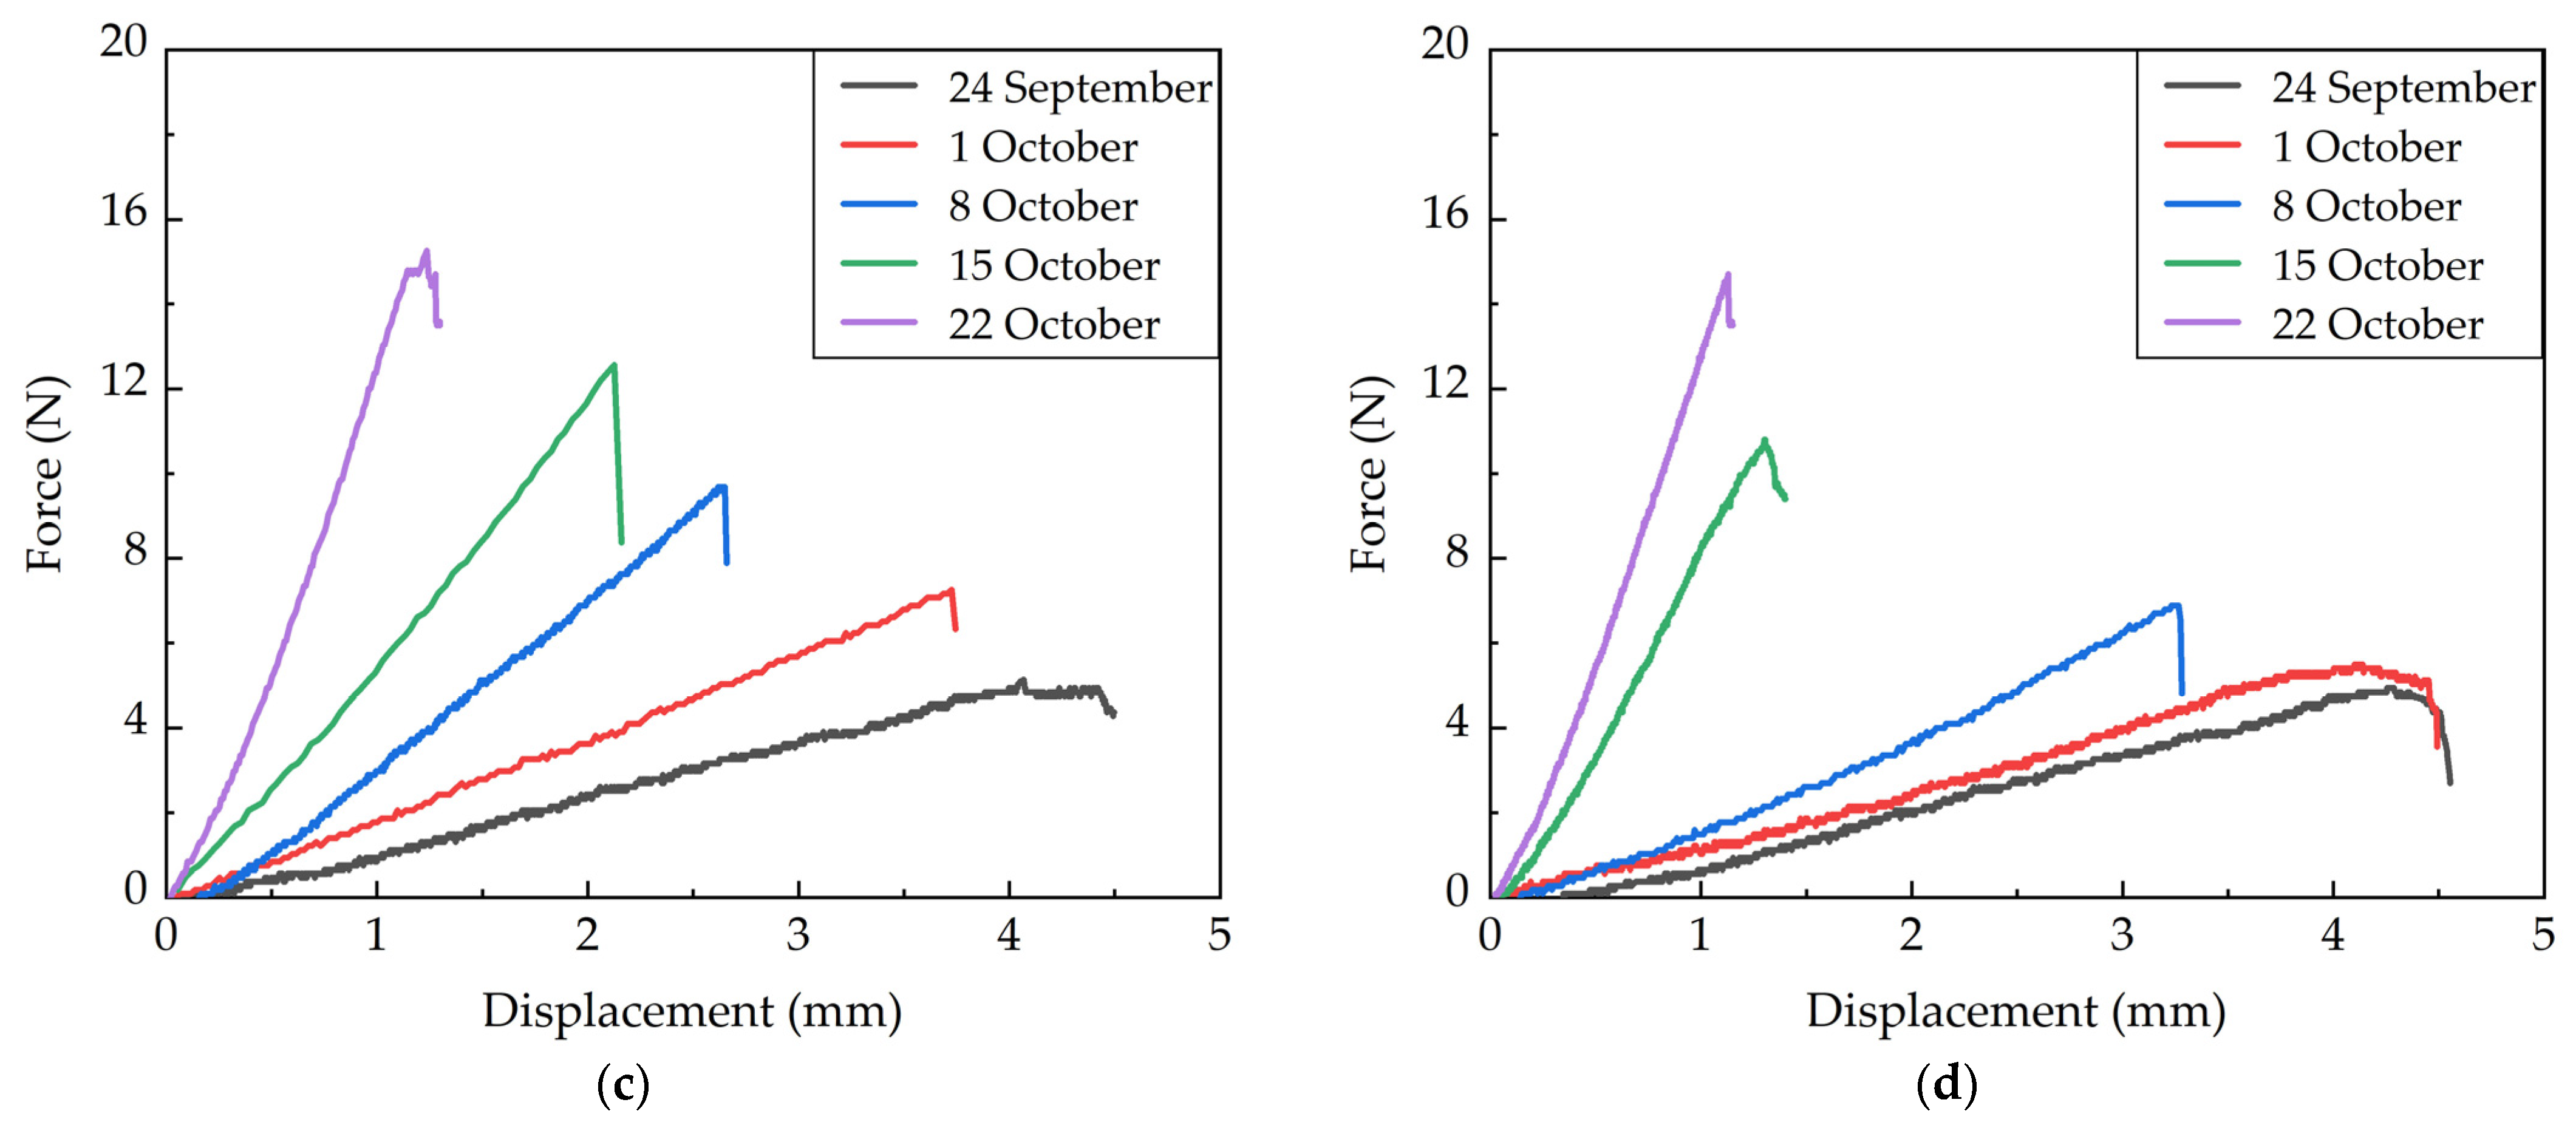
The typical force-displacement curves of the blade tensile test are plotted in
Figure 4, wherein
Figure 4a,b show the longitudinal tensile curves, and
Figure 4c,d show the transverse tensile curves. Although the elongations of blade specimens varied greatly for different harvest days for both corn varieties, the overall variation showed a predictable trend. The force-displacement curves showed that the maximum elongation of leaf blades decreased with a delay of harvest day, while the opposite occurred to the changing tendency of fracture force. This might have been due to the fact that reduced moisture content of the bract caused a decrease in toughness of fiber, and led to a decrease in tensile elongation.
Tensile Properties of the Second to Sixth Leaf Blades on 1 October 2020
The longitudinal and transverse tensile fracture forces of leaf blades showed a decreasing trend from outer to inner layers for both varieties (
Table 4). This was because the cross-sectional area gradually decreased from outer to inner layers when the specimen width was constant. The researches proved that the fracture force has a strong correlation with the cross-sectional area [
27,
28]. However, whether LTT or TTT, the tensile strengths of each layer of leaf blades had little difference except for the second layer, which was larger for both varieties. Moisture content might have been the main reason for this. As shown in
Table 2, the moisture content of the second bract was relatively low. In addition, the fracture energy increased firstly and then decreased from outer to inner layers. According to the Equation (2), we inferred it was the specimen elongation that resulted in the maximum fracture energy occurring in the middle layer. In fact, we did find that the specimen elongation of the middle layer was larger, possibly as a result of moisture content and blade thickness. One-way ANOVA showed that blade thickness had a significant effect on fracture force and fracture energy (
p < 0.01), but the effect on the tensile strength was not obvious (
p > 0.05). Our results agree well with findings of Jacobs et al. [
14] on the fracture properties of seven tropical grasses.
According to the results of the blade tensile test, the load increased for both directions, with an increase of specimen elongation before decreasing abruptly due to specimen fracture. The mean fracture force and tensile strength of the leaf blade in the LTT were about 8.95 times, and the mean fracture energy was about 24.03 times as much as that in the TTT. Therefore, the leaf blade was prone to transverse tearing during the mechanical peeling. The result of field investigation showed that most leaf blades were torn at different degrees in the transverse direction after mechanical peeling, which provides supporting evidence for our experimental result.
3.2.2. Tensile Test Results of Leaf Sheath
As illustrated in
Table 5, bract moisture content had a significant effect on the tensile properties of the leaf sheaths (
p < 0.01), and sheath thickness had a significant effect on the fracture force and fracture energy (
p < 0.01) but no effect on tensile strength (
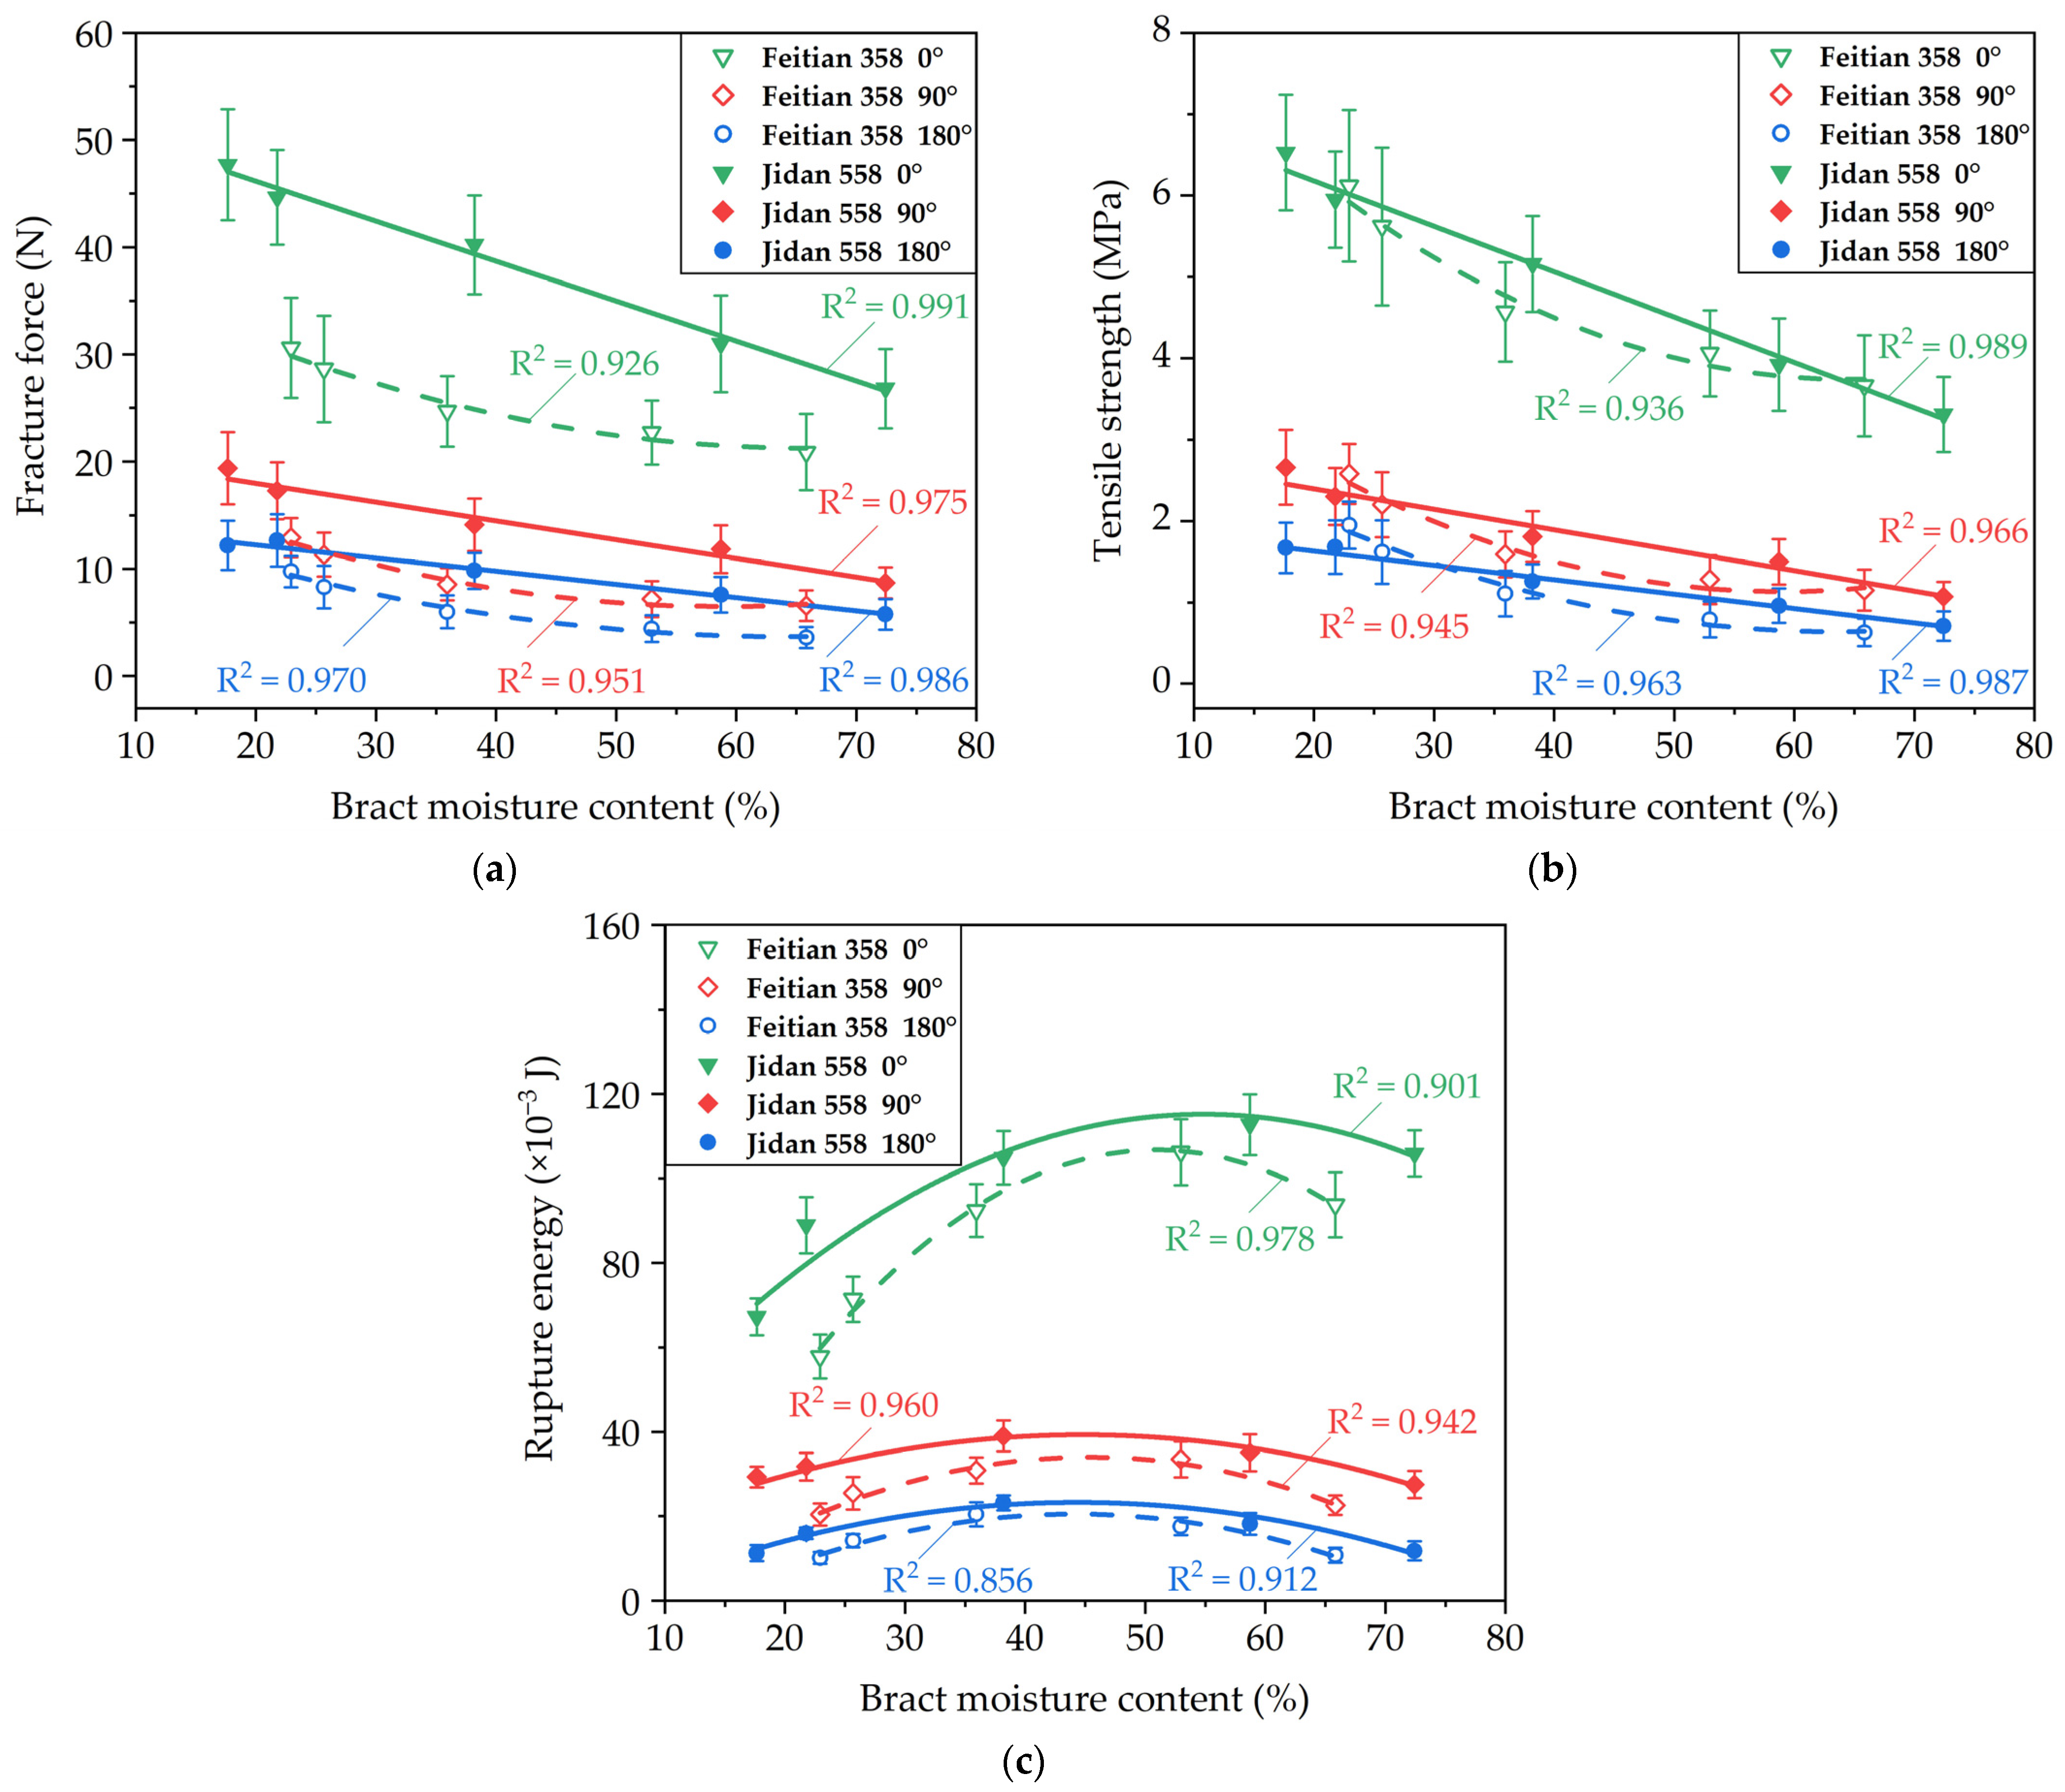
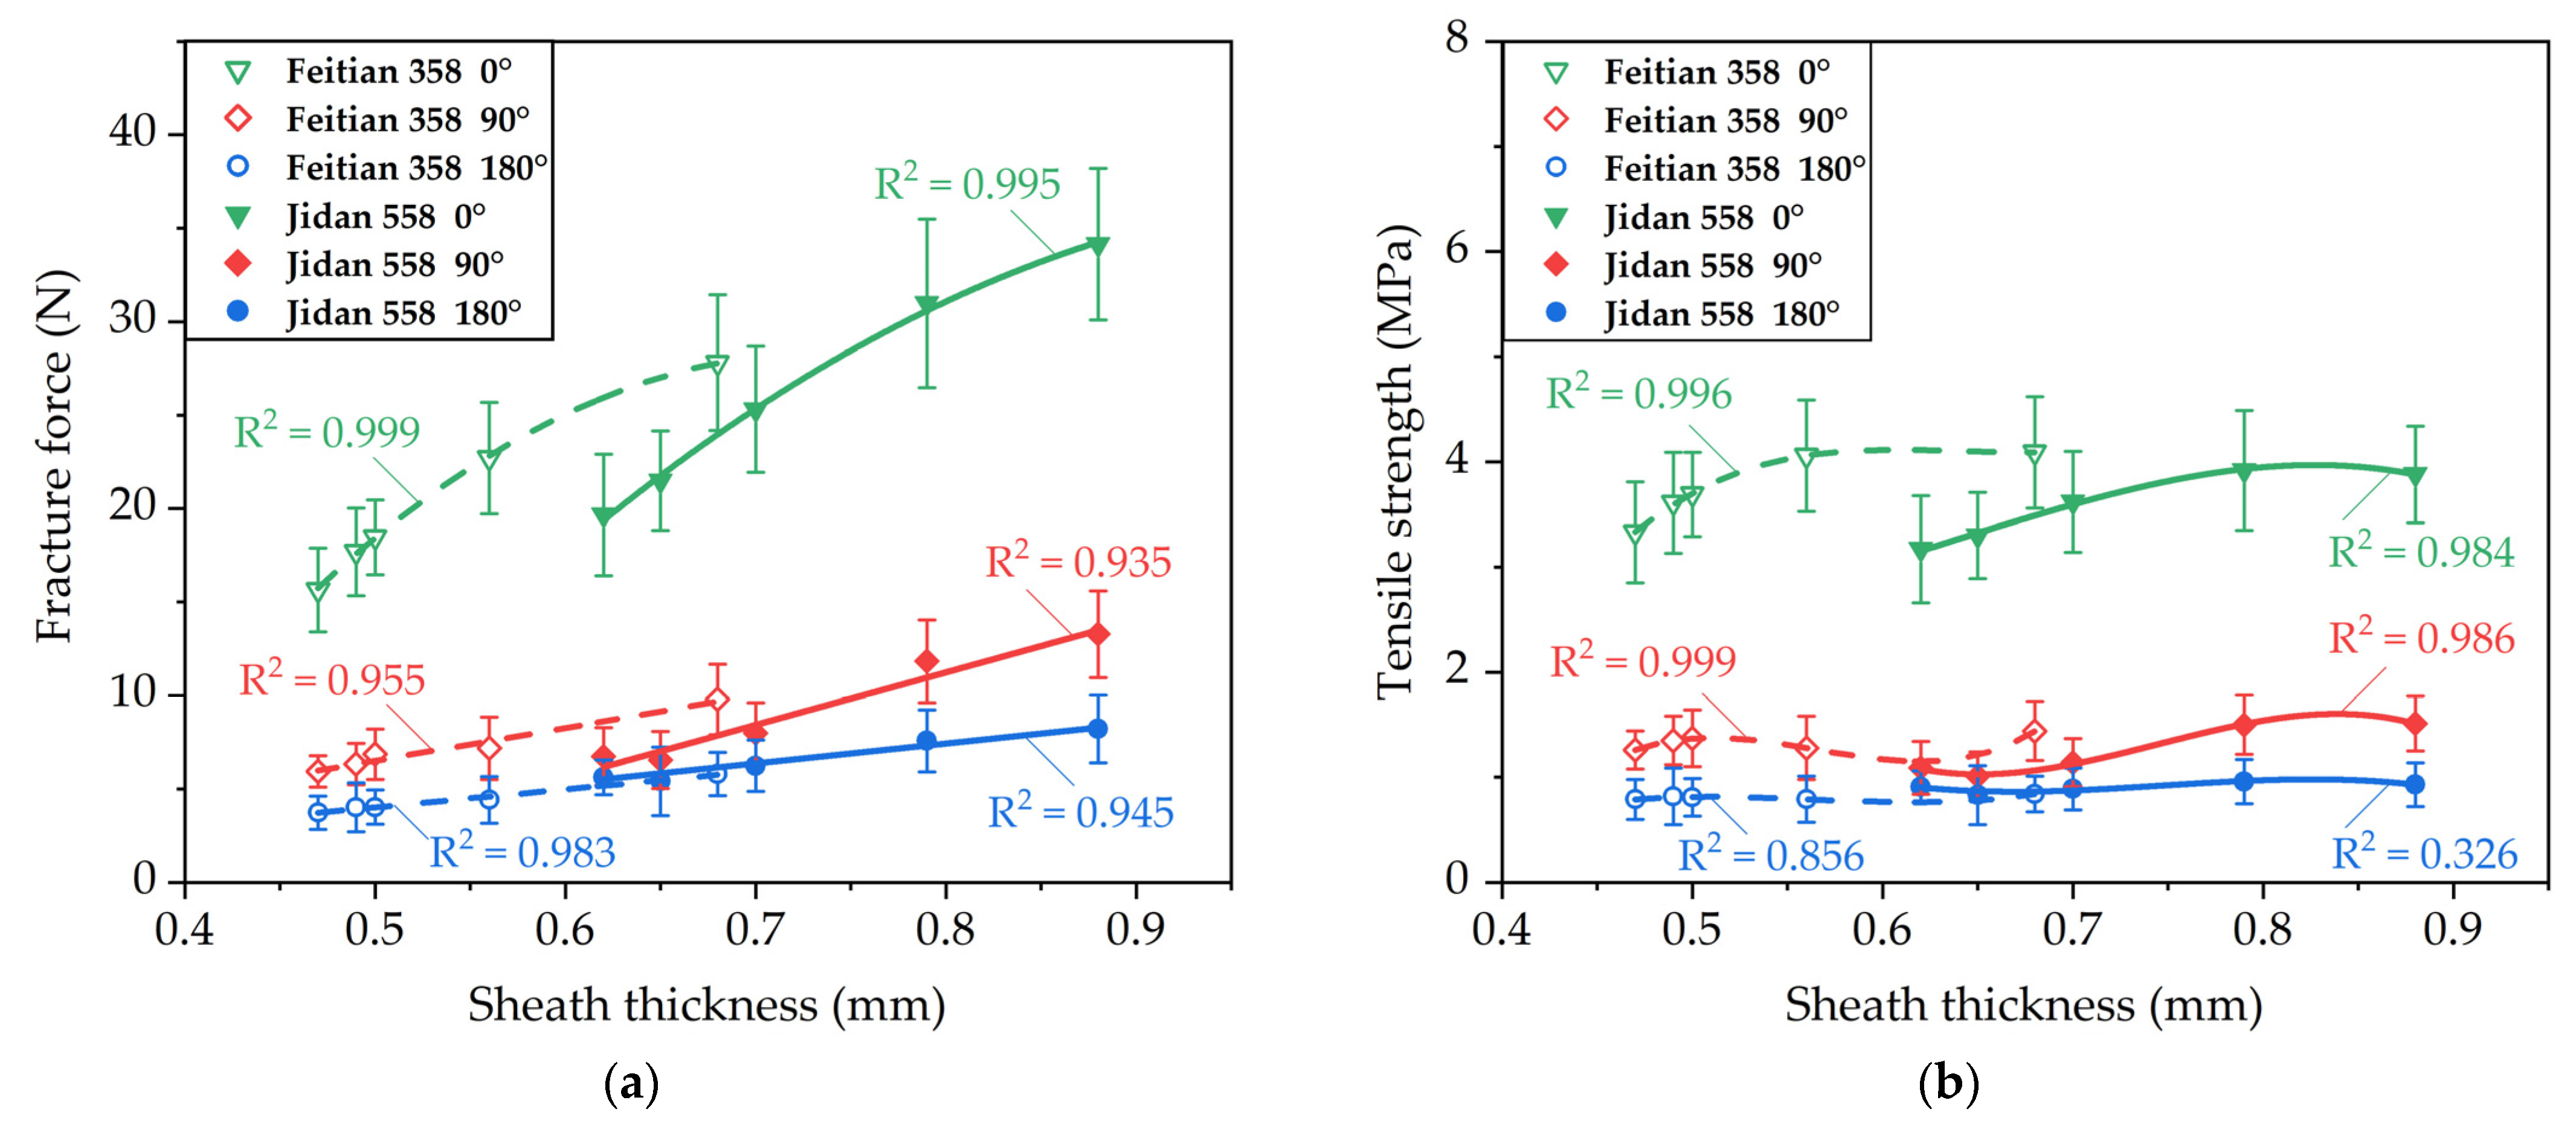
p > 0.05). The results of tensile properties of leaf sheath under three directions, and the regression relationships between these properties and moisture content (or sheath thickness) are presented in
Figure 5 and
Figure 6. In the following paragraphs, the effects of each factor on the tensile properties of leaf sheaths are comprehensively discussed.
Tensile Properties of the Third Leaf Sheath from Different Harvest Days
With the delay of harvest day, the mean fracture force and tensile strength that made the third leaf sheath separate from the peduncle both increased with decreasing moisture content for the two cultivars, while the mean fracture energy increased firstly and then decreased (
Figure 5). The fracture force (or tensile strength) of the leaf sheaths for Feitian 358 and Jidan 558 satisfied the quadratic polynomial relationship (R
2 > 0.926) and linear relationship (R
2 > 0.966) with moisture content, respectively. Meanwhile, the fracture energy of the leaf sheaths for the two cultivars satisfied the quadratic polynomial relationship (R
2 > 0.856) with moisture content. When the leaf sheaths from five harvest days were pulled at angles of 0°, 90°, and 180° (the angles between the pulling force and the natural growth direction of bract), the mean fracture forces required to remove the third leaf sheaths were 31.79, 11.78, and 8.01 N, respectively; the mean tensile strengths were 4.89, 1.82, and 1.23 MPa, respectively; the mean fracture energies were 90.14 × 10
−3, 29.53 × 10
−3, and 15.33 × 10
−3 J, respectively.
Tensile Properties of the Second to Sixth Leaf Sheaths on 1 October 2020
As shown in
Figure 6, the mean fracture force that separated the leaf sheath from the peduncle increased from inner to outer layers for the two cultivars. Sheath thickness had no significant effect on the tensile strength of the leaf sheaths (
p > 0.05), and there was no obvious rule in the variation of tensile strength. The experimental results showed that the mean tensile strength of the outer layer was higher than that of the inner layer when the tensile angles were 0° and 90°, while the mean tensile strength of each layer had little difference when the tensile angle was 180°. The fracture energy increased firstly and then decreased from outer to inner layers. The fracture force of the leaf sheaths for the two cultivars satisfied the quadratic polynomial relationship (0°, R
2 > 0.995) and the linear relationship (90° and 180°, R
2 > 0.935) with sheath thickness. Meanwhile, the mean tensile strength and fracture energy of the leaf sheaths for the two cultivars satisfied the cubic polynomial relationship (R
2 > 0.326) and the quadratic polynomial relationship (R
2 > 0.860) with sheath thickness, respectively. When the leaf sheaths were pulled at angles of 0°, 90°, and 180°, the mean fracture forces required to remove the second to sixth leaf sheaths were 23.40, 8.18, and 5.51 N, respectively; the mean tensile strengths were 3.67, 1.28, and 0.86 MPa, respectively; the mean fracture energies were 93.00 × 10
−3, 29.26 × 10
−3, and 15.30 × 10
−3 J, respectively.
According to the above analysis, among the three directions of sheath tensile test, the tensile property values were largest when pulled the leaf sheaths at an angle of 0°, and smallest when pulling the leaf sheaths at an angle of 180°. Under the same test conditions, the mean fracture force (or tensile strength) of 0° was 2.83 and 4.23 times as much as that of 90° and 180°, respectively. Meanwhile, the mean fracture energy of 0° was about 3.14 and 6.17 times as much as that of 90° and 180°, respectively. Therefore, the fracture force of leaf sheaths could be reduced by increasing the pulling force angle on the bract. It was reported in the literature that the fracture force of sugarcane leaf showed a similar decreasing trend with an increase of pulling force angle [
29].
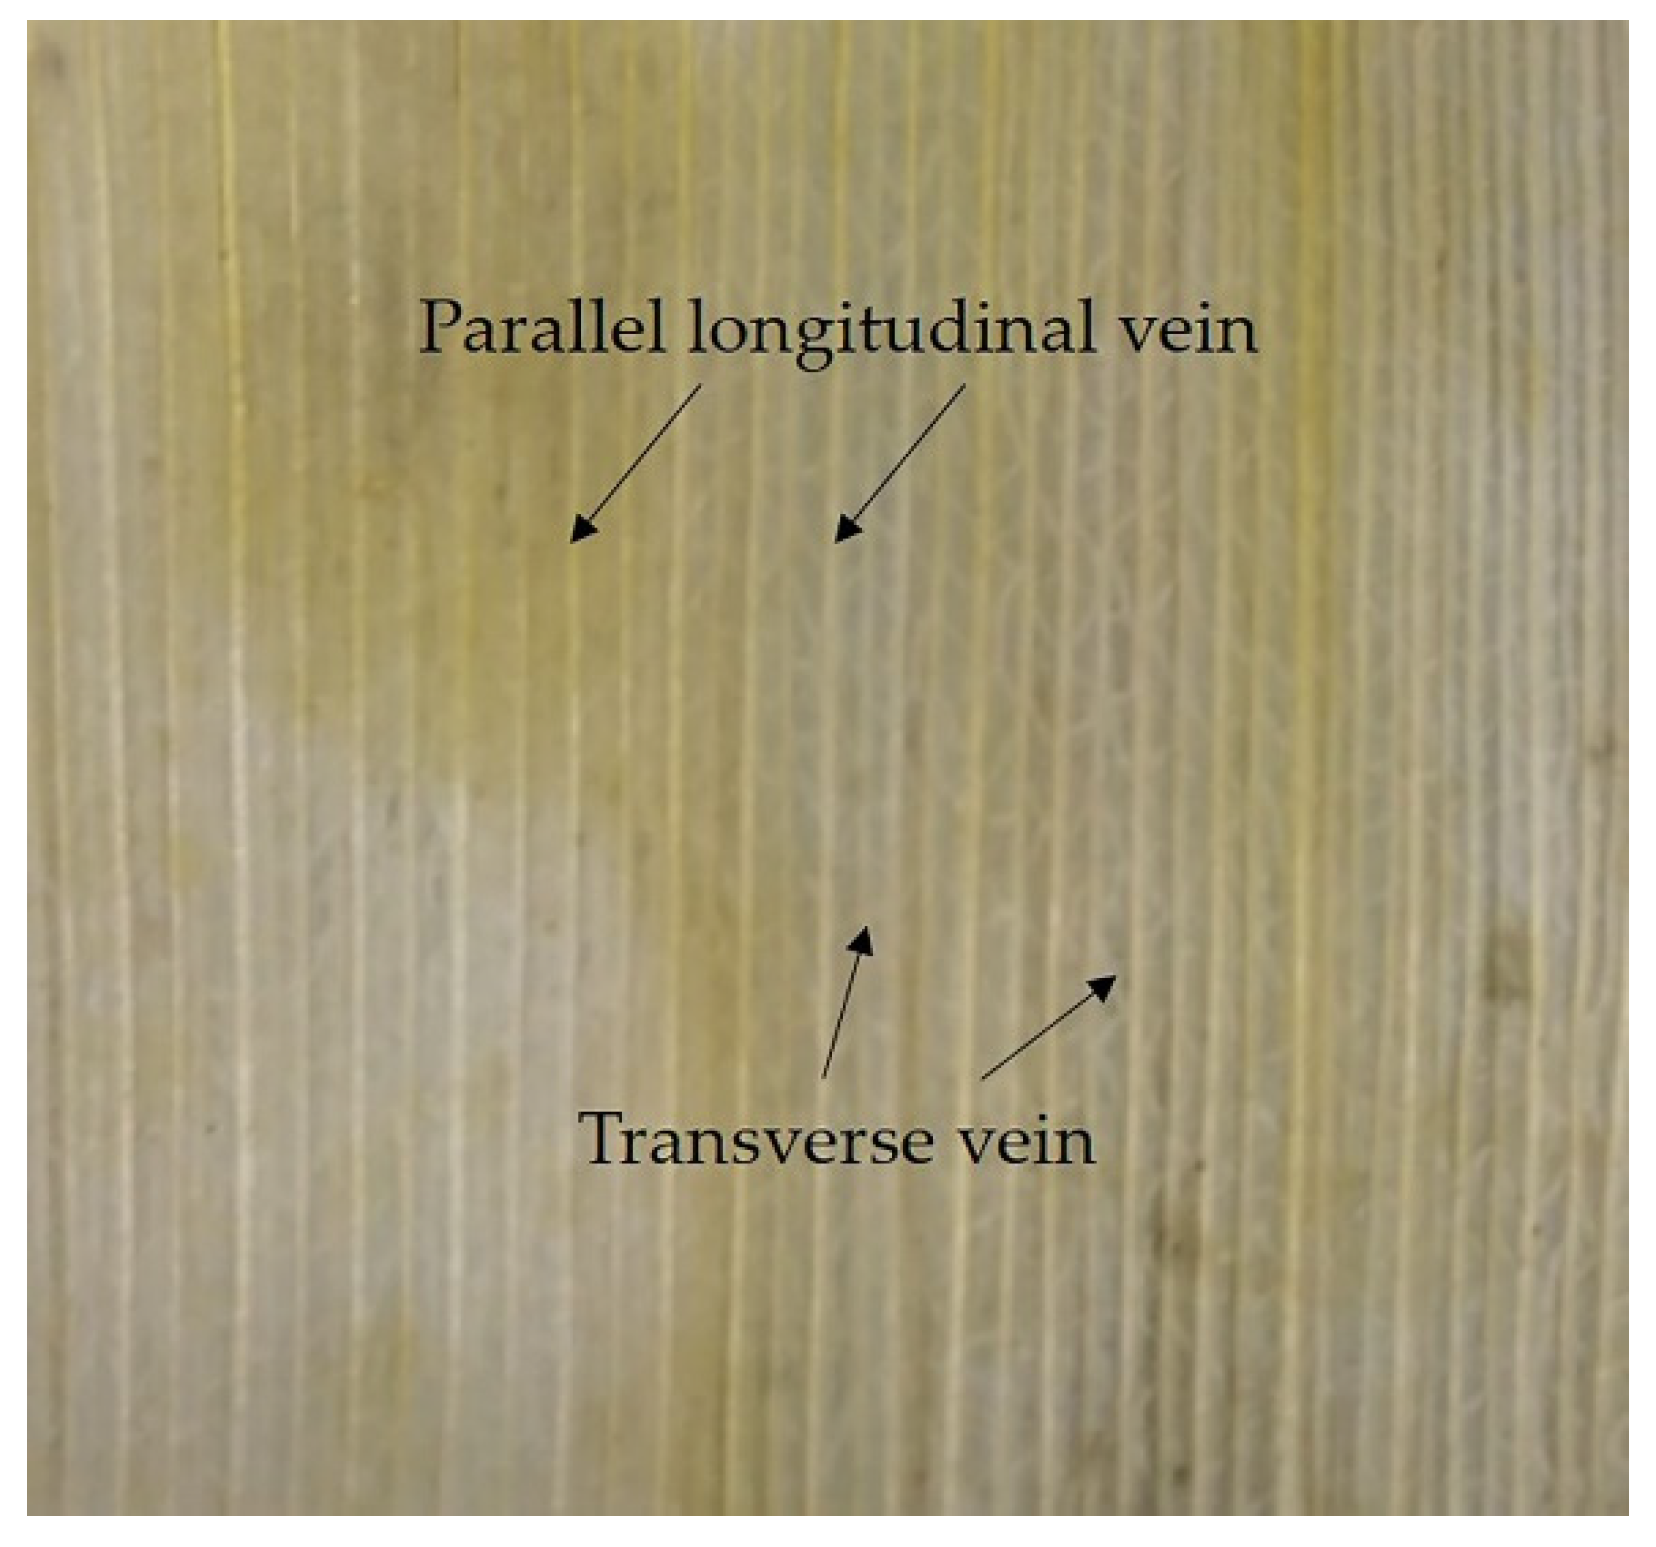
3.2.3. Vein Traits and Fracture Modes of Bract
Figure 7 shows the surface image of a corn bract taken with a digital camera. Corn bract has the pattern of parallel veins typical to monocotyledonous plants. The longitudinal veins arranged in sequence are parallel to each other. There are mesophyll and small transverse veins between two longitudinal veins.
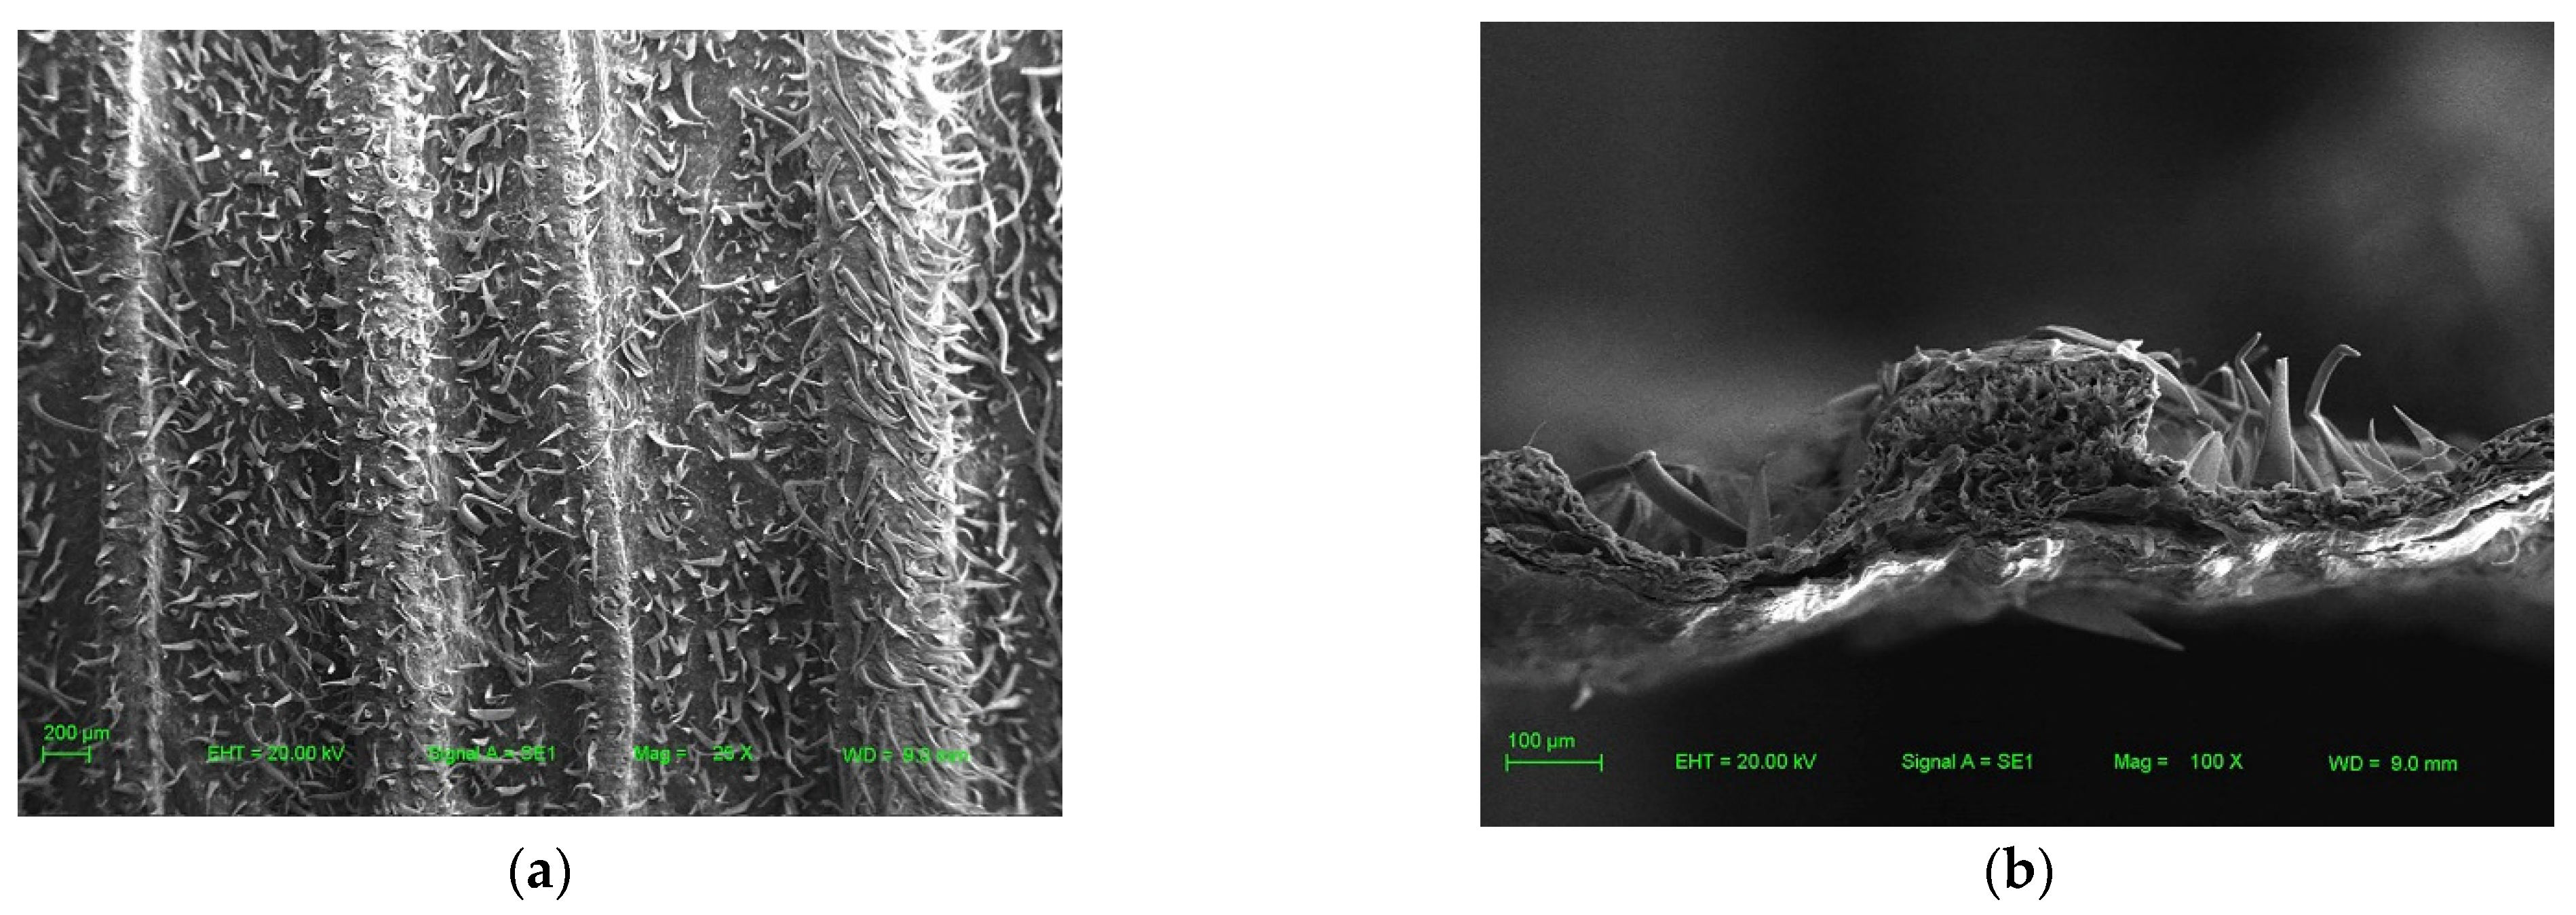
Figure 8 shows the surface and cross-sectional morphology of a corn bract observed using scanning electron microscopy. It could be seen that the longitudinal veins of the corn bract were about two to three times thicker than the surrounding mesophyll tissue. This highlighted the shortcoming of using a single thickness value in the tensile strength formula. The actual tensile strength of the bract was larger than the experimental data. Therefore, the tensile strength of a bract should be set slightly higher when the experimental data are applied to the actual machine parameter setting. Even so, the data still reflected the variation of tensile strength of bracts throughout the harvest period.
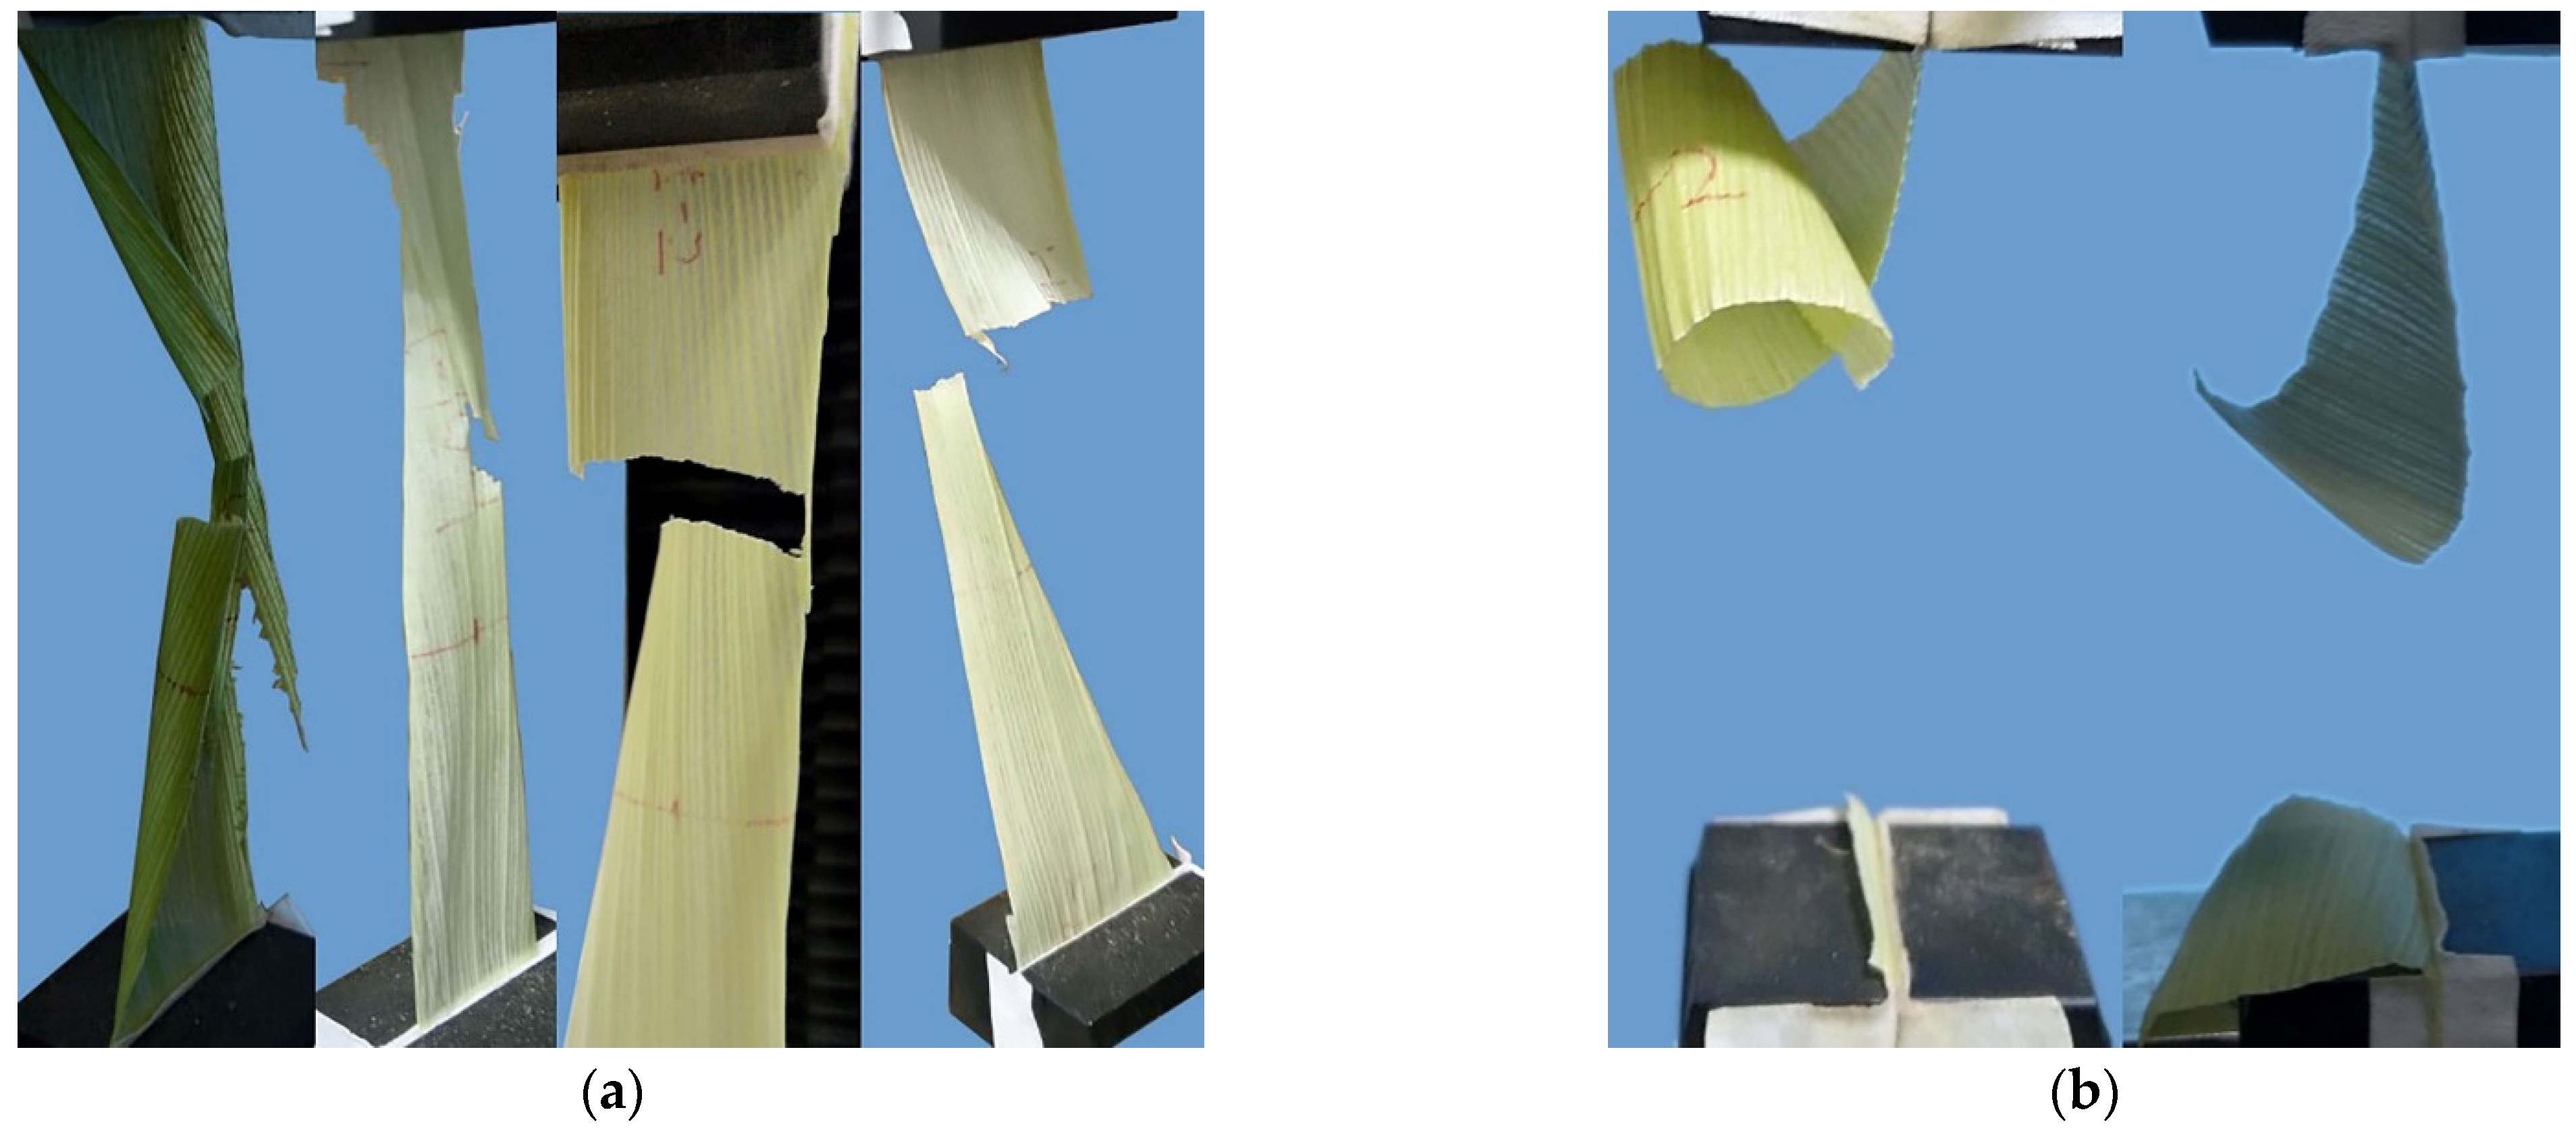
The crack propagation behavior of blade specimens under two vein orientations are presented in
Figure 9. The blade specimen distributed the tensile load on each solid longitudinal vein when the leaf blade was pulled with a force parallel to the longitudinal vein. As the load increased, the stress spread rapidly to the remaining longitudinal veins when a longitudinal vein broke. Once respective fracture strengths of the remaining longitudinal veins were exceeded, catastrophic failure occurred to the whole specimen. In addition, as shown in
Figure 4a,b, the decline curves remained linear after catastrophic failure of the blade specimen. This indicates that most of the longitudinal veins broke almost simultaneously. Additionally, the locations of fracture point of each longitudinal vein were relatively random, and might be far apart due to the different physical properties of each position on the leaf blade. Thus, the fracture shape of the blade specimen might have been an irregular broken line [
13].
It was observed that the fracture shape of the blade specimen was relatively regular in the TTT. Small transverse veins provided little resistance. The fracture mode was the mesophyll tissue torn along the longitudinal vein direction. The crack occurred between two adjacent longitudinal veins, then rapidly propagated until specimen fracture.
When pulling the leaf sheath at an angle of 0°, the fracture mode of leaf sheaths was similar to that of leaf blades in the LTT. The fracture position was usually not at the root of the leaf sheath, but slightly away from the root or somewhere on the leaf blade. This was because, when the pulling force angle was 0°, the mean tensile strength of the leaf sheath was closest to that of the leaf blade in the LTT, especially at the early stage of harvest. When pulling the leaf sheath at an angle of 180°, the tensile strength of the leaf sheath was relatively small, and the bract fractured along the root of the leaf sheath. The abrupt change of fracture behavior might have been caused by the stress of surface fibers transformed from a tensile stress to a bending stress, which resulted in changes to the crack initiation and propagation mechanism [
30].
4. Conclusions
This paper presented the physical and tensile properties of corn bracts for two corn cultivars, Feitian 358 and Jidan 558. The results of physical properties showed that bract dimensions and moisture contents of the two cultivars varied with the changes of harvest day and bract layer.
One-way ANOVA showed that bract moisture content creates a significant effect on the fracture force, tensile strength, and fracture energy, while bract thickness has a significant effect only on the fracture force and fracture energy (p < 0.01). As moisture content decreased, the tensile strengths of the leaf blades and sheaths both increased for the two cultivars. However, the tensile strengths of the leaf blades and sheaths did not noticeably change for different thicknesses.
Vein orientation had a significant effect on the tensile properties of the leaf blades. A crack passed through every longitudinal vein in the LTT, while cracks usually occurred in the mesophyll between two adjacent longitudinal veins in the TTT. The tensile strength of leaf blades in the LTT was about 8.95 times as much as that in the TTT. Therefore, the leaf blades were more prone to transverse tearing during the mechanical peeling.
The tensile properties of leaf sheaths depended on the angle between pulling force and the natural growth direction of the bract. The tensile properties decreased gradually with an increase in pulling force angle. Hence, increasing the pulling force angle exerted by the peeling component on the bract could reduce the peeling power consumption and improve the efficiency and quality of mechanical peeling. Further, a larger pulling force angle could improve the probability of bract fracturing at the root of the leaf sheath, which is beneficial to reducing bract residue on the peeled ear.
In this study, the test specimens were collected from five harvest days from different weeks after physiological maturity of the crop, coinciding with the normal harvest season. The test results could represent an actual material situation from the harvest period.
Author Contributions
Conceptualization, J.F.; methodology, J.F.; validation, Z.L.; investigation, Z.L.; resources, J.F.; writing—original draft preparation, Z.L.; writing—review and editing, J.F.; supervision, X.L.; project administration, J.F.; funding acquisition, J.F. All authors have read and agreed to the published version of the manuscript.
Funding
This research was funded by the thirteenth five-year science and technology project of Jilin Provincial Education Department (No. JJKH20190144KJ).
Institutional Review Board Statement
Not applicable.
Informed Consent Statement
Not applicable.
Data Availability Statement
The data and models presented in this study are available on demand from the first author at (zhenye19@mails.jlu.edu.cn).
Acknowledgments
The authors are grateful for the corn provided by the Agricultural Experimental Base of Jilin University.
Conflicts of Interest
The authors declare no conflict of interest.
References
- Chen, Z. Maize Full Value Harvest Key Technology and Equipment; Science Press: Beijing, China, 2014; pp. 1–181. [Google Scholar]
- Yang, F.; Du, Y.; Fu, Q.; Li, X.; Li, Z.; Mao, E.; Zhu, Z. Design and testing of seed maize ear peeling roller based on Hertz theory. Biosyst. Eng. 2021, 202, 165–178. [Google Scholar] [CrossRef]
- Fu, J.; Yuan, H.K.; Zhao, R.Q.; Chen, Z.; Ren, L.Q. Peeling damage recognition method for corn ear harvest using RGB image. Appl. Sci. 2020, 10, 3371. [Google Scholar] [CrossRef]
- Sotnar, M.; Pospisil, J.; Marecek, J.; Dokukilova, T.; Novotny, V. Influence of the combine harvester parameter settings on harvest losses. Acta Technol. Agric. 2018, 21, 105–108. [Google Scholar] [CrossRef] [Green Version]
- Yang, L.; Cui, T.; Qu, Z.; Li, K.H.; Yin, X.W.; Han, D.D.; Yan, B.X.; Zhao, D.Y.; Zhang, D.X. Development and application of mechanized maize harvesters. Int. J. Agric. Biol. Eng. 2016, 9, 15–28. [Google Scholar] [CrossRef]
- Fu, Q.; Fu, J.; Chen, Z.; Han, L.; Ren, L. Effect of impact parameters and moisture content on kernel loss during corn snapping. Int. Agrophys. 2019, 33, 493–502. [Google Scholar] [CrossRef]
- Magalhães, P.S.G.; Braunbeck, O.A.; Pagnano, N.B. Resistência à compressão e remoção de folhas da cana-de-açúcar visando à colheita mecânica. Eng. Agrícola 2004, 24, 177–184. [Google Scholar] [CrossRef] [Green Version]
- Read, J.; Sanson, G.D. Characterizing sclerophylly: The mechanical properties of a diverse range of leaf types. New Phytol. 2003, 160, 81–99. [Google Scholar] [CrossRef]
- Liu, J.J.; Ye, W.; Zhang, Z.H.; Yu, Z.L.; Ding, H.Y.; Zhang, C.; Liu, S. Vein distribution on the deformation behavior and fracture mechanisms of typical plant leaves by quasi in situ tensile test under a digital microscope. Appl. Bionics Biomech. 2020, 2020, 8792143. [Google Scholar] [CrossRef]
- Kohyama, K.; Takada, A.; Sakurai, N.; Hayakawa, F.; Yoshiaki, H. Tensile test of cabbage leaves for quality evaluation of shredded cabbage. Food Sci. Technol. Res. 2008, 14, 337–344. [Google Scholar] [CrossRef]
- Toole, G.A.; Parker, M.L.; Smith, A.C.; Waldron, K.W. Mechanical properties of lettuce. J. Mater. Sci. 2000, 35, 3553–3559. [Google Scholar] [CrossRef]
- Kneebone, W.R. Tensile strength variations in leaves of weeping lovegrass (Eragrostis curvula (schrad.) nees.) and certain other grasses. Agron. J. 1960, 52, 539–542. [Google Scholar] [CrossRef]
- Tang, Z.; Li, Y.; Zhang, B.; Wang, M.; Li, Y. Controlling rice leaf breaking force by temperature and moisture content to reduce breakage. Agronomy 2020, 10, 628. [Google Scholar] [CrossRef]
- Jacobs, A.A.; Scheper, J.A.; Benvenutti, M.A.; Gordon, I.J.; Poppi, D.P.; Elgersma, A. Tensile fracture properties of seven tropical grasses at different phenological stages. Grass Forage Sci. 2011, 66, 551–559. [Google Scholar] [CrossRef]
- Bai, Y.; Yang, Z.P.; Guo, K.Q.; Yang, C.C. Researches on the strength performance of the corn bract. J. Agric. Mech. Res. 2008, 4, 143–145. [Google Scholar]
- Zhao, C.S.; Xu, L.M.; Liu, J.; Zhang, D.X. Study on the corn bract mechanical properties-based on the skinning institution of corn harvester. J. Agric. Mech. Res. 2011, 33, 100–105. [Google Scholar]
- El-Shemy, H.A.; Nishimura, T.; Fujita, K. Characterization and localization of a novel protein (HFN 40) in maize genotypes without husk leaf blades. Biol. Plant. 2001, 44, 623–625. [Google Scholar] [CrossRef]
- Xie, F.X.; Song, J.; Huo, H.P.; Hou, X.X. Experiment and mechanical characteristics on bract peeling of corn harvester. J. Agric. Mech. Res. 2018, 40, 129–133. [Google Scholar]
- Wang, S.J.; Ren, L.Q.; Liu, Y.; Han, Z.W.; Yang, Y. Mechanical characteristics of typical plant leaves. J. Bionic Eng. 2010, 7, 294–300. [Google Scholar] [CrossRef]
- Mou, X.; Liu, Q.; Ou, Y.; Wang, M.; Song, J. Mechanical properties of the leaf sheath of sugarcane. Trans. Asabe 2013, 56, 801–812. [Google Scholar]
- Vincent, J.F.V. The influence of water content on the stiffness and fracture properties of grass. Grass Forage Sci. 2006, 38, 107–114. [Google Scholar] [CrossRef]
- Yu, M.; Igathinathane, C.; Hendrickson, J.; Sanderson, M.; Liebig, M. Mechanical shear and tensile properties of selected biomass stems. Trans. Asabe 2014, 57, 1231–1242. [Google Scholar]
- Su, Y.; Cui, T.; Zhang, D.; Xia, G.; Gao, X.; He, X.; Xu, Y. Effects of shape feature on compression characteristics and crack rules of maize kernel. J. Food Process. Eng. 2020, 44, e14307. [Google Scholar] [CrossRef]
- Demirel, C.; Kabutey, A.; Herak, D.; Gurdil, G.A.K. Numerical estimation of deformation energy of selected bulk oilseeds in compression loading. IOP Conf. Ser. Mater. Sci. Eng. 2017, 237, 1–5. [Google Scholar] [CrossRef]
- Mandang, T.; Sinambela, R.; Pandianuraga, N.R. Physical and mechanical characteristics of oil palm leaf and fruits bunch stalks for bio-mulching. IOP Conf. Ser. Earth Environ. Sci. 2018, 196, 012015. [Google Scholar] [CrossRef]
- Balsamo, R.A.; Willigen, C.V.; Bauer, A.M.; Farrant, J. Drought tolerance of selected Eragrostis species correlates with leaf tensile properties. Ann. Bot. 2006, 97, 985–991. [Google Scholar] [CrossRef] [PubMed] [Green Version]
- Benvenutti, M.A.; Gordon, I.J.; Poppi, D.P.; Crowther, R.; Spinks, W.; Moreno, F.C. The horizontal barrier effect of stems on the foraging behaviour of cattle grazing five tropical grasses. Livest. Sci. 2009, 126, 229–238. [Google Scholar] [CrossRef]
- Zhang, J.M.; Hongo, A.; Akimoto, M. Physical strength and its relation to leaf anatomical characteristics of nine forage grasses. Aust. J. Bot. 2004, 52, 799–804. [Google Scholar] [CrossRef]
- Miyabe, Y.; Abe, M. Fundamental studies on the development of a leaf-stripping-machine for sugarcane: 1. on the pulling-force of a leaf-detachment. Bull. Fac. Agric. Kagoshima Univ. 1976, 4, 1–5. [Google Scholar]
- Fu, Q.; Fu, J.; Chen, Z.; Zhang, L.; Ren, L. Influence of different corn ear position and orientation and water content on fracture mechanics of corn peduncle. Trans. Chin. Soc. Agric. Eng. 2019, 35, 60–69. [Google Scholar] [CrossRef]
| Publisher’s Note: MDPI stays neutral with regard to jurisdictional claims in published maps and institutional affiliations. |
© 2021 by the authors. Licensee MDPI, Basel, Switzerland. This article is an open access article distributed under the terms and conditions of the Creative Commons Attribution (CC BY) license (https://creativecommons.org/licenses/by/4.0/).

