Article

Energy Efficiency, Energy Conservation and Determinants in the Agricultural Sector in Emerging Economies

1
School of Economics, Shandong University of Finance and Economics, Jinan 250000, China
2
Faculty of Economics, Chiang Mai University, Chiang Mai 50200, Thailand
3
School of Foreign Languages for Business, Guangxi University of Finance and Economics, Nanning 530003, China
4
Plymouth Business School, University of Plymouth, Drake Circus, Plymouth PL4 8AA, UK
*
Author to whom correspondence should be addressed.
Agriculture 2021, 11(8), 773; https://doi.org/10.3390/agriculture11080773
Submission received: 23 June 2021 / Revised: 3 August 2021 / Accepted: 10 August 2021 / Published: 13 August 2021

Abstract

:
Improving energy efficiency and conservation is integral to sustain agricultural growth in emerging economies. This paper investigates the energy efficiency and energy-saving potential of the agricultural sector of 27 emerging economies using a stochastic frontier approach and Shephard distance function, and their determinants are examined using the Tobit quantile regression model. Results revealed that energy efficiency in the agricultural sector fluctuated during the period from 1998 to 2017. The median average energy efficiency was estimated at 0.74, and the cumulative energy-saving potential was estimated at 542.80 million tons of oil equivalent (Mtoe), which can be achieved by eliminating energy inefficiency alone. Differences exist in energy efficiency and energy-saving potential across continents, with higher potential in Asia and lower potential in Europe. Economic structure, urbanization and GDP per capita have negative influences on agricultural energy efficiency. Energy mix and pesticide use are significant drivers of energy efficiency, while the ratio of agricultural land that has varied influences different quantiles. Policy implications include optimization of the energy mix, economic structure and pesticide use.

1. Introduction

Energy efficiency plays an important role in sustainable development from the perspective of natural resource use and greenhouse gas emissions [1]. Due to rapid population growth and economic development, energy consumption has been increasing continuously [2]. Agriculture contributes about 14% of global greenhouse gas emissions [3]. The development of agricultural production demands more energy to operate equipment and machinery, support the production process and produce chemicals and fertilizers. Such an increasing consumption demand for energy and associated environmental degradation are prominent due to the lack of environmental sustainability existing in the agricultural sector [4]. The situation calls for energy conservation by using less energy input. Thus, energy efficiency improvement and energy saving are conducive to achieving environmentally friendly economic development [5].
Agriculture is a crucial sector for all economies. Owing to the modernization of the agricultural sector, both the quality and quantity of agricultural production have improved [6,7]. Agricultural production requires various inputs, such as land, labor, capital and technology. With the modernization of agriculture, the use of commercial energy for agriculture continues to rise, and it is important to ensure that energy used in agriculture is not wasteful or inefficient [8,9]. Improvement in the energy efficiency of the agricultural sector has attracted global attention as the key driver for sustainable development and has become one of the best strategies to reduce commercial energy demand and combat climate change [10]. Many evaluations of energy efficiency have been carried out for various cropping systems at the farm level, e.g., food grains, fruits and vegetables, etc. [11,12,13]. A few studies on agricultural energy efficiency investigations were also conducted at the regional and/or national level with varied estimates [6,14]. Keeping in pace with economic development, energy efficiency in agriculture also changed but not to the extent desired, thereby leaving scope for further improvement [15,16]. For example, energy efficiency in maize and wheat farming was estimated with environmental constraints in Bangladesh [17,18]. Wysokiński et al. [19] found that with socioeconomic development in European Union (EU) countries, agricultural energy efficiency experienced sustained growth.
Emerging economies are relatively rapid-growth developing countries driven by economic liberalization and becoming more engaged with global markets [20]. There is no commonly agreed parameter by which to classify countries as emerging economies, but some similar characteristics can be identified. We consider emerging economies as countries or regions with certain industrial foundations, a certain degree of standardized commercial market mechanisms and partial conditions and the potential to become mature market areas. Most of them are traditional agriculture-based countries. The agricultural energy efficiency in emerging economies is a significant research topic for a number of reasons. First, the economic growth of many emerging economies is increasing rapidly with a corresponding increasing demand for energy. According to the International Energy Agency, developing economies will contribute to 74% of the increase in global energy demand. Furthermore, the determinants of agricultural energy efficiency are important to gain a better understanding of how to alter the energy demand in emerging economies in the future and how to control global greenhouse gas emissions. Potentially, the need to improve emerging countries’ agricultural energy efficiency is required to achieve their goal of agricultural sustainability.
Figure 1 shows a substantial increase in energy use in the agricultural sector of emerging economies from 2003 to 2017. In 2003, commercial energy use in the agricultural sector was 88,553 kilotons of oil equivalent (ktoe), which increased by 1.44 times to 122,418 ktoe in 2017. However, the energy use per unit of agricultural GDP fluctuated around 2 tons of oil equivalent, which reveals that agricultural energy efficiency should be improved and carbon reduction targets possibly cannot be achieved with the rapid development of the agricultural sector. In fact, energy efficiency in some emerging economies has declined [21], and for others, it is rising slowly but is not sufficient [14].
Owing to the stronger economic development in rural areas of emerging economies, energy use is expected to increase further in the future [14]. Unlike developed countries, the energy mix in the agricultural sector of emerging economies mainly relies on traditional energy, namely oil and coal [22]. Thus, improving energy efficiency in the agricultural sector and devising policies to achieve such a goal are the key factors in global greenhouse gas mitigation. Although emerging economies have made good progress in agriculture, they still face many problems, such as increasing demands for agricultural products and a limited supply of arable land [23]. To some extent, these problems can be resolved, but commercial energy consumption and agricultural expenditures are increasing continuously [6]. The problem is that additional use of energy may not maximize agricultural production and profit. Therefore, it is crucial to improve energy efficiency and establish energy-saving policies for the agricultural sector of emerging economies. Strategic energy planning should be able to lay a solid foundation for the sustainable development of emerging economies and form an integral part of the agricultural sector. Agricultural energy efficiency is closely related to the ways of understanding energy, the future funding of projects and policies to respond to climate change. The energy efficiency measures taken by emerging economies can help to address their pressing priorities, including economic development, poverty reduction and access to basic services.
Many indicators are used to evaluate energy efficiency. Some have defined this as the production of similar amounts of desirable output with less energy input and undesirable output [24,25], known as “partial factor energy efficiency” and usually calculated as energy consumption over gross domestic product (GDP) at the macro level, or energy consumption over gross value added in a sector [6]. However, this measure does not take into account the substitution and complementary effects of other inputs, such as labor and capital, so it may exaggerate the role of energy in production [14]. To overcome this drawback, Hu and Wang [26] proposed “total factor energy efficiency (TFEE)”, which is defined as a proportion of minimum to actual energy input in a multifactor framework. TFEE introduces a comprehensive view of energy technical efficiency and can better reflect production reality.
Two methods mainly used in efficiency estimation are based on the efficiency frontier: data envelopment analysis (DEA) and stochastic frontier analysis (SFA). DEA, a nonparametric approach, cannot separate the influence of statistical noise or random error from inefficiency, easily influenced by data quality, and therefore causes downward or upward bias in efficiency estimation [27]. In contrast, SFA, a parametric approach, considers deviation from the technological frontier as a combination of both random error and inefficiency and is able to isolate inefficiency from statistical noise in estimation [28]. Moreover, Coelli [29] recommended the stochastic frontier method for use in most agricultural applications and also pointed out that the stochastic frontier model has the added advantage of the ability to conduct statistical tests of hypotheses regarding the production structure and the degree of inefficiency. Therefore, the stochastic frontier model is more suitable than DEA in this study. The distance function describes alternative representations of production technologies, with more empirical applications in the field of efficiency analysis. This paper uses SFA and the Shephard energy distance function to investigate energy efficiency, energy-saving potential and factors influencing energy efficiency in the agricultural sector of emerging economies using Tobit quantile regression.
With regard to the factors affecting agricultural energy efficiency, studies first suggested that integrated farming technological progress has improved energy efficiency by reducing energy input without affecting output [30]. Technologies at the farm level can promote the optimization of energy utilization in rural areas [22,31]. Second, many studies found that agro-environmental policy can affect agricultural energy efficiency, and stricter environmental standards can lead to lower agricultural energy efficiency [15]. Third, the impact of industrial agglomeration on energy efficiency has received more attention. Some studies proposed that industrial agglomeration improves the scale and distributional efficiencies of energy, thereby contributing to increasing energy efficiency [32,33].
The specific objectives of this study are: (i) to estimate agricultural energy efficiency and energy-saving potential of emerging economies over time; (ii) to identify factors influencing energy efficiency changes; and (iii) to explore strategies to improve the energy-saving potential of emerging economies.
The contributions of this paper are as follows. First, most studies on energy efficiency in the agricultural sector paid attention to farm and/or national levels, and macroregional attention is largely centered on EU countries, with very few considering emerging economies [13,14,34]. Agriculture is an essential part of the effective development strategy in emerging economies, which undertake the tasks of economic development and greenhouse gas emission reduction simultaneously. This study adds to the literature by explicitly providing an analysis of transboundary characteristics on energy efficiency and energy conservation for emerging economies. Second, this paper is the first to use an SFA model based on the distance function with Tobit quantile regression to study the determinants of energy efficiency in the agricultural sector of emerging economies. It helps to analyze influencing factors of various endowments and production resources in different emerging economies.
The remainder of this paper is organized as follows: Section 2 describes the methodology, Section 3 presents an overview of the model variables, Section 4 reports the results of the model, and Section 5 concludes and proposes policy recommendations.

2. Methodology

In this section, we provide an introduction to SFA based on the distance function with Tobit quantile regression. The Shephard energy distance function presents the distance of the actual production from the optimum energy input [35]. Tobit quantile regression provides an efficient way to deal with left-censored data and can be viewed as a linear quantile regression model, where the data on the dependent variable are incompletely observed [36]. In this context, Tobit quantile regression is used.
According to Zhou et al. [37], all feasible inputs and the output are included in a production possibility set (T). In this paper, the three input factors are agricultural labor (L), fixed capital in agriculture (K) and commercial energy in agriculture (E), while the single output is gross value added in agriculture (Y). T can be expressed as:
T = L ,   K ,   E ,   Y :   Input   L ,   K ,   E   can   provide   Y
The Shephard energy distance function with respect to the production frontier is defined as:
D E K ,   L ,   E ,   Y = sup α : K ,   L ,   E / α ,   Y T  
The translog functional specification of the Shephard energy distance function is given by:
l n D E E i t ,   L i t ,   K i t ,   Y i t = β 0 +   β E l n E i t + β L l n L i t + β K l n K i t + β Y l n Y i t + β T T + β E L l n E i t l n L i t + β E K l n E i t l n K i t + β E Y l n E i t l n Y i t + β K L l n K i t l n L i t + β Y L l n Y i t l n L i t + β K Y l n K i t l n Y i t + β E T T l n E i t + β L T T l n L i t + β K T T l n K i t + β Y T T l n Y i t + 1 2 β E E ( l n E i t ) 2   + 1 2 β L L ( l n L i t ) 2 + 1 2 β K K ( l n K i t ) 2 + 1 2 β Y Y ( l n Y i t ) 2 + 1 2 β T T ( T ) 2 + V i t
where β 0 is the intercept, β with the subscript letter is the parameter of corresponding explanatory variable and V i t is a normally distributed random variable, which is the statistical noise component. Equation (3) can be transformed in terms of energy input because of the linear homogeneity of the Shephard distance function:
l n D E E i t ,   L i t ,   K i t ,   Y i t = l n E i t +   l n D E 1 ,   L i t ,   K i t ,   Y i t = l n E i t + β 0 +   β L l n L i t + β K l n K i t + β Y l n Y i t + β T T + β K L l n K i t l n L i t + β Y L l n Y i t l n L i t + β K Y l n K i t l n Y i t + β L T T l n L i t + β K T T l n K i t + β Y T T l n Y i t + 1 2 β L L ( l n L i t ) 2 + 1 2 β K K ( l n K i t ) 2 + 1 2 β Y Y ( l n Y i t ) 2 + 1 2 β T T ( T ) 2 + V i t
We can then obtain Equation (5) after transposition:
l n E i t   = β 0 +   β L l n L i t + β K l n K i t + β Y l n Y i t + β T T + β K L l n K i t l n L i t + β Y L l n Y i t l n L i t + β K Y l n K i t l n Y i t + β L T T l n L i t + β K T T l n K i t + β Y T T l n Y i t + 1 2 β L L ( l n L i t ) 2 + 1 2 β K K ( l n K i t ) 2 + 1 2 β Y Y ( l n Y i t ) 2 + 1 2 β T T ( T ) 2 + V i t U i t
where U i t = l n D E E i t ,   L i t ,   K i t ,   Y i t is a non-negative variable, which captures energy inefficiency [38].
Additionally, the time trend variable T, which denotes technological change over time, a dummy variable of agricultural energy input and its interaction terms, is also taken into account to check the necessity of the division of energy inefficiency. We can express H = 1 for high-level energy input and M = 1 for middle-level energy input.
Therefore, we modeled the frontier as:
l n E i t   = β 0 +   β L l n L i t + β K l n K i t + β Y l n Y i t + β T T + β K L l n K i t l n L i t + β Y L l n Y i t l n L i t + β K Y l n K i t l n Y i t + β L T T l n L i t + β K T T l n K i t + β Y T T l n Y i t + 1 2 β L L ( l n L i t ) 2 + 1 2 β K K ( l n K i t ) 2 + 1 2 β Y Y ( l n Y i t ) 2 + 1 2 β T T ( T ) 2 + β H H i t + β M M i t +   β H Y H l n Y i t + β H K H l n K i t + β H L H l n L i t + β M Y M l n Y i t + β M K M l n K i t + β M L M l n L i t + V i t U i t
We used two-stage SFA to estimate the agricultural energy efficiency of emerging economies based on the maximum likelihood estimation by Equation (6). The agricultural energy efficiency (AEE) at time t can be measured through:
A E E i t = E [ exp U i t | e i t ]
(ii) The energy-saving potential (ESP) can be obtained:
E S P i t = E i t 1 A E E i t
and the determinants of estimated energy efficiency by using the following Tobit regression: y i t = A E E i t , if 0 < A E E i t < 1 , otherwise y i t = 0 . Consider the p-th quantile regression model for A E E i t :
A E E i t = x i t β p + ε p i
where x is a vector of inefficiency factors, and ε is a random disturbance term with mean zero and variance σ 2 . The Tobit quantile regression that estimates β ^ p is expressed as
β ^ p = a r g m i n A E E i t x i β p p A E E i t x i t β p + A E E i t < x i β p 1 p A E E i t x i t β p
In this study, SFA is estimated by using LIMDEP, and Tobit quantile regression is conducted using the Package “Brq” in R.

3. Variables

We selected 27 countries (Argentina, Brazil, Bulgaria, China, Colombia, Czech, Dominican Rep., Estonia, Greece, Hungary, India, Indonesia, Latvia, Lithuania, Mexico, Pakistan, Peru, Poland, Romania, Russia, Slovakia, South Korea, Thailand, Turkey, Ukraine, Uruguay, Vietnam), which are classified as emerging economies, based on data availability for the period from 1998 to 2017. We used agricultural value added (in millions of 2010 USD) as output and the consumption of agricultural fixed capital (in millions of 2010 USD) as capital and the labor force (in number of persons) as labor input, collected from the FAOSTAT database (http://www.fao.org/faostat/en accessed on 2 August 2020). There are some studies in the literature regarding energy efficiency that used the baseline year 2010 for GDP and capital [39,40,41], as did we. We used the total energy consumption for agriculture, forestry and fishing measured in toe as energy input from the International Energy Agency (https://www.iea.org accessed on 2 August 2020). All these four variables divided by agricultural land area (square kilometer) were mean corrected and then logged using a natural logarithm.
Based on the literature and justification thereof, many variables were considered, such as urbanization, GDP per capita, share of agricultural sector in GDP, energy mix, pesticides, fertilizers, agricultural land, farmers’ age and educational level [19,42,43,44]. Subject to data availability, the following variables were selected as determinants of energy inefficiency: (i) Urbanization (upop): Defined as the proportion of urban population to total population. Economic development may imply more energy-intensive production due to rising food demands such as dairy products and meat [31]. Rapid urbanization has a negative effect on energy efficiency [45]. (ii) GDP per capita (gdppc): High levels of GDP per capita may improve energy-saving awareness and promote technological innovations and application, which are the key factors to improve energy efficiency [46]. The energy efficiency of agriculture is rising in successful economies [47]. (iii) Economic structure (ecostru): Defined as the share of the agricultural sector in GDP. A higher share indicates more use of energy in agriculture [14]. Higher agricultural energy efficiency will enable to increase output with the same level of energy input. (iv) Energy mix (enemix): Various types of energy have different efficiencies. Compared to other energy products, the efficiency of coal is relatively lower than oil [48], so we used the proportion of oil consumption to total energy use in agriculture. (v) Pesticide (pesti): Quantities of pesticides used in the agricultural sector for crop protection. Pesticides as indirect inputs present significant energy-saving potential at the level of agricultural production, to maintain and improve soil quality [49]. (vi) Agricultural land (land): Energy use in agriculture increases sharply due to overpopulation and a limited supply of agricultural land [50]. Economies with limited natural resources mainly apply land-saving techniques to increase agricultural output per unit of land [14]. Therefore, we used the proportion of agricultural land in total land to assess energy efficiency. upop, gdppc, ecostru and land are collected from the WDI (https://databank.worldbank.org/source/world-development-indicators accessed on 2 August 2020) and pesti from the FAOSTAT database and enemix was calculated using data from the International Energy Agency.

4. Empirical Results

4.1. SFA Model Results

Table 1 shows the maximum likelihood estimation results of three different SFA specifications, including the time trend and energy input dummy variables with interactions. In the model building process, we first specified the translog function with interaction effects to assess linear shifts in Model 1 and found that the interaction terms of labor are insignificant. We then added the time trend and its interaction terms in Model 2 and found that all coefficients are significant, which means that time influences agricultural energy efficiency. Based on Model 2, we used the dummy variables to represent the level of energy input to yield Model 3, which shows that a high-level energy input has more influence. Finally, in Model 4, the interaction terms of the dummy variables are added to Model 3. In Model 4, 16 coefficients out of a total of 22 are significantly different from 0 at the 5% level, implying a good fit. Model 4 has the smallest Akaike information criterion (AIC) and Bayesian Information Criteria (BIC) values. Therefore, this discussion concentrates on the results of Model 4 from now on. Table 1 shows that the estimated value of the parameter γ is 0.84, which indicates that most of the deviations from the input set frontier in emerging economies are due to inefficiency. The z value of γ illustrates that the null hypothesis is rejected, and the alternative hypothesis is accepted at the 1% confidence level. Because the model uses mean-corrected variables, the coefficients can be read directly as elasticities on energy consumption. Results indicate that output and capital input show a significantly positive relationship with agricultural energy, while labor input is significantly negative. The estimated output elasticity is 0.32, and capital elasticity is 0.50, which suggests a 1% increase in output per square kilometer and capital increase energy consumption by 0.32% and 0.50%, respectively.
As seen in Model 4, the coefficient of the interaction term provides the magnitude and direction of the marginal effect of the use of each variable on the other variables. The interaction between output and capital has a positive coefficient, which is significantly different from zero, indicating that with constant capital, a 1% increase in output per square kilometer will increase energy use by 0.36%. However, the coefficient of the interaction of capital with labor is significantly negative, which suggests a substitution relationship between capital and labor. That is to say, more labor lowers the demand for energy input with constant capital because mechanical farming can substitute agricultural labor use. We tested for the time trend and found that the linear trend is significantly negative, which indicates a decreasing trend in energy use over the period and positive technological change. The time interaction term is significantly positive for labor and shows that the negative impact of labor on energy use diminished (becoming less negative) over time. As expected, capital and labor inputs significantly influence energy use in different economies. Contrary to low-energy-input economies, energy use is significantly higher with an increase in capital or labor in high-energy-input economies. The result shows that M-capital interaction is insignificant. The M-labor interaction coefficient is positive and significant, indicating that middle-energy-input economies also consume a little more energy than low-energy-input economies with an increase in labor.

4.2. Energy Efficiency in Emerging Economies’ Agricultural Sector

Based on the model results presented above, energy efficiency in the agricultural sector of emerging economies was calculated. It reflects the degree of gap between minimum energy input and actual energy at a given output level. If the value equals one, there is no room for energy saving from the use of inputs. If it is less than one, energy-saving potential exists. Because the distribution of energy efficiency is left skewed, we used the median as the average. During 1998–2017, the median of agricultural energy efficiency in 27 emerging economies fluctuated around 0.74, and the sample median deviation was 0.11, which indicates the existence of a relatively large degree of inefficiency.
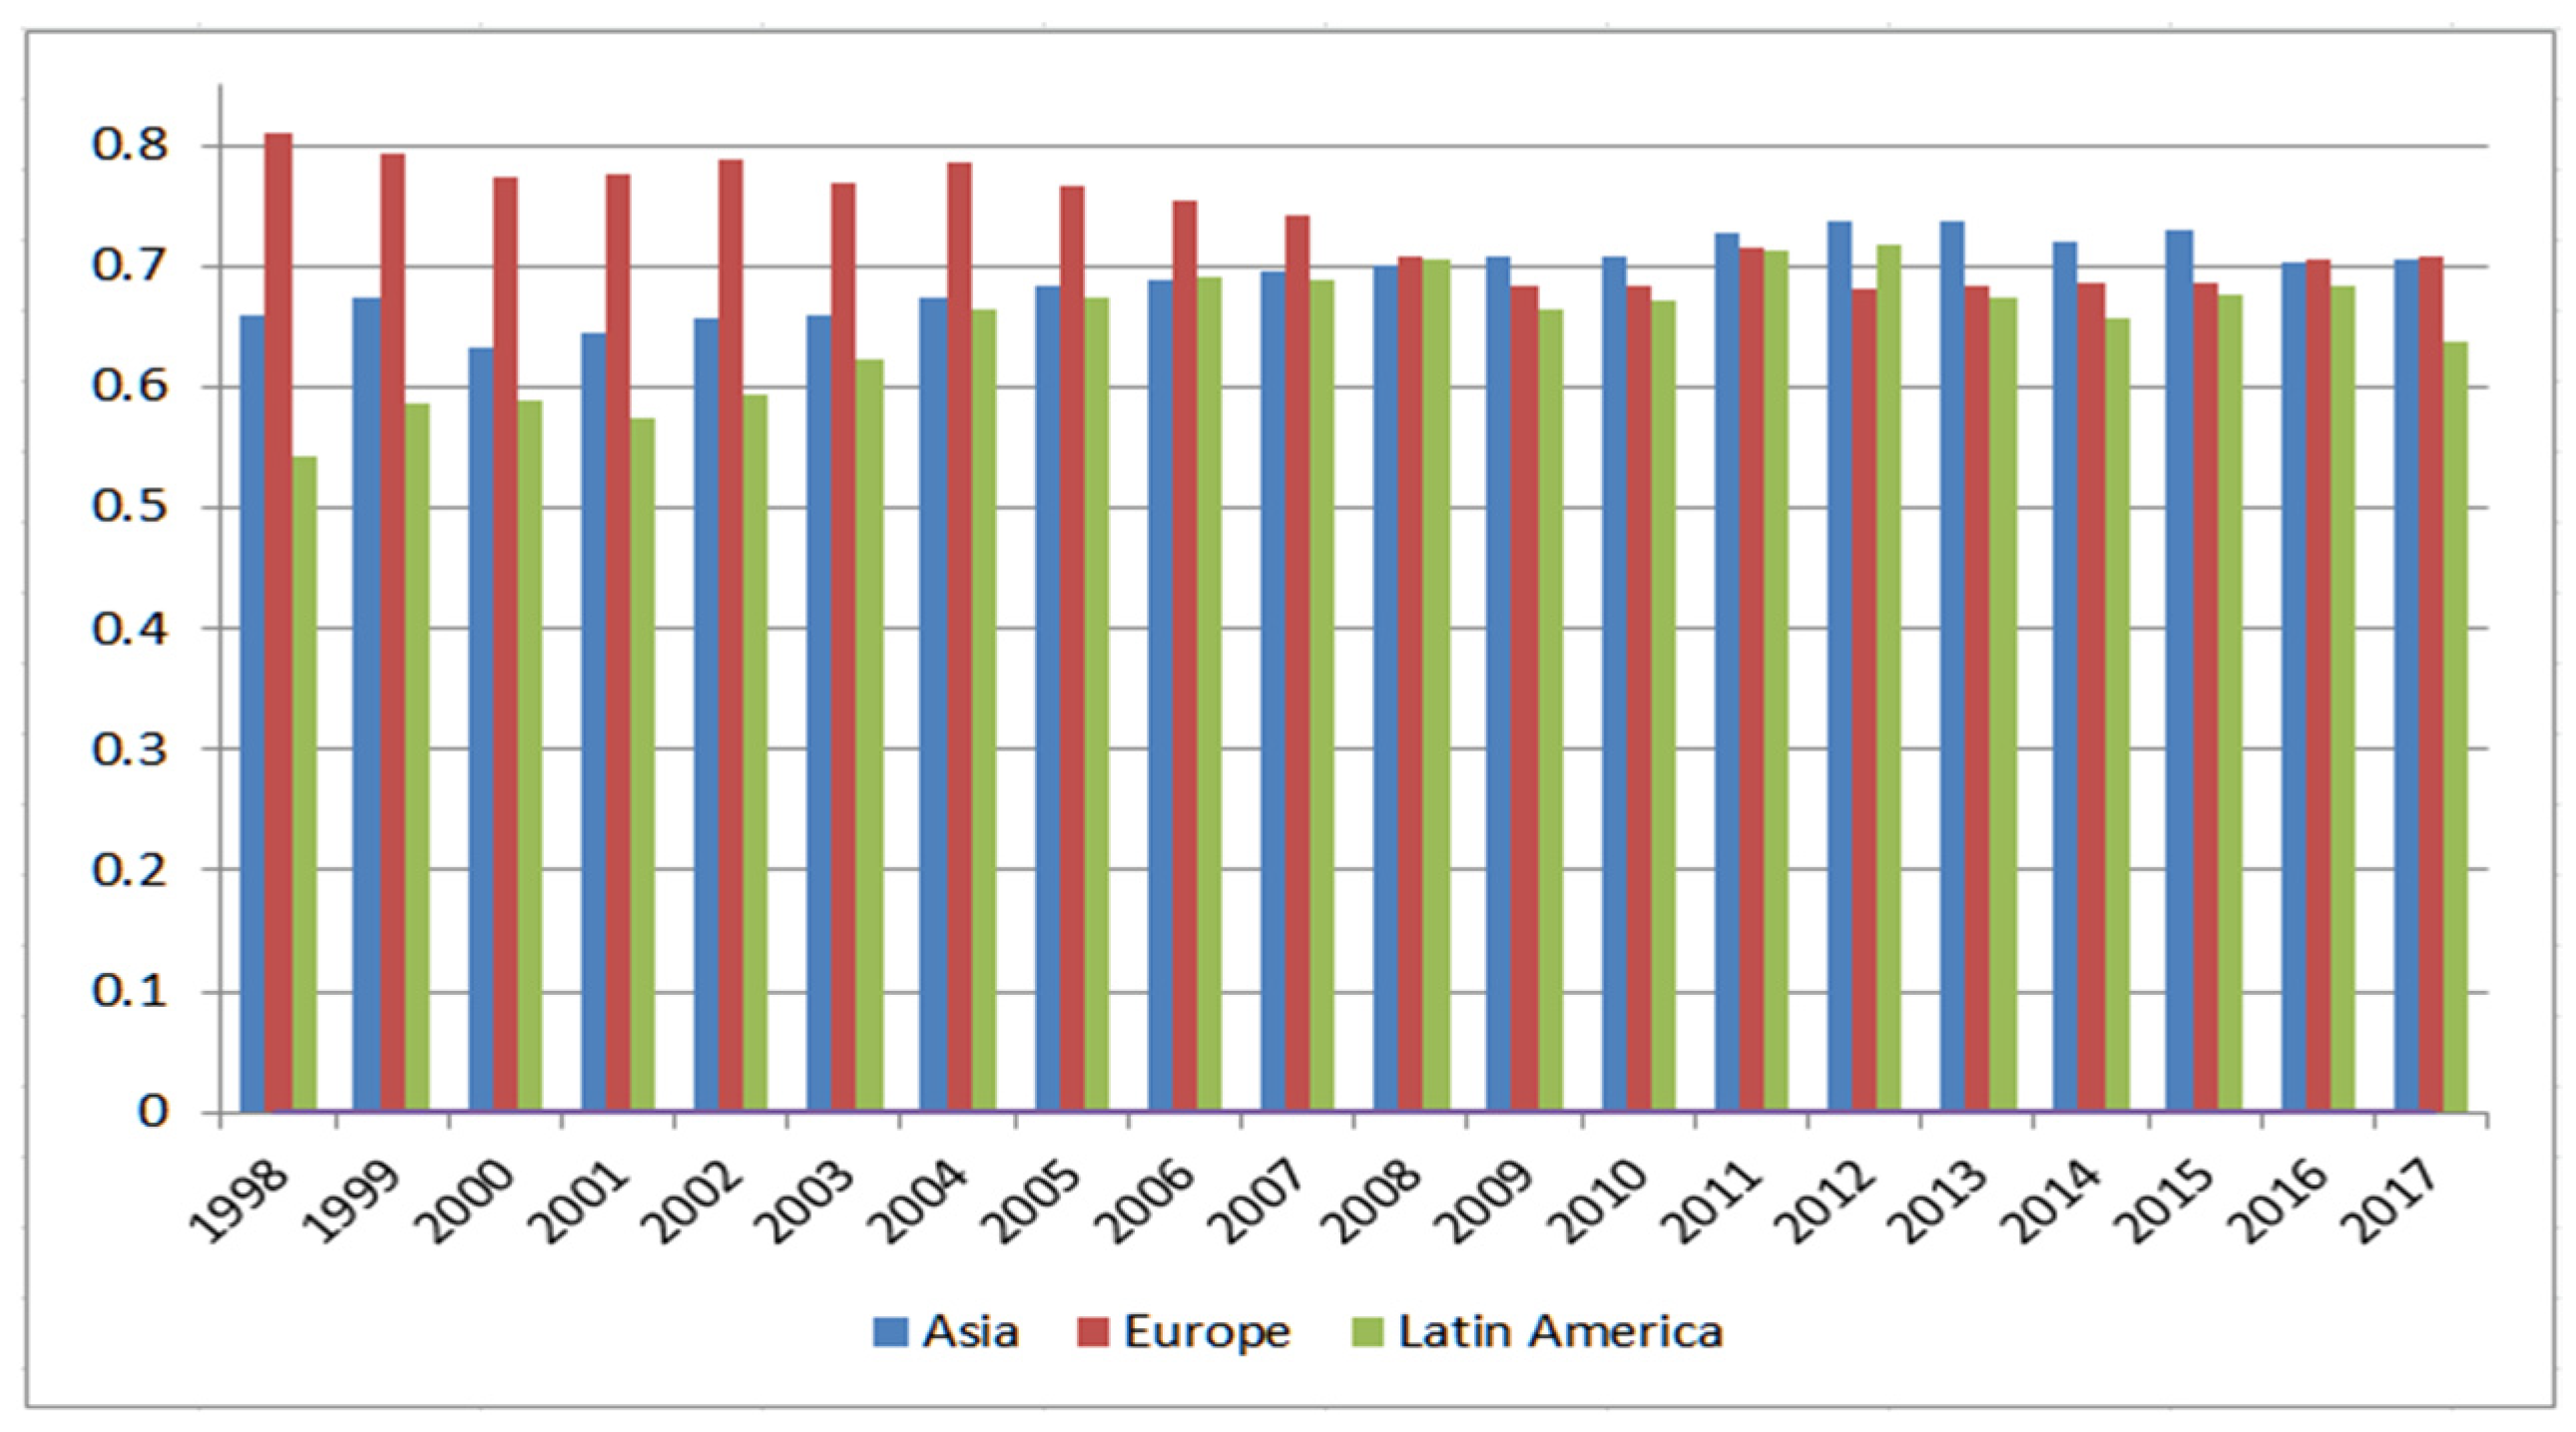
Based on the continental groups, Figure 2 exhibits continental variations in energy efficiency in the agricultural sector of emerging economies from 1998 to 2017. The overall energy efficiency is maintained at a relatively high level. The rank from high to low is: Europe, Asia and Latin America. For Europe, in the beginning, energy efficiency decreased slightly. However, the average agricultural energy efficiency of Latin American emerging economies experienced a slight growth. In 2008, possibly affected by the U.S. subprime mortgage crisis and the subsequent global financial crisis, energy efficiency dropped a little. Since then, it fluctuated a little, showing that the economic recession has a limited impact on the agricultural sector. Deepak [51] concluded that although the global economic slowdown has led to mass unemployment in many other sectors, the agricultural sector remained stable with few job losses.
Table 2 shows energy efficiency in the agricultural sector of each emerging economy and the average for each continent. Energy efficiencies of Asian countries, except Indonesia and Pakistan, are relatively high, and the values are higher than the overall median of 0.74. Among the eight Asian countries, Thailand, Vietnam and India showed the best energy efficiency performance and enhanced overall competitiveness of agricultural products. It is important to develop the agricultural sector in these three economies, which are among the world’s top ten rice producers.
The average energy efficiency in Europe is a little higher than the overall median estimate of 0.74, which is higher than that observed in Asia and Latin America. In Europe, the energy efficiency of Estonia ranks first, followed by the Czech Republic. The agricultural energy efficiency in Greece is the lowest, estimated at only 0.59. Energy efficiencies of five European countries (Greece, Hungary, Latvia, Lithuania and Slovakia) are less than 0.70, implying that there is high potential to improve energy efficiency. This result is similar to the conclusion by Vlontzos et al. [15], who, using the nonradial DEA model, found that Slovakia, Latvia and Lithuania have lower agricultural energy efficiencies in Europe.
Energy efficiencies in Latin America are relatively low, which indicates that the agricultural sector in Latin America is in the phase of inefficient use of agricultural energy. Argentina’s energy efficiency is the highest in Latin America, as Viglizzo and Frank [52] found that although the consumption of fossil energy increased, there was a noticeable improvement in Argentina’s energy efficiency, compared with other Latin American countries.

4.3. Analysis of National Differences

In order to explore the differences in agricultural energy efficiency in emerging economies, we classified the 27 countries by the two indicators, energy input and energy efficiency. To start with, the countries were divided into three groups according to agricultural energy consumption. The mean was 4534 ktoe, the median was 772 ktoe and the maximum was 44,460 ktoe. Thus, the three groups were divided into (0, 800), [800, 4500) and [4500, 45,000]. On the other hand, in each group, the countries were divided by agricultural energy efficiency. The overall median of energy efficiency was 0.74 and the deviation was 0.11. We adopted 0.60 and 0.80 to separate the countries into three levels: high efficiency ([0.80, 1]), middle efficiency ([0.60, 0.80)) and low efficiency ([0.40, 0.60)). All 27 countries within 9 categories are displayed in Table 3.
First, the BRIC countries, as large agricultural producers, require high energy consumption. Agricultural energy efficiencies of China, India and Russia are relatively high. Brazil’s energy efficiency is relatively low and reached 0.597, which is close to the threshold of the middle energy efficiency level. Almost all European countries achieved at least a middle energy efficiency level in agriculture. In the category of middle efficiency, compared to China, India and Russia, European countries have middle and low energy input levels, which denote that they are more efficient than the BRIC countries. The main reason is that Europe promoted agricultural intensification earlier and more widely than Asia and Latin America and is supported by the EU’s Common Agricultural Policy and Cohesion Policy [53].
Second, countries within the same region and climate usually have similar agricultural energy efficiency, e.g., Mexico and the Dominican Republic. However, there are also some exceptions, e.g., the three Baltic countries. Compared with Lithuania and Latvia, Estonia has a higher degree of agricultural intensification [54]. These two neighboring countries are still in the era of peasant economy. The agricultural sector in Estonia, Lithuania and Latvia all account for small portions of GDP. Estonia employs a similar percentage of its workforce in the agricultural sector as compared to the sector’s contribution to GDP, whereas Lithuania and Latvia have a much higher percentage of employment in agriculture as compared to the sector’s contribution to GDP.

4.4. Energy-Saving Potential in Emerging Economies’ Agricultural Sector

Energy-saving potential measures the quantity of agricultural energy input that can be saved by moving toward the production frontier. The total energy-saving potential and energy-saving potential per agricultural value added in each country are presented in Table 4. China has the largest level of energy-saving potential. As China’s energy consumption in agriculture is relatively high, it will be conducive to global greenhouse emission reduction and environmental protection by improving its energy efficiency. Thus, there is an urgent need to improve its energy efficiency. The BRIC countries consume far more energy to cultivate vast areas of agricultural land and face heavy demand to produce a high level of agricultural output. Indonesia, Pakistan and Uruguay have the lowest agricultural energy efficiency and also have small energy-saving potential. However, the countries that have a higher energy efficiency have small energy-saving potential, e.g., Bulgaria, Czech and Estonia. The reason is that these countries have very low energy input. This only goes to show that energy-saving potential is related to both energy use and energy efficiency. To save energy and reduce greenhouse gas emissions, we should also control the total amount of energy consumption. The energy-saving potential in Europe is generally small, exceeding 10 Mtoe only in Poland and Russia. The energy-saving potential of Estonia is the smallest. The energy-saving potentials in Latin American countries are also relatively low, except for Brazil.
Furthermore, we measured the energy saving of emerging economies calculated as units of ESP per unit of agricultural land shown in Table 4. The higher value indicates higher potential to save energy per unit of agricultural land. Uruguay, Pakistan and Colombia have a lower value of ESP per unit of agricultural land but low energy efficiency shown in Table 3. Thus, countries with relatively low values of ESP do not necessarily have high energy efficiency.
Table 5 presents the median energy efficiency and total energy-saving potential of the agricultural sector in emerging economies in the classification of energy efficiency during 1998–2017. The total energy use in the agricultural sector is 2066.96 Mtoe, and the energy-saving potential is 542.80 Mtoe. In other words, the total energy-saving potential accounts for about 26.26% of the total agricultural energy use. The ESP in high-efficiency and middle-efficiency countries fluctuated at 0.56 Mtoe and 20.42 Mtoe, respectively, with a slight fluctuation in their energy efficiency. However, the ESP of low-efficiency countries shows a downward trend, which is reducing faster than their energy efficiency.
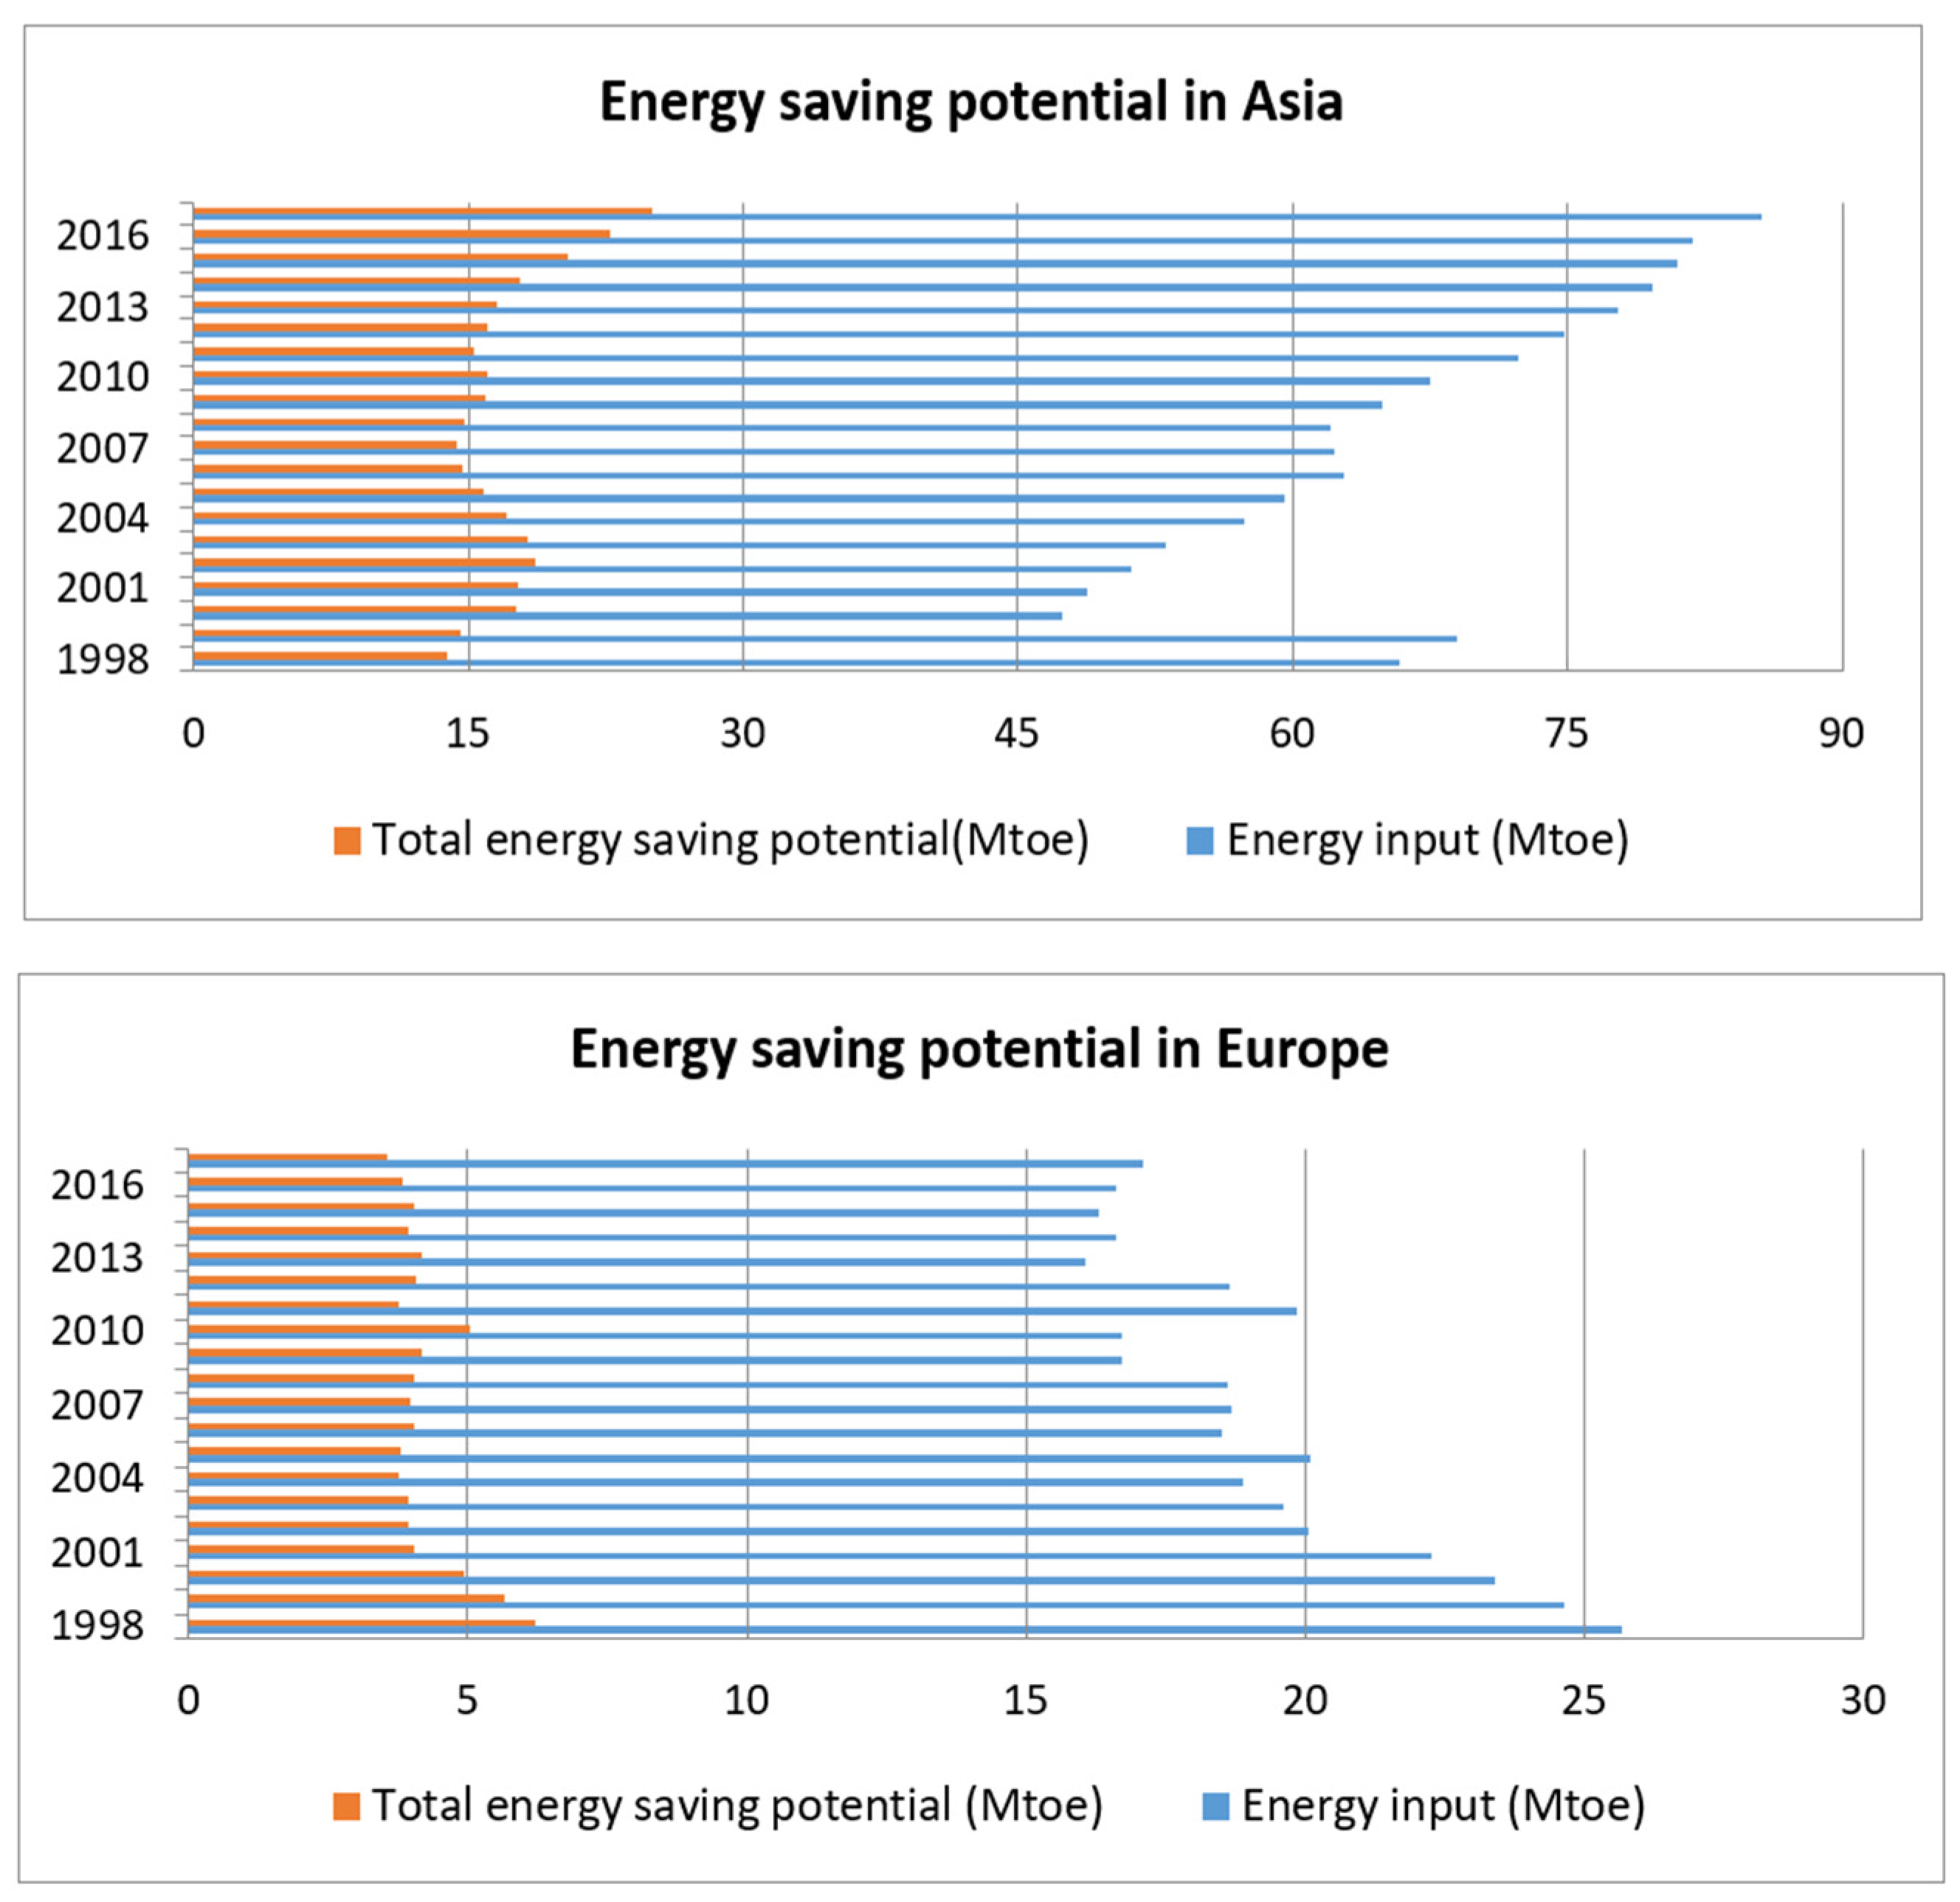
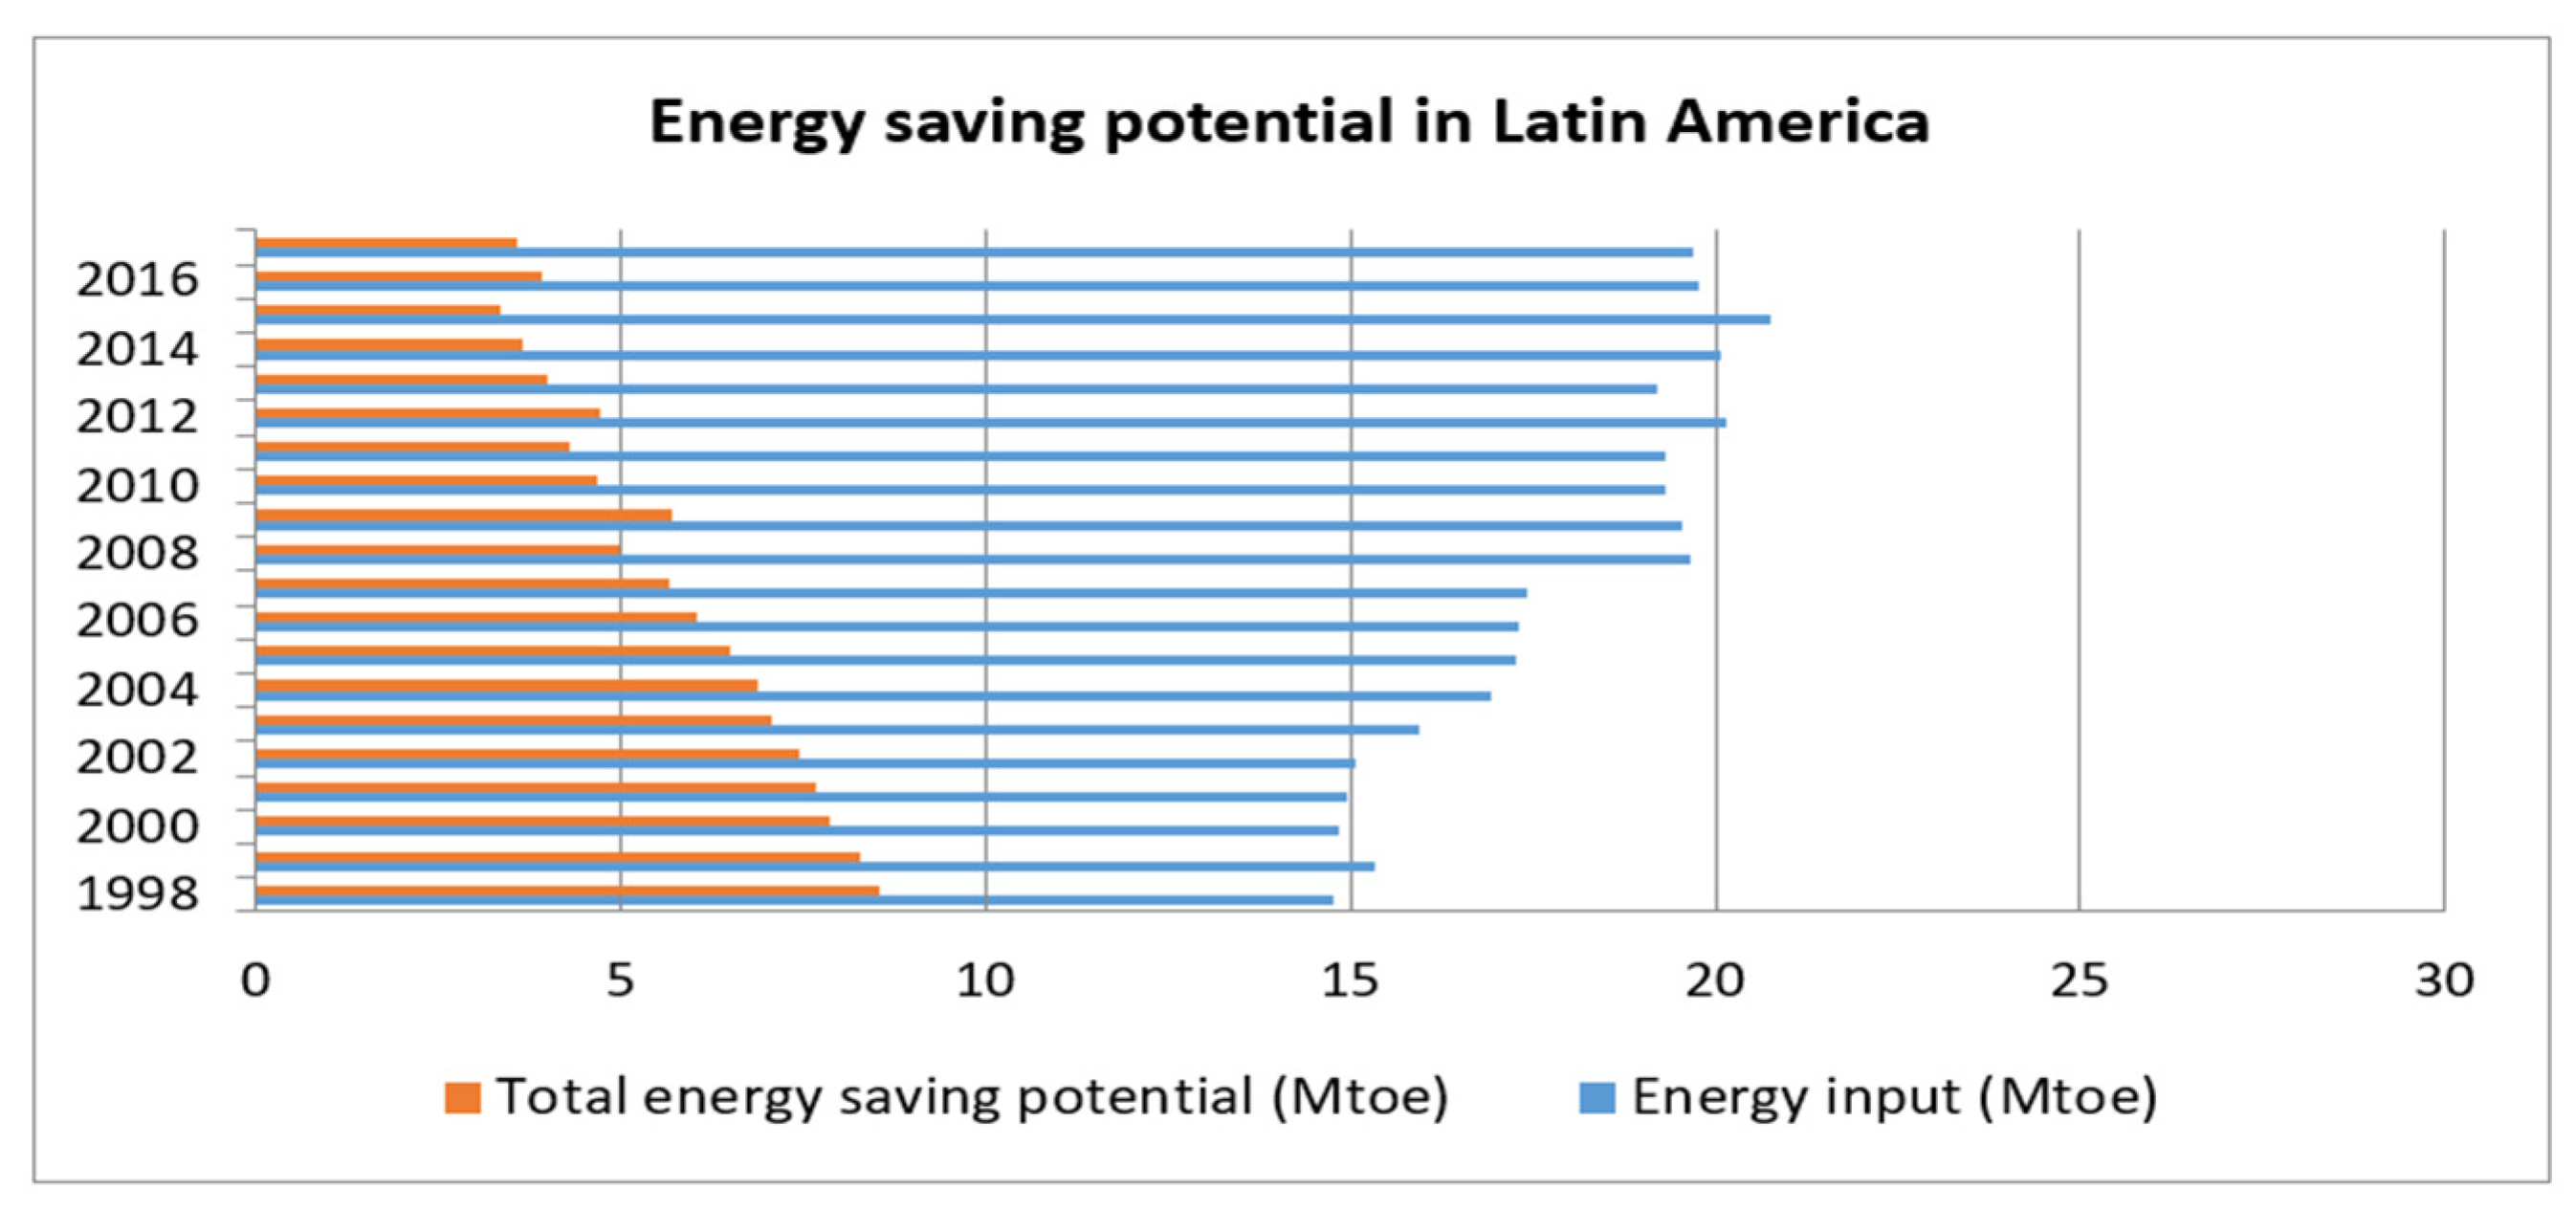
Figure 3 illustrates energy-saving potential in different continents and suggests that:
(i) The energy-saving potential in Asia presents an increasing trend, conveying that with technological innovation and economic development, an increase of energy efficiency can be attributed to energy-saving technologies used in agriculture. In 2000, the energy-saving potential in Asia increased, but the total energy input decreased, indicating that agricultural energy efficiency was lower. The decrease in total agricultural energy input in Asia in 2000 was mainly due to the sharp reduction in China’s agricultural energy consumption compared with the previous year. It could be related to China’s implementation of returning farmland to forests in 1999 [55]. It is noteworthy that although Asia performs well in agricultural energy efficiency, the absolute amount of its energy input is much larger than Europe and Latin America.
(ii) Energy efficiency is relatively lower in Latin America, implying that they face the problem of energy saving. Though agricultural energy efficiency in Europe was higher than that in Latin America, the absolute amount of energy-saving potential in Europe during 1998–2017 was less than that in Latin America with a difference in agricultural energy input in these two regions. Agricultural energy input in Europe is showing a downward trend, but its energy-saving potential is not significantly reduced, indicating that energy efficiency in Europe needs to be optimized. However, agricultural energy input in Latin America is on the rise, while the energy-saving potential is decreasing. According to Dutra et al. [56], most energy in the agricultural sector was consumed in machinery and fertilizer production. So, it indicates that agricultural production in Latin America is expanding and energy efficiency improved gradually though at a low level.

4.5. Factor Analysis for Agricultural Energy Efficiency (AEE)

We proceed with the factors affecting AEE. The energy efficiency scores are not normally distributed, as informed by a Chi-square value of 64.365 in the Jarque–Bera test. To accommodate upper censoring and account for the skewed distribution in the data, we employed Tobit quantile regression to investigate the influencing factors of agricultural energy efficiency of emerging economies. The results estimated at the 10th, 25th, 50th, 75th and 90th quantiles are reported in Table 6.
The regression estimates show that both urbanization and GDP per capita have negative influences on agricultural energy efficiency, but their impacts vary at different quantiles. This result implies that economic growth impedes improvements in energy efficiency. It is contradictory with the findings that an increase in GDP per capita would cause higher agricultural energy efficiency but is consistent with the findings that urbanization has a significantly negative effect on energy efficiency [45]. The different results may be caused by regional heterogeneity and the sample period. Due to the complexity of the long process, urbanization has complex connections with energy use. Reasons for the negative impact of urbanization can be analyzed from different perspectives, such as agricultural modernization, a shift in economic structure, the application of energy-saving technical measures and green energy consumption preferences [57].
The economic structure is also negative and significant at all quantiles, suggesting that an increase in the share of the agricultural sector in GDP would lead to lower agricultural energy efficiency. Yang et al. [14] have the same opinion on the negative impact of economic structure. The negative influences in the lower-quantile countries are greater than those in the higher-quantile countries. The absolute values of the coefficients are a little larger than the coefficients of other variables, indicating a relatively higher influence than other variables on energy efficiency.
The energy mix has a significantly positive effect on agricultural energy efficiency at the 25th, 50th, 75th and 90th quantiles, indicating that an increase in the percentage of oil consumption to total agricultural energy would lead to higher agricultural energy efficiency. Dutra et al. [56] drew the same conclusion and found the reason that machinery is the main consumer of energy in the agricultural sector. Agricultural energy mainly consists of coal, gasoline and diesel. The corresponding standard conversion coefficients of coal equivalent are 0.714 kg standard coal/kg, 1.471 kg standard coal/kg and 1.457 kg standard coal/kg. Therefore, diesel- and gasoline-powered machinery are more fuel efficient, powerful and productive, making it a key foundation of sustainable farming [58]. Additionally, the effect of the percentage of oil consumption on energy efficiency is approximately twice at the 50th quantile (0.20) than at the 90th quantile (0.12). The influence of the energy mix is more extensive at the median level.
The positive impact of pesticide use on agricultural energy efficiency is shown at the 50th quantile, indicating that increasing the use of pesticides can improve agricultural energy efficiency, possibly because it is beneficial in increasing crop yields. It is also observed when Lechenet et al. [59] studied the impacts of pesticide use on crop productivity in arable farms. However, the absolute value of the coefficient is the smallest, indicating that it has little impact because pesticide use should be controlled to a minimum necessary dosage to avoid possible environmental contaminants and reduce the level of toxic residues remaining on food [60].
The coefficient of the proportion of agricultural land in the country’s land is positive at the 10th quantile but negative at the 90th quantile. This is different from the conclusion drawn by Chen and Zhang [61], who suggested that the land factor has a significantly negative influence on the total factor energy efficiency, so it is not easy to predict the influence of land on energy efficiency in agriculture.

5. Conclusions and Policy Implications

We applied the SFA method, Shephard distance function and Tobit quantile regression to investigate energy efficiency, energy-saving potential and their determinants in the agricultural sector of 27 emerging economies. Energy efficiency was calculated by the ratio of the actual energy input to the energy input of the frontier. On the basis of the above empirical analysis, the results can be summarized as follows: (1) the median energy efficiency of the agricultural sector of emerging economies fluctuated at 0.74, the cumulative energy-saving potential was 542.80 Mtoe, and the average annual energy-saving potential was 27.14 Mtoe during 1998–2017; (2) agricultural energy efficiency is relatively high in Thailand, Estonia, Czech and Bulgaria, while it is relatively low in Indonesia, Pakistan, Uruguay and Colombia; (3) the average energy efficiency in Europe is the highest, while it is the lowest in Latin America; (4) energy mix and pesticide use are conducive to energy efficiency improvement, and GDP per capita, urbanization and economic structure have a negative effect, while the ratio of agricultural land has different influences at different quantiles.
The policy implications for improving energy saving in the agricultural sector of emerging economies are as follows:
(i) From the estimation results of the Tobit quantile regression, energy mix and pesticide use are important efficiency factors that positively influence agricultural energy efficiency. The availability of fuel oil has proven to be necessary to increase the productivity of the agricultural sector in emerging economies. It is based on the guidance that expensive production factors (such as manpower and land) can be replaced by cheap production factors (such as petroleum, machinery and pesticides). Meanwhile, it is noted that policymakers should consider trade-offs when addressing certain issues, such as choosing between pesticide use and food safety.
(ii) Encouraging the proportion of agricultural GDP and economic development can decrease energy efficiency, which relies on promoting scientific progress and technical innovation, as well as improving farming management and operations. Governments should train skilled agricultural workers and continue to promote good practices in the use of agricultural mechanization for cultivation, irrigation and harvesting purposes in order to maximize output per unit of energy input. After all, reducing energy input minimizes greenhouse gas emissions but may also lower productivity and is rarely beneficial to farmers. Additionally, it is worth noting that adopting energy-saving technologies will be an expensive undertaking and add expenses for farmers because renewable energy and labor are more expensive than using fossil fuel. The trade-offs between energy consumption preferences and energy efficiency and environmental performance also need to be taken into consideration.
(iii) The government should implement feasible land-use policies for agricultural production, subject to urban planning, climate and other factors in its own country. If it is not appropriate to expand agricultural land, governments can develop fishery, agricultural product processing or import products. For example, BRIC economies, which have high agricultural energy input, should focus on the comparative advantages and production of high value-added agricultural products. Additionally, although agricultural energy efficiency in Asia is a little higher, there are still large amounts of energy-saving potential. Thus, governments should support the development of the main agricultural production areas to increase the volume of production and improve industrial agglomeration.
In summary, energy efficiency and energy-saving potential are significant factors in national sustainable development strategies. Although energy efficiency in the agricultural sector of emerging economies has experienced considerable improvement, the energy-saving potential is still very high. Therefore, based on local conditions, government policies should be geared toward improving agricultural energy efficiency and achieving maximum energy saving in individual economies. The limitation of this study is the lack of data for more emerging countries, and undesirable output variables were not considered. To assess the robustness of the conclusions, future improvements of the study should include expanding the time span and use of other variables that influence energy efficiency, taking into account undesirable output variables.

Author Contributions

Conceptualization, J.L., H.W., S.R. and S.S.; methodology, J.L., H.W. and S.S.; formal analysis, J.L. and H.W.; data curation, J.L. and H.W.; writing—original draft preparation, J.L. and H.W.; writing—review and editing, J.L., H.W. and S.R.; supervision, S.S. All authors have read and agreed to the published version of the manuscript.

Funding

This research received no external funding.

Institutional Review Board Statement

Not applicable.

Informed Consent Statement

Not applicable.

Data Availability Statement

The data presented in the study are available within the article.

Acknowledgments

This work was supported by the Faculty of Economics and the Centre of Excellence in Econometrics at Chiang Mai University, the China–ASEAN High-Quality Development Research Center and International Exchange and Cooperation Office at Shandong University of Finance and Economics, and the education plan of the youth and creative talents in Shandong higher education institutions.

Conflicts of Interest

The authors declare no conflict of interest.

References

  1. Prasetyo, P.E.; Kistanti, N.R. Human capital, institutional economics and entrepreneurship as a driver for quality & sustainable economic growth. Entrep. Sustain. Issues 2020, 7, 2575–2589. [Google Scholar]
  2. Ozturk, I. Measuring the impact of energy consumption and air quality indicators on climate change: Evidence from the panel of UNFCC classified countries. Environ. Sci. Pollut. Res. 2015, 22, 15459–15468. [Google Scholar] [CrossRef]
  3. Francesco, N.T.; Mirella, S.; Simone, R.; Alessandro, F.; Nuala, F.; Pete, S. The FAOSTAT database of greenhouse gas emissions from agriculture. Environ. Res. Lett. 2013, 8, 015009. [Google Scholar]
  4. Huang, W.T.; Chien, C.Y. Patterns and Factors of Farming Innovation in Taiwan. J. Agric. Sci. 2013, 5, 269–279. [Google Scholar] [CrossRef] [Green Version]
  5. Bayar, Y.; Gavriletea, M.D. Energy efficiency, renewable energy, economic growth: Evidence from emerging market economies. Qual. Quant. Int. J. Methodol. 2019, 53, 2221–2234. [Google Scholar] [CrossRef]
  6. Fei, R.; Lin, B. Energy efficiency and production technology heterogeneity in China’s agricultural sector: A meta-frontier approach. Technol. Forecast. Soc. 2016, 109, 25–34. [Google Scholar] [CrossRef]
  7. Tripathi, A.; Prasad, A.R. Agricultural Development in India since Independence: A Study on Progress, Performance, and Determinants. J. Emerg. Knowl. Emerg. Mark. 2009, 1, 63–92. [Google Scholar] [CrossRef] [Green Version]
  8. VanLoon, G.W.; Patil, S.G.; Hugar, L.B. Agricultural Sustainability: Strategies for Assessment; SAGE: New Delhi, India, 2005. [Google Scholar]
  9. Han, H.; Wu, S. Structural Change and Its Impact on the Energy Intensity of Agricultural Sector in China. Sustainability 2018, 10, 4591. [Google Scholar] [CrossRef] [Green Version]
  10. Cardozo, N.P.; de Oliveira Bordonal, R.; La Scala, N. Sustainable intensification of sugarcane production under irrigation systems, considering climate interactions and agricultural efficiency. J. Clean. Prod. 2018, 204, 861–871. [Google Scholar] [CrossRef]
  11. Bručienė, I.; Aleliūnas, D.; Šarauskis, E.; Romaneckas, K. Influence of Mechanical and Intelligent Robotic Weed Control Methods on Energy Efficiency and Environment in Organic Sugar Beet Production. Agriculture 2021, 11, 449. [Google Scholar] [CrossRef]
  12. Dyer, J.A.; Desjardins, R.L. Energy use and fossil CO2 emissions for the Canadian fruit and vegetable industries. Energy Sustain. Dev. 2018, 47, 23–33. [Google Scholar] [CrossRef]
  13. Jat, H.S.; Jat, R.D.; Nanwal, R.K.; Lohan, S.K.; Yadav, A.K.; Poonia, T.; Sharma, P.C.; Jat, M.L. Energy use efficiency of crop residue management for sustainable energy and agriculture conservation in NW India. Renew Energy 2020, 155, 1372–1382. [Google Scholar] [CrossRef]
  14. Yang, Z.; Wang, D.; Du, T.; Zhang, A.; Zhou, Y. Total-factor energy efficiency in China’s agricultural sector: Trends, disparities and potentials. Energies 2018, 11, 853. [Google Scholar] [CrossRef] [Green Version]
  15. Vlontzos, G.; Niavis, S.; Manos, B. A DEA approach for estimating the agricultural energy and environmental efficiency of EU countries. Renew. Sustain. Energy Rev. 2014, 40, 91–96. [Google Scholar] [CrossRef]
  16. Li, C.; Wang, H.; Miao, H.; Ye, B. The economic and social performance of integrated photovoltaic and agricultural greenhouses systems: Case study in China. Appl. Energy 2017, 190, 204–212. [Google Scholar] [CrossRef]
  17. Rahman, S.; Rahman, M.S.; Rahman, M.H. Joint determination of the choice of growing season and economic efficiency of maize in Bangladesh. J. Asia Pac. Econ. 2012, 17, 138–150. [Google Scholar] [CrossRef] [Green Version]
  18. Rahman, S.; Hasan, M.K. Energy productivity and efficiency of wheat farming in Bangladesh. Energy 2014, 66, 107–114. [Google Scholar] [CrossRef] [Green Version]
  19. Wysokiński, M.; Domagała, J.; Gromada, A.; Golonko, M.; Trębska, P. Economic and energy efficiency of agriculture. Agric. Econ. 2020, 66, 355–364. [Google Scholar] [CrossRef]
  20. Ozcan, B.; Ozturk, I. Renewable energy consumption-economic growth nexus in emerging countries: A bootstrap panel causality test. Renew. Sustain. Energy Rev. 2019, 104, 30–37. [Google Scholar] [CrossRef]
  21. Hatirli, S.A.; Ozkan, B.; Fert, C. An econometric analysis of energy input-output in Turkish agriculture. Renew Sustain. Energy Rev. 2005, 9, 608–623. [Google Scholar] [CrossRef]
  22. Wen, L.; Li, H. Estimation of agricultural energy efficiency in five provinces: Based on data envelopment analysis and Malmquist index model. Energy Source Part A 2019, 41, 1–14. [Google Scholar] [CrossRef]
  23. Wang, C.; Siriwardana, M.; Meng, S. Effects of the Chinese arable land fallow system and land-use change on agricultural production and on the economy. Econ. Model. 2019, 79, 186–197. [Google Scholar] [CrossRef]
  24. Patterson, M.G.; Makarov, V.I.; Khmelinskii, I.V. What is energy efficiency? Concepts, indicators, and methodological issues. Energy Policy 1996, 5, 377–390. [Google Scholar] [CrossRef]
  25. Wei, C.; Shen, M. Energy Efficiency and Energy Productivity: A Comparison of based on the Panel Data by Province. J. Quant. Tech. Econ. 2007, 9, 110–121. [Google Scholar]
  26. Hu, J.; Wang, S. Total factor energy efficiency of regions in China. Energy Policy 2006, 34, 3206–3217. [Google Scholar] [CrossRef]
  27. Lin, B.; Wang, X. Exploring energy efficiency in China’s iron and steel industry: A stochastic frontier approach. Energy Policy 2014, 72, 87–96. [Google Scholar] [CrossRef]
  28. Wei, Z.; Han, B.; Pan, X.; Shahbaz, M.; Zafar, M.W. Effects of diversified openness channels on the total-factor energy efficiency in China’s manufacturing sub-sectors: Evidence from trade and FDI spillovers. Energy Econ. 2020, 90, 104836. [Google Scholar] [CrossRef]
  29. Coelli, T.J. Recent Development in Frontier Modeling and Efficiency Measurement. Aust. J. Agric. Econ. 1995, 39, 219–245. [Google Scholar]
  30. Alluvione, F.; Moretti, B.; Sacco, D.; Grignani, C. Energy use efficiency of cropping systems for a sustainable agriculture. Energy 2011, 36, 4468–4481. [Google Scholar] [CrossRef]
  31. Noguchi, R.; Saito, T. Consideration of energy consumption and energy efficiency in mechanized rice production system by using inventory analysis. Agric. Infor. Res. 2008, 17, 20–30. [Google Scholar] [CrossRef] [Green Version]
  32. Chang, C.L.; Oxley, L. Industrial agglomeration, geographic innovation and total factor productivity: The case of Taiwan. Math. Comput. Simulat. 2009, 79, 2787–2796. [Google Scholar] [CrossRef] [Green Version]
  33. Liu, J.; Cheng, Z.; Zhang, H. Does industrial agglomeration promote the increase of energy efficiency in China? J. Clean. Prod. 2017, 164, 30–37. [Google Scholar] [CrossRef]
  34. Martínez, F.B.; Guevara, F.; Aguilar, C.E.; Pinto, R.; La O, M.A.; Rodríguez, L.A.; Aryal, D.R. Energy and Economic Efficiency of Maize Agroecosystem under Three Management Strategies in the Frailesca, Chiapas (Mexico). Agriculture 2020, 10, 81. [Google Scholar] [CrossRef] [Green Version]
  35. Haider, S.; Bhat, A.J. Inter-state analysis of energy efficiency—A stochastic frontier approach to the Indian paper industry. Int. J. Energy Serv. Manag. 2018, 12, 547–565. [Google Scholar] [CrossRef]
  36. Alhamzawi, R.; Mohammad Ali, H.T. Bayesian Tobit quantile regression with penalty. Commun. Stat B-Simul. 2018, 47, 1739–1750. [Google Scholar] [CrossRef]
  37. Zhou, P.; Ang, B.; Zhou, D. Measuring economy-wide energy efficiency performance: A parametric frontier approach. Appl. Energy 2012, 90, 196–200. [Google Scholar] [CrossRef]
  38. Wei, Z.; Conlon, E.M.; Wang, T. Asymmetric dependence in the stochastic frontier model using skew normal copula. Int. J. Approx. Reason. 2021, 128, 56–68. [Google Scholar] [CrossRef]
  39. Bianco, V.; Cascetta, F.; Marino, A.; Nardini, S. Understanding energy consumption and carbon emissions in Europe: A focus on inequality issues. Energy 2019, 170, 120–130. [Google Scholar] [CrossRef]
  40. Borozan, D. Technical and total factor energy efficiency of European regions: A two-stage approach. Energy 2018, 152, 521–532. [Google Scholar] [CrossRef]
  41. Fragkos, P.; Tasios, N.; Paroussos, L.; Capros, P.; Tsani, S. Energy system impacts and policy implications of the European Intended Nationally Determined Contribution and low-carbon pathway to 2050. Energy Policy 2017, 100, 216–226. [Google Scholar] [CrossRef]
  42. Lin, B.; Zhu, J. Energy and carbon intensity in China during the urbanization and industrialization process: A panel VAR approach. J. Clean. Prod. 2017, 168, 780–790. [Google Scholar] [CrossRef]
  43. Schneider, U.A.; Rasche, L.; McCarl, B.A. Assessing the Economic Impacts of Pesticide Regulations. Agriculture 2018, 8, 53. [Google Scholar] [CrossRef] [Green Version]
  44. Raheli, H.; Rezaei, R.M.; Jadidi, M.R.; Mobtaker, H.G. A two-stage DEA model to evaluate sustainability and energy efficiency of tomato production. Inf. Process. Agric. 2017, 4, 342–350. [Google Scholar] [CrossRef]
  45. Lv, Y.; Chen, W.; Cheng, J. Effects of urbanization on energy efficiency in China: New evidence from short run and long run efficiency models. Energy Policy 2020, 147, 111858. [Google Scholar] [CrossRef]
  46. Zaman, G.; Goschin, Z. Energy Efficiency: Trends and Influence Factors. Rom. J. Econ. 2006, 23, 7–12. [Google Scholar]
  47. Chen, Z.; Song, S. Efficiency and technology gap in China’s agriculture: A regional meta-frontier analysis. China Econ. Rev. 2008, 19, 287–296. [Google Scholar] [CrossRef]
  48. Marques, A.C.; Fuinhas, J.A.; Tomas, C. Energy efficiency and sustainable growth in industrial sectors in European Union countries: A nonlinear ARDL approach. J. Clean. Prod. 2019, 239, 118045. [Google Scholar] [CrossRef]
  49. Smith, L.G.; Williams, A.; Pearce, B. The energy efficiency of organic agriculture: A review. Renew Agric. Food Syst. 2015, 30, 280–301. [Google Scholar] [CrossRef]
  50. Niavis, S.; Vlontzos, G. Seeking for Convergence in the Agricultural Sector Performance under the Changes of Uruguay Round and 1992 CAP Reform. Sustainability 2019, 11, 4006. [Google Scholar] [CrossRef] [Green Version]
  51. Deepak, S. Financial and Economic Crisis: Implications for Agricultural Sector in India; MPRA Paper 39274; University Library of Munich: Munich, Germany, 2012. [Google Scholar]
  52. Viglizzo, E.F.; Frank, C.F. Energy use in agriculture: Argentina compared with other countries. In Energy Consumption: Impacts of Human Activity, Current and Future Challenges, Environmental and Socio-Economic Effects; Reiter, S., Ed.; NOVA Science Publishers: New York, NY, USA, 2014; pp. 77–98. [Google Scholar]
  53. Pellegrini, P.; Fernández, R.J. Crop intensification, land use, and on-farm energy-use efficiency during the worldwide spread of the green revolution. Proc. Natl. Acad. Sci. USA 2018, 115, 2335–2340. [Google Scholar] [CrossRef] [PubMed] [Green Version]
  54. Värnik, R.; Aste, R.; Ariva, J. Sustainable Intensification in Crop Farming—A Case from Estonia. In Precision Agriculture: Technology and Economic Perspectives; Pedersen, S.M., Lind, K.M., Eds.; Springer: Singapore, 2017; pp. 201–221. [Google Scholar]
  55. Zhang, Z.; Zinda, J.A.; Li, W. Forest transitions in Chinese villages: Explaining community-level variation under the returning forest to farmland program. Land Use Policy 2017, 64, 245–257. [Google Scholar] [CrossRef] [Green Version]
  56. Dutra, L.; Schwinden, N.B.C.; Andrade, S.F.D. Future scenarios and trends in energy generation in Brazil: Supply and demand and mitigation forecasts. J. Clean. Prod. 2015, 103, 197–210. [Google Scholar] [CrossRef]
  57. Sadorsky, P. Do urbanization and industrialization affect energy intensity in developing countries? Energy Econ. 2013, 37, 52–59. [Google Scholar] [CrossRef]
  58. Shancita, I.; Masjuki, H.H.; Kalam, M.A.; Fattah, I.M.R.; Rashed, M.M.; Rashedul, H.K. A review on idling reduction strategies to improve fuel economy and reduce exhaust emissions of transport vehicles. Energy Convers. Manag. 2014, 88, 794–807. [Google Scholar] [CrossRef]
  59. Lechenet, M.; Dessaint, F.; Py, G.; Makowski, D.; Munier-Jolain, N. Reducing pesticide use while preserving crop productivity and profitability on arable farms. Nat. Plants 2017, 3, 17008. [Google Scholar] [CrossRef]
  60. Deike, S.; Pallutt, B.; Christen, O. Investigations on the energy efficiency of organic and integrated farming with specific emphasis on pesticide use intensity. Eur. J. Agron. 2008, 28, 461–470. [Google Scholar] [CrossRef]
  61. Chen, S.; Zhang, S. Large-Scale Land Use for Construction and Energy Consumption after the New Millennium with Their Impact on Total-Factor Efficiency Change in China’s Regional Economy. Energies 2014, 7, 1986. [Google Scholar] [CrossRef] [Green Version]
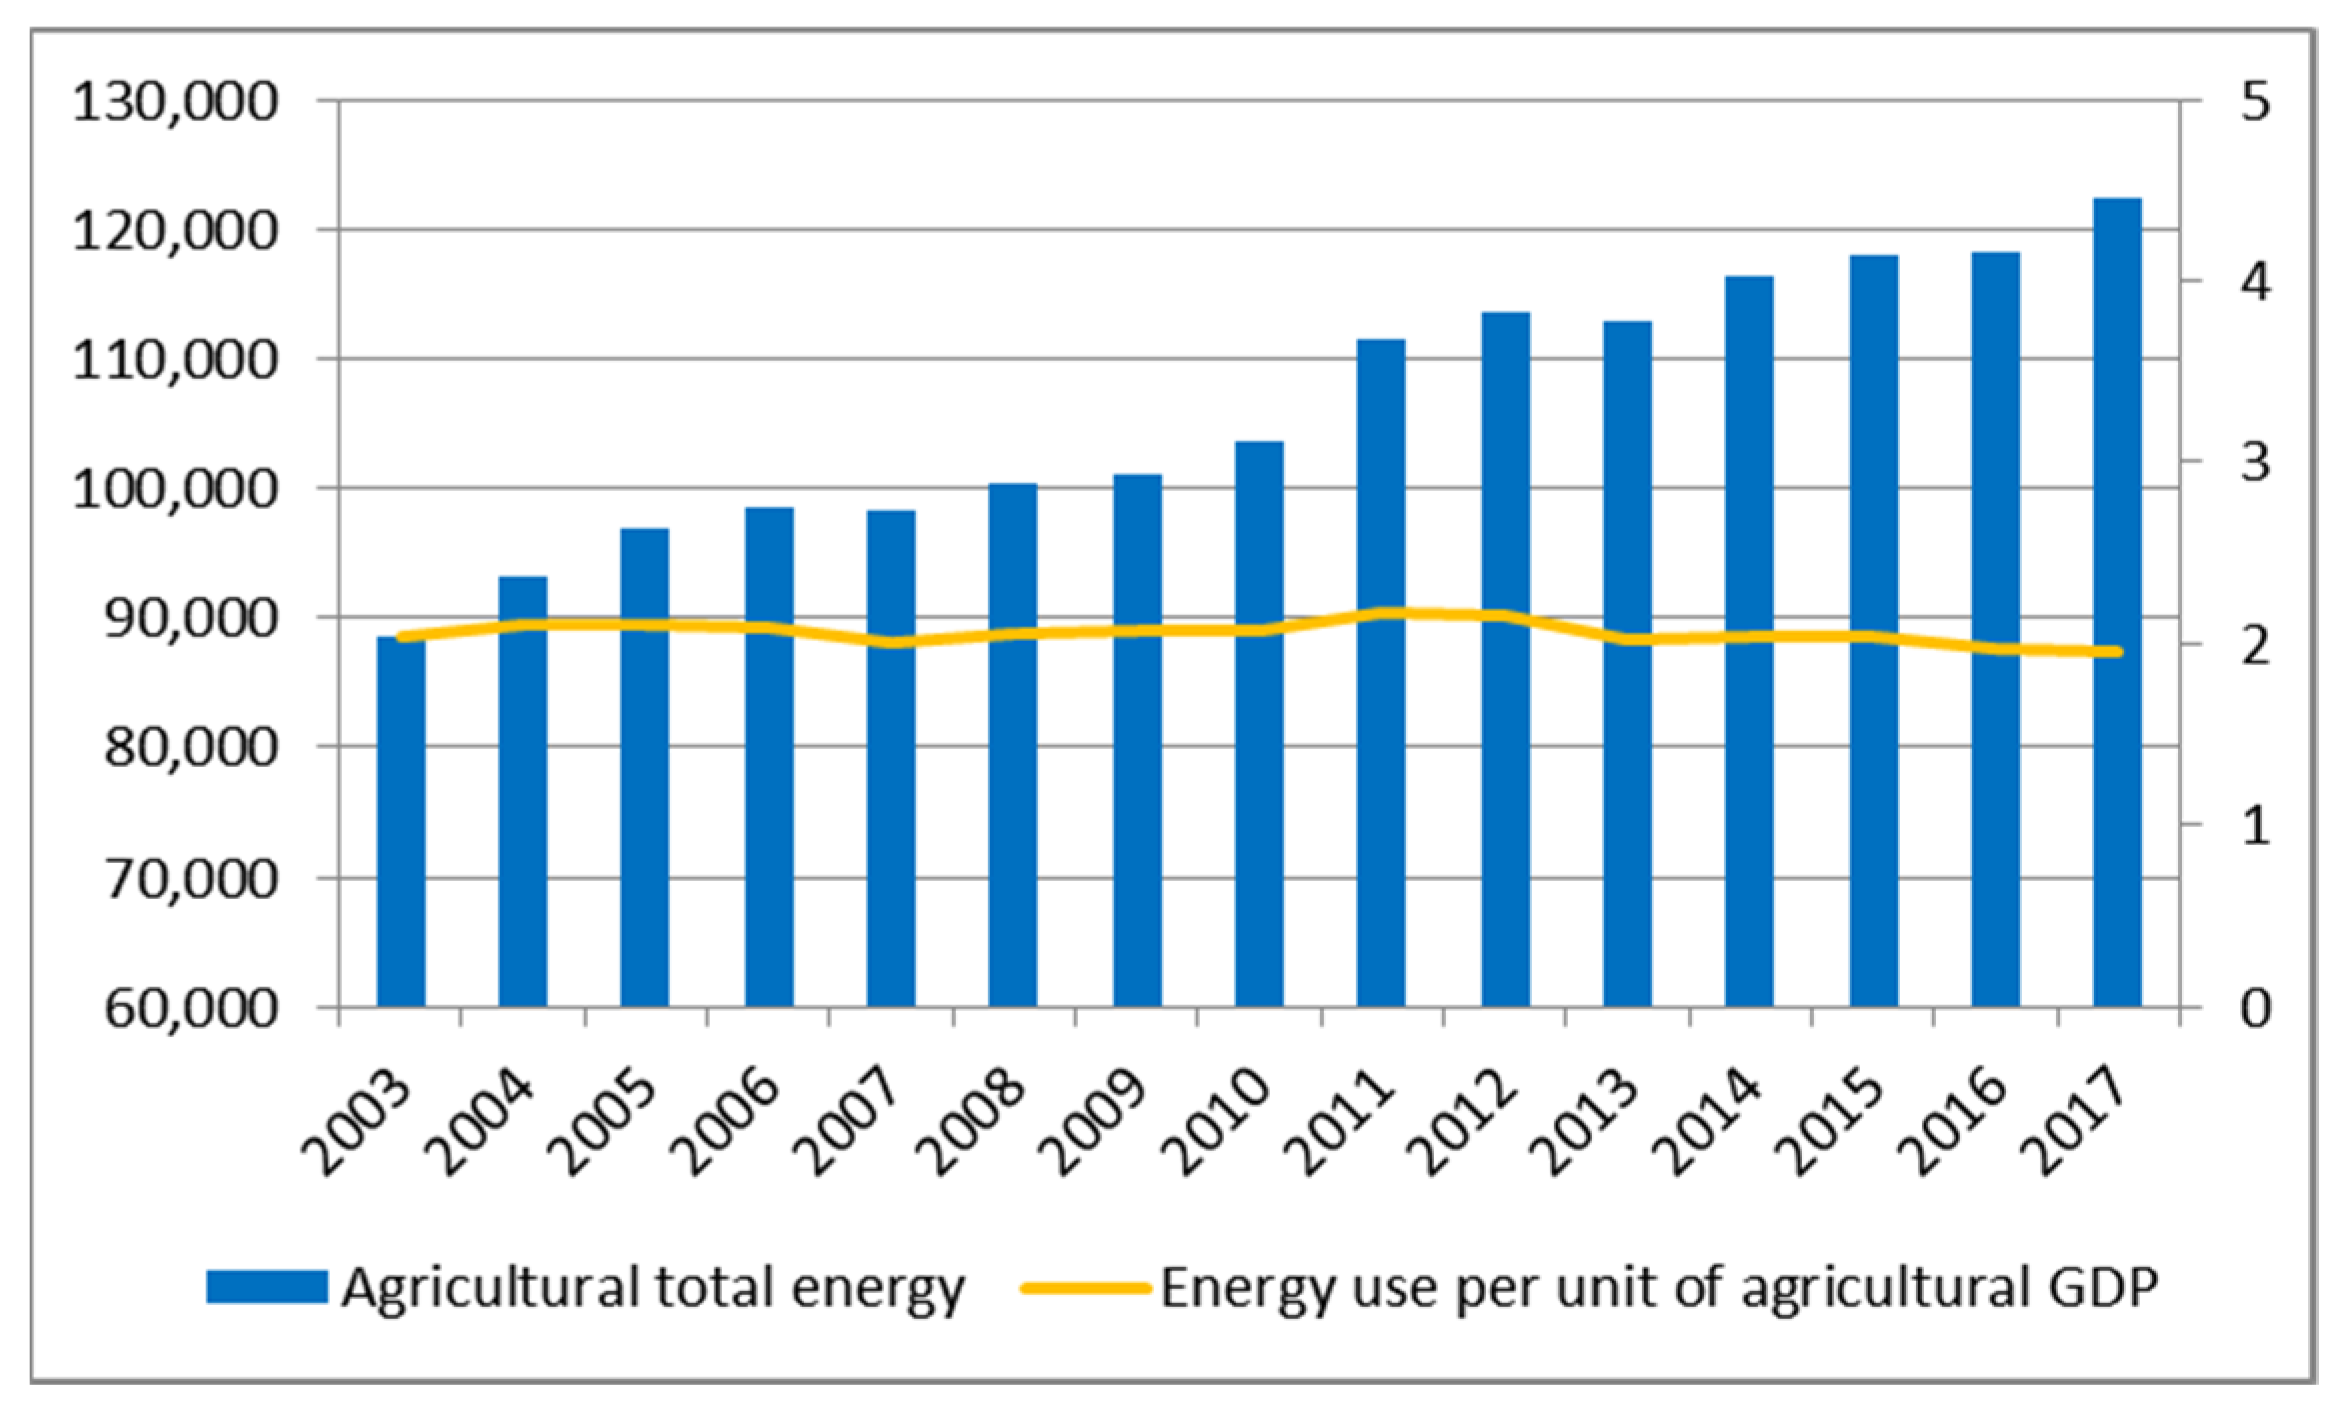
Figure 1. Agricultural energy use and energy use per unit of agricultural GDP in emerging economies. Data source: Agricultural total energy from the International Energy Agency and agricultural GDP from the FAOSTAT database. Energy use per unit of agricultural GDP is calculated by dividing the agricultural total energy by the agricultural GDP.
Agriculture 11 00773 g001
Figure 2. Comparison of energy efficiency in different continents. Data source: energy efficiency from the estimation according to Equation (7).
Agriculture 11 00773 g002
Figure 3. Energy-saving potential in different continents. Data source: energy-saving potential from the estimation according to Equation (8).
Agriculture 11 00773 g003aAgriculture 11 00773 g003b
Table 1. Results of the estimation.
VariablesModel 1Model 2Model 3Model 4
Constant0.466 ***1.077 ***0.303 ***0.231 ***
lnY−0.359 ***−0.071 ***0.1340.322 ***
lnK0.667 ***0.716 ***0.579 ***0.503 ***
lnL0.198 ***0.048 ***−0.080 *−0.292 ***
lnY × lnY−0.355 **−0.282 ***−0.527 ***−0.558 ***
lnK × lnK0.244 ***0.228 ***0.178 ***0.098 ***
lnL × lnL0.0090.034 **−0.0150.025
lnY × lnK0.087 *0.095 ***0.244 ***0.359 ***
lnK × lnL0.0100.038 ***−0.183 ***−0.322 ***
lnY × lnL0.010−0.074 *0.179 **0.270 **
T −0.071 ***−0.031 **−0.038 ***
T × T 0.003 ***0.0010.002
T × lnY −0.029 ***−0.017 **−0.014 *
T × lnK 0.005 ***0.001−0.005
T × lnL 0.010 ***0.009 **0.011 ***
H 0.622 ***0.137 *
M 0.346 ***0.390 ***
H × lnY −1.775 ***
M × lnY −0.267 **
H × lnK 0.945 ***
M × lnK 0.089
H × lnL 0.721 ***
M × lnL 0.270***
sigma-squared0.667 ***0.824 ***0.362 ***0.303 ***
gamma0.947 ***1.000 ***0.780 ***0.835 ***
log likelihood−371.91−333.86−298.73−226.14
AIC761.82695.72629.46496.28
BIC800.44755.80698.13590.69
Note: *, ** and *** represent 10%, 5% and 1% significance, respectively.
Table 2. Energy efficiency in the agricultural sector of emerging economies (1998–2017).
AsiaEnergy EfficiencyEuropeEnergy EfficiencyLatin AmericaEnergy Efficiency
China0.723Bulgaria0.810Argentina0.754
India0.761Czech0.833Brazil0.597
Indonesia0.430Estonia0.865Colombia0.564
Pakistan0.494Greece0.591Dominican Rep.0.740
South Korea0.749Hungary0.693Mexico0.747
Thailand0.875Latvia0.641Peru0.644
Turkey0.741Lithuania0.678Uruguay0.512
Vietnam0.764Poland0.783
Romania0.716
Russia0.783
Slovakia0.626
Ukraine0.795
Median0.744Median0.750Median0.644
Table 3. Classification discussion of emerging economies.
High Input [4500, 45,000]Middle Input [800, 4500)Low Input (0, 800)
High efficiency [0.8, 1] ThailandBulgaria, Czech, Estonia,
Middle efficiency [0.6, 0.8)China, India, RussiaArgentina, Mexico, Poland, South Korea, Turkey, UkraineDominican Rep., Hungary, Latvia, Lithuania, Peru, Romania, Slovakia, Vietnam
Low efficiency [0.4, 0.6)BrazilColombia, Greece, IndonesiaPakistan, Uruguay
Table 4. Energy-saving potential in the agricultural sector of emerging economies (1998–2017).
ContinentsCountriesESP (Mtoe)ESP per Agricultural Land (toe/sq.km)
AsiaChina175.531.55
AsiaIndia88.912.47
AsiaIndonesia30.642.96
AsiaPakistan7.791.55
AsiaSouth Korea11.003.16
AsiaThailand8.111.90
AsiaTurkey18.352.31
AsiaVietnam2.751.34
EuropeBulgaria0.820.83
EuropeCzech1.912.34
EuropeEstonia0.271.61
EuropeGreece5.253.45
EuropeHungary3.423.01
EuropeLatvia0.972.83
EuropeLithuania0.691.23
EuropePoland17.225.49
EuropeRomania2.080.78
EuropeRussia43.550.91
EuropeSlovakia1.143.04
EuropeUkraine7.580.89
Latin AmericaArgentina15.210.48
Latin AmericaBrazil68.901.52
Latin AmericaColombia8.741.09
Latin AmericaDominican Rep.0.601.25
Latin AmericaMexico16.190.67
Latin AmericaPeru3.170.67
Latin AmericaUruguay2.010.68
Table 5. Agricultural energy efficiency and energy-saving potential in the classification of energy efficiency (1998–2017).
High-Efficiency CountriesMiddle-Efficiency CountriesLow-Efficiency Countries
YearAEETotal ESP (Mtoe)AEETotal ESP (Mtoe)AEETotal ESP (Mtoe)
19980.8390.640.73920.020.4787.94
19990.8520.590.74519.820.4917.98
20000.8520.580.71121.920.4977.88
20010.8860.560.69821.040.5117.79
20020.8930.520.71422.040.5257.52
20030.8890.530.70721.390.5457.30
20040.8860.500.73819.940.5637.31
20050.8790.520.73218.430.5697.13
20060.8800.510.73117.570.5736.68
20070.8700.500.72917.180.5686.27
20080.8350.530.71617.590.5865.73
20090.8080.560.69119.170.5916.08
20100.8130.550.69219.930.5885.29
20110.8310.560.73317.810.6014.98
20120.8270.570.72919.060.5655.18
20130.8280.550.73919.480.4874.69
20140.8270.550.73120.500.4764.39
20150.8260.540.74023.030.4904.27
20160.8070.600.75425.310.4704.52
20170.8000.660.74627.140.4564.39
AEE0.74Cumulative ESP (Mtoe)542.80
Table 6. Result of the Tobit quantile model.
VariablesQuantiles
0.100.250.500.750.90
Intercept0.915
[0.789, 1.050]
0.919
[0.829, 1.010]
0.953
[0.842, 1.048]
0.883
[0.814, 0.958]
0.890
[0.818, 0.954]
upop−0.429
[−0.554, −0.308]
−0.308
[−0.403, −0.206]
−0.326
[−0.428, −0.224]
−0.124
[−0.201, −0.053]
−0.047
[−0.111, 0.017]
gdppc−1.074
[−1.546, −0.537]
−0.791
[−1.219, −0.447]
−0.199
[−0.426, 0.011]
−0.235
[−0.426, −0.026]
−0.244
[−0.400, −0.085]
ecostru−1.941
[−2.415, −1.492]
−1.459
[−1.818, −1.115]
−1.320
[−1.610, −0.999]
−0.837
[−1.184, −0.494]
−0.396
[−0.655, −0.111]
enemix0.005
[−0.062, 0.092]
0.132
[0.066, 0.195]
0.204
[0.157, 0.250]
0.167
[0.122, 0.209]
0.118
[0.086, 0.153]
pesti−0.029
[−0.083, 0.027]
0.035
[−0.017, 0.077]
0.035
[0.011, 0.056]
0.010
[−0.008, 0.033]
−0.015
[−0.030, 0.005]
land0.250
[0.146, 0.357]
−0.003
[−0.080, 0.094]
−0.044
[−0.112, 0.028]
−0.033
[−0.087, 0.016]
−0.061
[−0.110, −0.012]
Pseudo R20.0830.0930.0930.0630.074
Note: 95% credible intervals in parentheses. The bold indicate that the posterior probability is nonzero to select variables.
Publisher’s Note: MDPI stays neutral with regard to jurisdictional claims in published maps and institutional affiliations.