Article

Heading Uniformity: A New Comprehensive Indicator of Rice Population Quality

1
Crop Ecophysiology and Cultivation Key Laboratory of Sichuan Province, Rice Research Institute, Sichuan Agricultural University, Chengdu 611130, China
2
College of Agronomy, Sichuan Agricultural University, Chengdu 611130, China
3
Institute of Rice and Sorghum, Sichuan Academy of Agricultural Sciences, Deyang 618000, China
4
Sichuan Provincial Meteorological Service, Chengdu 610072, China
*
Author to whom correspondence should be addressed.
The authors contributed equally to this work.
Agriculture 2021, 11(8), 770; https://doi.org/10.3390/agriculture11080770
Submission received: 15 July 2021 / Revised: 9 August 2021 / Accepted: 11 August 2021 / Published: 12 August 2021

Abstract

:
Productive tiller percentage (PTP) is the only available comprehensive indicator of rice population quality. However, productive panicle number (PN) has a great effect on its characterization accuracy. Panicle exsertion is an important but difficult to describe morphological index; therefore, it cannot be easily determined. The aims of this study were to develop heading uniformity (HU), which describes the difference in the degree of rice panicle exsertion, as a new comprehensive indicator by designing a representative sampling and calculation method and exploring the relationship between HU and yield components. HU first decreased then increased after initial heading, exhibiting a single-valley curve. Adequate HU was obtained by panicle sampling on day two or three (panicle N fertilizer proportion ≤40 or >40%) after initial heading. The explanatory power of PTP for grain yield variance was markedly insufficient in low- and high-PN rice populations. Compared with the percent contribution of PTP to grain yield variance (12.32–41.26%), that of HU (49.02–61.93%) was greater and more stable across rice populations of different PNs. Moreover, HU showed fewer interannual variations, despite large interannual differences in weather and soil conditions. Hence, HU may have applications as a comprehensive indicator of rice population quality.

1. Introduction

Rice population quality is the basic theory that ensures high rice yields in China. In this theory, the optimum panicle number (PN) and productive tiller percentages (PTPs) of 70–80% (Indica rice) and 80–90% (Japonica rice) are used as comprehensive indicators of the quality of high-yield rice populations [1,2]. As it is not easy to determine the optimum PN of rice populations in different environments, there is large uncertainty in selecting a proper range of PTP to guide the cultivation of high-quality rice populations [3,4,5]. Therefore, deeper insights into the relationships between rice population characteristics and grain yields, as well as a thorough analysis of comprehensive indicators that generate high-yielding rice populations, would be of great value for developing an indicator system of rice population quality and improving the current theory of cultivation.
The theory of rice population quality involves seven basic quality indicators, including the total photosynthetic production of rice population during the productive phase, optimum leaf area index (LAI), spikelet number per plant (SN), and grain–leaf ratio [1,6,7]. Although these indicators can only be used to determine whether a rice population meets the “high-yield” requirements and design specifications, they are all closely related to a PTP-centered comprehensive quality indicator. Among the seven basic indicators, LAI, SN, grain–leaf ratio, effective and high effective leaf area percentage, single stem-sheath weight, and spikelet-root activity are the most reflective of the rice population quality at the heading stage. Hence, morphological features of rice plants at the heading stage are reliable indicators of population quality. Extensive studies have been conducted to explore the relationship between heading and grain yield. Panicle exsertion and the uppermost internode play critical roles in regulating the heading stage and controlling water and nutrient transport efficiency from the leaves and stems to the grains. The drought-induced inhibition of panicle exsertion has been attributed to a decrease in uppermost internode elongation, which can usually account for 70–75% of spikelet sterility [8,9,10,11,12]. Previous studies have reported that the elongation rate of the uppermost internode is the fastest at four days before flowering and slows down after flowering under normal conditions. However, the uppermost internode elongation is blocked by leaf water deficit, which has a significant negative correlation with grain yield (−0.40**) [13]. Under severe environmental conditions, panicle exsertion is responsible for enhanced spikelet sterility [14,15,16]. Kobayasi et al. reported that air temperature, solar radiation, and atmospheric vapor pressure explain approximately 40% of the observed variation in panicle heading [17]. Panicle exsertion and the uppermost internode are not only sensitive to adverse environments but also vary among different tillers of the same rice plant, with the elongation rate of the uppermost internodes being generally higher in early initiated tillers than in late-initiated tillers [12]. Therefore, the uppermost internode elongation reflects the morphological and physiological differences between different tillers, in addition to being sensitive to the external environment.
Rice breeders refer to the uppermost internode elongation as the “fourth genetic element” of hybrid rice [18], and based on this trait, they have been searching for and using the elongated uppermost internode genes to improve yields of hybrid seeds [19,20]. Despite its close relationship with grain yield, the uppermost internode elongation requires a complicated measurement process, which is difficult to implement in practice for the cultivation of high-yield rice, thereby ruling out the uppermost internode elongation as a practical comprehensive indicator of rice population quality.
Uniformity is an important trait in crop populations. To date, most studies have shown that population uniformity (including plant height, tiller number per plant (TN), and panicle length) of low-TN crops, such as corn, is closely related to grain yield, whereas that of high-TN crops, such as rice and wheat, has a weak relationship with grain yield [21,22,23]. Lei et al. [24] used the reciprocal of coefficient of variation as a uniformity indicator to investigate the uniformity of tiller dry weight per plant in rice and found that the uniformity indicator shows an increasing trend as the growth period progresses, reaching a maximum value after full heading and then remains stable. Under extremely sparse planting conditions, the rice TN is relatively large and the panicle weight of early initiated tillers is prone to reach the upper limit of the rice cultivar. Tiller dry weight per plant and panicle weight per plant do not have a simple linear relationship. The uniformity of tiller dry weight per plant significantly affects grain yield. Zhang et al. [25] proposed that the practices of promoting the tillering capacity per plant, increasing the PTP, and reducing the occurrence of nonproductive tillers and small tillers are all beneficial for improving the heading uniformity (HU) and increasing the grain yield of the population. This study, however, used the heading duration to represent HU without considering differences in the heading moments of different panicles. Therefore, an in-depth quantification of the relationships between HU and grain yields is beyond the capability of HU represented by heading duration. To overcome these limitations, a method to describe the differences in rice heading processes in detail is required to quantify the relationships between the PN, single panicle weight (SPW), and HU and elucidate the underlying mechanisms through which HU characterizes the quality of rice populations.
The difference in the uppermost internode elongation of single hull rice during the heading stage leads to discrepancies in the state of panicles exserting from the flag leaf sheath at the same time. From a purely mathematical point of view, this discrepancy can be expressed as a value with a reasonable calculation method. Because heading is a continuous, dynamic process, representative maximum and minimum values of HU can be determined. Although it is difficult to accurately obtain the maximum and minimum HU, it is possible to approximate them by shortening the sampling intervals. In summary, the HU obtained through mathematical calculations can be applied to rice production.
Although rice population quality has been determined previously using various methods, the role of HU in rice population quality has not been elucidated. Therefore, we aimed to verify whether HU was a suitable comprehensible indicator of rice population quality. To achieve this goal, we mainly focused on the following three aspects: (1) determination of the representative HU sampling time using a newly proposed HU calculation method; (2) exploration of the internal relationship between HU and grain yield formulation by studying the relationships between HU and PN (SPW); and (3) comparison of HU and PTP (a widely used comprehensive rice population quality indicator) to verify the ability of HU to characterize rice population quality.

2. Materials and Methods

2.1. Location of the Study

The current study included three field experiments, all conducted at the experimental farm of the Rice Research Institute of Sichuan Agricultural University, Wenjiang District, Chengdu, Sichuan Province, which is the only major grain-producing area in Southwest China (30°43′ N, 103°47′ E). Experiments 1–3 were conducted in 2013, 2017, and 2018, respectively. Meteorological data of rice seasons were obtained from the Sichuan Meteorological Bureau (Table 1). Likely due to the intensification of climate change, the climate conditions of the three test years were not stable, and there was a certain difference from the average values for 2000–2020. Both of the fields where experiments 1 and 2 were conducted comprised sandy loam and had been previously used for the cultivation of rapeseed. For experiment 1, rice seeds were sown on April 9, followed by seedling transplantation on May 12 and crop harvest on September 6. For experiment 2, rice seeds were sown on April 7, followed by seedling transplantation on May 8 and crop harvest on September 10. Experiment 3 field comprised sandy soil and had been previously used for the cultivation of wheat; rice seeds were sown on April 13, followed by seedling transplantation on May 20 and crop harvest on September 16. No fertilizer was applied during the cultivation of rapeseed in field 2, thereby leading to low soil fertility during the rice season. The nutrient content of the surface soil of the experimental fields is shown in Table 2.

2.2. Rice Varieties

In experiment 1, hybrid rice varieties ‘Chuan Nong You 498’ (C498) and ‘Chuan You 6203’ (C6203) were used as the experimental cultivars, with C498 producing low PNs but large panicle and C6203 producing high PNs but small panicle. In experiments 2, 3, and 4, the hybrid rice varieties ‘Long Liang You 1206’ (L1206), ‘Y Liang You 1’ (Y1), ‘Yi Xiang You 2115’ (Y2115), and ‘F You 498’ (F498) were used as the experimental cultivars, with Y2115 and L1206 producing high PNs but small panicles and Y1 and F498 producing low PNs but large panicles [26]. The above six varieties are all national registered hybrid rice cultivars with synchronized jointing and heading stages, and they can be grown in all rice production areas in China.

2.3. Experimental Design

Experiment 1, conducted in 2013, was a two-factor split-plot design of rice variety × nitrogen management. The field was divided into two main plots, one for C498 and the other for C6203. Each main plot was further divided into a number of subplots for four different ratios of basal-tillering fertilizer to panicle fertilizer, namely 75:25, 60:40, 45:55, and 30:70, thereby totaling eight treatments. Each treatment was implemented in triplicate, and each subplot had dimensions of 3.5 m × 4 m (14.0 m2 in area). The implementation of experiment 2, which used four hybrid rice varieties, was to verify the results of experiment 1; the treatments were the same as those in experiment 1.
Experiment 3 was a repetition of experiment 4. Both experiments were conducted with a two-factor split-plot design of rice variety × nitrogen management. L1206, Y1, Y2115, and F498 were subjected to three nitrogen managements; i.e., farmers’ usual management, leaf age fertilization management, and uniform fertilization management (Table 3), thereby totaling 12 treatments. Each treatment was implemented in triplicate, and each subplot had dimensions of 4.5 m × 5 m (=22.5 m2 in area).
The transplanting density of rice seedlings in all three experiments was 33.3 cm × 16.7 cm. Along with nitrogen fertilizer, P2O5 and K2O were used as basal fertilizers at application rates of 75 and 150 kg hm−2, respectively. The nitrogen, phosphorus, and potassium fertilizers used in the experiments were urea (containing 46% N), superphosphate (containing 12% P2O5), and potassium chloride (containing 60% K2O), respectively. Controlled irrigation was applied to ensure proper water management [27]. Reasonable field management was conducted during the experiments, and there was no obvious flooding, drought, pests, or parasitic weeds throughout the growth period.

2.4. Experimental Items and Methods

2.4.1. PTP

In experiments 3 and 4, seven days after the seedlings had been transplanted, 20 uniformly grown rice plants were selected in each subplot and labeled. For each labeled seedling, the number of tillers was recorded every seven days until the number increased to the maximum and did not change further; this seedling was referred to as the maximum-tiller seedling. PTP was calculated as the ratio of the number of productive tillers, which was defined as the tillers with productive panicles to the maximum number of tillers.

2.4.2. HU

In experiments 1 and 2, when the tips of the flag leaves on the main stem were at the same level as the tips of the top second leaves (about seven days before panicles emerged), 20 rice plants in the same growth state were selected in each subplot according to the mean number of tillers and then labeled. Starting from the initial heading day (when 10% rice panicles exserted to 2 cm from the flag leaf pulvinus; set as the first day [D1]), three rice plants were selected on each day for measurement, and this procedure continued for six consecutive days for determining HU. Specifically, each rice plant was measured for the panicle length L (from the panicle tip to the panicle neck node excluding the awn length) and distance D between the panicle top to the flag leaf pulvinus. When the panicle tip emerged, D was a positive value; otherwise, it was a negative value. For a single rice plant, its HU could be calculated by substituting the measured values of L and D into Formulas (1)–(4). The mean HU of representative rice plants is defined as the HU of the rice population.
X = D D min L
X ¯ = 1 N i = 1 N X i
S = X 2 ( X ) N 2 N 1
H U = ( 1 S X ) × 100
where Dmin represents the D of the tiller with the shortest uppermost internode length in a hill, X represents the degree of panicle exsertion relative to the slowest-growing tiller, X ¯ represents the mean of the set of values of X, N represents the number of productive panicles in a hill, and S represents the standard deviation of the set of values of X. The optimal sampling time for experiments 3 and 4 refers to the results of experiments 1 and 2.

2.4.3. Yield and Yield Components Measurement

At the maturity stage of experiments 3 and 4, five plants were selected in each subplot according to the average PN to measure yield components. Grain yield was determined from all remaining plants for each plot and adjusted to the standard moisture content of 0.135 g H2O g1.

2.5. Data Processing

Statistical analysis was performed using Microsoft Excel 2010 (Microsoft Corp., Redmond, WA, USA) and IBM SPSS Statistics V27.0 (IBM Corp., Armonk, NY, USA), and relative weight analysis was performed following the method of Johnson et al. [28]. Specifically, a set of independent variables (Xj) was transformed into a set of orthogonal variables (Zk) on which the dependent variable Y was regressed to obtain a set of coefficients (βk), while each independent variable (Xj) was regressed on Zk to obtain a set of regression coefficients (λjk). The relative weight of each independent variable Xj on Y is described by the following equation:
εj = λj12β12 + λj22β22 + … + λjk2βk2
Data plotting was performed using Origin Pro 9.0.0 SR2 (OriginLab Corp., Northampton, MA, USA).

3. Results

3.1. Dynamic Changes in Rice HU at the Heading Stage

Figure 1 and Figure 2 show single-valley curves in rice HU on each day after the initial heading. The HU of low-PN varieties (C498, F498, and Y1) was higher than that of high-PN varieties (C6203, Y2115, and L1206). As heading advanced, HU initially decreased and then increased, reaching a maximum value (approximately maximum; the same below) at the end of heading and then remained stable. The minimum HUs of C498, F498, and Y1 (approximately minimum; the same below) appeared on D2 in the treatments with 25% panicle fertilizer and 40% panicle fertilizer and D3 in the treatment with 55% panicle fertilizer and 70% panicle fertilizer after the initial heading. Moreover, the HU increased with the increasing proportion of panicle fertilizer to total fertilizer. The trends for the HU of C6203, Y2115, and L1206 after the initial heading and their relationships with nitrogen management were similar to those of the low-PN varieties. In contrast, the effects of nitrogen management on maximum HU varied dramatically between the two types of varieties. Maximum HU varied dramatically among nitrogen managements in C6203, Y2115, and L1206, gradually increasing with the increase in panicle fertilizer proportion. In contrast, maximum HU among nitrogen managements in C498, F498, and Y1 showed little variation, demonstrating the weak effects of nitrogen management in this variety. The appearance of maximum HU of a rice plant coincided with the completion of panicle exsertion of the plant, and the value of D-Dmin tended to be the same among tillers at this time point, making the HU only reflective of the panicle length difference among tillers and independent of the elongation rate and degree of the uppermost internode.

3.2. Varied PTPs and HUs of Different Rice Populations

Unlike PTP, minimum HU, which was obtained on D2 after the initial heading (and hereafter referred to as HU for simplicity, unless otherwise specified), showed no significant difference over the years; thus, HU is more stable than PTP. The 2020 rice season had more rainfall and higher basal soil fertility than the 2019 rice season (Table 1 and Table 2), which were beneficial to tillering. As sunshine hours and diurnal temperature in 2020 were lower than those in 2019, the PN in 2020 was significantly lower to that in 2019; this, coupled with varied tillers, resulted in a significantly different PTP between 2019 and 2020. The interaction effects between year and variety (nitrogen management) and those among year, variety, and nitrogen management had no significant effect on grain yield, PN, SPW, PTP, and HU (Table 4); therefore, this study averaged the test data in 2019 and 2020 for statistical analysis.
Multiple comparisons of PN, SPW, and grain yield showed that F498 and Y1 produced higher yield (12.79% average), larger SPW (22.04% average), and lower PN (7.58% average) than L1206 and Y2115 (Table 5). Among PN, SPW, and grain yield, only PN varied significantly between 2019 and 2020 (Table 4), which was consistent with the performance of PTP. Thus, PN was used in the current study to classify rice populations as follows: (1) the F498 population had the lowest PN and was, thus, referred to as the low-PN population; (2) the Y2115 population had the highest PN and was, thus, referred to as the high-PN population; and (3) the L1206 and Y1 populations had moderate PNs and were, thus, referred to as the moderate-PN population.
Among different varieties or nitrogen fertilizer managements, the trends of grain yields were consistent with HUs but varied greatly with PTPs. In the current study, HU was 45.45–46.36 in high-yielding treatments (with a yield ≥9750 kg ha−1, which was 20% higher than the local average yield), but was only 26.29–28.48 in the low-yield treatment (with a yield ≤8250 kg ha−1, which was similar to the local average yield), confirming that rice populations with higher yields had higher HUs.

3.3. Comparison of the Percent Contribution of PTP and HU to Grain Yield Variance

Relative weight analysis overcomes the problem of collinearity among independent variables, and the sum of the percent contributions of each independent variable to the dependent variable is equal to the coefficient of determination (R2). With PN and SPW (PTP and HU) as the independent variables and grain yield as the dependent variable, a relative weight analysis was performed (Table 6). The results showed that both PN and SPW determined grain yield, but the former had a far lower percent contribution than the latter to grain yield variance; the PN to SPW percent contribution ratio was 8.87 to 37.55%. Although a high number of productive panicles was noted (Y3724 in 2018), the PN contributed least to grain yield variance. In contrast, PTP and HU jointly contributed to 74.25 to 96.19% of grain yield variance, with PTP having a lower percent contribution than HU. In the moderate-PN populations, the percent contributions of PTP to grain yield variance were 80.58 and 75.08% by HU for Y1 and L1206, respectively; however, these values decreased to only 19.89 and 45.72% in the high- and low-PN populations, respectively, indicating that the explanatory power of PTP for grain yield variance was quite limited in the high- and low-PN populations. In contrast, the percent contribution of HU to grain yield variance was relatively stable across populations with different PNs, indicating that HU is more accurate and stable than PTP in predicting grain yield variance.
Relative weight analysis was further performed using PN and SPW as the independent variables and PTP and HU as the dependent variables (Table 7). PN and SPW contributed to a higher percentage of HU variance than PTP variance, indicating that HU is a better indicator of grain yield components than PTP. The R2 of PTP by PN and SPW differed dramatically from that of HU by PN and SPW in the low- and high- PN populations, which were 26.40 and 17.59%, respectively. In contrast, this difference was not more than 5% in the moderate-PN populations. This discrepancy suggested that the HU of low- and high-PN populations is more reflective of grain yield components than that of moderate-PN populations. In the low-PN population, SPW had a much higher percent contribution to PTP and HU than PN. In the high-PN population, SPW still had a much higher percent contribution to HU than PN, but the percent contribution to PTP decreased to only 33.86% of the percent contribution of PN. In various rice populations, HU comprised more information on grain yield components than PTP.

4. Discussion

4.1. HU Change Pattern and Optimal Sampling Time at the Heading Stage

Panicle elongation stops before heading, and the heading process of rice plants is controlled by uppermost internode elongation, with differences in the elongation rate determining the differences in heading traits among different environmental conditions or genotypes [29,30]. Previous studies have shown that the elongation rate of the uppermost internode exhibits a single-peak curve pattern. Ji et al. [29] pointed out that the acceleration of the uppermost internode elongation starts when panicles begin to exsert from the flag leaf sheath and reaches a maximum value 1–3 days after the initial heading. He et al. [30] reported that under normal water conditions, the elongation of the uppermost internode accelerates one day before panicle emergence, and the elongation rate is maximum within a time window of one day before the initial heading to four days after the initial heading. Drought stress inhibits the uppermost internode elongation, delaying this time window to 1–4 days after the initial heading. As shown by equations A–D (Section 2.4.2), the magnitude of rice HU is determined by the difference in the degree of panicle exsertion, with a smaller difference leading to a larger HU value. Under normal growth conditions, accelerated elongation of the uppermost internode generally occurs when the uppermost internode length is approximately 5 cm [23]. At this time point, the uppermost internode length is generally short, and the difference in the degree of panicle exsertion is relatively small among different productive panicles, thereby leading to a large HU. As the panicle exsertion process accelerates, the elongation rate of the uppermost internode may reach 5–6 cm day−1. During this period, a higher difference in the degree of panicle exsertion would lead to a smaller HU value, and the minimum HU in the process is reflective of the largest difference in the degree of panicle exsertion. As more panicles exsert, the degree of exsertion of one panicle gradually approaches that of another one, and this decrease in the difference of exsertion leads to an increase in HU. When the panicle exsertion process is completed, the difference in the degree of panicle exsertion is minimal and remains stable. At this time point (Equations A–D), the maximum HU is almost only reflective of the difference in panicle length. In experiments 1 and 2, HU first decreased and then increased as the heading proceeded, which was consistent with the formula-based prediction. Moreover, the minimum HU was on D2 and D3 after the initial heading, which was consistent with the reported time window of the fastest uppermost internode elongation in studies by Ji et al. [29] and He et al. [30]. Therefore, to compare rice HU among different environmental conditions or varieties, it is recommended to conduct sampling and measurement 2 (the proportion of panicle fertilizer is not higher than 40%) or 3 (the proportion of panicle fertilizer is higher than 40%) days after the initial heading.

4.2. Comparison of HU Among Different Rice Populations

The elongation rate of the uppermost internode is generally lower in late-initiated tillers than in early initiated tillers, and the uniformity of rice panicle size decreases with the increase in late-initiated, high-order tillers [12,31]. The rice varieties C6203, Y2115, and L1206 with high PN also exhibited large differences among panicles, and their HUs were significantly lower than those of C498, F498, and Y1 during the whole heading stage. The difference in minimum HU between the two types of rice varieties was far greater than the difference in maximum HU, further confirming the rationality of using the minimum HU as the representative HU to reflect the difference in heading among rice populations. As the maximum HU is almost only reflective of the difference in panicle length, the greater the difference in panicle length, the smaller the maximum HU. Prior studies have shown that the effect of nitrogen application on yield components is greater in multipanicle type rice varieties than in large-panicle type varieties [32,33]. An increase in panicle fertilizer proportion promoted the growth of panicle size more greatly on the late-initiated tillers of the small-panicle varieties C6203, Y2115, and L1206 than on those of the large-panicle varieties C498, F498, and Y1, which decreased the difference in panicle length, thereby making the maximum HU even greater in treatments with a higher panicle fertilizer proportion. However, the regulatory effects of panicle fertilizer on panicle length were weak in the C498, F498, and Y1 populations because of their large panicle size, and there was almost no difference in maximum HU among treatments. Although the effects of panicle fertilizer on maximum HU were different between the two types of rice varieties, high proportions of panicle fertilizer enhanced nitrogen metabolism at the booting stage and weakened the demand for carbon metabolism at the heading stage, resulting in heading delay in both rice varieties. Specifically, panicle fertilizer proportions of 55 and 70% delayed the acceleration of the uppermost internode elongation and, thus, the arrival of minimum HU.

4.3. Comparison Between HU and PTP with Respect to Grain Yield

Extensive studies have shown that PN is positively correlated with grain yield and that the effects of SPW on grain yield increase as temperature and light conditions improve [34,35]. The current results showed that the effects of PN and SPW on grain yield varied among rice varieties and nitrogen managements and that the effect of PN was less than that of SPW, which was closely related to the ecological environment and production characteristics of the rice area in the Sichuan Basin. The rice area in the Sichuan Basin is subject to low sunshine hours and high humidity [36], which leads to limited PN in the paddy fields. Therefore, high-yield rice breeding in this area is centered on increasing SPW, whereas high-yielding cultivation prefers sparse planting, the maintenance of a certain number of productive panicles, and an increase in the number of spikelets per panicle [37,38]. Under the dual constraints of environmental conditions and technical capacities, the possibility for PN to affect yield is diminished whereas the role of SPW is prominent. The results of the current study showed that the largest differences in PN among different nitrogen managements were 8.40, 10.40, and 13.56% for high-, moderate-, and low-PN populations, respectively. In contrast, the largest differences in SPW among the different nitrogen managements were 25.45, 17.62, and 23.74% for these rice populations, respectively. This observation suggested that SPW was regulated to a greater extent than PN, which established a foundation for further improvement in rice grain yield. Indicators more closely related to SPW will provide a more accurate characterization of rice grain yield.
High PTP with suitable PN is a key requirement for regulating high-yield rice populations [7]. Without suitable PN, high PTP may not represent excellent population quality [39], as substantiated by the observation in the current study that there was a dramatic decline in the explanatory power of PTP for grain yield in the low and high-PN rice populations. Within the low-PN population, PTPs under various nitrogen managements showed no significant difference. Accordingly, the relative weight analysis showed that the percent contribution of PN to PTP was less than that of SPW. In contrast, when PN was high (Y2115 population), nitrogen management had a significant effect on PTP, with PN having a greater percent contribution to PTP than SPW. This discrepancy implied that PTP would be greatly affected by the size of the rice population and that the PTP of a large rice population would likely be reflective of a high number of productive panicles. Accordingly, owing to the decrease in the effects of PN on grain yield, the relationship of PTP with grain yield would also decrease. For example, in the Y2115 population, the percent contribution of PN to PTP was nearly three times that of SPW, and both PN and PTP explained a lower percentage of grain yield variance, with the former explaining 8.15% and the latter explaining 12.32%, whereas HU explained 61.93%, indicating that HU was more closely related to grain yield.
In summary, as a comprehensive rice population quality indicator, HU had the following three advantages. First, the interannual differences in light and temperature resources and basal soil fertility did not lead to significant changes in HU, thereby establishing a stable foundation for the use of HU as a universal indicator to compare rice populations over time and space. Second, HU contained a wealth of information on PN and SPW, both of which are biological traits closely related to grain yield. Third, as the PN of a population increased, PTP and HU decreased. As the percent contribution of PN to grain yield variance dramatically decreased, the percent contribution of HU to grain yield variance increased to nearly six times that of PTP. This indicated that HU was closely related to grain yield when the PN of a population changed, reflecting the potential of HU as a highly accurate and highly stable indicator of rice population quality.

5. Conclusions

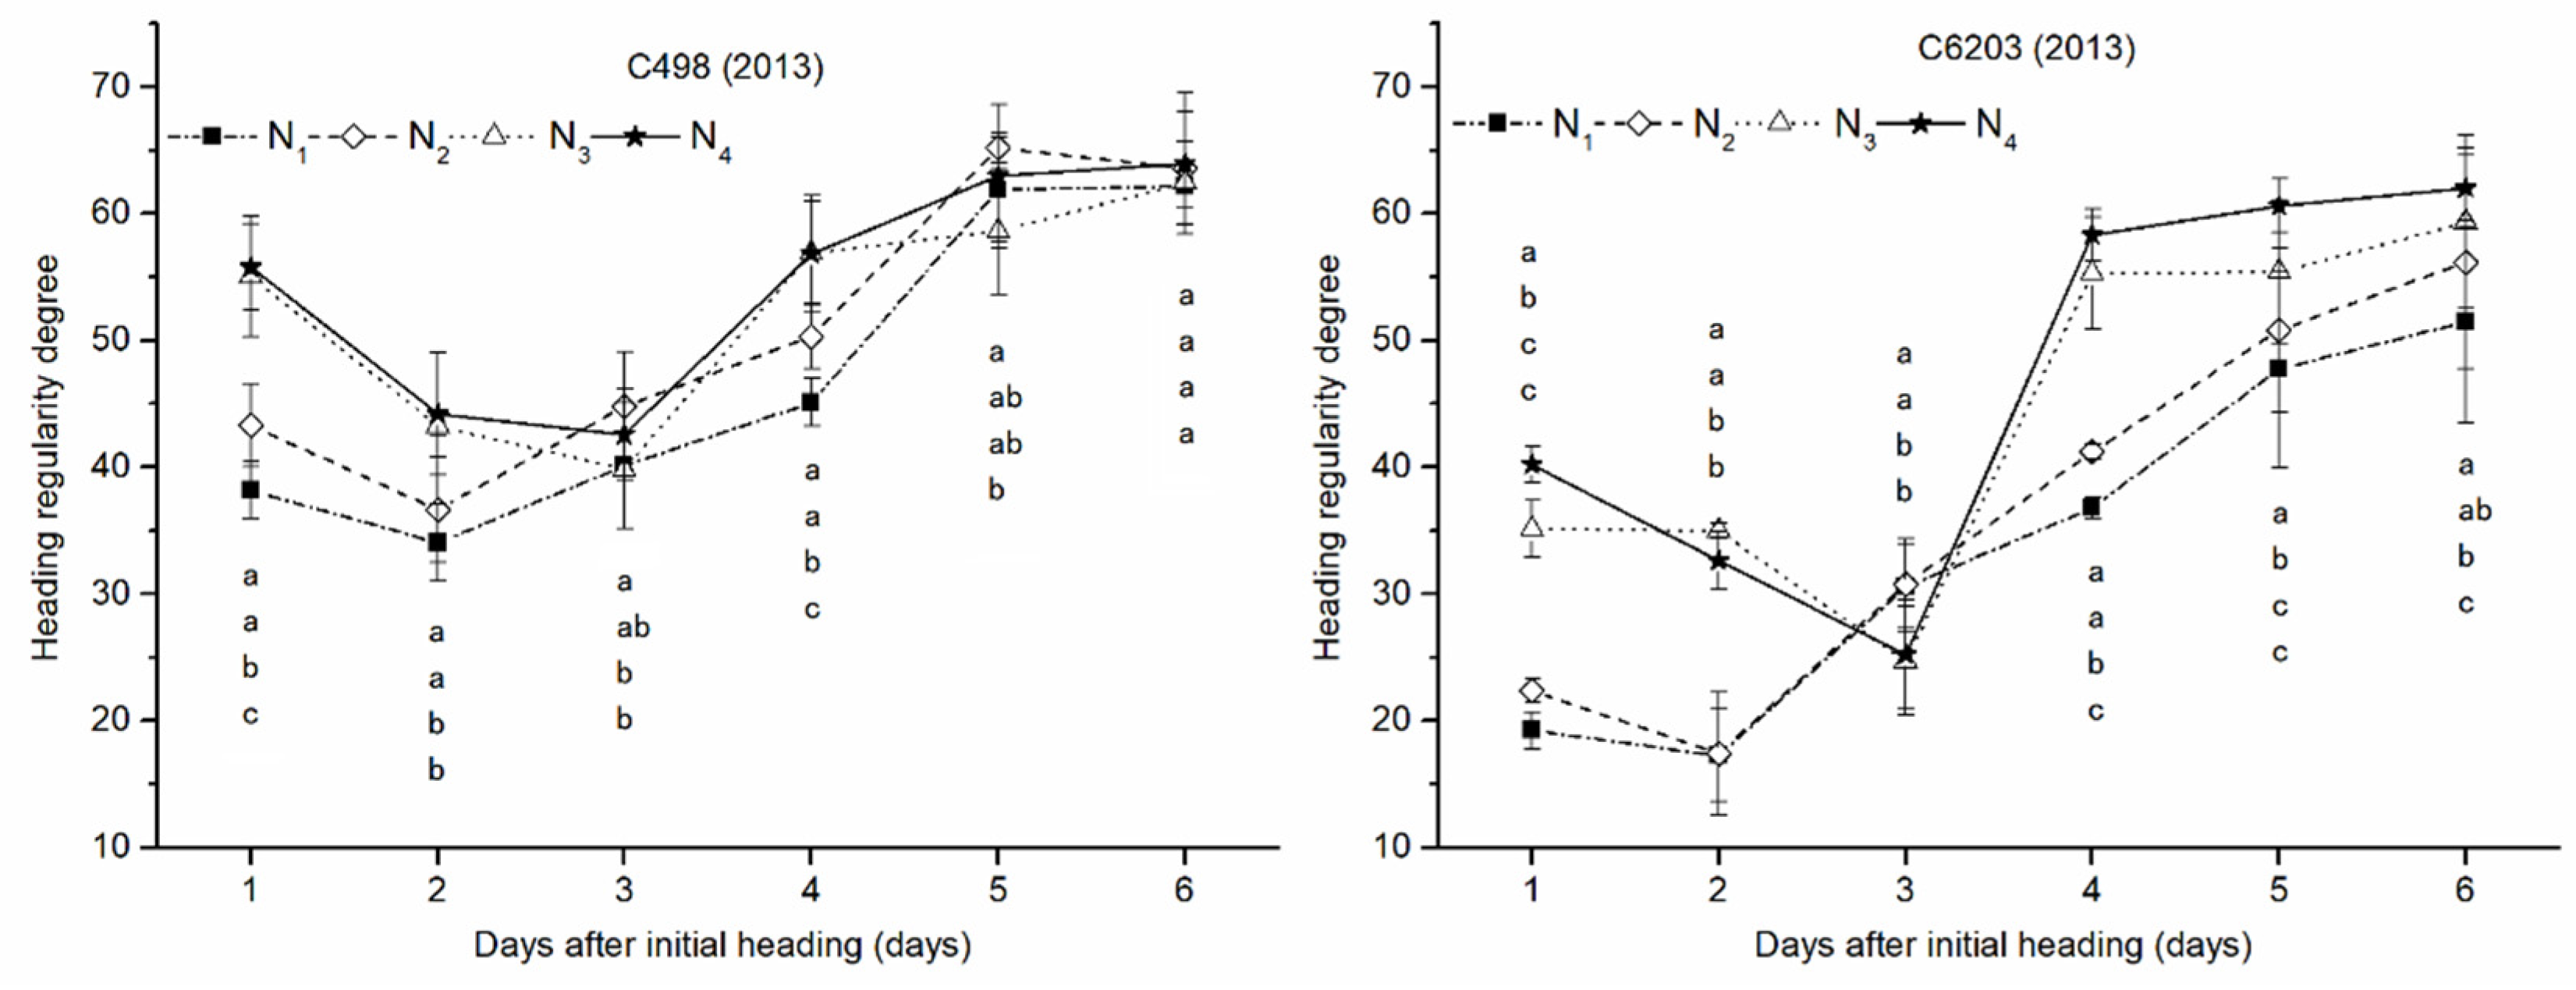
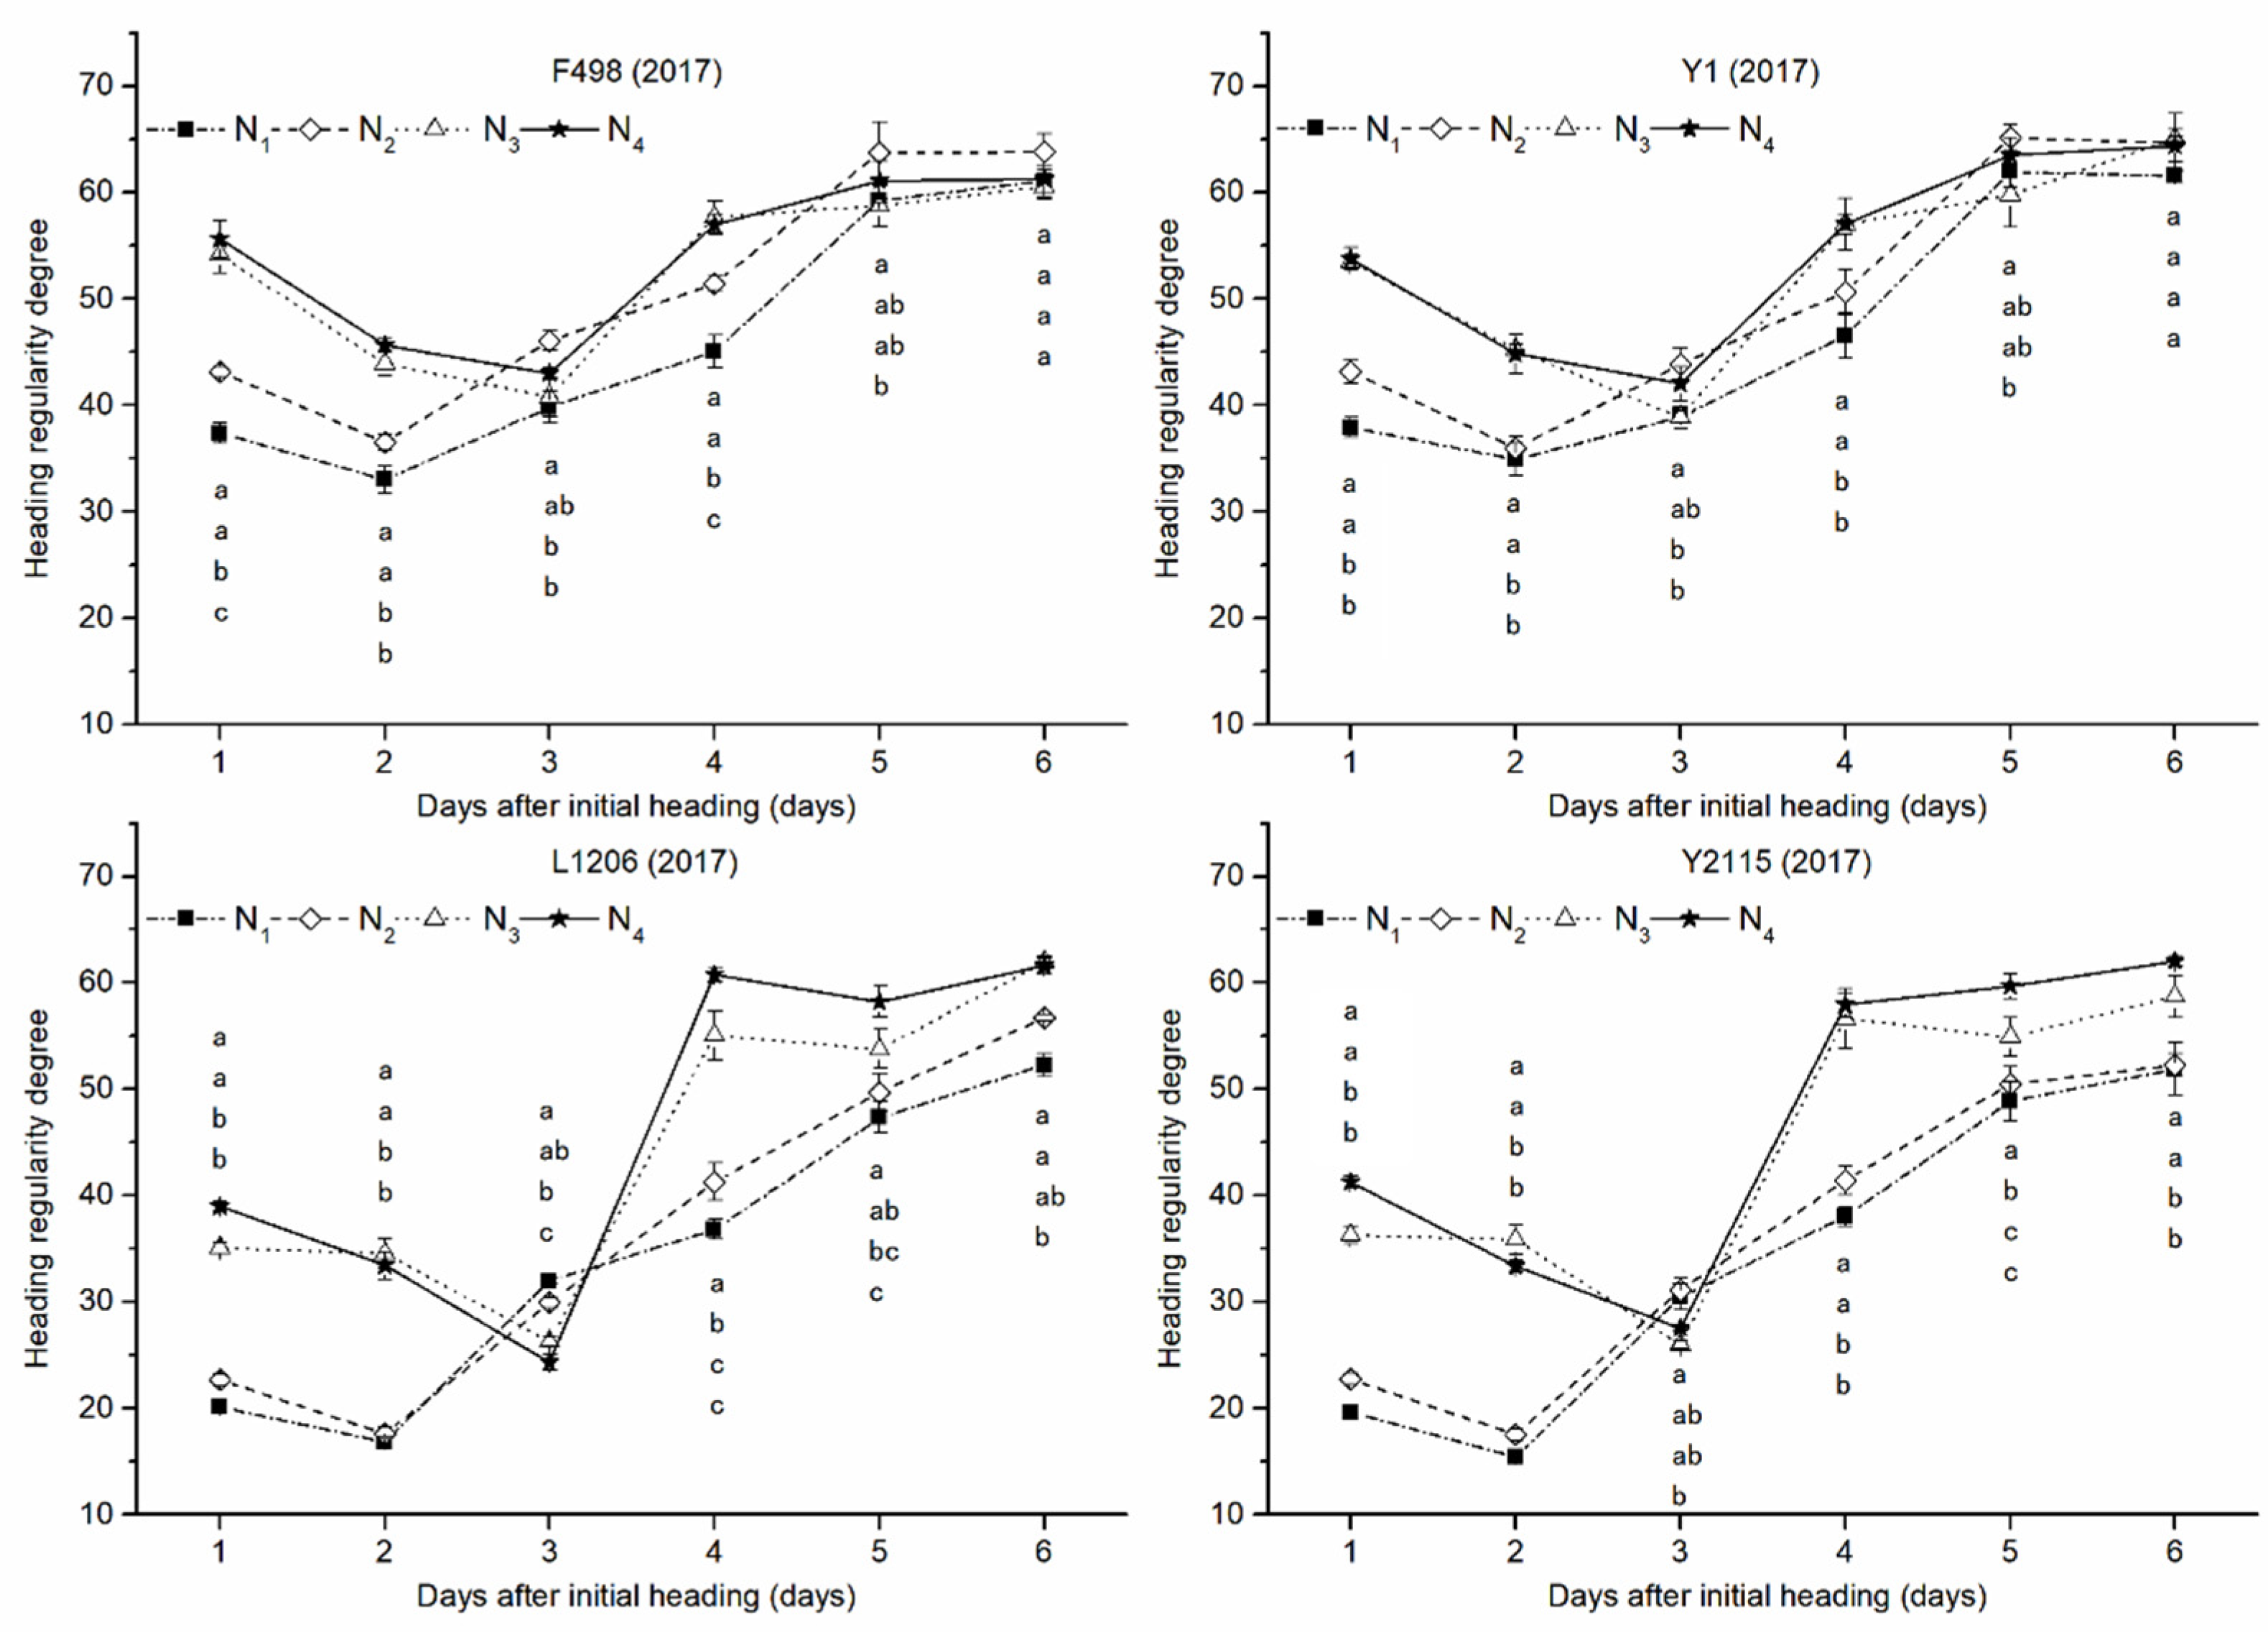
HU measured two or three days after the initial heading represented the greatest difference in the heading process of rice populations. The relationship between HU and grain yield was more stable than that between PTP and grain yield, thereby making HU a suitable comprehensive indicator of rice population quality. In the current study, HU was 45.45–46.36 in high-yielding treatments (with a yield ≥9750 kg ha−1, which was 20% higher than the local average yield). Extreme drought or heat stress may cause the calculation method to not be applicable; that is, after the heading process of the early initiated tiller ends, the tip of the late-initiated tiller may not be exposed. Although this situation occurs rarely in actual production, it is still necessary to strengthen research in this area to verify the reliability of HU. In addition, for rice production in China, the ecological environments are diverse, and varieties are numerous. Therefore, before HU really guides rice production, more varieties need to be further verified in more diversified ecological areas.

Author Contributions

Conceptualization, J.M.; methodology, C.S.; software, F.L. and Y.S.; validation, J.M.; formal analysis, J.Q.; investigation, C.S. and D.L.; resources, N.L.; data curation, D.L. and N.L.; writing—original draft preparation, C.S. and F.L.; writing—review and editing, Z.Y.; visualization, F.L.; supervision, M.W.; project administration, Z.Y.; funding acquisition, J.M. and Z.Y. All authors have read and agreed to the published version of the manuscript.

Funding

This research was funded by the Applied Basic Research Program, grant number 2021YJ0281 and the Scientific Research Fund of Sichuan Provincial Education Department, grant number 18ZA0390.

Institutional Review Board Statement

Not applicable.

Informed Consent Statement

Not applicable.

Data Availability Statement

Not applicable.

Acknowledgments

The authors would like to thank anonymous reviewers and the editor for their support, insightful critiques, and constructive comments.

Conflicts of Interest

The authors declare that they have no known competing financial interests or personal relationships that could have appeared to influence the work reported in this paper.

References

  1. Ling, Q.; Zhang, H.; Cai, J.; Su, Z.; Ling, L. Investigation on the population quality of high yield and its optimizing control programme in rice. Sci. Agric. Sin. 1993, 26, 1–11. [Google Scholar]
  2. Jiang, P.; Hong, X.; Feng, L.; Ma, Y.; Shi, J.; Ni, Z.; Liu, Z. Relation between percentage of ear-bearing of colony in the middle phase and photosynthesis efficiency in the late in rice. Sci. Agric. Sin. 1994, 27, 8–14. [Google Scholar]
  3. Chen, S.; Zheng, X.; Wang, D.; Xu, C.; Zhang, X. Influence of the improved System of Rice Intensification (SRI) on rice yield, yield components and tillering characteristics under different rice establishment methods. Plant Prod. Sci. 2013, 16, 191–198. [Google Scholar] [CrossRef] [Green Version]
  4. Yan, J.; Yu, J.; Tao, G.; Vos, J.; Bouman, B.; Xie, G.; Meinke, H. Yield formation and tillering dynamics of direct-seeded rice in flooded and nonflooded soils in the Huai River Basin of China. Field Crops Res. 2010, 116, 252–259. [Google Scholar] [CrossRef]
  5. Peng, S.; Khush, G. Four decades of breeding for varietal improvement of irrigated lowland rice in the International Rice Research Institute. Plant Prod. Sci. 2003, 6, 157–164. [Google Scholar] [CrossRef]
  6. Ling, Q.; Yang, J. Studies on “grain-leaf ratio” of population and cultural approaches of high yield in rice plants. Sci. Agric. Sin. 1986, 19, 1–8. [Google Scholar]
  7. Ling, Q.; Su, Z.; Zhang, H. Relationship between earbearing tiller percentage and population quality and its influential factors in rice. Acta Agron. Sin. 1995, 21, 463–469. [Google Scholar]
  8. Cruz, R.; Milach, S.; Federizzi, L. Inheritance of panicle exsertion in rice. Sci. Agric. 2008, 65, 502–507. [Google Scholar] [CrossRef]
  9. Qiao, B.; Zhu, X.; Wang, Y.; Hong, D. Mapping of QTL for three panicle exsertion-related traits in rice under different growing environments. Acta Agron. Sin. 2008, 34, 389–396. [Google Scholar] [CrossRef]
  10. Liu, G.; Mei, H.; Yu, X.; Zou, G.; Liu, H.; Hu, S.; Li, M.; Wu, J.; Chen, L.; Luo, L. QTL analysis of panicle neck diameter, a trait highly correlated with panicle size, under well-watered and drought conditions in rice (Oryza sativa L.). Plant Sci. 2008, 174, 71–77. [Google Scholar] [CrossRef]
  11. Xiao, H.; Wang, W. Elongation of the uppermost internode for Changxuan 3S, a thermo-sensitive genic male sterile rice line. Rice Sci. 2008, 15, 209–214. [Google Scholar] [CrossRef]
  12. O’Toole, J.C.; Namuco, O.S. Role of panicle exsertion in water stress induced sterility. Crop Sci. 1983, 23, 1093–1097. [Google Scholar] [CrossRef]
  13. He, H.; Serraj, R. Involvement of peduncle elongation, anther dehiscence and spikelet sterility in upland rice response to reproductive-stage drought stress. Environ. Exp. Bot. 2012, 75, 120–127. [Google Scholar] [CrossRef]
  14. Rang, Z.W.; Jagadish, S.V.K.; Zhou, Q.M.; Craufurd, P.Q.; Heuer, S. Effect of high temperature and water stress on pollen germination and spikelet fertility in rice. Environ. Exp. Bot. 2011, 70, 58–65. [Google Scholar] [CrossRef] [Green Version]
  15. Julia, C.; Dingkuhn, M. Variation in time of day of anthesis in rice in different climatic environments. Eur. J. Agron. 2012, 43, 166–174. [Google Scholar] [CrossRef]
  16. Zeng, Y.; Zhang, Y.; Xiang, J.; Uphoff, N.T.; Pan, X.; Zhu, D. Effects of low temperature stress on spikelet-related parameters during anthesis in Indica-Japonica hybrid rice. Front. Plant Sci. 2017, 8, 1350. [Google Scholar] [CrossRef] [Green Version]
  17. Kobayasi, K.; Matsui, T.; Yoshimoto, M.; Hasegawa, T. Effects of temperature solar radiation, and vapor-pressure deficit on flower opening time in rice. Plant Prod. Sci. 2010, 13, 21–28. [Google Scholar] [CrossRef]
  18. Rutger, J.N.; Carnahan, H.L. A fourth genetic element to facilitate hybrid cereal production -a recessive tall in rice. Crop Sci. 1981, 21, 373–376. [Google Scholar] [CrossRef]
  19. Zhan, C.; Hu, J.; Pang, Q.; Yang, B.; Cheng, Y.; Xu, E.; Zhu, P.; Li, Y.; Zhang, H.; Cheng, J. Genome-wide association analysis of panicle exsertion and uppermost internode in rice (Oryza sativa L.). Rice 2019, 12, 72. [Google Scholar] [CrossRef]
  20. Chen, H.; Jiang, S.; Zhang, J.; Lin, Y. Improving panicle exsertion of rice cytoplasmic male sterile line by combination of artificial microRNA and artificial target mimic. Plant Biotechnol. J. 2013, 11, 336–343. [Google Scholar] [CrossRef] [Green Version]
  21. Xu, Z.; Huang, R.; Li, H. Difference and correlation of uniformity in rice population among varieties. J. Shenyang Agric. Univ. 2006, 37, 137–140. [Google Scholar]
  22. Bian, S.; Zhao, H.; Meng, X.; Fang, X.; Tan, G.; Zhang, L.; Yang, F.; Yan, W. Study on the relationship between the ear characteristic uniformity and yield of super high-yielding corn. J. Maize Sci. 2008, 16, 119–122. [Google Scholar]
  23. Zhao, D.; Yan, Q.; Cheng, X. Research progress of rice character uniformity. Crop Res. 2004, 18, 346–347. [Google Scholar]
  24. Lei, H.; Xi, D.; Yan, R. Study on the uniformity of paddy fields. Acta Agron. Sin. 1963, 2, 131–146. (In Chinese) [Google Scholar]
  25. Zhang, W.; Zhu, D.; Zhang, Y.; Chen, H.; Lin, X. Analysis of panicle uniformity and yield of rice hybrid in planting density. Southwest China J. Agric. Sci. 2004, 17, 720–723. [Google Scholar]
  26. Yang, Z.; Shu, C.; Zhang, R.; Yang, G.; Wang, M.; Qin, J.; Sun, Y.; Ma, J.; Li, N. Comparison of tolerances to nitrogen fertilizer between compact and loose hybrid indica rice varieties. Acta Agron. Sinica 2021, 47, 1593–1602. [Google Scholar] [CrossRef]
  27. Yang, Z.; Li, N.; Ma, P.; Li, Y.; Zhang, R.; Song, Q.; Guo, X.; Sun, Y.; Xu, H.; Ma, J. Improving nitrogen and water use efficiencies of hybrid rice through methodical nitrogen-water distribution management. Field Crops Res. 2020, 246, 107698. [Google Scholar] [CrossRef]
  28. Johnson, J.W. A heuristic method for estimating the relative weight of predictor variables in multiple regression. Multivar. Behav. Res. 2000, 35, 1–19. [Google Scholar] [CrossRef] [PubMed]
  29. Ji, X.; Raveendran, M.; Oane, R.; Ismail, A.; Lafifitte, R.; Bruskiewich, R.; Cheng, S.; Bennett, J. Tissue-specific expression and drought responsiveness of cell wall invertase genes of rice at flowering. Plant Mol. Biol. 2005, 59, 945–964. [Google Scholar] [CrossRef]
  30. He, H.; Serrag, R.; Yang, Q. Changes in OsXTH gene expression, ABA content, and peduncle elongation in rice subjected to drought at the reproductive stage. Acta Physiol. Plant. 2009, 31, 749–756. [Google Scholar] [CrossRef]
  31. Wei, M.; Liao, X.; Li, D.; Duan, H. Comparison of tillering productivity among nodes along the main stem of rice. Chin. J. Plant Ecol. 2012, 36, 324–332. [Google Scholar] [CrossRef]
  32. Yang, S.; Yang, Z.; Sun, Y.; Ma, J. Effects of nitrogen management on grain yield and nitrogen use efficiency of two hybrid rice varieties with different panicle masses. J. Zhejiang Univ. Agric. Life Sci. 2015, 41, 685–694. [Google Scholar]
  33. Zhang, Z.; Chu, G.; Liu, L.; Wang, Z.; Wang, X.; Zhang, H.; Zhang, J. Mid-season nitrogen application strategies for rice varieties differing in panicle size. Field Crops Res. 2013, 150, 9–18. [Google Scholar] [CrossRef]
  34. Huang, M.; Zou, Y.; Jiang, P.; Xia, B.; Md, I.; Ao, H. Relationship between grain yield and yield components in super hybrid rice. Sci. Agric. Sin. 2011, 10, 1537–1544. [Google Scholar] [CrossRef]
  35. Huang, M.; Jiang, L.; Xia, B.; Zou, Y.; Jiang, P.; Ao, H. Yield gap analysis of super hybrid rice between two subtropical environments. Aust. J. Crop Sci. 2013, 7, 600–608. [Google Scholar]
  36. Qi, D.; Zhou, C.; Li, Y.; Sun, Z. Analysis of the characteristics and causes of overcast and rainy days in autumn 2017 in Sichuan Province. Meteor. Mon. 2020, 46, 37–49. [Google Scholar]
  37. Van Wart, J.; Kersebaum, C.; Peng, S.; Milner, M.; Cassman, K.G. Estimating crop yield potential at regional to national scales. Field Crops Res. 2013, 143, 34–43. [Google Scholar] [CrossRef] [Green Version]
  38. Yang, Z.; Li, N.; Ma, J.; Sun, Y.; Xu, H. High-yielding traits of heavy panicle varieties under triangle planting geometry: A new plant spatial configuration for hybrid rice in China. Field Crops Res. 2014, 168, 135–147. [Google Scholar] [CrossRef]
  39. Jiang, P.; Feng, L.; Hong, X.; Xu, Z. Study on the relationship between the application of spikelet-preserving fertilizer and the ear-bearing tiller percentage. J. Zhejiang Agric. Sci. 1996, 37, 27–30. (In Chinese) [Google Scholar]
Figure 1. Dynamic changes in the rice heading uniformity over six days after the initial heading in the year 2013. N1, N2, N3, and N4 represent the ratios m (base and tillering fertilizer): m (panicle fertilizer) = 75:25, 60:40, 45:55, and 30:70, respectively; vertical bars represent means ± SEs. Four groups of letters from top to bottom in the same column indicate statistical significance at p = 0.05 among different nitrogen management regimens from large to small within the same time period.
Agriculture 11 00770 g001
Figure 2. Dynamic changes in the rice heading uniformity over six days after the initial heading in the year 2017. N1, N2, N3, and N4 represent the ratios m (base and tillering fertilizer): m (panicle fertilizer) = 75:25, 60:40, 45:55, and 30:70, respectively; vertical bars represent means ± SEs. Four groups of letters from top to bottom in the same column indicate statistical significance at P = 0.05 among different nitrogen management regimens from large to small within the same time period.
Agriculture 11 00770 g002
Table 1. Meteorological conditions during the rice season in 2013, 2017, 2019, 2020, and 2000–2020 at the Rice Research Institute of Sichuan Agricultural University in Sichuan Province, China.
YearTotal Rainfall (mm)Total Sunshine Hours (h)Mean Diurnal Temperature (°C)
2013602.20598.8022.87
2017576.78622.7323.01
2019520.03642.0023.19
2020564.82581.4022.67
2000–2020550.30610.7022.87
Table 2. Average values for selected soil characteristics of composite topsoil samples (0–20 cm) from the experimental fields in 2013, 2017, 2019, and 2020.
ExperimentOrganic MatterTotal NitrogenAvailable NitrogenAvailable PhosphorusAvailable Potassium
(g kg−1)(g kg−1)(mg kg−1)(mg kg−1)(mg kg−1)
Experiment 1 (2013)24.412.12104.3331.75121.50
Experiment 2 (2017)22.341.6999.6025.48110.45
Experiment 3 (2019)18.661.7990.6620.3890.24
Experiment 4 (2020)21.121.8393.7421.53102.34
Table 3. Nitrogen management during the rice season in 2019 and 2020.
Nitrogen ManagementNitrogen Application Method
Farmers’ usual management150 kg ha−1 of N fertilizer was applied according to the ratio m (basal fertilizer): m (tillering fertilizer) = 7:3, one day before and seven days after transplanting.
Leaf age fertilization management 150 kg ha−1 of N fertilizer was applied according to the ratio m (base fertilizer): m (tillering fertilizer): m (panicle fertilizer) = 3:3:4, one day before and seven days after transplanting, and as the fourth and second leaves emerged from the top (panicle fertilizer was divided into two portions).
Uniform fertilization management 15, 15, 30, 15, 15, 15, and 15 kg ha−1 (total 120 kg ha−1) of N fertilizer was applied 7, 14, 35, 49, 56, 70, and 77 days after transplanting.
Table 4. Analysis of variance (ANOVA) of the effect of nitrogen management on grain yield components and heading traits at the heading stage in 2019 and 2020.
VarianceGrain YieldPNSPWPTP HU
Variety (V)28.8 **81.98 **75.79 **18.75 **88.1 **
Nitrogen management mode (N)61.98 **54.56 **289.09 **16.32 *72.51 **
Year (Y)0.23 ns14.69 *0.08 ns13.37 *0.16 ns
V * N0.81 ns0.83 ns0.47 ns1.93 ns1.1 ns
Y * V 2.07 ns1.44 ns1.43 ns0.15 ns2.32 ns
Y * N 0.05 ns1.14 ns2.12 ns0.49 ns0.11 ns
Y * V * N1.32 ns1.00 ns1.65 ns1.00 ns1.22 ns
PN: productive panicle number; SPW: single panicle weight; PTP: productive tiller percentage; HU: heading uniformity. ns: not significant; *: significant at the p = 0.05 level; **: significant at the P = 0.01 level.
Table 5. Effects of nitrogen management on grain yield components and heading traits in 2019 and 2020 (two-year average).
VarietyNitrogen ManagementPN (×104 ha−1)SPW (g)Grain Yield (kg ha−1)PTP (%)HU
L1206FU185.44.37 b8077 b66.74 b28.48 b
LAF191.31 a4.61 b8803 a68.02 ab37.04 a
UF173.29 b5.14 a8931 a69.25 a37.61 a
Average183.36 b4.70 c8604 b68.00 c34.38 b
Y2115FU197.51 a3.93 c7753 b66.31 c26.94 b
LAF198.71 a4.42 b8775 a71.27 a36.92 a
UF183.32 b4.93 a9015 a69.50 b38.05 a
Average193.18 a4.42 d8514 b69.03 b33.97 b
F498FU170.59 a5.14 c8752 b68.90 a35.92 b
LAF177.59 a5.73 b10,171 a69.20 a45.49 a
UF156.38 b6.36 a9945 a70.84 a45.45 a
Average168.18 c5.74 a9623 a69.64 b42.29 a
Y1FU179.57 ab4.92 b8843 b70.29 b39.66 b
LAF185.32 a5.49 a10,144 a70.56 ab46.36 a
UF174.61 b5.77 a10,069 a71.94 a46.07 a
Average179.83 b5.39 b9685 a70.93 a44.03 a
F-valueVariety (V)81.98 **75.79 **28.80 **18.74 **88.10 **
Nitrogen management (N)33.09 **39.30 **49.84**13.44 **95.17**
V×N0.94 ns0.61 ns0.86 ns2.04 ns0.99 ns
PN: productive panicle number; SPW: single panicle weight; PTP: productive tiller percentage; HU: heading uniformity; FU: farmers’ usual management; LAF: leaf age fertilization management; UF: uniform fertilization management; ns: not significant; **: significant at the p = 0.01 level. The lowercase letters after different nitrogen managements within the same variety represent significant differences at the p = 0.05 level; the lowercase letters after the average values represent significant differences at the p = 0.05 level among different varieties.
Table 6. Relative weight analysis of productive panicle number versus single panicle weight, and productive tiller percentage versus heading uniformity on grain yield in 2019 and 2020 (two-year average).
VarietyPercent Contribution (%)R2 (%)Percent Contribution (%)R2 (%)
PNSPWPTPHU
L120617.9381.8299.7541.2554.9496.19
Y21158.1591.85100.0012.3261.9374.25
F49822.7576.8199.5624.5453.6778.21
Y127.2472.5599.7939.5049.0288.52
PN: productive panicle number; SPW: single panicle weight; PTP: productive tiller percentage; HU: heading uniformity.
Table 7. Relative weight analysis of productive panicle number and single panicle weight on productive tiller percentage and heading uniformity in 2019 and 2020 (two-year average).
VarietyDependent VariablePercent Contribution (%)R2 (%)
PNSPW
L1206PTP57.7732.8690.64
HU11.9583.0995.03
Y2115PTP45.2515.3260.56
HU3.6274.5278.15
F498PTP13.2248.9662.18
HU24.1564.4388.58
Y1PTP17.9063.1181.01
HU22.8363.9686.79
PN: productive panicle number; SPW: single panicle weight; PTP: productive tiller percentage; HU: heading uniformity.
Publisher’s Note: MDPI stays neutral with regard to jurisdictional claims in published maps and institutional affiliations.

