
Impact of Rural–Urban Migration Experience on Rice Farmers’ Agricultural Machinery Expenditure: Evidence from China


Abstract
:1. Introduction
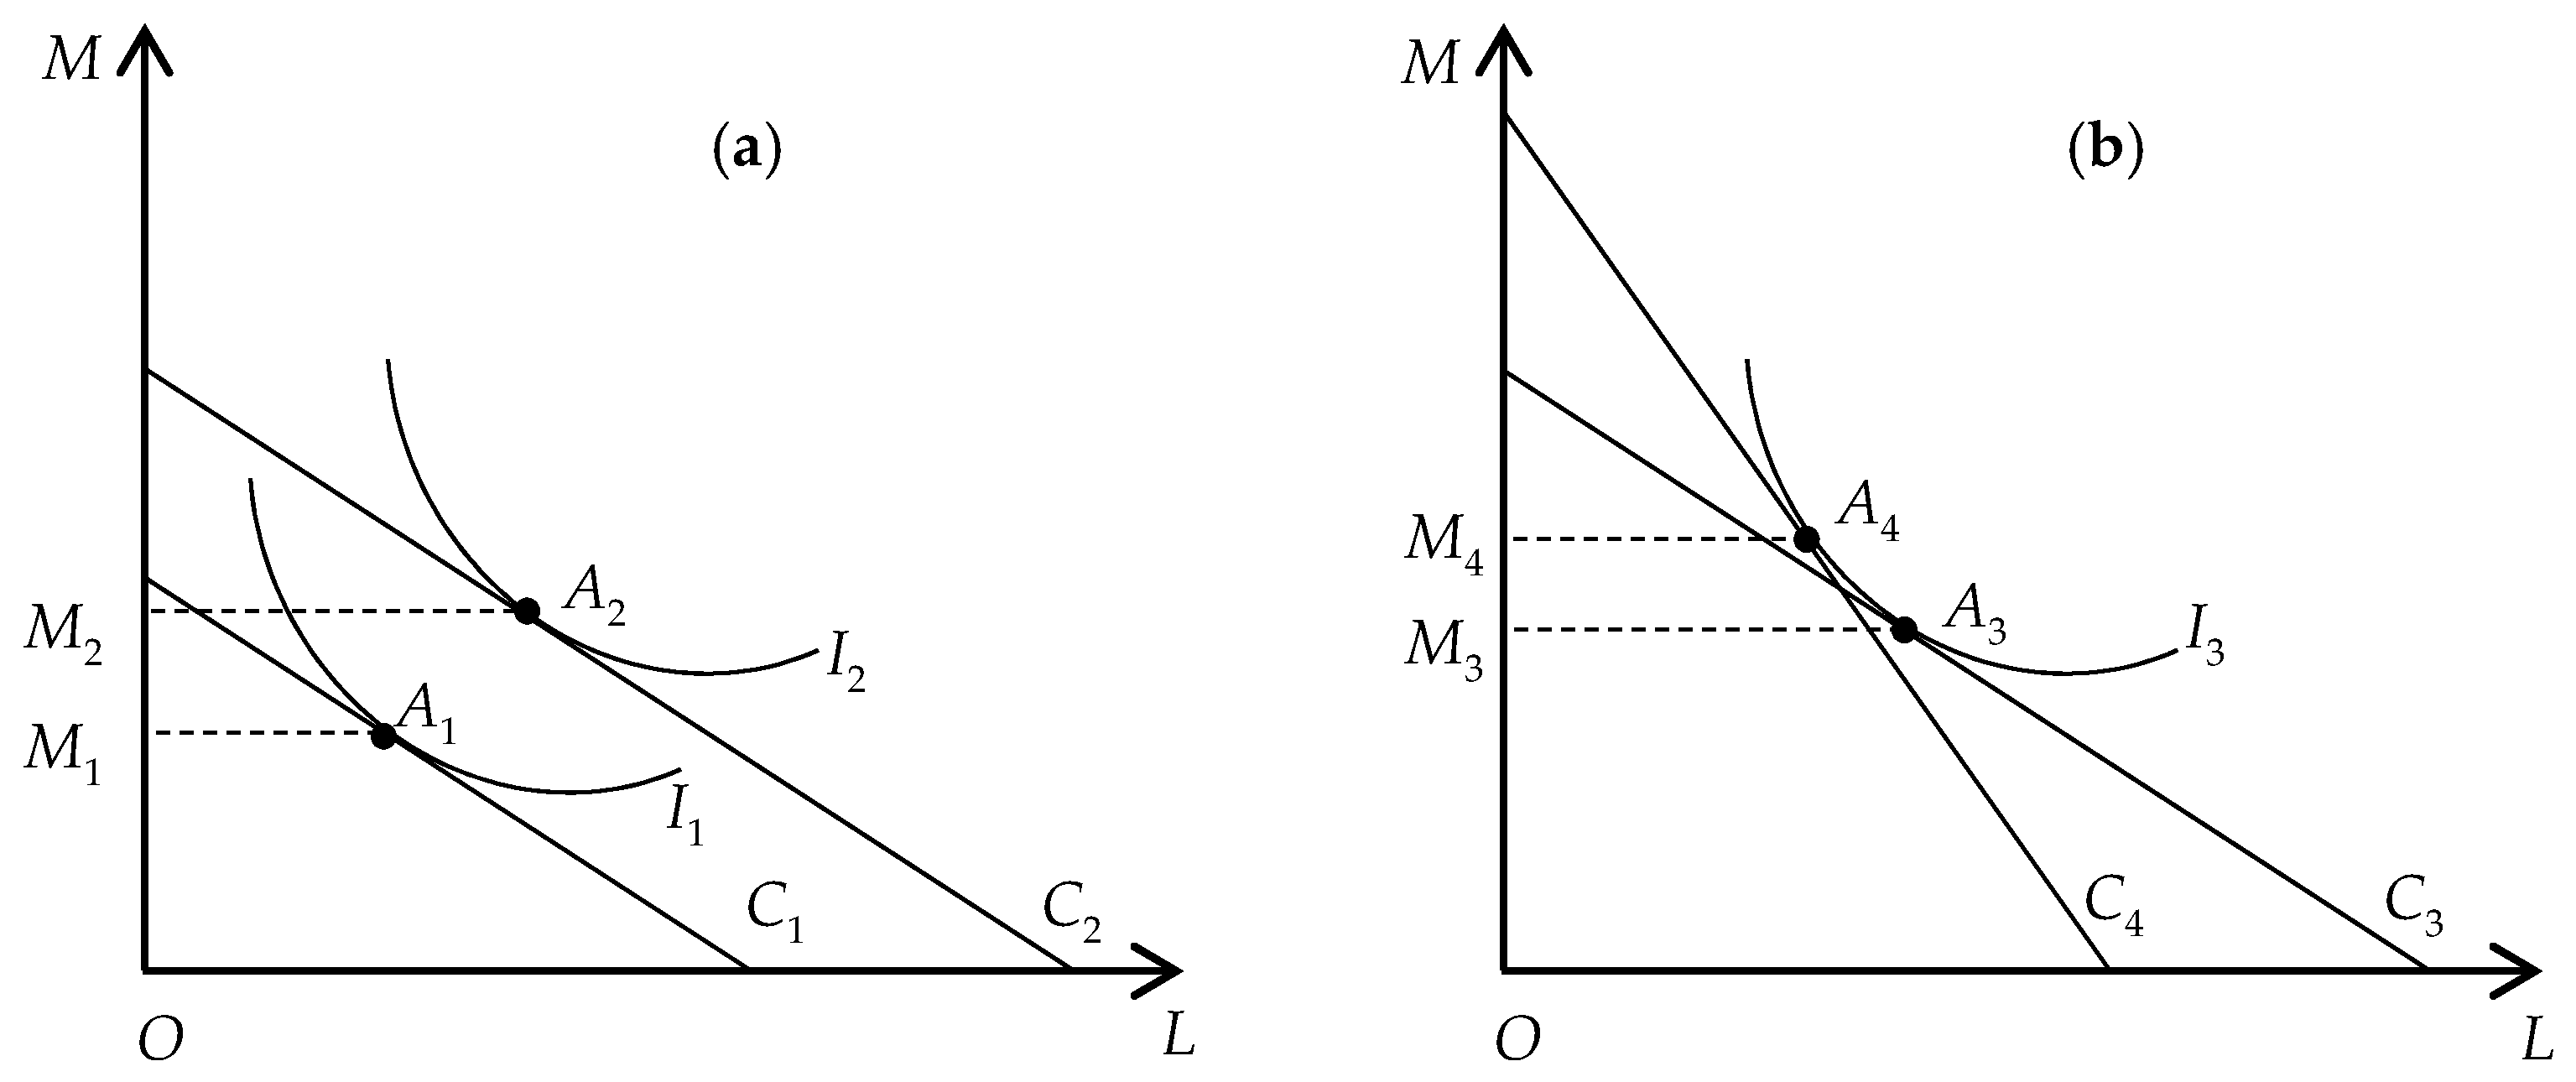
2. Theoretical Framework
3. Materials and Methods
3.1. Endogenous Treatment–Effect Model
3.2. Data
3.3. Variables and Descriptive Summary
- The dependent variable. In this study, we use agricultural machinery expenditure per hectare (ha) as the dependent variable.
- Core independent variable. In this study, the core independent variable is farmers’ rural–urban migration experience. This is a dummy variable that is equal to one if a farmer had migrated to the urban areas and returned to their hometown when the survey was conducted, and zero when a farmer was a non-migrant.
- Control variables. In this study, four groups of factors potentially influencing agricultural machinery expenditure are included in the econometric model. The first group includes farmers’ individual characteristics, such as gender, age, education, whether they are a village leader, and health self-perception. The second group describes farmers’ labor endowment, consisting of the number of household laborers and percentage of off-farm laborers. The third group includes rice planting characteristics, such as whether a land plot is plain, rice farm size, and adoption of direct seeding. The fourth group includes the provincial dummy variables.
- Instrumental variable. As aforementioned, at least one instrumental variable is needed for estimating the endogenous treatment–effect model. This study employs the percentage of the return migrants in the total sampled farmers in the same village as the instrumental variable of rural–urban migration experience. Many previous studies point out that farmers’ rural–urban migration and return to their hometown may be typically and closely associated with collective incentive. In other words, farmers’ rural–urban migration would encourage other farmers in the same village to migrate to the urban areas, and more rural–urban migrants return to their hometown would also guide other rural–urban migrants in the same village to return to their hometown [8,27,37,38]. Hence, the higher the percentage of the return migrants in a village, the larger the probability of an individual farmer’s rural–urban migration experience. In addition, there exists no relationship between the percentage of village-level return migrants and an individual farmer’ agricultural production except through rural–urban migration experience.
4. Results and Discussion
4.1. Main Results
4.2. Robustness Checks
4.3. Heterogeneity Analysis
5. Conclusions and Policy Implications
Author Contributions
Funding
Data Availability Statement
Conflicts of Interest
References
- National Bureau of Statistics of China. China Statistical Yearbook; China Statistics Press: Beijing, China, 2009. (In Chinese)
- Hu, Y.; Zhang, Z. Does agricultural machinery service influence technical efficiency in wheat production? Chin. Rural Econ. 2018, 5, 68–83. (In Chinese) [Google Scholar]
- Jiao, C.; Dong, L. From “over-densification” to “mechanization”: The process, motivation and influence of China’s agricultural mechanization revolution (1980~2015). Manag. World 2018, 10, 173–190. (In Chinese) [Google Scholar]
- Cao, Y.; Hu, J. Agricultural mechanization in the context of household contract system of land in China based on the survey data in 17 provinces in China. Chin. Rural Econ. 2010, 10, 57–65. (In Chinese) [Google Scholar]
- Wang, X.; Yamauchi, F.; Huang, J. Rising wages, mechanization, and the substitution between capital and labor: Evidence from small scale farm system in China. Agric. Econ. 2012, 47, 309–317. [Google Scholar] [CrossRef]
- Cai, J.; Tang, Z.; Zhu, Y. The relative price of factors, land resources condition and farmer’s demand on agricultural mechanical service outsourcing. Chin. Rural Econ. 2017, 8, 18–28. (In Chinese) [Google Scholar]
- Zhao, Y. Causes and consequences of return migration: Recent evidence from China. J. Comp. Econ. 2002, 30, 376–394. [Google Scholar] [CrossRef]
- Démurger, S.; Xu, H. Return migrants: The rise of new entrepreneurs in rural China. World Dev. 2011, 39, 1847–1861. [Google Scholar] [CrossRef]
- Bryceson, D.F.; Jamal, V. Farewell to Farms: De-Agrarianization and Employment in Africa; Ashgate: Aldershot, UK, 1997. [Google Scholar]
- Bryceson, D.F.; Kay, C.; Mooij, J. Disappearing Peasantries? Rural Labour in Africa, Asia and Latin American; Intermediate Technology Publications: Landon, UK, 2000. [Google Scholar]
- Chu, N.Y.; Sung-Ko, L.; Shu-Ki, T. The incidence of surplus labor in rural China: A nonparametric estimation. J. Comp. Econ. 2000, 28, 565–580. [Google Scholar]
- Cai, F.; Wang, M. A counterfactual analysis on unlimited surplus labor in rural China. China World Econ. 2010, 16, 51–65. [Google Scholar] [CrossRef]
- Yu, L.; Jiang, C. An empirical analysis of the absorption of labor force of the township enterprises in China. Manag. World 2003, 3, 76–82. (In Chinese) [Google Scholar]
- Cao, K.H.; Birchenall, J.A. Agricultural productivity, structural change, and economic growth in post-reform China. J. Dev. Econ. 2013, 104, 165–180. [Google Scholar] [CrossRef] [Green Version]
- Chen, Q.; Hu, R.; Sun, Y.; Zhang, C. How does rural-urban migration experience affect arable land use? Evidence from 2293 farmers in China. Land 2020, 9, 400. [Google Scholar] [CrossRef]
- Zhang, C.; Sun, Y.; Hu, R.; Yang, F.; Shen, X. The impact of rural-urban migration experience on fertilizer use: Evidence from rice production in China. J. Clean. Prod. 2021, 280, 124429. [Google Scholar] [CrossRef]
- Shi, Z.; Yang, Y. The effect of rural-urban migration on the capability development of rural labor force and its policy implications. Manag. World 2011, 12, 40–54. (In Chinese) [Google Scholar]
- Liu, Y.; Hu, W.; Jetté-Nantel, S.; Tian, Z. The influence of labor price change on agricultural machinery usage in Chinese agriculture. Can. J. Agric. Econ. 2014, 62, 219–243. [Google Scholar] [CrossRef]
- Li, Q.; Li, D.; Chen, F. Analysis of the effect of plot characteristics on the utilization of agricultural machinery: Based on the rice plots data of South China. Issues Agric. Econ. 2017, 7, 43–52. (In Chinese) [Google Scholar]
- Yang, Y.; Li, R.; Wu, M. An analysis of the constraint path of land fragmentation on farmers’ purchase of agricultural machinery service. J. Agrotech. Econ. 2018, 10, 17–25. (In Chinese) [Google Scholar]
- Wang, X.; Yamauchi, Y.; Huang, J.; Rozelle, S. What constrains mechanization in Chinese agriculture? Role of farm size and fragmentation. China Econ. Rev. 2020, 62, 101221. [Google Scholar] [CrossRef]
- Peng, J.; Wu, H. The influence of land transfer on farmers’ agricultural mechanization adoption. China Land Sci. 2019, 33, 73–80. (In Chinese) [Google Scholar]
- Fang, S.; Shi, X.; Gao, X. Off-farm employment, investment in agricultural machinery and utilization of agricultural machinery service. J. Nanjing Agric. Univ. Soc. Sci. 2020, 20, 139–149. (In Chinese) [Google Scholar]
- Hu, X.; Mi, Y. The effect and its mechanism of property rights stability on agricultural machinery outsourcing. J. Huazhong Agric. Univ. Soc. Sci. 2020, 3, 63–71. (In Chinese) [Google Scholar]
- Zhao, Y. Labor migration and earnings differences: The case of rural China. Econ. Dev. Cult. Chang. 1999, 47, 767–782. [Google Scholar] [CrossRef]
- Qian, W.; Wang, D.; Zheng, L. The impact of migration on agricultural restructuring: Evidence from Jiangxi Province in China. J. Rural Stud. 2016, 47, 542–551. [Google Scholar] [CrossRef]
- Zhou, G.; Tan, H.; Li, L. Does migration experience promote entrepreneurship in rural China? China Econ. Quart. 2017, 16, 793–814. (In Chinese) [Google Scholar]
- Wei, X.; Zhu, H. Return migrants’ entrepreneurial decisions in rural China. Asian Popul. Stud. 2020, 16, 61–81. [Google Scholar] [CrossRef]
- Wang, S.; Tian, X. The influence of rural labor force aging on agricultural production—An empirical analysis of cultivated land terrain. J. Agrotech. Econ. 2018, 4, 15–26. (In Chinese) [Google Scholar]
- Lin, B.; Deng, H. An empirical analysis of the effect of agricultural labor force aging on land use efficiency based on rural fixed point data in Zhejiang Province. Chin. Rural Econ. 2012, 4, 15–25. (In Chinese) [Google Scholar]
- Yang, F.; Zhang, Y.; Liu, W. Social network, land scale and productivity-oriented investment of peasant household in agriculture. Reform 2019, 1, 97–108. (In Chinese) [Google Scholar]
- Hu, W.; Zhang, J.; Chen, Z. Small farmer and large scale production: Farmland scale and agricultural capital deepening—Taking agricultural machinery operation service as example. J. Agrotech. Econ. 2019, 6, 82–96. (In Chinese) [Google Scholar]
- Liu, G.; Song, H. The entrepreneurship of return migrants: Characteristics, causes and its effects—A case analysis of 71 return migrants in four counties in Anhui and Sichuan provinces. Chin. Rural Econ. 2002, 3, 65–71. (In Chinese) [Google Scholar]
- Maddala, G.S. Limited Dependent and Qualitative Variables in Econometrics; Cambridge University Press: Cambridge, UK, 1983. [Google Scholar]
- Huang, J.; Wang, Y.; Wang, J. Farmers’ adaptation to extreme weather events through farm management and its impacts on the mean and risk of rice yield in China. Am. J. Agric. Econ. 2015, 97, 602–617. [Google Scholar] [CrossRef]
- Peng, W.; Huang, Z. Can cooperatives help to increase farmers’ income? —Analysis based on endogenous switching regression model and cooperatives’ service functionality. J. Northweat A&F Univ. Soc. Sci. 2017, 17, 57–66. (In Chinese) [Google Scholar]
- Mendola, M. Migration and technological change in rural households: Complements or substitutes? J. Dev. Econ. 2008, 85, 150–175. [Google Scholar] [CrossRef] [Green Version]
- Tshikala, S.K.; Kostandini, G.; Fonsah, E.G. The impact of migration, remittances and public transfers on technology adoption: The case of cereal producers in rural Kenya. J. Agric. Econ. 2019, 70, 316–331. [Google Scholar] [CrossRef]
- National Bureau of Statistics of China. Available online: http://www.stats.gov.cn/tjsj/pcsj/nypc/nypc3/d3cqgnypchzsj.pdf (accessed on 31 July 2021).
- Guo, L.; Chen, H.; Cao, Y. The determinants of industrial transfer and rural migrants’ willingness of intra-provincial mobilization in the context of return of labor force—A farmer survey conducted in six provinces in the Central China. Chin. Rural Econ. 2011, 6, 45–53. (In Chinese) [Google Scholar]

| Variable | Total | Return Migrants | Non-Migrants | Mean Difference |
|---|---|---|---|---|
| Agricultural machinery expenditure (yuan/ha) | 201.05 (472.26) | 226.10 (497.27) | 193.45 (464.44) | 32.64 |
| Male (1 = yes, 0 = no) | 0.90 (0.25) | 0.93 (0.25) | 0.90 (0.31) | 0.04 * |
| Age (years) | 57.00 (9.68) | 54.35 (10.66) | 57.80 (9.22) | −3.45 *** |
| Education (years) | 6.62 (3.28) | 7.64 (3.00) | 6.31 (3.30) | 1.33 *** |
| Village leader (1 = yes, 0 = no) | 0.10 (0.30) | 0.11 (0.31) | 0.10 (0.29) | 0.02 |
| Health (1 = yes, 0 = no) | 0.39 (0.49) | 0.38 (0.49) | 0.40 (0.49) | −0.02 |
| No. of laborers (persons) | 2.99 (1.25) | 3.02 (1.37) | 2.98 (1.21) | 0.03 |
| Percentage of off-farm laborers | 66.68 (29.68) | 68.82 (29.62) | 66.03 (29.69) | 2.79 |
| Plain (1 = yes, 0 = no) | 0.69 (0.46) | 0.71 (0.45) | 0.68 (0.47) | 0.03 |
| Farm size (ha) | 1.94 (10.95) | 3.25 (12.38) | 1.55 (10.46) | 1.70 ** |
| Direct seeding (1 = yes, 0 = no) | 0.47 (0.50) | 0.46 (0.50) | 0.47 (0.50) | −0.02 |
| Percentage of village-level return migrants (%) | 23.26 (10.10) | 27.64 (10.25) | 21.93 (9.68) | 5.71 *** |
| Observations | 1122 | 261 | 861 |
| Variable | OLS | Endogenous Treatment–Effect Model | |
|---|---|---|---|
| Selection Equation | Outcome Equation | ||
| Rural–urban migration experience | −7.31 (25.96) | 561.12 *** (86.01) | |
| Male | 74.23 (54.27) | 0.17 (0.17) | 48.98 (59.17) |
| Age | −4.13 *** (1.39) | −0.01 ** (0.01) | −1.45 (1.73) |
| Education | -6.42 (4.03) | 0.06 *** (0.02) | −16.77 *** (5.84) |
| Village leader | −2.02 (48.14) | −0.12 (0.12) | 9.91 (50.11) |
| Health | 20.51 (25.54) | −0.18 *** (0.07) | 39.55 (26.96) |
| No. of laborers | −12.75 (12.31) | 0.01 (0.04) | −21.91 (15.07) |
| Percentage of off-farm laborers | 0.24 (0.44) | 0.00 (0.00) | −0.15 (0.51) |
| Plain | 11.55 (26.76) | 0.16 (0.10) | −40.08 (34.31) |
| Ln(farm size) | 65.06 *** (21.43) | -0.05 (0.05) | 64.25 *** (22.86) |
| Direct seeding | −117.31 *** (29.41) | 0.11 (0.08) | −137.95 *** (33.66) |
| Provincial dummy variables | Yes | Yes | Yes |
| Percentage of village-level return migrants | 0.02 *** (0.00) | ||
| Constant | 860.24 *** (92.21) | −1.41 *** (0.40) | 691.30 *** (120.60) |
| Correlation coefficient (ρ) | −0.72 *** (0.10) | ||
| Wald test for independent equations (χ2 statistics) | 21.11 *** | ||
| Weak instrument test (F statistics) | 201.63 *** | ||
| Exogeneity test for instrument | 2.81 (1.78) | ||
| Observations | 1122 | 1122 | |
| Variable | Selection Equation | Outcome Equation |
|---|---|---|
| Rural–urban migration experience (≥2 years) | 604.39 *** (77.62) | |
| Male | 0.08 (0.18) | 64.00 (58.89) |
| Age | −0.01 ** (0.01) | −1.68 (1.65) |
| Education | 0.05 *** (0.02) | −14.59 ** (5.76) |
| Village leader | −0.04 (0.12) | −6.93 (50.32) |
| Health | −0.22 *** (0.06) | 41.16 (27.14) |
| No. of laborers | −0.00 (0.04) | −20.15 (14.75) |
| Percentage of off-farm laborers | 0.00 (0.00) | −0.16 (0.54) |
| Plain | 0.24 ** (0.10) | −51.19 (37.67) |
| Ln(farm size) | −0.05 (0.04) | 63.91 *** (23.16) |
| Direct seeding | 0.14 ** (0.07) | −153.25 *** (34.50) |
| Provincial dummy variables | Yes | Yes |
| Percentage of village-level return migrants (≥2 years) | 0.02 *** (0.00) | |
| Constant | −1.25 *** (0.37) | 710.11 *** (113.01) |
| Correlation coefficient (ρ) | −0.76*** (0.09) | |
| Wald test for independent equations (χ2 statistics) | 20.98*** | |
| Weak instrument test (F statistics) | 201.79 *** | |
| Exogeneity test for instrument | 2.63 (1.64) | |
| Observations | 1122 |
| Variable | Age ≥ 55 Years Old | Age < 55 Years Old | ||
|---|---|---|---|---|
| Selection Equation | Outcome Equation | Selection Equation | Outcome Equation | |
| Rural–urban migration experience | 483.25 *** (77.00) | 648.35 *** (197.92) | ||
| Male | −0.04 (0.23) | 48.51 (67.93) | 0.34 (0.28) | 32.76 (96.77) |
| Age | 0.01 (0.01) | −5.77 ** (2.59) | −0.04 *** (0.01) | 2.36 (7.46) |
| Education | 0.07 *** (0.02) | −17.58 ** (6.95) | 0.05 * (0.03) | −10.58 (14.63) |
| Village leader | −0.13 (0.17) | −41.67 (38.12) | 0.04 (0.19) | 53.49 (108.64) |
| Health | −0.19 * (0.10) | 53.68 (33.57) | −0.20 ** (0.10) | 34.29 (50.19) |
| No. of laborers | −0.01 (0.06) | 2.01 (15.34) | 0.05 (0.06) | −77.58 *** (29.60) |
| Percentage of off-farm laborers | −0.00 (0.00) | 0.29 (0.64) | 0.00 (0.00) | −0.83 (1.18) |
| Plain | 0.02 (0.15) | −1.18 (32.65) | 0.30 * (0.16) | −82.10 (66.19) |
| Ln(farm size) | −0.16 ** (0.07) | 60.41 ** (25.81) | 0.02 (0.06) | 63.26 * (35.11) |
| Direct seeding | 0.08 (0.11) | −94.63 *** (35.31) | 0.15 (0.13) | −200.89 *** (72.01) |
| Provincial dummy variables | Yes | Yes | Yes | Yes |
| Percentage of village-level return migrants | 0.02 *** (0.00) | 0.03 *** (0.01) | ||
| Constant | −2.82 *** (0.75) | 897.38 *** (198.38) | −0.30 (0.78) | 627.36 (457.97) |
| Correlation coefficient (ρ) | −0.75 *** (0.11) | −0.72 ** (0.17) | ||
| Wald test for independent equations (χ2 statistics) | 13.85 *** | 6.57 ** | ||
| Weak instrument test (F statistics) | 27.08 *** | 79.54 *** | ||
| Exogeneity test for instrument | 0.98 (1.85) | 5.03 (3.20) | ||
| Observations | 665 | 457 | ||
| Variable | Farm Size ≥ 0.67 Hectares | Farm Size < 0.67 Hectares | ||
|---|---|---|---|---|
| Selection Equation | Outcome Equation | Selection Equation | Outcome Equation | |
| Rural–urban migration experience | 781.68 *** (118.96) | 443.81 *** (157.09) | ||
| Male | 0.50 * (0.26) | −43.89 (110.68) | 0.15 (0.20) | 55.24 (66.62) |
| Age | −0.03 *** (0.01) | 1.12 (6.06) | −0.01 (0.01) | −1.78 (1.89) |
| Education | 0.12 *** (0.03) | −41.38 ** (19.46) | 0.04 ** (0.02) | −9.93 * (5.43) |
| Village leader | −0.56 (0.37) | 267.68 (227.56) | 0.07 (0.14) | −57.21 * (34.01) |
| Health | −0.07 (0.15) | 53.92 (81.99) | −0.25 *** (0.09) | 30.93 (28.72) |
| No. of laborers | 0.04 (0.10) | −42.13 (61.49) | 0.01 (0.05) | −14.35 (11.96) |
| Percentage of off-farm laborers | 0.00 (0.00) | -0.09 (1.94) | 0.00 (0.00) | −0.13 (0.51) |
| Plain | 0.02 (0.24) | −87.43 (110.47) | 0.19 ** (0.10) | −23.87 (30.22) |
| Ln(farm size) | −0.12 (0.13) | 80.54 (65.39) | −0.12 (0.09) | 41.27 (29.45) |
| Direct seeding | 0.29 * (0.15) | −293.14 *** (100.90) | 0.09 (0.08) | −86.01 *** (31.46) |
| Provincial dummy variables | Yes | Yes | Yes | Yes |
| Percentage of village-level return migrants | 0.03 *** (0.01) | 0.03 *** (0.01) | ||
| Constant | −1.48* (0.79) | 487.89 (349.20) | −1.60 *** (0.53) | 622.58 *** (131.03) |
| Correlation coefficient (ρ) | −0.87 *** (0.06) | −0.62 ** (0.21) | ||
| Wald test for independent equations (χ2 statistics) | 30.90 *** | 4.93 ** | ||
| Weak instrument test (F statistics) | 5.59 ** | 190.55 *** | ||
| Exogeneity test for instrument | 5.95 (3.83) | 2.34 (1.98) | ||
| Observations | 257 | 865 | ||
Publisher’s Note: MDPI stays neutral with regard to jurisdictional claims in published maps and institutional affiliations. |
© 2021 by the authors. Licensee MDPI, Basel, Switzerland. This article is an open access article distributed under the terms and conditions of the Creative Commons Attribution (CC BY) license (https://creativecommons.org/licenses/by/4.0/).
Share and Cite
Sun, Y.; Hu, R.; Zhang, C. Impact of Rural–Urban Migration Experience on Rice Farmers’ Agricultural Machinery Expenditure: Evidence from China. Agriculture 2021, 11, 764. https://doi.org/10.3390/agriculture11080764
Sun Y, Hu R, Zhang C. Impact of Rural–Urban Migration Experience on Rice Farmers’ Agricultural Machinery Expenditure: Evidence from China. Agriculture. 2021; 11(8):764. https://doi.org/10.3390/agriculture11080764
Chicago/Turabian StyleSun, Yiduo, Ruifa Hu, and Chao Zhang. 2021. "Impact of Rural–Urban Migration Experience on Rice Farmers’ Agricultural Machinery Expenditure: Evidence from China" Agriculture 11, no. 8: 764. https://doi.org/10.3390/agriculture11080764
APA StyleSun, Y., Hu, R., & Zhang, C. (2021). Impact of Rural–Urban Migration Experience on Rice Farmers’ Agricultural Machinery Expenditure: Evidence from China. Agriculture, 11(8), 764. https://doi.org/10.3390/agriculture11080764