Spatial Variability of Nitrogen Uptake and Net Removal and Actual Evapotranspiration in the California Desert Carrot Production System


Abstract
:1. Introduction
2. Materials and Methods
2.1. Field Experiments
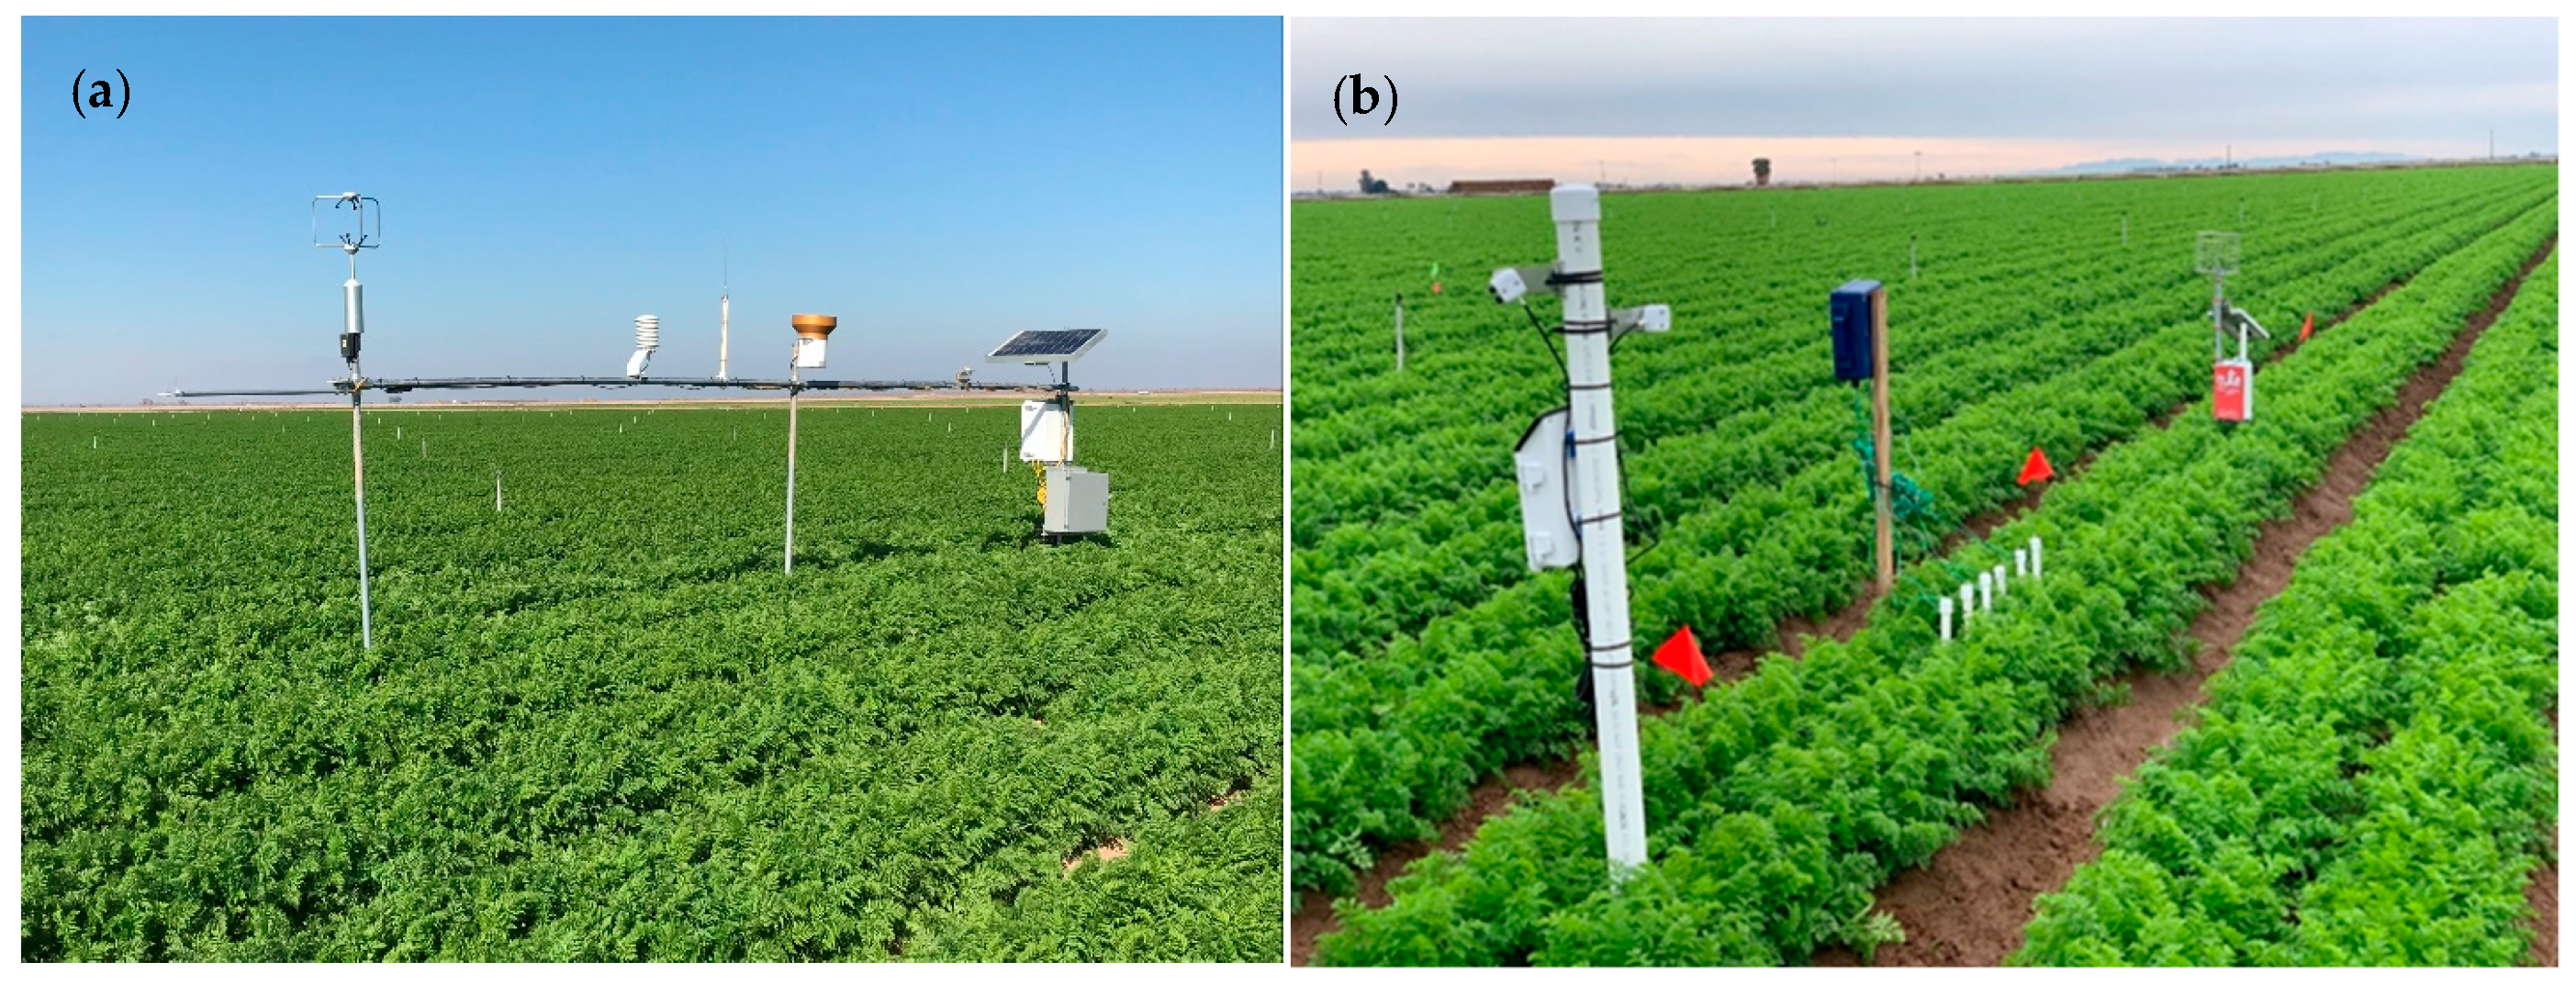
2.2. Instrumentation and Data Collection
2.3. Date Analyses
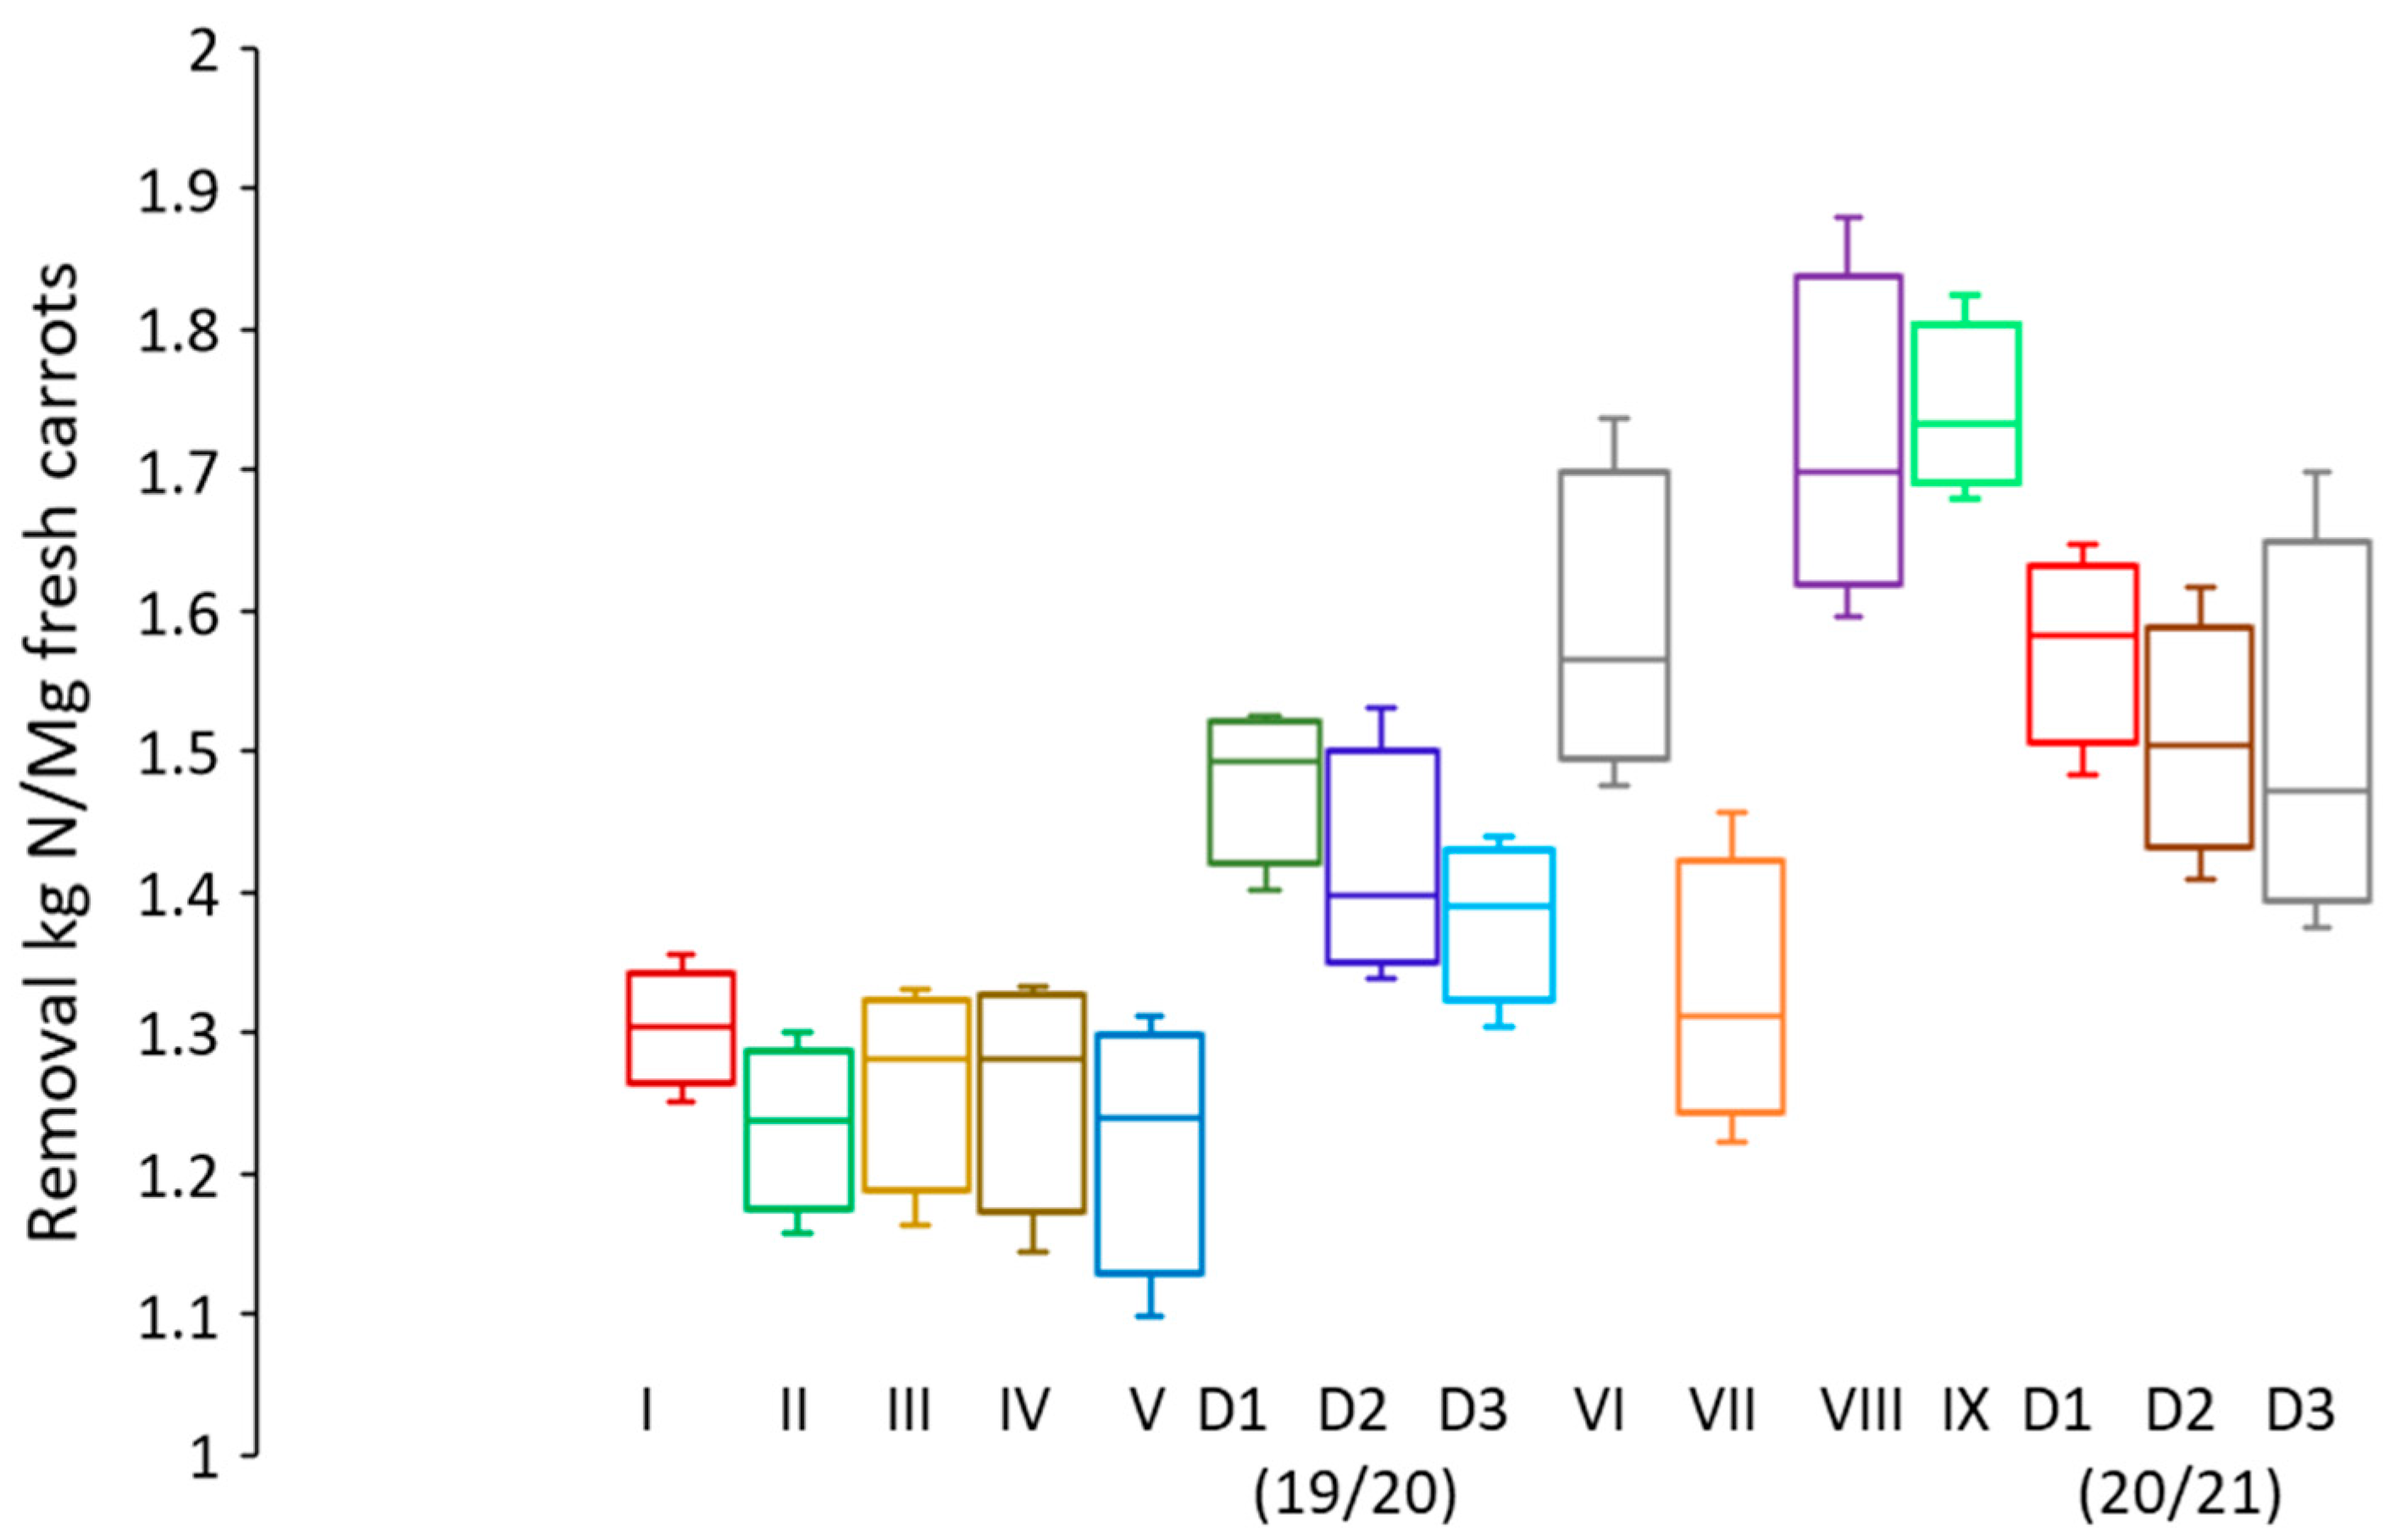
3. Results
3.1. Plant Density and Canopy Growth Model
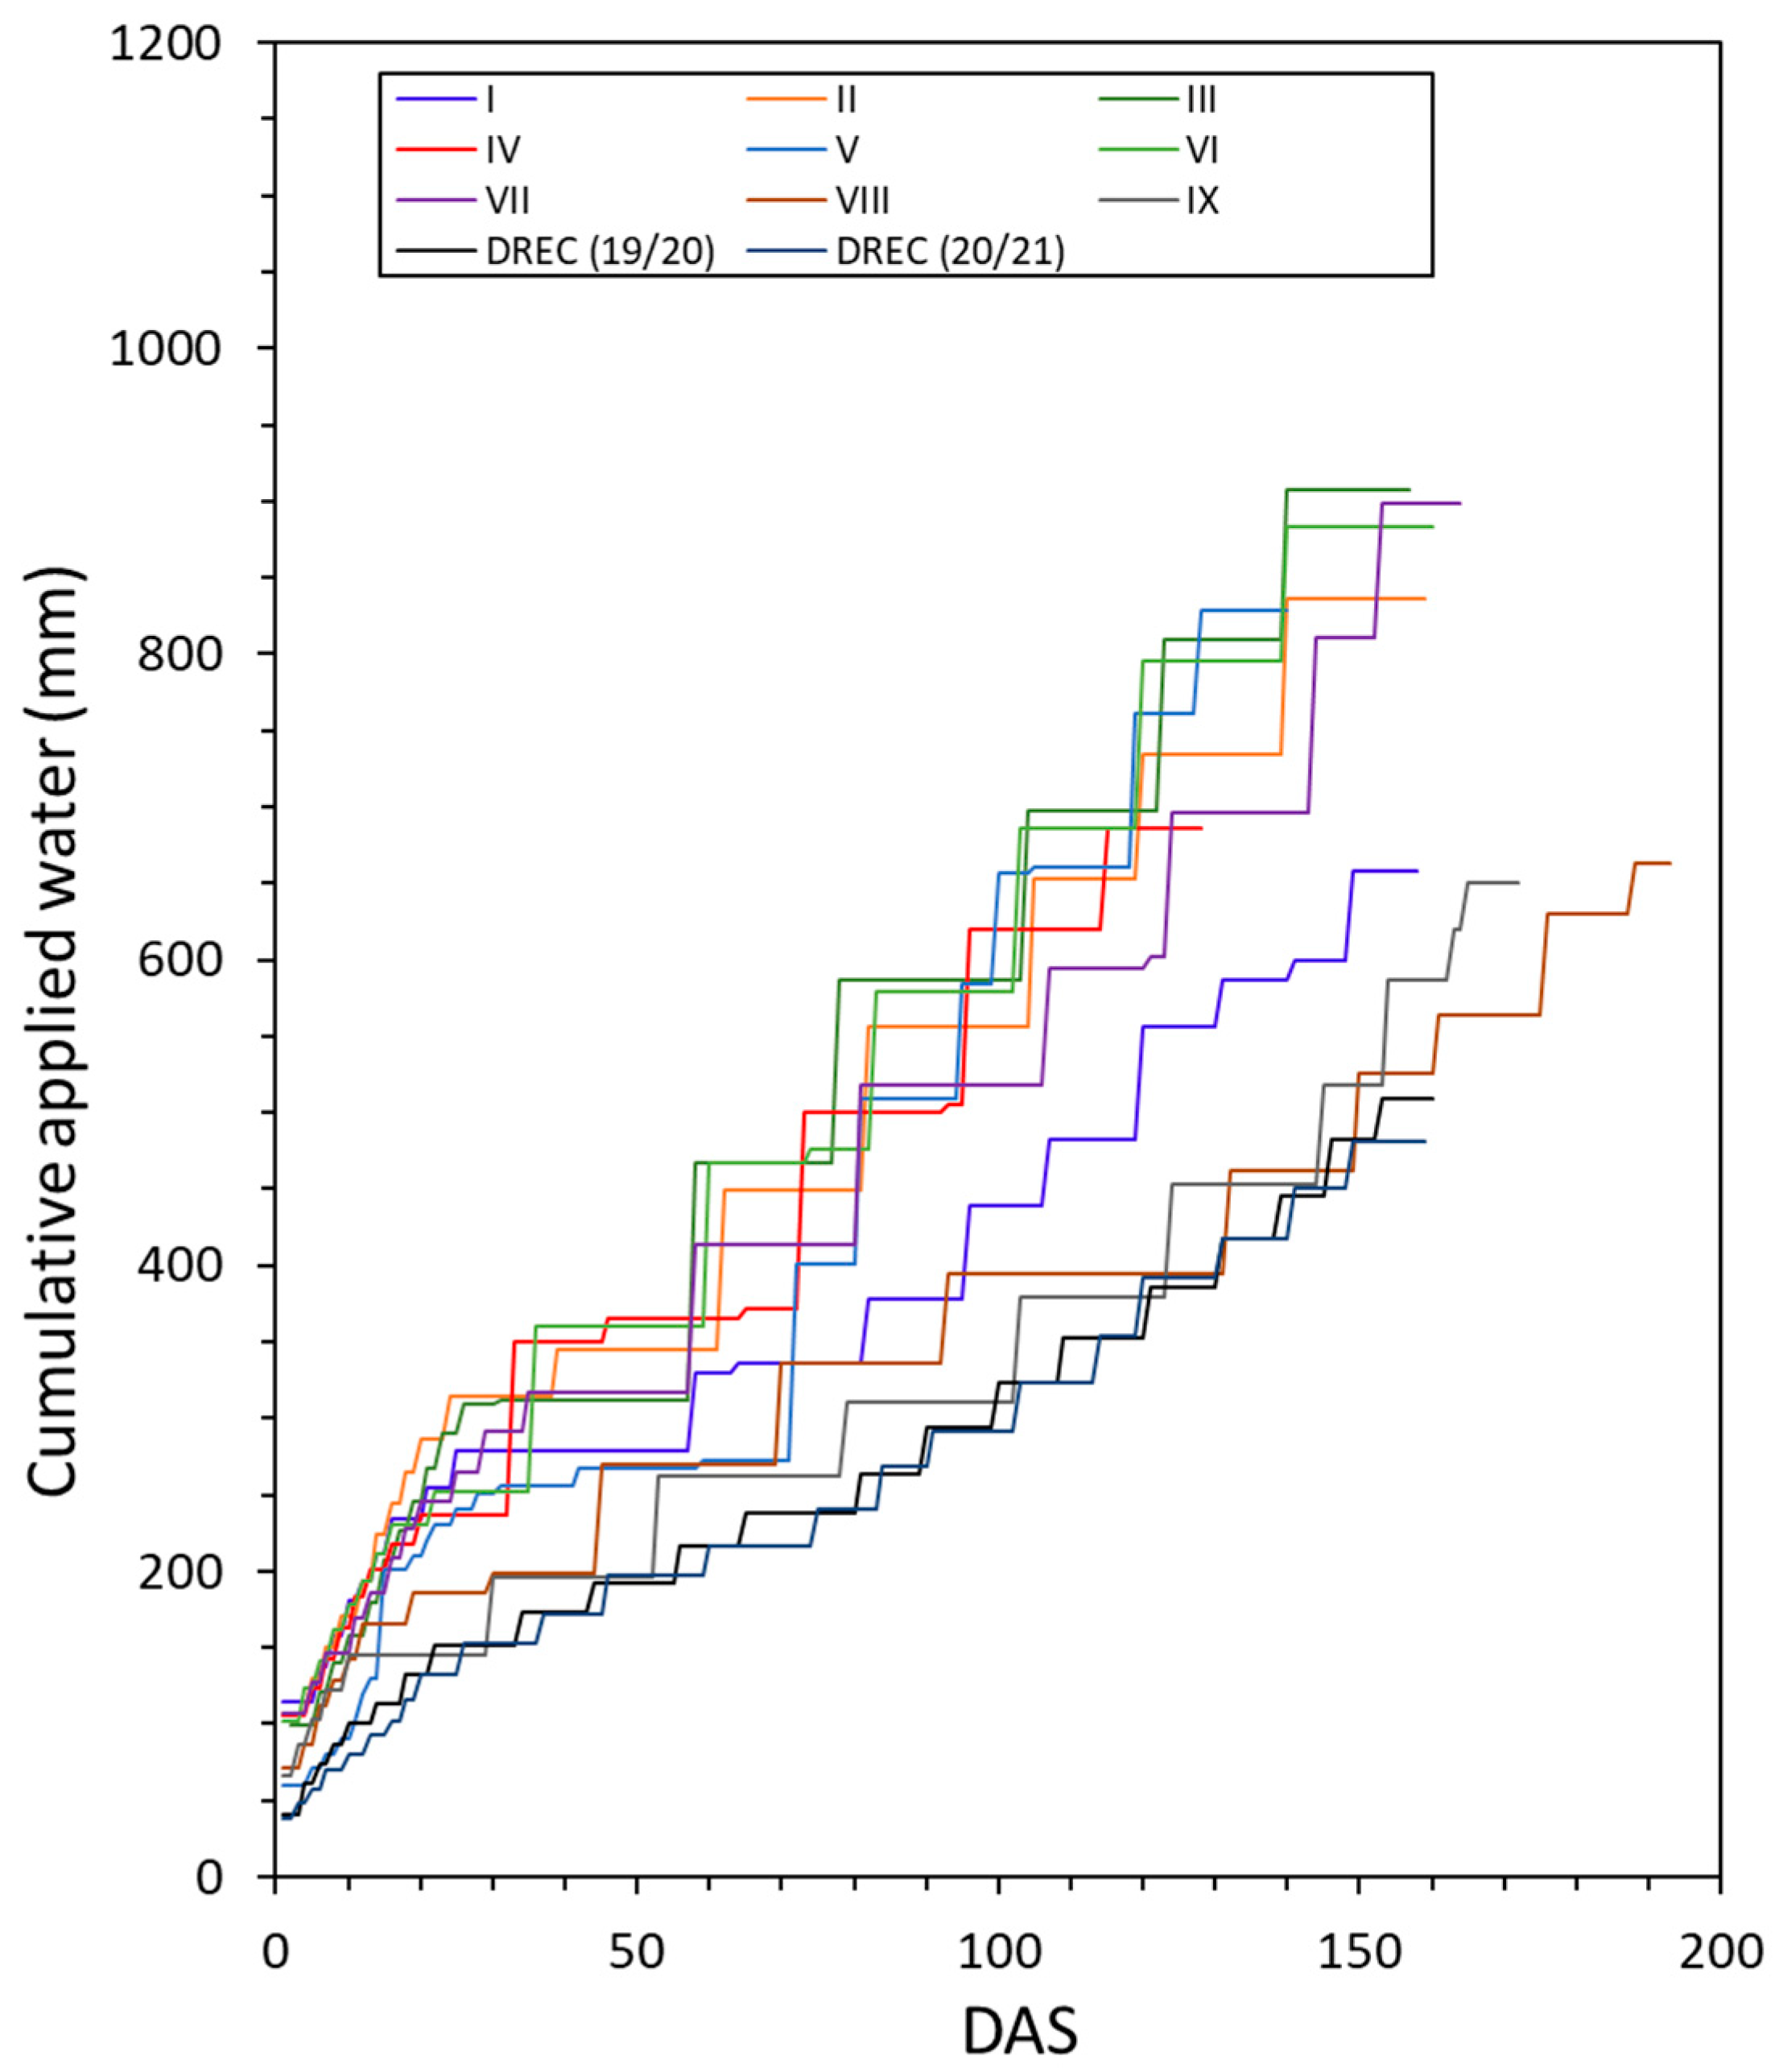
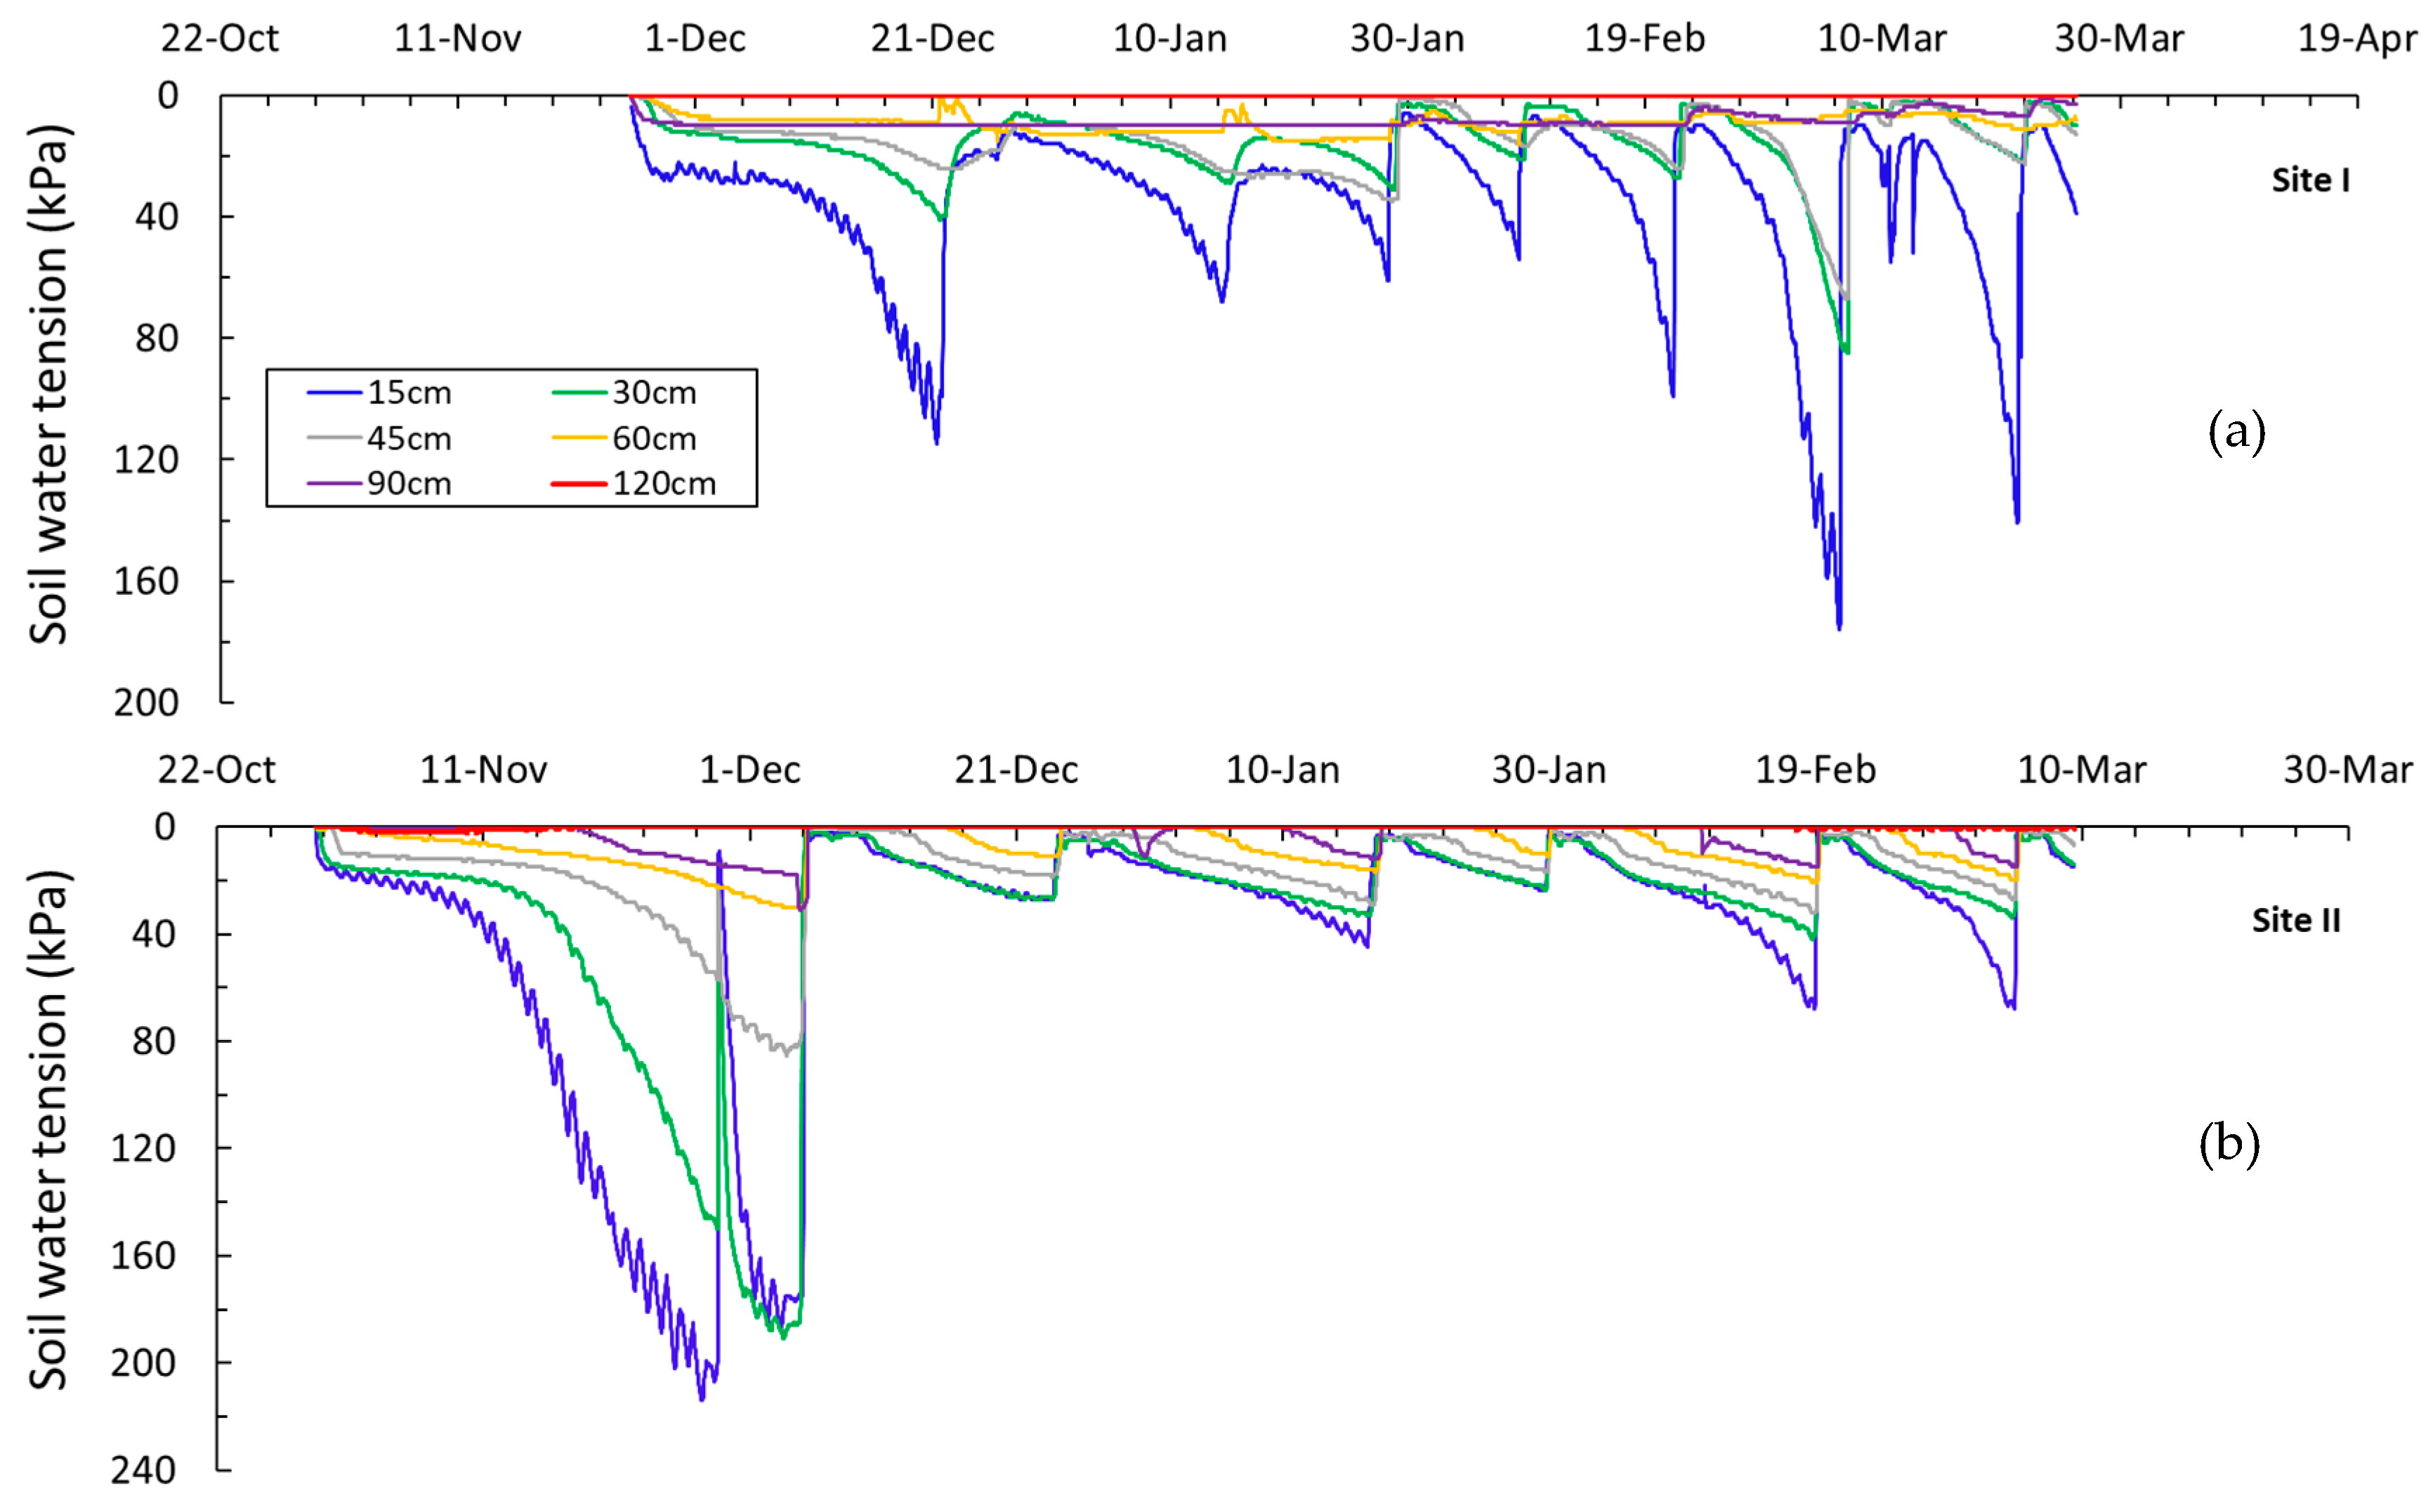
3.2. Applied Water and Soil Water Tension Status
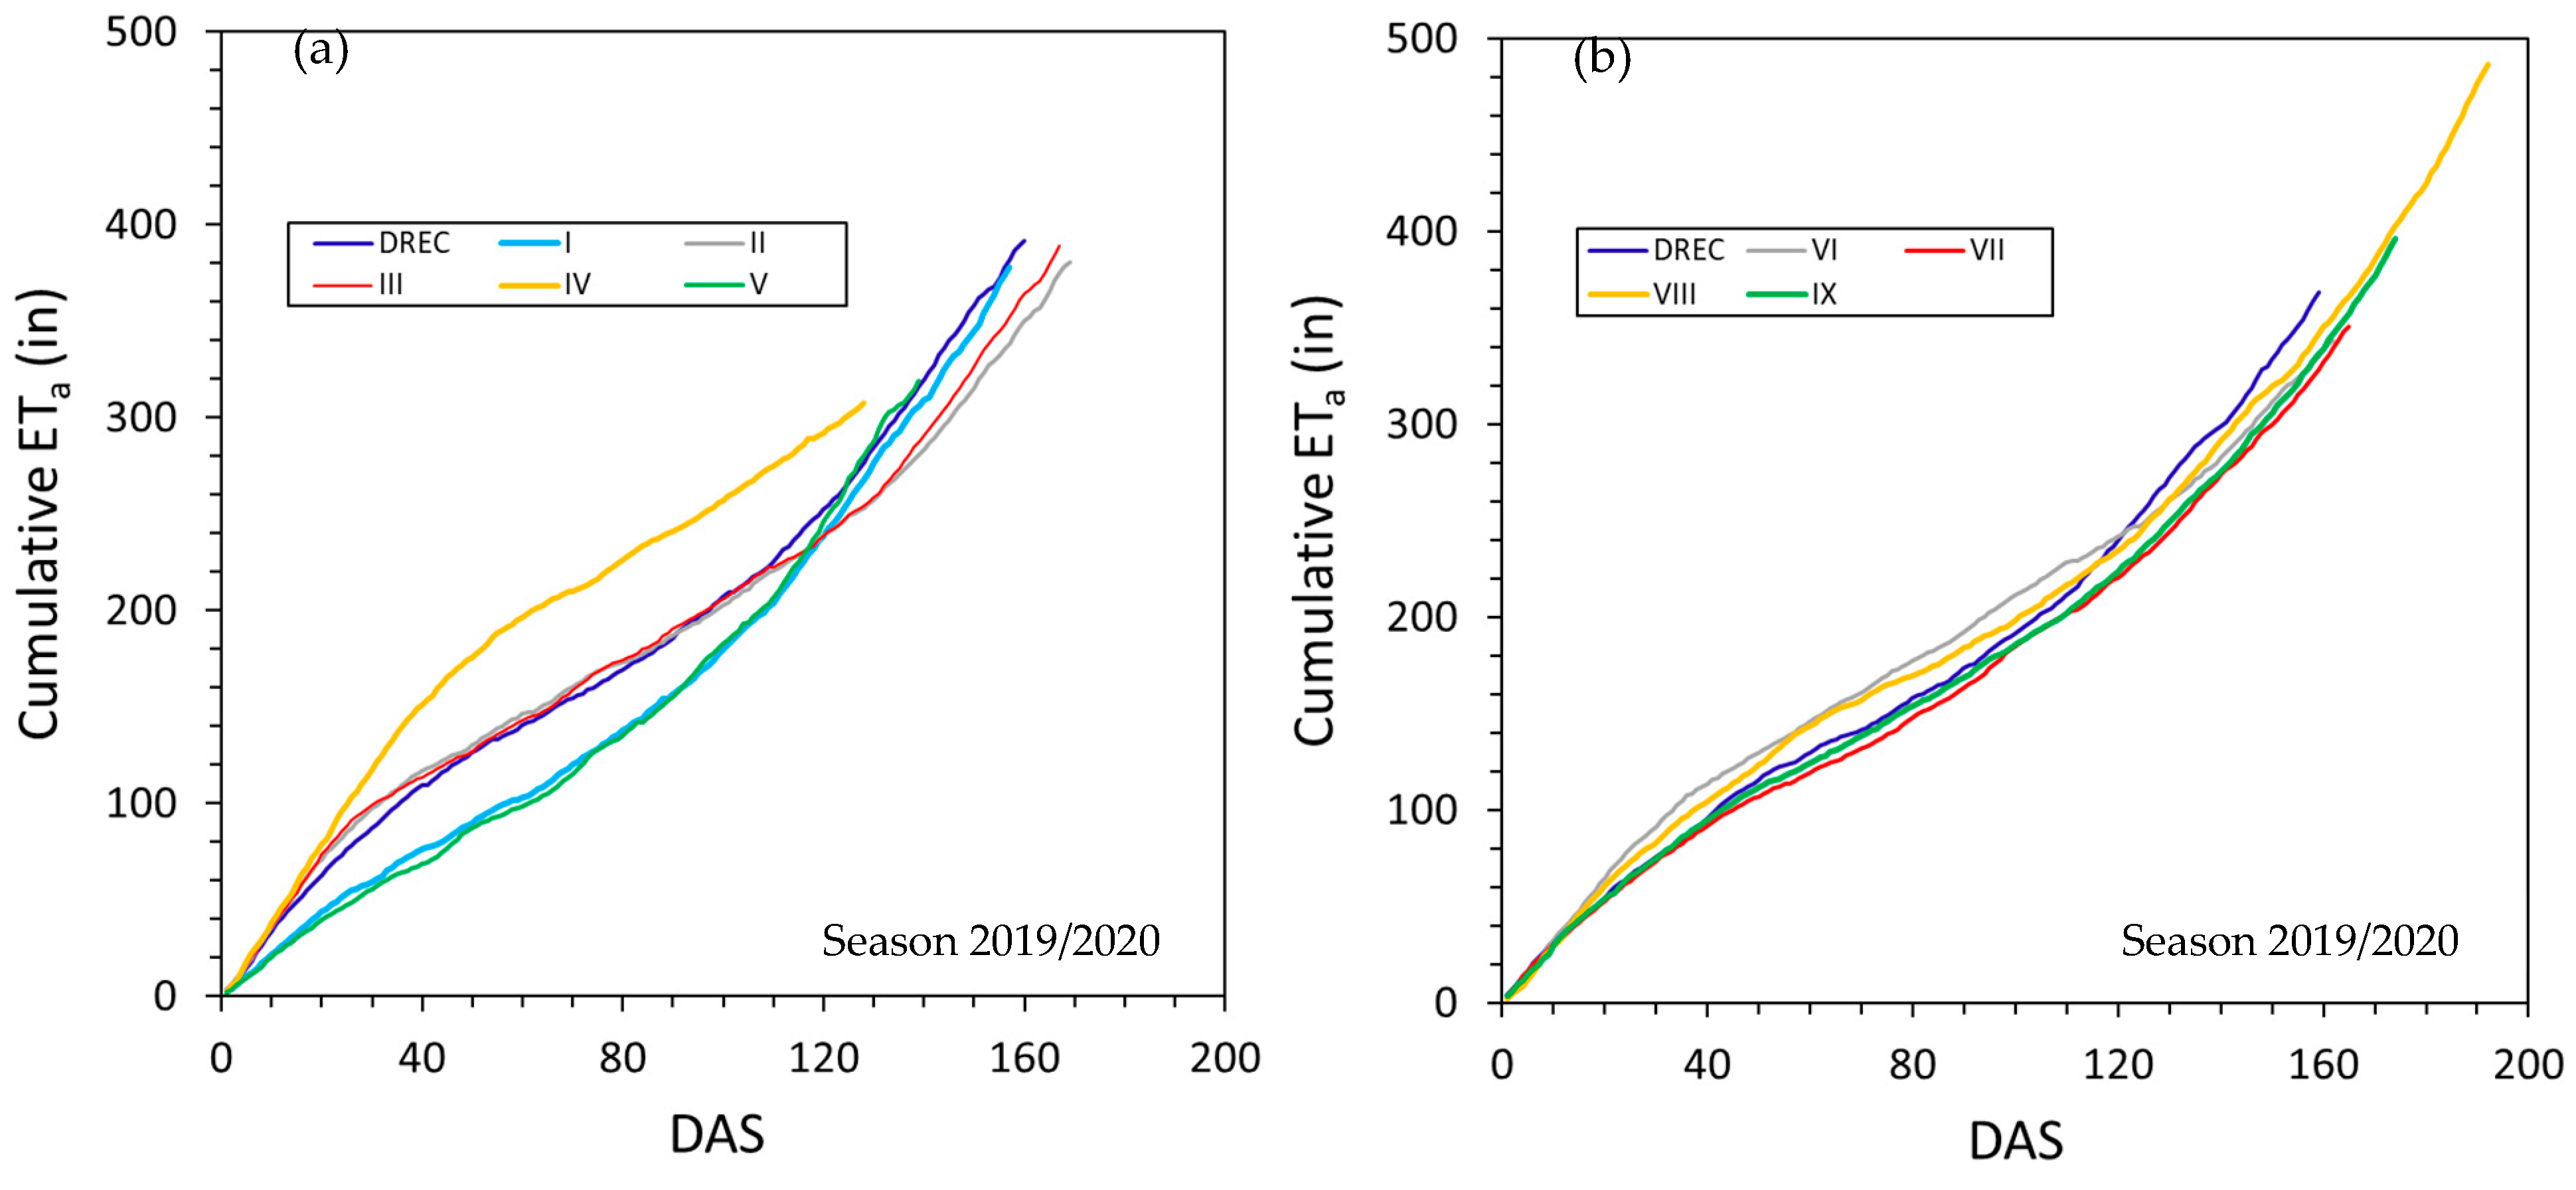
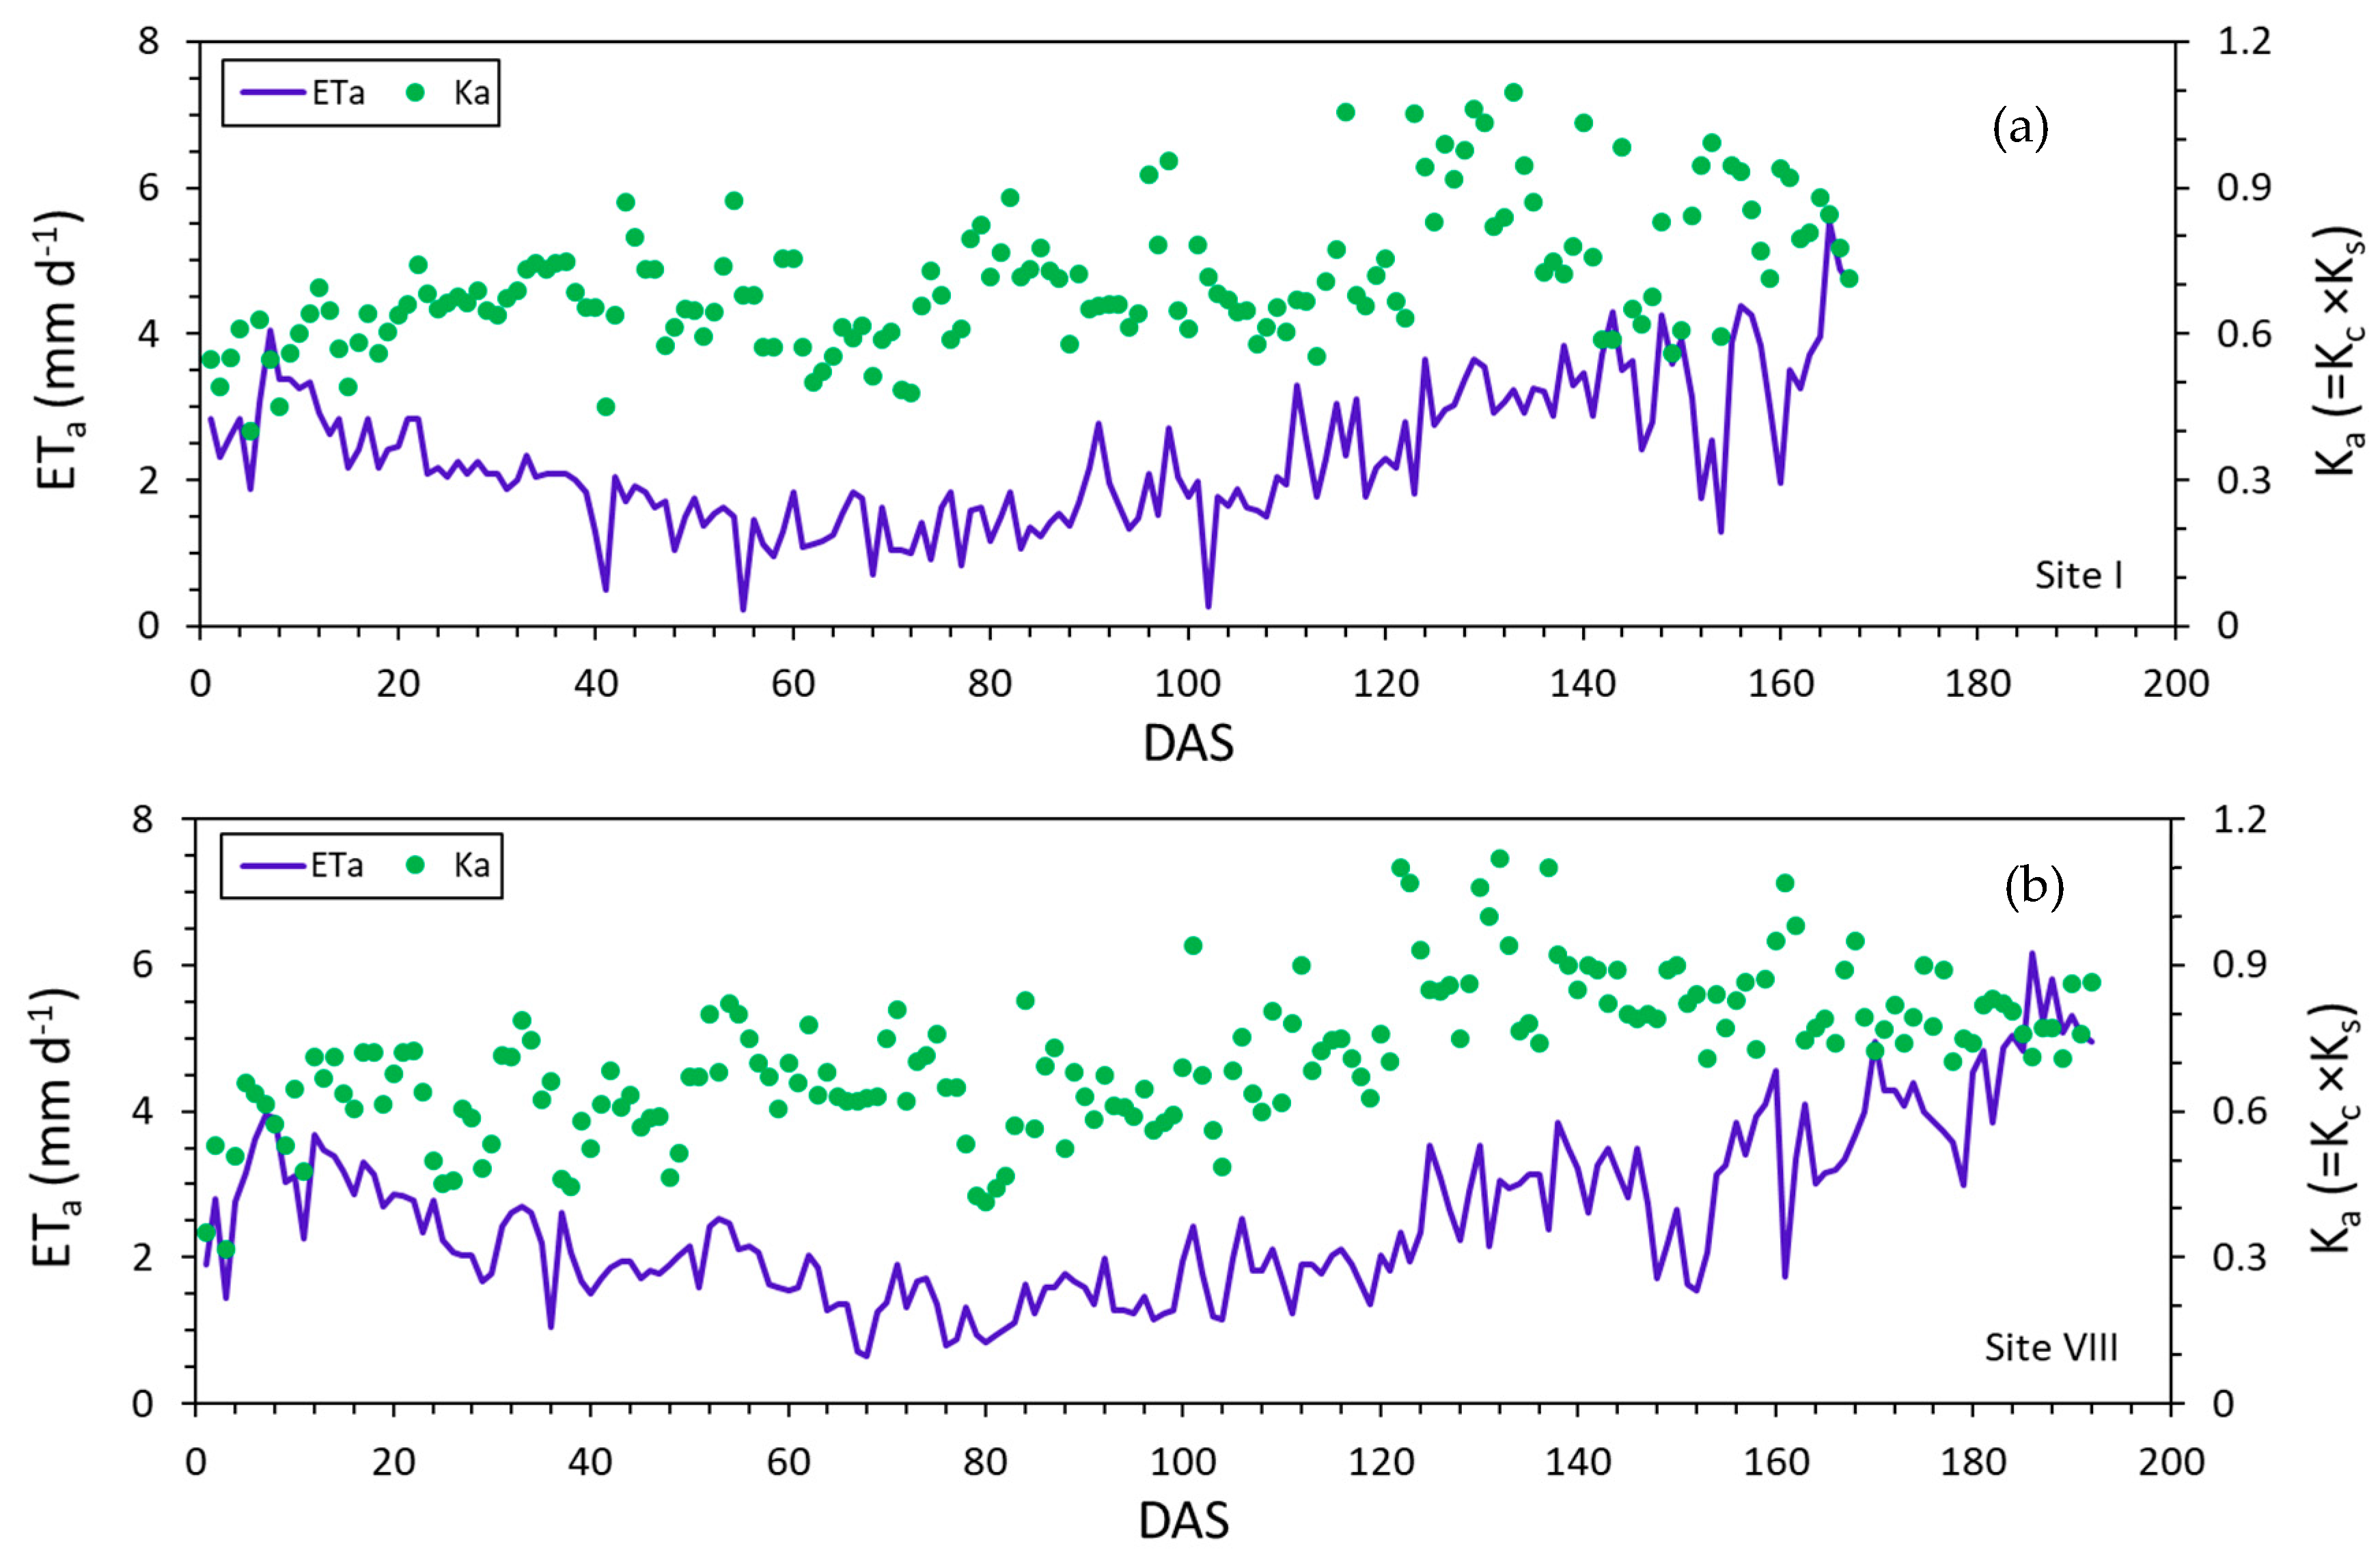
3.3. Actual Evapotranspiration and Crop Coefficients
3.4. Soil Nitrate-N Availability
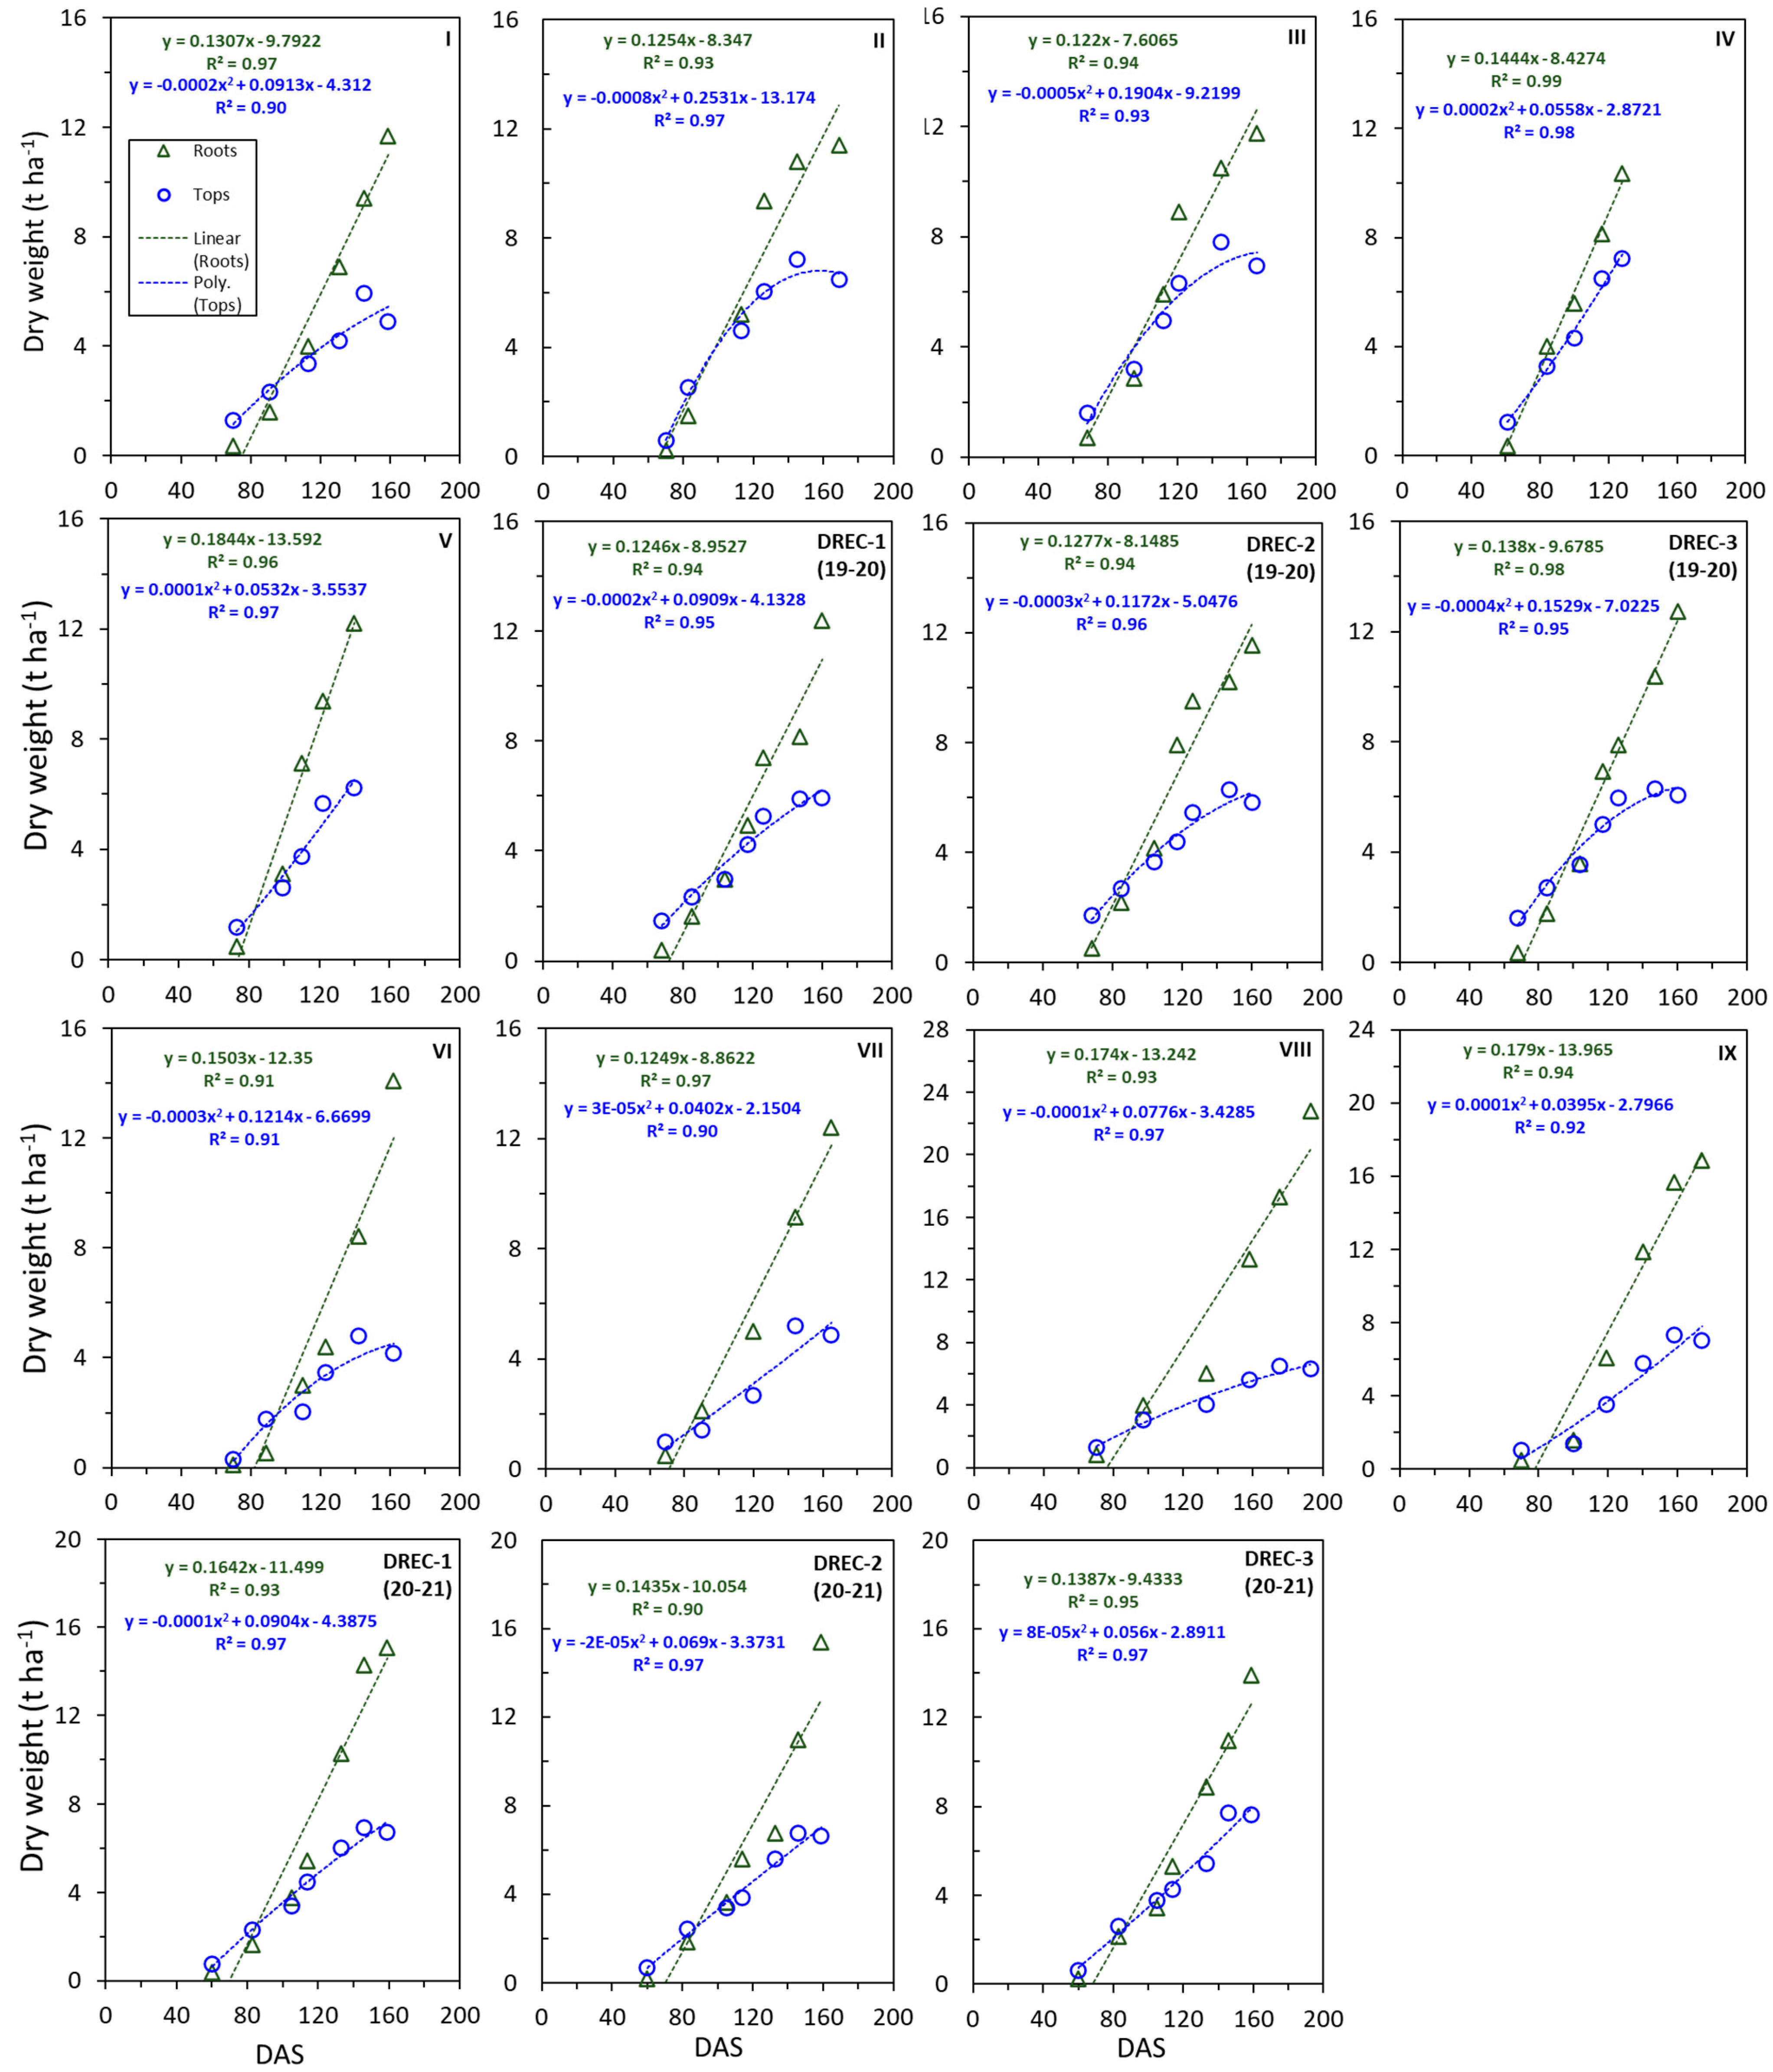
3.5. Dry Matter Accumulation
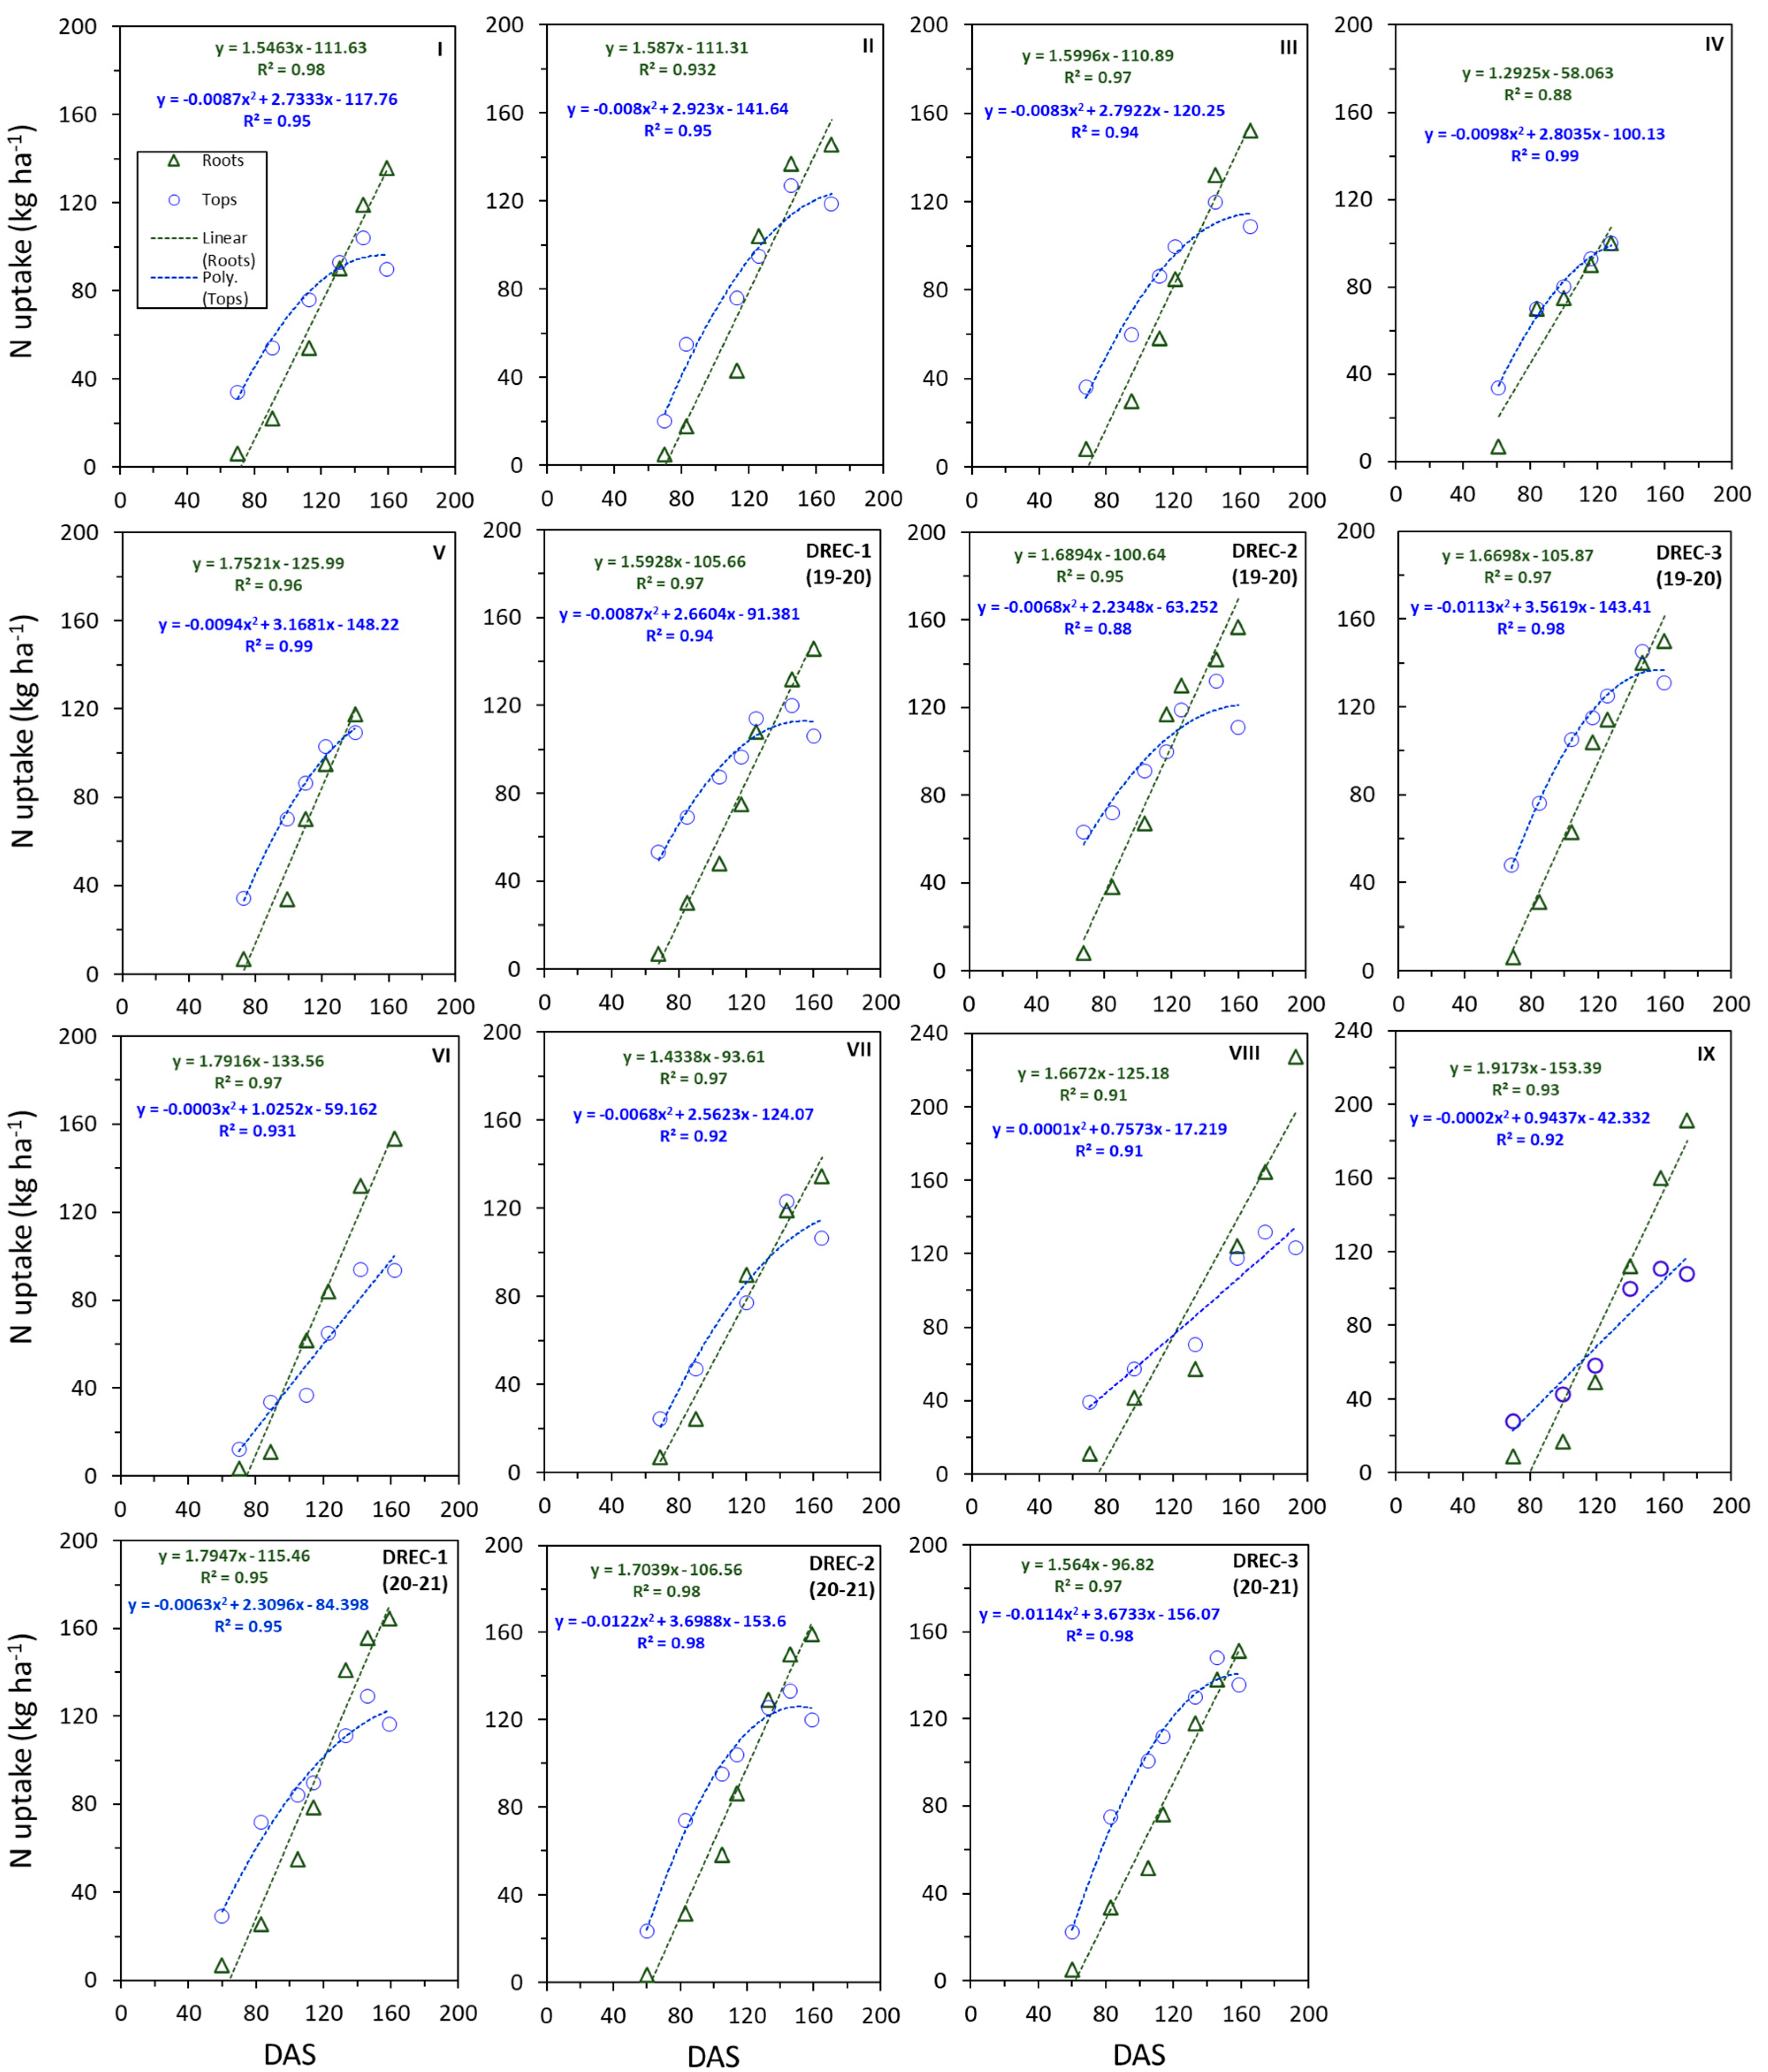
3.6. N Uptake
3.7. Fresh Root Yield
4. Discussion
4.1. Crop Water and Nitrogen Use
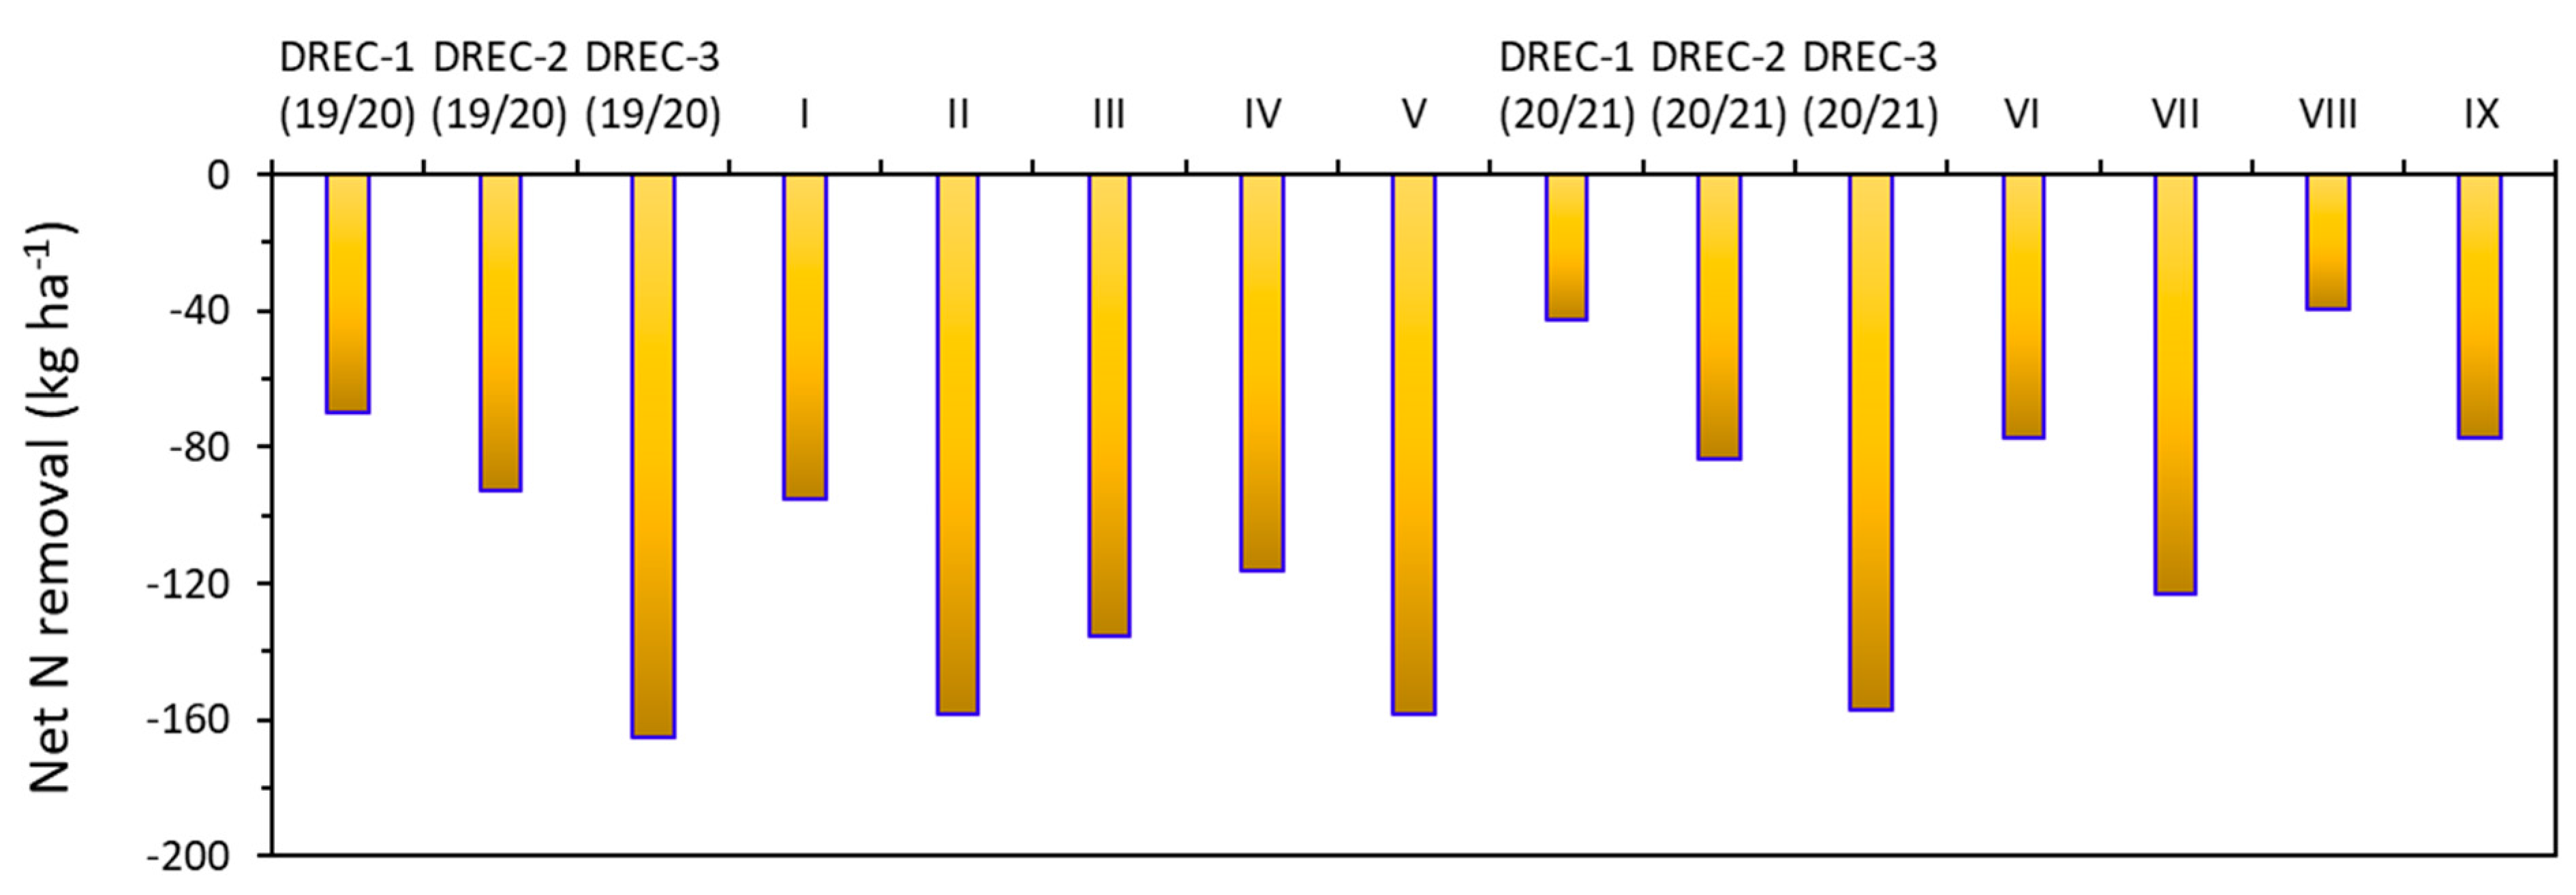
4.2. N Removal
5. Conclusions
Author Contributions
Funding
Acknowledgments
Conflicts of Interest
References
- Montazar, A. Best water and nitrogen management practices in the low desert carrots: A preliminary assessment. Agric. Briefs Imp. Cty. 2021, 24, 87–92. [Google Scholar]
- McGiffen, M.; Nunez, J.; Suslow, T.; Mayberry, K. Carrot Production in California (Vegetable Production Series Publication 7226), 1997. Oakland: Vegetable Research and Information Center, Division of Agriculture and Natural Resources, University of California. Available online: http://anrcatalog.ucdavis.edu/spicials.ihtml (accessed on 7 December 2019).
- Nunez, J.; Hartz, T.; Suslow, T.; McGiffen, M.; Natwick, E.T. Carrot Production in California. University of California Division of Agriculture and Natural Resources, University of California. Publication 7226. 2008. Available online: https://anrcatalog.ucanr.edu/pdf/7226.pdf (accessed on 7 March 2019).
- Mills, H.A. Carrot Daucus Carota var Sativus; University of Georgia: Athens, GA, USA, 2001. [Google Scholar]
- Westerveld, S.M. Nitrogen Dynamics of the Carrot Crop and Influences on Yield and Alternaria and Cercospora Leaf Blights. Ph.D. Thesis, University of Guelph, Guelph, ON, Canada, 2005. [Google Scholar]
- Westerveld, S.M.; McDonald, M.R.; McKeown, A.W. Carrot yield, quality, and storability in relation to preplant and residual nitrogen on mineral and organic soils. HortTechnology 2006, 16, 286–293. [Google Scholar] [CrossRef] [Green Version]
- Sanderson, K.R.; Ivany, J.A. Carrot yield response to nitrogen rate. J. Prod. Agric. 1997, 10, 336–339. [Google Scholar] [CrossRef]
- Gutezeit, B. Yield and nitrate content of carrots (Daucus carota L.) as affected by nitrogen supply. Acta Hortic. 1999, 506, 87–91. [Google Scholar] [CrossRef]
- Couper, G. The Biology, Epidemiology and Control of Sclerotinia Sclerotiorum on Carrots in Northeast Scotland. Ph.D. Thesis, University of Aberdeen, Aberdeen, UK, 2001. [Google Scholar]
- Westerveld, S.M. Nitrogen Management of Cabbage, Onions, and Carrots as Part of an Integrated Crop Management Program in Ontario. Master’s Thesis, University of Guelph, Guelph, ON, Canada, 2002. [Google Scholar]
- Zebarth, B.J.; Leclerc, Y.; Moreau, G. Rate and timing of nitrogen fertilization of Russet Burbank potato: Nitrogen use efficiency. Can. J. Plant Sci. 2004, 84, 845–854. [Google Scholar] [CrossRef]
- Thorup-Kristensen, K.; van den Boogaard, R. Vertical and horizontal development of the root system of carrots following green manure. Plant Soil 1999, 212, 145–153. [Google Scholar] [CrossRef]
- Westerveld, S.M.; McKeown, A.W.; McDonald, M.R. Distribution of nitrogen uptake, fibrous roots, and nitrogen in the soil profile for fresh-market and processing carrot cultivars. Can. J. Plant Sci. 2006, 86, 1227–1237. [Google Scholar] [CrossRef]
- Hochmuth, G.J.; Brecht, J.K.; Bassett, M.J. Nitrogen fertilization to maximize carrot yield and quality on a sandy soil. HortScience 1999, 34, 641–645. [Google Scholar] [CrossRef] [Green Version]
- Kumazawa, K. Nitrogen fertilization and nitrate pollution in groundwater in Japan: Present status and measures for sustainable agriculture. Nutr. Cycl. Agroecosyst. 2002, 63, 129–137. [Google Scholar] [CrossRef]
- Burdine, H.W.; Hall, C.B. Carrot responses to fertilizer levels on Everglades organic soils. Proc. Fla. State Hort. Soc. 1976, 89, 120–125. [Google Scholar]
- Nilsson, T. Yield, storage ability, quality and chemical composition of carrot, cabbage and leek at conventional and organic fertilizing. Acta Hortic. 1979, 93, 209–215. [Google Scholar] [CrossRef]
- Jackson, T.; Soil Acidity an Important Factor in Production of Beans, Lettuce, Carrots. 1979, Oregon State University. Available online: https://agsci.oregonstate.edu/oregon-vegetables/soil-acidity-important-factor-vegetable-yields (accessed on 4 April 2019).
- Sikora, J.; Niemiec, M.; Tabak, M.; Gródek-Szostak, Z.; Szeląg-Sikora, A.; Kuboń, M.; Komorowska, M. Assessment of the Efficiency of Nitrogen Slow-Release Fertilizers in Integrated Production of Carrot Depending on Fertilization Strategy. Sustainability 2020, 12, 1982. [Google Scholar] [CrossRef] [Green Version]
- Abdel-mawly, S.E. Growth, yield, N uptake and water use efficiency of carrot (Daucus carota L.) plants as influenced by irrigation level and nitrogen fertilization rate. Assiut Univ. Bull. Environ. Res. 2004, 7, 111–122. [Google Scholar]
- Gutezeit, B. Yield and quality of carrots as affected by soil moisture and N fertilization. J. Hortic. Sci. Biotechnol. 2002, 76, 736–738. [Google Scholar] [CrossRef]
- Paradiso, R.; De Pascale, S.; Barbier, G. Effects of water regime and nitrogen supply on yield and mineral composition of carrot. Itlus Hortus 2002, 8, 8–13. [Google Scholar]
- Reid, J.B.; Gillespie, R.N. Yield and quality responses of carrots (Daucus carota L.) to water deficits. N. Zealand J. Crop. Hortic. Sci. 2017, 45, 299–312. [Google Scholar] [CrossRef]
- Carvalho, D.F.; Domínguez, A.; Oliveira Neto, D.H.; Tarjuelo, J.M.; Martínez-Romero, A. Combination of date with deficit irrigation for improving the profitability of carrot in a tropical environment (Brazil). Sci. Hortic. 2014, 179, 112–121. [Google Scholar] [CrossRef]
- Snyder, R.L.; Spano, D.; Pawu, K.T. Surface Renewal analysis for sensible and latent heat flux density. Bound. Layer Meteorol 1996, 77, 249–266. [Google Scholar] [CrossRef]
- Spano, D.; Snyder, R.L.; Duce, P.; Pawu, K.T. Surface renewal analysis for sensible heat flux density using structure functions. Agric. For. Meteorol. 1997, 86, 259–271. [Google Scholar] [CrossRef]
- Shaw, R.H.; Snyder, R.L. Evaporation and eddy covariance. Encyclopedia of Water Science; Stewart, B.A., Howell, T., Eds.; Marcel Dekker: New York, NY, USA, 2003. [Google Scholar]
- Montazar, A.; Rejmanek, H.; Tindula, G.N.; Little, C.; Shapland, T.M.; Anderson, F.E.; Inglese, G.; Mutters, R.G.; Linquist, B.; Greer, C.A.; et al. Crop coefficient curve for paddy rice from residual of the energy balance calculations. J. Irrig. Drain. Eng. 2017, 143, 04016076. [Google Scholar] [CrossRef] [Green Version]
- Massman, W.J.; Lee, X. Eddy covariance flux corrections and uncertainties in long-term studies of carbon and energy exchanges. Agric. For. Meteorol. 2002, 113, 121–144. [Google Scholar] [CrossRef]
- Pawu, K.T.; Snyder, R.L.; Spano, D.; Su, H.B. Surface Renewal Estimates of Scalar Exchange. Micrometeorology in Agricultural Systems; Hatfield, J.L., Baker, J.M., Eds.; Agronomy Society of America: Madison, WI, USA, 2005; pp. 455–483. [Google Scholar]
- Shapland, T.M.; McElrone, A.J.; Pawu, K.T.; Snyder, R.L. A turnkey data logger program for field-scale energy flux density measurements using eddy covariance and surface renewal. Ital. J. Agrometeorol. 2013, 1, 1–9. [Google Scholar]
- Montazar, A.; Krueger, R.; Corwin, D.; Pourreza, A.; Little, C.; Rios, S.; Snyder, R.L. Determination of Actual Evapotranspiration and Crop Coefficients of California Date Palms Using the Residual of Energy Balance Approach. Water 2020, 12, 2253. Available online: https://www.mdpi.com/2073-4441/12/8/2253 (accessed on 4 July 2021). [CrossRef]
- ILRP Website. Available online: https://www.waterboards.ca.gov/water_issues/programs/agriculture/ (accessed on 12 June 2021).
- Geisseler, D.; Horwath, W.R. Sampling for Soil Nitrate Determination. 2016. Available online: https://apps1.cdfa.ca.gov/FertilizerResearch/docs/Soil_Sampling_Nitrate.pdf (accessed on 15 June 2021).
- Montazar, A.; Bachie, O.; Corwin, D.; Putnam, D. Feasibility of Moderate Deficit Irrigation as a Water Conservation Tool in California’s Low Desert Alfalfa. Agronomy 2020, 10, 1640. Available online: https://www.mdpi.com/2073-4395/10/11/1640 (accessed on 4 August 2021). [CrossRef]
- CIMIS Website. Available online: http://wwwcimis.water.ca.gov/SpatialData.aspx (accessed on 5 July 2021).
- Allen, R.; Pereira, L.S.; Raes, D.; Smith, M. Crop Evapotranspiration: Guidelines for Computing Crop Water Requirements; Irrigation and Drainage Paper 56; FAO: Rom, Italy, 2006. [Google Scholar]
- Westerveld, S.M.; McKeown, A.W.; McDonald, M.R. Seasonal nitrogen partitioning and nitrogen uptake of carrots as affected by nitrogen application in a mineral and an organic soil. HortScience 2006, 41, 1332–1338. [Google Scholar] [CrossRef] [Green Version]
- Tremblay, N.; Scharpf, H.; Weier, U.; LaurenceJ, H.; Owen, J. Nitrogen Management in Field Vegetables: A Guide to Efficient Fertilization. 2001. Available online: http://dsp-psd.pwgsc.gc.ca/Collection/A42-92-2001E.pdf (accessed on 5 June 2018).
- Kristensen, H.L.; Thorup-Kristensen, K. Uptake of 15 N labeled nitrate by root systems of sweet corn, carrot and white cabbage from 0.2–2.5 meters depth. Plant Soil 2004, 265, 93–100. [Google Scholar] [CrossRef]
- Thorup-Kristensen, K. Root growth and nitrogen uptake of carrot, early cabbage, onion and lettuce following a range of green manures. Soil Use Manag. 2006, 22, 29–38. [Google Scholar] [CrossRef]
- Fritz, V.; Tong, C.; Rosen, C.; Wright, J. Vegetable Crop Management: Carrots Daucus Carota Bulletin WW-7196-GO). 1998, University of Minnesota Extension Service. Available online: http://www.extension.umn.edu/distribution/horticulture/DG7196.html (accessed on 2 June 2017).
- Warncke, D.D.; Christenson, D.R.; Jacobs, L.W.; Vitosh, M.L.; Zandstra, B.H. Fertilizer Recommendations for Vegetable Crops in Michigan (Extension Bulletin E550B); Michigan State University: East Lansing, MI, USA, 1992. [Google Scholar]
- Sidhu, J.; Takele, E.; Montazar, A.; Goodrich, B.; Cantwell, M. Carrot Production in California; Publication 7226 (Updated Version); University of California Division of Agriculture and Natural Resources, University of California: Oakland, CA, USA, 2021; Under publication. [Google Scholar]


| Month | Season 2019–2020 | Season 2020–2021 | 10-Year Mean Temp. (°C) | 10-Year Mean Total Rainfall (mm) | 10-Year Mean Total ETo (mm) | ||||
|---|---|---|---|---|---|---|---|---|---|
| Mean Temp. (°C) | Total Rainfall (mm) | Total ETo (mm) | Mean Temp. (°C) | Total Rainfall (mm) | Total ETo (mm) | ||||
| October | 28.9 | 0.0 | 146.5 | 30.6 | 0.0 | 131.5 | 23.9 | 30.9 | 129.9 |
| November | 17.1 | 19.4 | 80.5 | 16.9 | 0.0 | 79.4 | 17.2 | 2.8 | 81.3 |
| December | 12.9 | 8.7 | 56.9 | 11.7 | 0.0 | 62.3 | 12.6 | 5.9 | 58.7 |
| January | 12.6 | 0.0 | 65.9 | 12.9 | 16.5 | 67.6 | 13.0 | 9.0 | 66.3 |
| February | 14.4 | 8.1 | 90.7 | 14.7 | 1.5 | 98.2 | 15.0 | 7.9 | 91.0 |
| March | 16.5 | 65.6 | 63.4 | 16.6 | 3.8 | 159.2 | 19.1 | 7.6 | 156.3 |
| April | 22.0 | 3.8 | 192.2 | 22.9 | 0.0 | 205.6 | 22.2 | 1.5 | 197.0 |
| Experimental Site | Generic (Horizon m) | Soil Texture | Organic Matter (%) | NO3-N (ppm) | P (ppm) | K (ppm) | CEC (meq/100 g) | EC (dS/m) | pH |
|---|---|---|---|---|---|---|---|---|---|
| DREC (19–20) | 0–0.3 | Sandy clay loam | 0.96 | 14.8 | 18.0 | 283 | 18.4 | 1.7 | 8.0 |
| 0.3–0.6 | Sandy loam | 0.69 | 3.5 | 11.2 | 224 | 16.7 | 1.1 | 8.2 | |
| 0.6–0.9 | Sandy loam | 0.53 | 0.5 | 4.0 | 111 | 12.4 | 1.1 | 8.3 | |
| I | 0–0.3 | Silty clay loam | 1.18 | 15.4 | 109.5 | 141 | 30.9 | 1.6 | 8.1 |
| 0.3–0.6 | Silty clay | 0.85 | 9.4 | 8.2 | 326 | 45.1 | 1.5 | 8.4 | |
| 0.6–0.9 | Clay | 0.97 | 7.0 | 5.9 | 360 | 63.7 | 1.6 | 8.6 | |
| II | 0–0.3 | Sandy loam | 1.01 | 21.1 | 9.7 | 76 | 17.5 | 1.6 | 7.7 |
| 0.3–0.6 | Sandy loam | 0.79 | 11.0 | 13.1 | 63 | 17.9 | 1.0 | 7.0 | |
| 0.6–0.9 | Sandy loam | 0.71 | 6.3 | 5.4 | 59 | 16.0 | 0.9 | 8.0 | |
| III | 0–0.3 | Sandy loam | 0.94 | 18.7 | 11.6 | 87 | 16.8 | 1.5 | 8.0 |
| 0.3–0.6 | Silty loam | 1.03 | 11.4 | 14.2 | 67 | 19.2 | 1.0 | 7.9 | |
| 0.6–0.9 | Loamy sand | 0.59 | 7.8 | 7.3 | 66 | 14.7 | 1.1 | 8.1 | |
| IV | 0–0.3 | Silty loam | 1.12 | 10.7 | 14.4 | 74 | 24.2 | 1.8 | 7.9 |
| 0.3–0.6 | Silty loam | 0.79 | 6.0 | 5.6 | 55 | 22.4 | 1.6 | 8.0 | |
| 0.6–0.9 | Sandy loam | 0.50 | 2.7 | 4.3 | 29 | 14.1 | 0.9 | 8.1 | |
| V | 0–0.3 | Sandy loam | 0.99 | 6.8 | 50.9 | 85 | 15.2 | 1.3 | 7.8 |
| 0.3–0.6 | Silty loam | 0.72 | 2.3 | 9.9 | 46 | 20.0 | 0.4 | 8.2 | |
| 0.6–0.9 | Sandy loam | 0.57 | 2.6 | 5.6 | 39 | 17.2 | 0.8 | 8.1 | |
| DREC (20–21) | 0–0.3 | Sandy clay loam | 0.98 | 16.1 | 19.4 | 303 | 18.9 | 1.7 | 8.0 |
| 0.3–0.6 | Sandy loam | 0.73 | 8.2 | 14.2 | 264 | 17.3 | 1.3 | 8.1 | |
| 0.6–0.9 | Sandy loam | 0.56 | 3.3 | 10.5 | 178 | 13.0 | 1.2 | 8.2 | |
| VI | 0–0.3 | Sandy loam | 0.94 | 10.1 | 25.0 | 99 | 14.5 | 1.5 | 8.0 |
| 0.3–0.6 | Sandy loam | 0.70 | 6.8 | 9.3 | 66 | 16.7 | 0.6 | 8.2 | |
| 0.6–0.9 | Sandy loam | 0.51 | 6.7 | 2.9 | 73 | 12.7 | 1.4 | 8.3 | |
| VII | 0–0.3 | Silty loam | 1.49 | 15.5 | 79.4 | 101 | 19.3 | 1.6 | 7.9 |
| 0.3–0.6 | Silty loam | 0.76 | 5.0 | 10.7 | 65 | 15.6 | 1.3 | 8.2 | |
| 0.6–0.9 | Loamy sand | 0.6 | 2.5 | 1.9 | 63 | 15.5 | 3.3 | 8.3 | |
| VIII | 0–0.3 | Sandy clay loam | 1.41 | 30.1 | 5.7 | 78 | 19.2 | 2.3 | 8.2 |
| 0.3–0.6 | Sandy clay loam | 1.09 | 19.9 | 2.3 | 71 | 23.7 | 2.1 | 8.3 | |
| 0.6–0.9 | Sandy loam | 0.65 | 14.2 | 1.3 | 71 | 16.2 | 5.7 | 8.0 | |
| IX | 0–0.3 | Silty loam | 1.21 | 30.3 | 8.8 | 80 | 22.1 | 2.0 | 8.1 |
| 0.3–0.6 | Silty loam | 1.04 | 24.8 | 2.4 | 61 | 22.4 | 2.4 | 8.1 | |
| 0.6–0.9 | Sandy loam | 0.62 | 13.8 | 1.8 | 40 | 11.6 | 3.2 | 8.1 |
| Season | Experimental Site | Seeding Date | Harvest Date | Irrigation Practice | Carrot Type |
|---|---|---|---|---|---|
| 2019–2020 | DREC | 11 October 2019 | 18 March 2020 (DAS 160) | Sprinkler | Fresh market |
| I | 24 October 2019 | 30 March 2020 (DAS 159) | Sprinkler | Fresh market | |
| II | 2 October 2019 | 19 March 2020 (DAS 169) | Furrow | Fresh market | |
| III | 4 October 2019 | 17 March 2020 (DAS 166) | Furrow | Fresh market | |
| IV | 25 September 2019 | 30 January 2020 (DAS 128) | Furrow | Processing | |
| V | 29 October 2019 | 16 March 2020 (DAS 140) | Furrow | Processing | |
| 2020–2021 | DREC | 14 October 2020 | 21 March 2021 (DAS 159) | Sprinkler | Fresh market |
| VI | 1 October 2020 | 11 March 2021 (DAS 162) | Furrow | Processing | |
| VII | 13 October 2020 | 26 March 2021 (DAS 165) | Furrow | Processing | |
| VIII | 2 October 2020 | 12 April 2021 (DAS 193) | Sprinkler | Fresh market | |
| IX | 16 October 2020 | 7 April 2021 (DAS 174) | Sprinkler | Processing |
| Site | DREC (19–20) | I | II | III | IV | V | DREC (20–21) | VI | VII | VIII | IX |
|---|---|---|---|---|---|---|---|---|---|---|---|
| Plant Density | 140 ± 7 | 129 ± 12 | 126 ± 14 | 141 ± 5 | 318 ± 11 | 320 ± 16 | 133 ± 6 | 297 ± 25 | 292 ± 31 | 128 ± 9 | 307 ± 13 |
| Experimental Site | N Application Rate (kg ha−1) | Pre-Seeding | Post-Harvest | ||||
|---|---|---|---|---|---|---|---|
| 30–60 cm | 60–90 cm | 90–120 cm | 30–60 cm | 60–90 cm | 90–120 cm | ||
| Fresh Market Carrots | |||||||
| DREC-1 (20–21) | 197.5 | 15.2 | 11.2 | 13.7 | 4.3 | 3.8 | 13.0 |
| DREC-1 (19–20) | 205.2 | 12.1 | 7.9 | 13.4 | 10.8 | 8.3 | 12.5 |
| I | 220.9 | 10.3 | 9.8 | 8.9 | 10.7 | 7.9 | 8.5 |
| DREC-2 (20–21) | 232.5 | 16.7 | 11.5 | 14.1 | 5.6 | 6.5 | 14.7 |
| DREC-2 (19–20) | 239.4 | 10.7 | 11.3 | 13.2 | 11.3 | 13.0 | 12.8 |
| VIII | 256.6 | 19.9 | 14.2 | 13.4 | 4.4 | 8.2 | 12.6 |
| III | 277.5 | 8.7 | 11.1 | 9.5 | 2.7 | 8.9 | 11.5 |
| II | 293.7 | 14.7 | 13.2 | 7.2 | 12.5 | 15.7 | 10.8 |
| DREC-3 (20–21) | 298.2 | 15.5 | 12.4 | 12.6 | 16.3 | 14.5 | 14.3 |
| DREC-3 (19–20) | 305.3 | 11.0 | 8.8 | 14.7 | 13.3 | 12.3 | 16.1 |
| Significance | L | NS | NS | NS | NS | * | NS |
| Q | NS | NS | NS | NS | NS | NS | |
| R2 | - | - | - | - | 0.55 | - | |
| Processing carrots | |||||||
| IV | 211.8 | 8.6 | 11.3 | 8.6 | 9.1 | 13.7 | 8.0 |
| V | 220.8 | 6.8 | 6.7 | 3.9 | 2.3 | 4.2 | 5.2 |
| VI | 247.7 | 5.0 | 2.5 | 2.5 | 2.5 | 3.2 | 9.3 |
| VII | 258.5 | 24.8 | 13.8 | 12.3 | 16.6 | 15.8 | 11.9 |
| IX | 266.0 | 6.9 | 9.7 | 11.7 | 7.5 | 11.5 | 13.4 |
| Significance | L | NS | NS | NS | NS | NS | * |
| Q | NS | NS | NS | NS | NS | NS | |
| R2 | - | - | - | - | - | 0.69 | |
| Experimental Site | N Applied (kg ha−1) | N in Roots (kg ha−1) | N in Tops (kg ha−1) | Total N Uptake (kg ha−1) |
|---|---|---|---|---|
| Fresh Market Carrots | ||||
| DREC-1 (20–21) | 197.5 | 164.6 | 116.1 | 280.7 |
| DREC-1 (19–20) | 205.2 | 145.6 | 105.5 | 251.1 |
| I | 220.9 | 135.5 | 90.6 | 226.1 |
| DREC-2 (20–21) | 232.5 | 159.2 | 119.8 | 279.0 |
| DREC-2 (19–20) | 239.4 | 156.8 | 110.7 | 267.5 |
| VIII | 256.6 | 227.3 | 123.2 | 350.5 |
| III | 277.5 | 152.3 | 108.8 | 261.1 |
| II | 293.7 | 145.6 | 118.7 | 264.3 |
| DREC-3 (20–21) | 298.2 | 151.2 | 135.5 | 286.7 |
| DREC-3 (19–20) | 305.3 | 150.1 | 131.3 | 281.4 |
| Significance | L | NS | * | NS |
| Q | NS | NS | NS | |
| R2 | - | 0.33 | - | |
| Processing carrots | ||||
| IV | 211.8 | 105.3 | 100.1 | 205.4 |
| VI | 220.8 | 153.4 | 93.7 | 247.1 |
| VII | 247.7 | 134.4 | 106.6 | 241.0 |
| IX | 258.5 | 191.5 | 108.0 | 299.5 |
| V | 266.0 | 117.6 | 109.4 | 227.0 |
| Significance | L | NS | * | NS |
| Q | NS | NS | NS | |
| R2 | - | 0.69 | - | |
| Experimental Site | N Applied (kg ha−1) | Mean ± SD (Mg ha−1) | |
|---|---|---|---|
| Fresh market carrots | DREC-1 (20–21) | 197.5 | 104.7 ± 7.7 |
| DREC-1 (19–20) | 205.2 | 111.5 ± 10.1 | |
| I | 220.9 | 104.0 ± 8.7 | |
| DREC-2 (20–21) | 232.5 | 105.8 ± 7.2 | |
| DREC-2 (19–20) | 239.4 | 112.7 ± 8.5 | |
| VIII | 256.6 | 132.7 ± 11.8 | |
| III | 277.5 | 120.8 ± 9.5 | |
| II | 293.7 | 118.3 ± 6.6 | |
| DREC-3 (20–21) | 298.2 | 101.1 ± 8.3 | |
| DREC-3 (19–20) | 305.3 | 109.6 ± 9.4 | |
| Significance | L | NS | |
| Q | NS | ||
| R2 | - | ||
| Processing carrots | IV | 211.8 | 83.8 ± 9.8 |
| VI | 220.8 | 97.1 ± 8.6 | |
| VII | 247.7 | 101.7 ± 9.3 | |
| IX | 258.5 | 110.0 ± 10.7 | |
| V | 266.0 | 96.6 ± 8.9 | |
| Significance | L | NS | |
| Q | NS | ||
| R2 | - | ||
Publisher’s Note: MDPI stays neutral with regard to jurisdictional claims in published maps and institutional affiliations. |
© 2021 by the authors. Licensee MDPI, Basel, Switzerland. This article is an open access article distributed under the terms and conditions of the Creative Commons Attribution (CC BY) license (https://creativecommons.org/licenses/by/4.0/).
Share and Cite
Montazar, A.; Geisseler, D.; Cahn, M. Spatial Variability of Nitrogen Uptake and Net Removal and Actual Evapotranspiration in the California Desert Carrot Production System. Agriculture 2021, 11, 752. https://doi.org/10.3390/agriculture11080752
Montazar A, Geisseler D, Cahn M. Spatial Variability of Nitrogen Uptake and Net Removal and Actual Evapotranspiration in the California Desert Carrot Production System. Agriculture. 2021; 11(8):752. https://doi.org/10.3390/agriculture11080752
Chicago/Turabian StyleMontazar, Aliasghar, Daniel Geisseler, and Michael Cahn. 2021. "Spatial Variability of Nitrogen Uptake and Net Removal and Actual Evapotranspiration in the California Desert Carrot Production System" Agriculture 11, no. 8: 752. https://doi.org/10.3390/agriculture11080752
APA StyleMontazar, A., Geisseler, D., & Cahn, M. (2021). Spatial Variability of Nitrogen Uptake and Net Removal and Actual Evapotranspiration in the California Desert Carrot Production System. Agriculture, 11(8), 752. https://doi.org/10.3390/agriculture11080752