
Influences of Soil Bulk Density and Texture on Estimation of Surface Soil Moisture Using Spectral Feature Parameters and an Artificial Neural Network Algorithm


Abstract
:1. Introduction
2. Material and Methods
2.1. Soil Sample Preparation
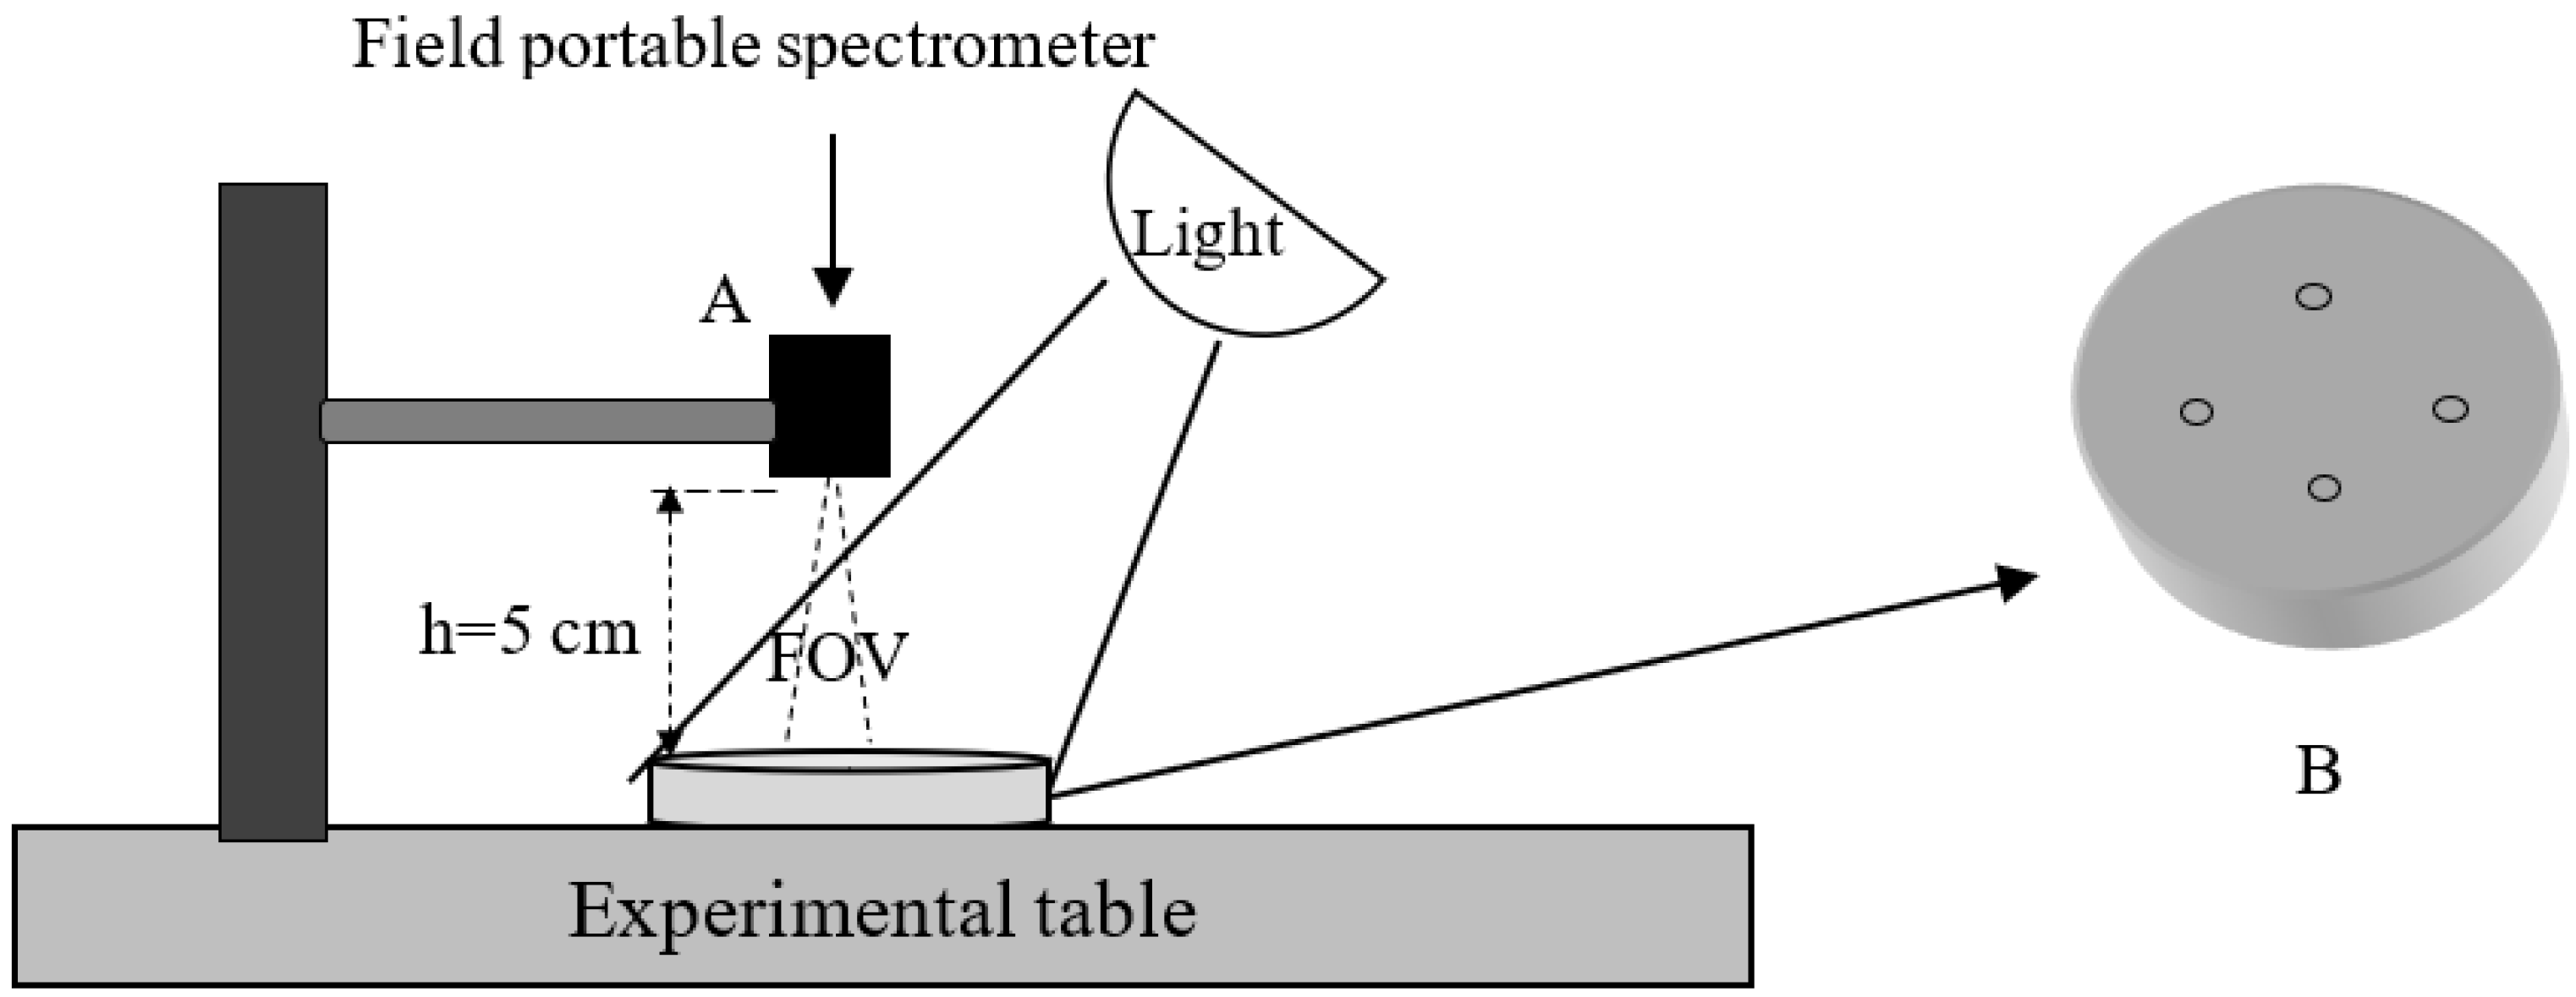
2.2. Field Portable Spectrometer
2.3. Selection of Spectral Feature Parameters
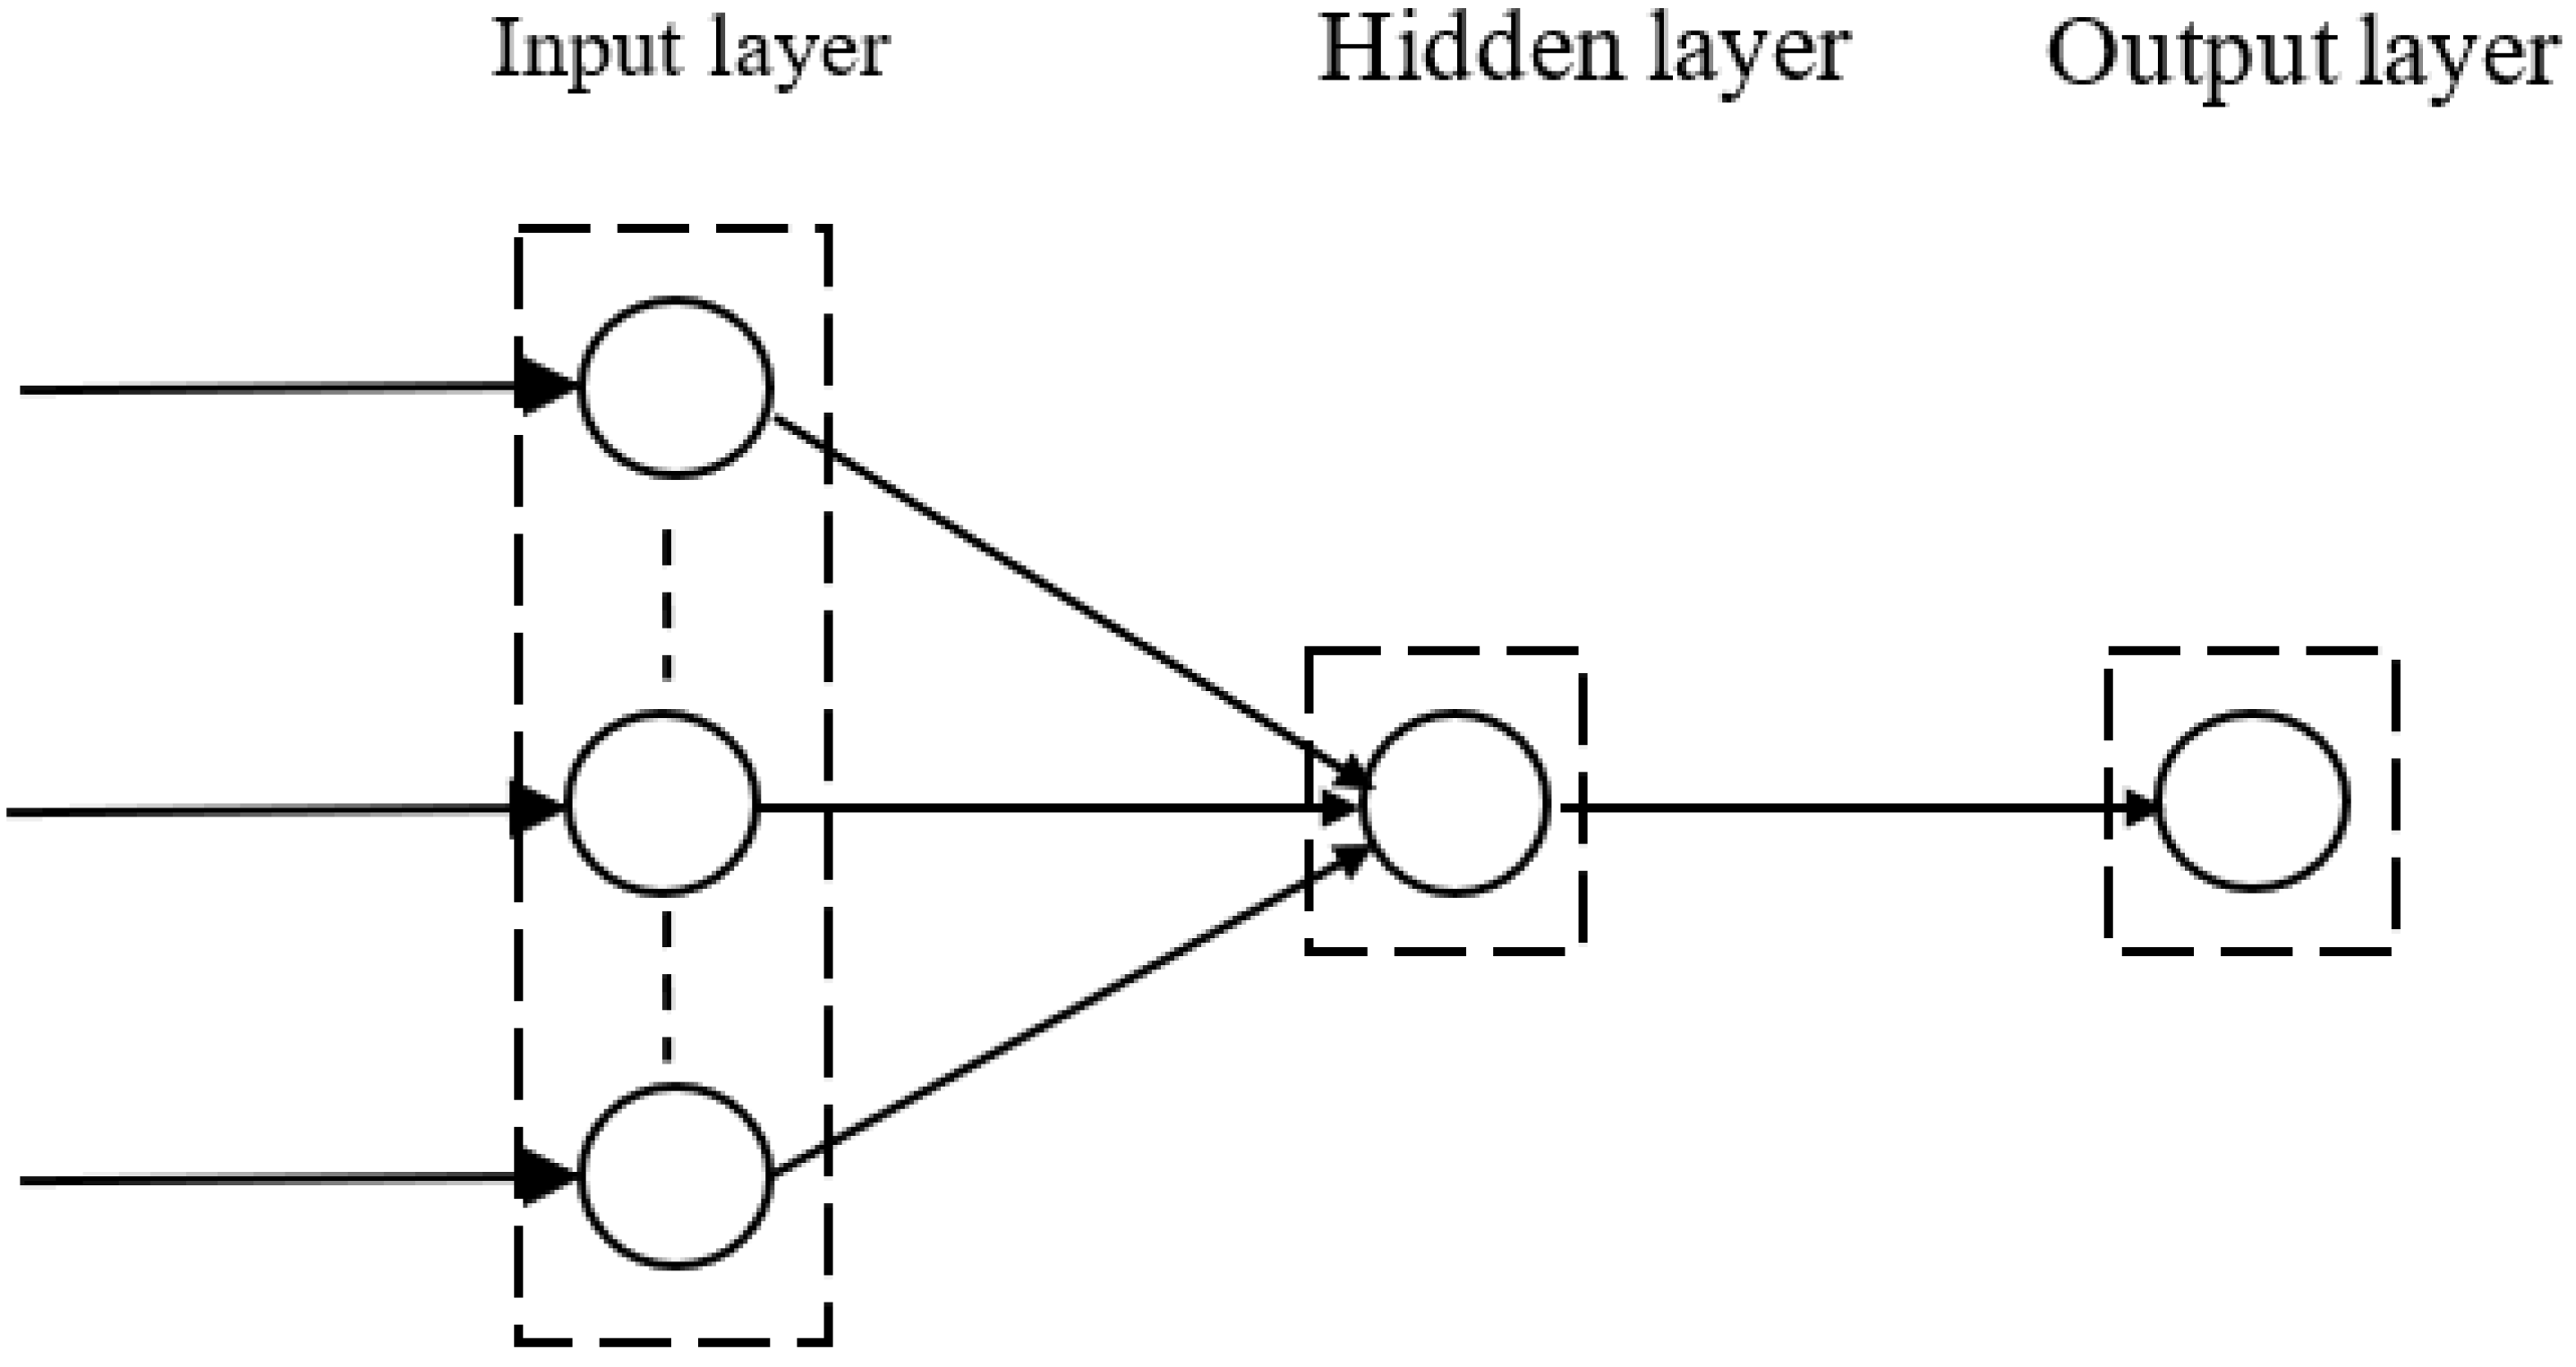
2.4. Artificial Neural Network Algorithm
2.5. Data Analysis
3. Results
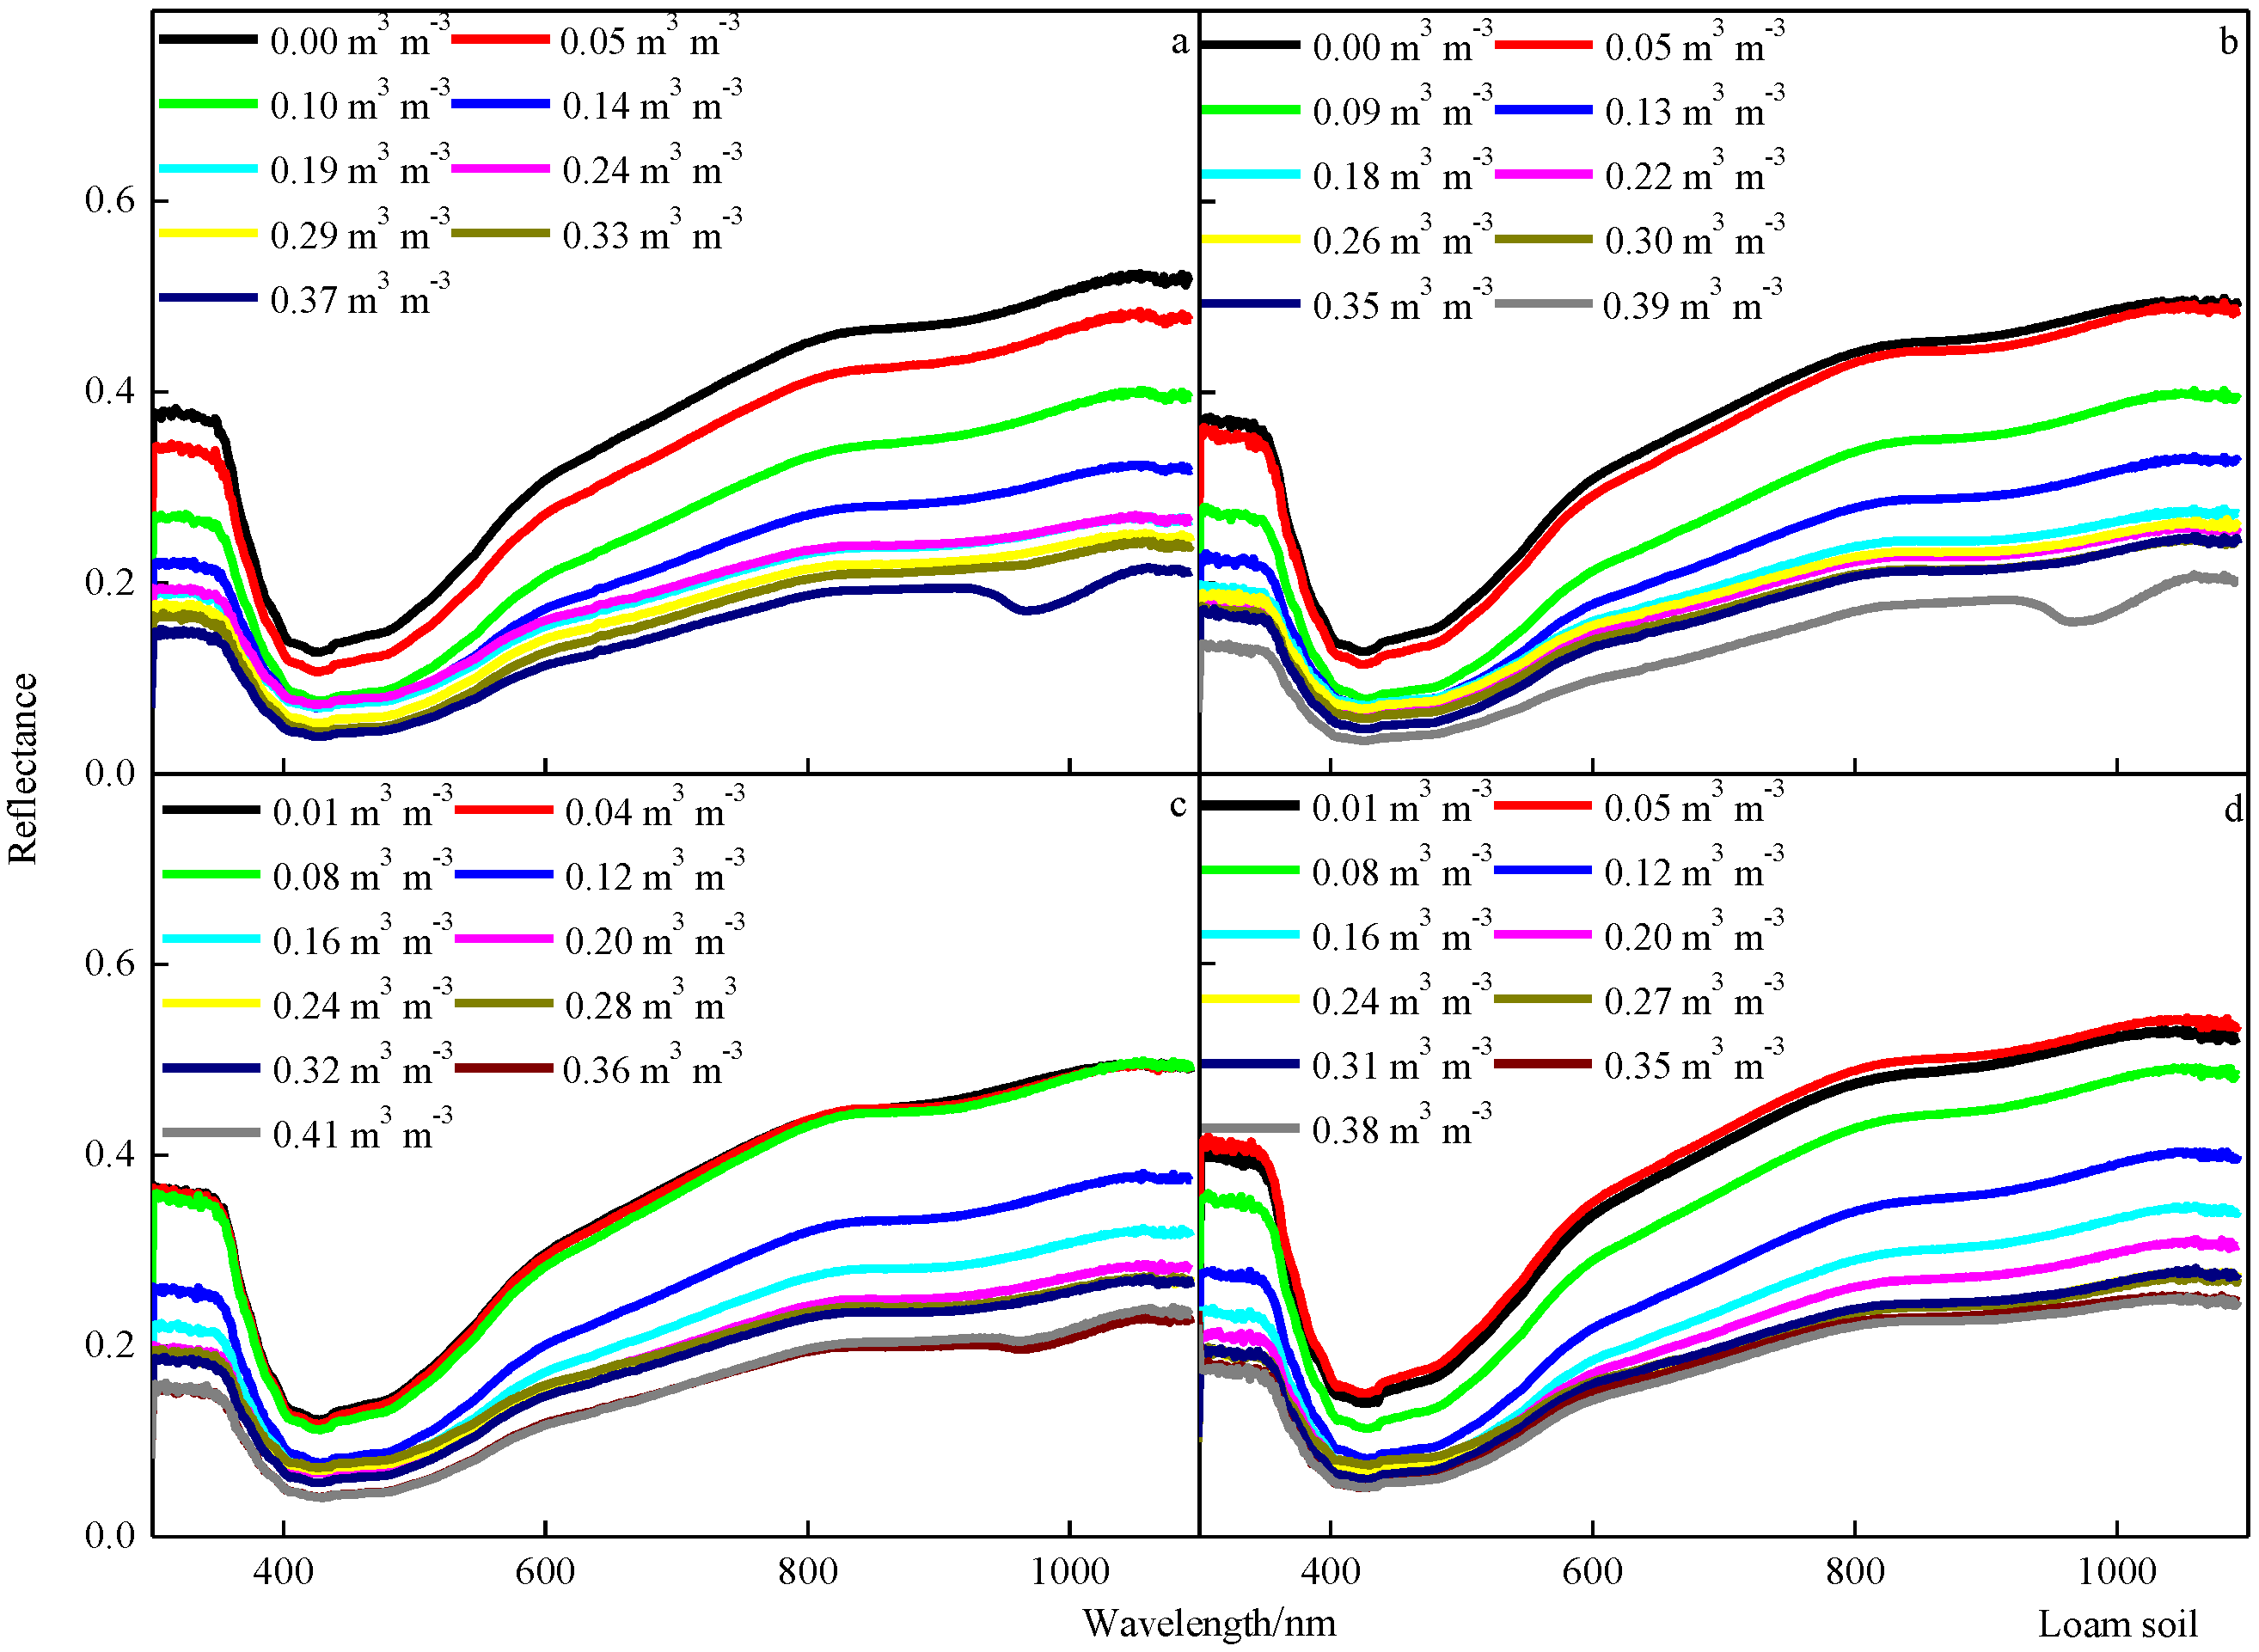
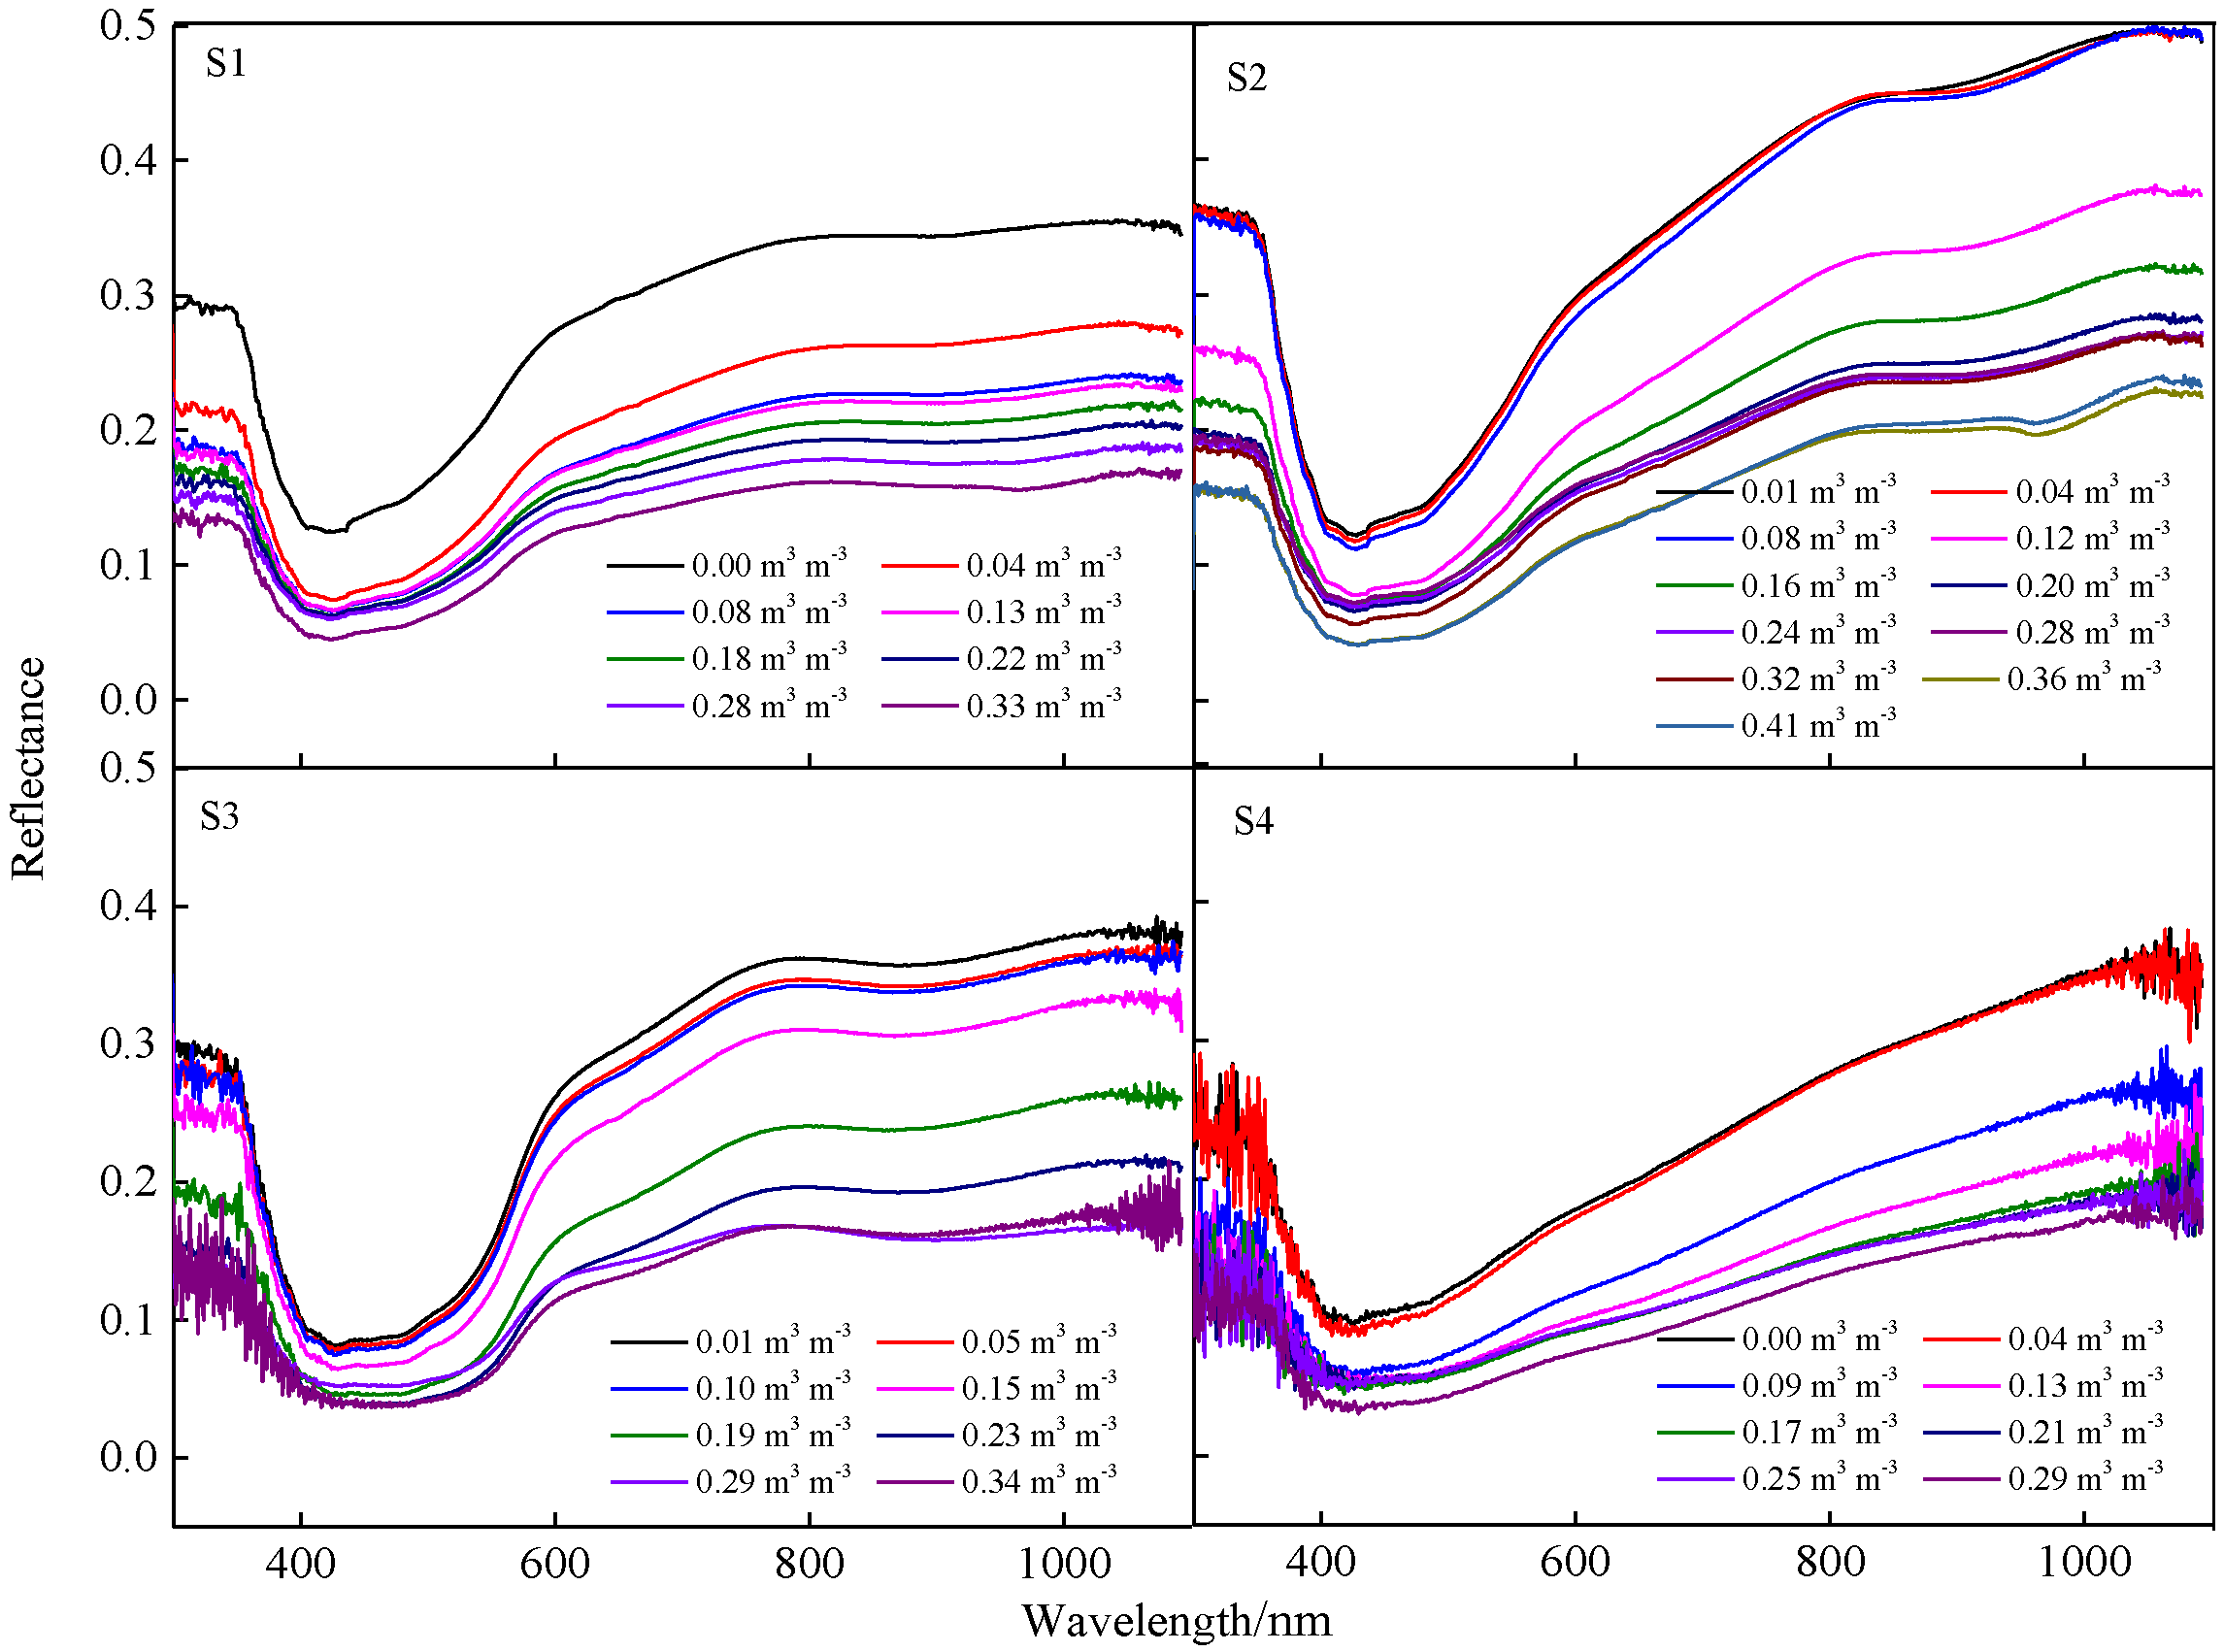
3.1. Soil Reflectance Trend with Different Soil Moisture Levels and Bulk Densities
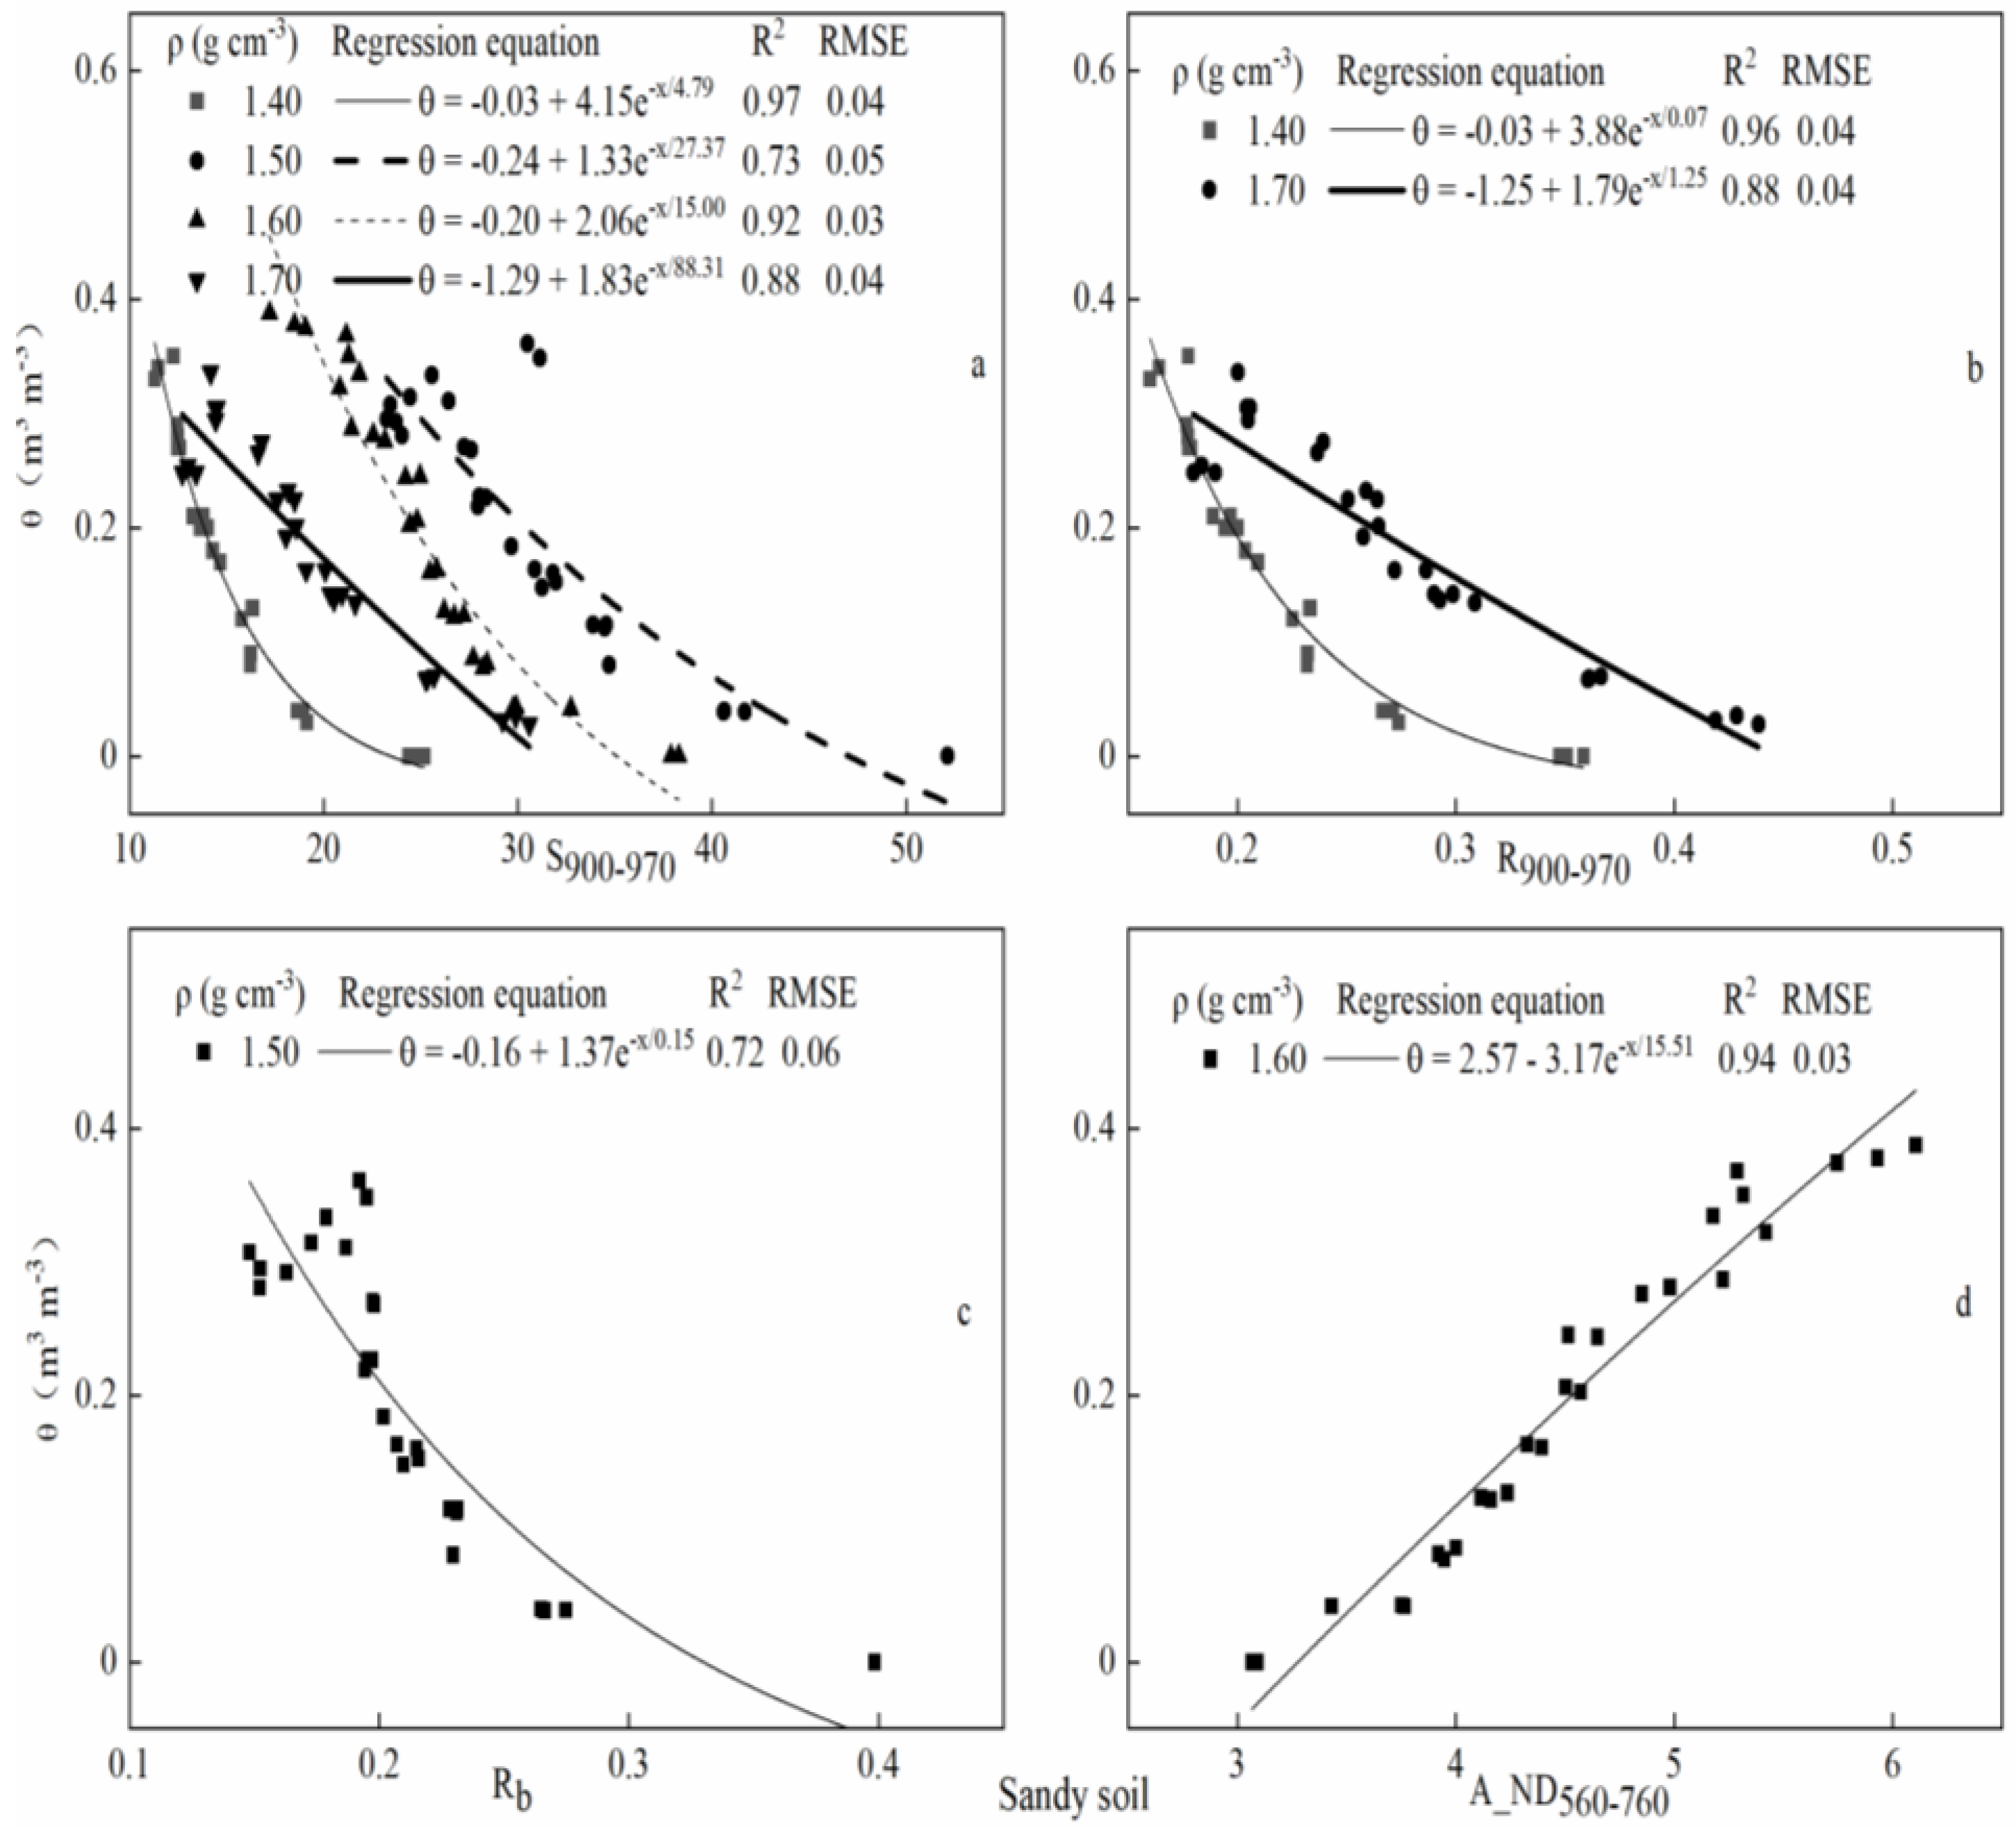
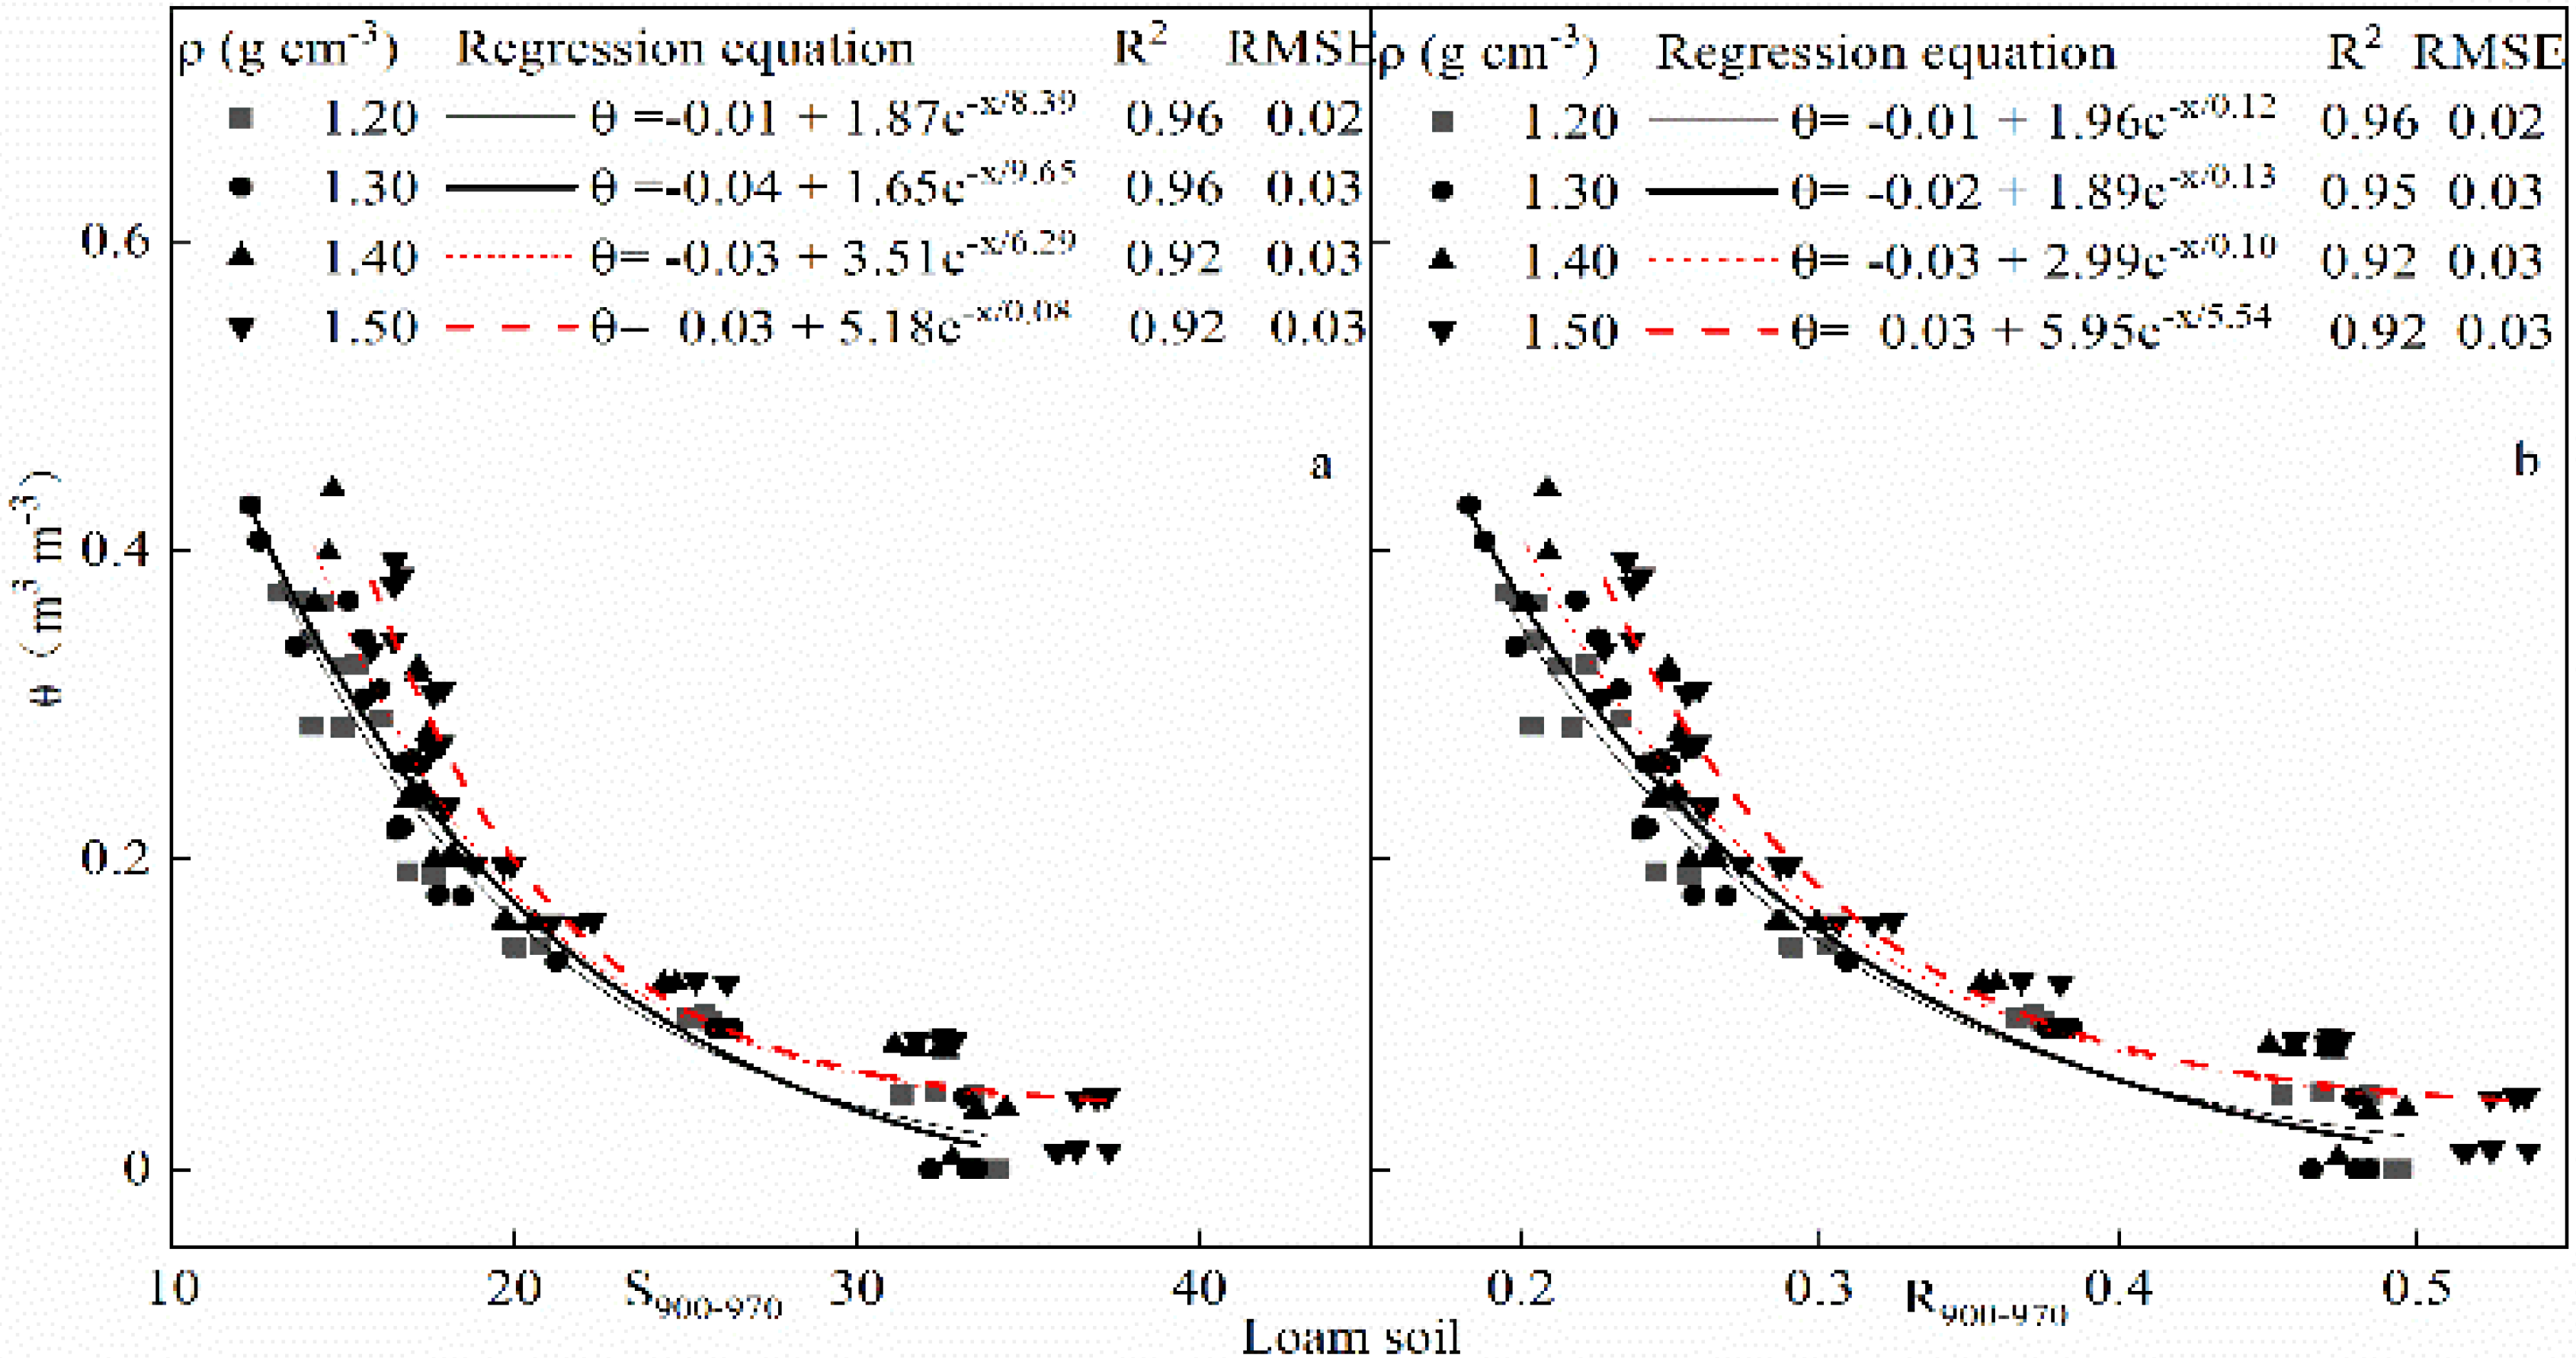
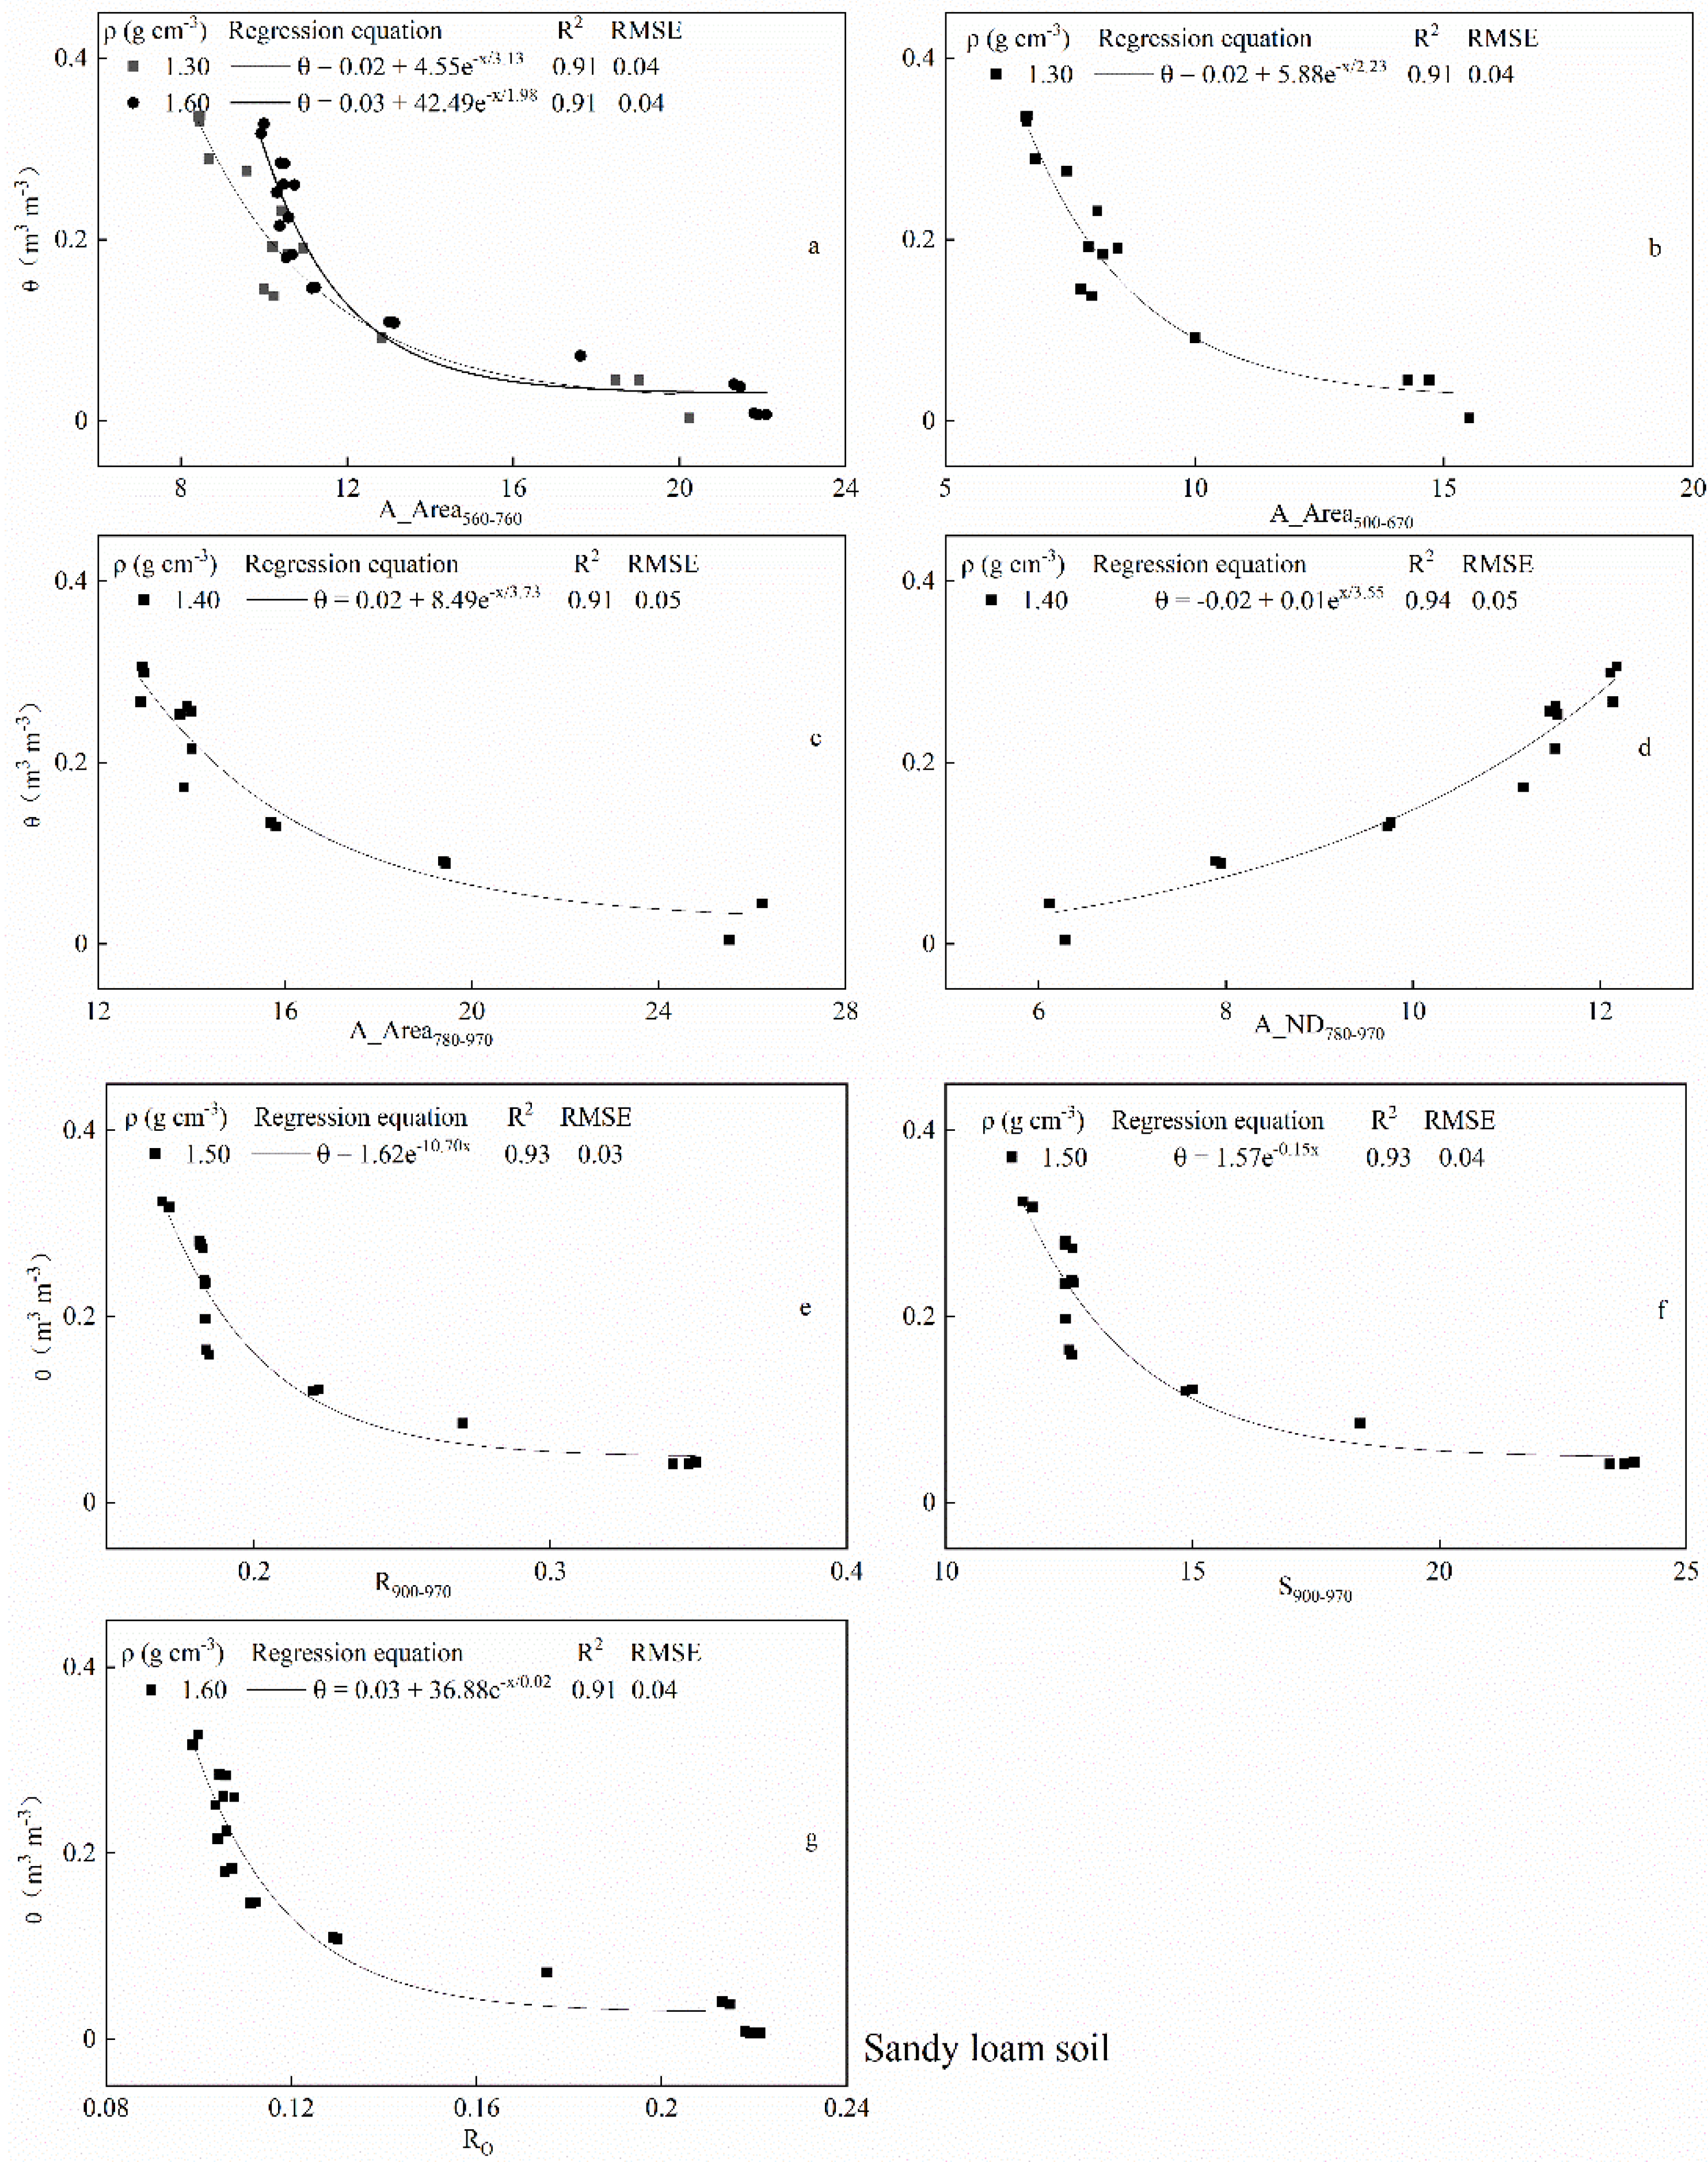
3.2. Relationships between Soil Moisture and Spectral Feature Parameters with Different Soil Bulk Densities
3.3. Soil Moisture Relationships with Spectral Feature Parameters Varied among Soil Textures
3.4. Artificial Neural Network Algorithm
4. Discussion
5. Conclusions
Author Contributions
Funding
Institutional Review Board Statement
Informed Consent Statement
Data Availability Statement
Conflicts of Interest
Appendix A

| Sandy Soil | 1.40 g cm−3 (n = 24) | RMSE | 1.50 g cm−3 (n = 27) | RMSE | ||
|---|---|---|---|---|---|---|
| Regression Equation | R2 | m3 m−3 | Regression Equation | R2 | m3 m−3 | |
| Rb | θ = 5.32 × e−32.61x | 0.78 ** | 0.04 | θ = −0.16 + 1.37 × e−x/0.15 | 0.72 ** | 0.06 |
| Sb | θ = 4.54 × e−0.87x | 0.76 ** | 0.05 | θ = −0.15 + 1.34 × e−x/5.37 | 0.72 ** | 0.07 |
| Ry | θ = 9.19 × e−26.50x | 0.81 ** | 0.05 | θ = −0.18 + 1.43 × e−x/0.23 | 0.68 ** | 0.06 |
| Sy | θ = 8.23 × e−0.85x | 0.80 ** | 0.04 | θ = −0.18 + 1.43 × e−x/6.74 | 0.70 ** | 0.06 |
| Rg | θ = −0.03 + 5.73 × e−x/0.04 | 0.80 ** | 0.04 | θ = −0.17 + 1.44 × e−x/0.20 | 0.70 ** | 0.06 |
| Sg | θ = −0.03 + 4.33 × e−x/1.85 | 0.78 ** | 0.04 | θ = −0.16 + 1.39 × e−x/8.08 | 0.72 ** | 0.06 |
| Rr | θ = −0.03 + 5.99 × e−x/0.06 | 0.86 ** | 0.04 | θ = 2.17 × e−5.72x | 0.61 ** | 0.06 |
| Sr | θ = −0.03 + 6.24 × e−x/5.66 | 0.85 ** | 0.04 | θ = 2.19 × e−0.06x | 0.61 ** | 0.06 |
| Ro | θ = −0.03 + 6.69 × e−x/0.05 | 0.83 ** | 0.04 | θ = 2.28 × e−7.17x | 0.64 ** | 0.06 |
| R900–970 | θ = −0.03 + 3.88 × e−x/0.07 | 0.96 ** | 0.04 | θ = −0.16 + 1.37 × e−x/0.15 | 0.72 ** | 0.06 |
| S900–970 | θ = −0.03 + 4.15 × e−x/4.79 | 0.97 ** | 0.04 | θ = −0.24 + 1.33 × e−x/27.37 | 0.73 ** | 0.05 |
| A_Depth500–670 | θ = 267,582.26 × e−8.92x | 0.10 ns | 0.11 | θ =0.16 + 1.59 × 1047 × e−x/0.01 | 0.22 ns | 0.11 |
| A_Area500–670 | θ = −0.26 + 0.10 × ex/15.32 | 0.84 ** | 0.04 | θ = e0.87 − 0.09x | 0.62 ** | 0.06 |
| A_ND500–670 | θ = −0.16 + 0.04 × ex/5.43 | 0.90 ** | 0.03 | θ = 0.63−1.35 × e−x/4.80 | 0.61 ** | 0.05 |
| A_Depth780–970 | θ = −701,619.63 × e−1.19x | 0.64 ** | 0.06 | θ = 0.57−0.07 × ex/1.04 | 0.50 ** | 0.11 |
| A_Area780–970 | θ = −0.03 + 5.46 × e−x/5.24 | 0.86 ** | 0.04 | θ = e0.63 − 0.06x | 0.55 ** | 0.07 |
| A_ND780–970 | θ = 0.19−2.08 × 10⁸ × e−x/0.32 | 0.20 ns | 0.06 | θ = 0.10 × e0.15x | 0.01 ns | 0.11 |
| A_Depth560–760 | θ = −0.26 + 0.10 × ex/5.32 | 0.01 ns | 0.07 | θ = 78.48 × e−4.70x | 0.11 ns | 0.12 |
| A_Area560–760 | θ = −0.02 + 6.88 × e−x/4.88 | 0.83 ** | 0.04 | θ = e0.80 − 0.07x | 0.62 ** | 0.06 |
| A_ND560–760 | θ = −0.26 + 0.10 × ex/5.32 | 0.91 ** | 0.22 | θ = 0.57−1.23 × e−x/3.01 | 0.54 ** | 0.05 |
| Sandy Soil | 1.60 g cm−3 (n = 28) | RMSE | 1.70 g cm−3 (n = 27) | RMSE | ||
|---|---|---|---|---|---|---|
| Regression Equation | R2 | m3 m−3 | Regression Equation | R2 | m3 m−3 | |
| Rb | θ = −0.11 + 2.29 × e−x/0.08 | 0.76 ** | 0.06 | θ = 1.87 × e−17.70x | 0.86 ** | 0.04 |
| Sb | θ = −0.11 + 2.11 × e−x/3.14 | 0.72 ** | 0.05 | θ = 1.77 × e−0.48x | 0.86 ** | 0.05 |
| Ry | θ = −0.12 + 2.83 × e−x/0.11 | 0.84 ** | 0.06 | θ = 2.23 × e−13.30x | 0.87 ** | 0.04 |
| Sy | θ = −0.12 + 2.73 × e−x/3.41 | 0.82 ** | 0.05 | θ = 2.15 × e−0.43x | 0.87 ** | 0.04 |
| Rg | θ = −0.12 + 2.69 × e−x/0.10 | 0.81 ** | 0.06 | θ = 2.12 × e−14.70x | 0.87 ** | 0.04 |
| Sg | θ = −0.12 + 2.38 × e−x/4.45 | 0.77 ** | 0.06 | θ = 1.92 × e−0.33x | 0.86 ** | 0.04 |
| Rr | θ = −0.16 + 2.52 × e−x/0.17 | 0.90 ** | 0.05 | θ = 2.29 × e−9.87x | 0.87 ** | 0.04 |
| Sr | θ = −0.15 + 3.61 × e−x/16.05 | 0.90 ** | 0.05 | θ = 2.29 × e−0.10x | 0.87 ** | 0.03 |
| Ro | θ = −0.13 + 2.79 × e−x/0.13 | 0.87 ** | 0.06 | θ = 2.25 × e−11.70x | 0.87 ** | 0.04 |
| R900–970 | θ = −0.21 + 1.97 × e−x/0.23 | 0.92 ** | 0.03 | θ =−1.25 + 1.79 × e−x/1.25 | 0.88 ** | 0.04 |
| S900–970 | θ = −0.20 + 2.06 × e−x/15.00 | 0.92 ** | 0.03 | θ = −1.29 + 1.83 × e−x/88.31 | 0.88 ** | 0.04 |
| A_Depth500–670 | θ = 0.85 × e−0.92x | 0.00ns | 0.13 | θ = 694,617,504.34 × e−13.85x | 0.19ns | 0.12 |
| A_Area500–670 | θ = −0.13 + 3.01 × e−x/10.42 | 0.89 ** | 0.04 | θ = 2.43 × e−0.14x | 0.87 ** | 0.03 |
| A_ND500–670 | θ = −2.83 + 2.38 × ex/28.76 | 0.19ns | 0.03 | θ = −1.25 + 1.79 × e−x/1.25 | 0.84 ** | 0.04 |
| A_Depth780–970 | θ = 1.34 × 10⁻¹⁶ × e18.13x | 0.05ns | 0.12 | θ = 0.36−1.54 × e−x/3.86 | 0.84 ** | 0.04 |
| A_Area780–970 | θ = 4.87 × e−0.11x | 0.88 ** | 0.04 | θ = 2.14 × e−0.11x | 0.87 ** | 0.03 |
| A_ND780–970 | θ = 122.37−122.82 × e−x/1225.62 | 0.74 ** | 0.08 | θ = 0.02 × e−0.35x | 0.33ns | 0.08 |
| A_Depth560–760 | θ = 8.32 × 10−100 × e106.81x | ns | 0.23 | θ = 91.08 × e48.10x | 0.00ns | 0.12 |
| A_Area560–760 | θ = 5.35 × e−0.12x | 0.85 ** | 0.04 | θ = 2.30 × e−0.11x | 0.87 ** | 0.02 |
| A_ND560–760 | θ =2.57−3.17 × e−x/15.51 | 0.94 ** | 0.03 | θ = 0.03 × e0.27x | 0.73 ** | 0.07 |
| Loamy Soil | 1.20 g cm−3 (n = 27) | RMSE | 1.30 g cm−3 (n = 25) | RMSE | ||
|---|---|---|---|---|---|---|
| Regression Equation | R2 | m3 m−3 | Regression Equation | R2 | m3 m−3 | |
| Rb | θ = −0.01 + 1.77 × e−x/0.05 | 0.92 ** | 0.04 | θ = −0.07 + 1.23 × e−x/0.08 | 0.92 ** | 0.06 |
| Sb | θ = −0.02 + 1.57 × e−x/0.88 | 0.92 ** | 0.05 | θ = −0.08 + 1.16 × e−x/2.85 | 0.91 ** | 0.04 |
| Ry | θ = −0.01 + 2.22 × e−x/0.06 | 0.92 ** | 0.05 | θ = −0.07 + 1.35 × e−x/0.10 | 0.93 ** | 0.04 |
| Sy | θ = −0.01 + 2.12 × e−x/1.97 | 0.92 ** | 0.04 | θ = −0.07 + 1.33 × e−x/3.08 | 0.93 ** | 0.04 |
| Rg | θ = −0.01 + 2.08 × e−x/0.06 | 0.92 ** | 0.04 | θ = −0.07 + 1.32 × e−x/0.09 | 0.92 ** | 0.04 |
| Sg | θ = −0.01 + 1.83 × e−x/2.61 | 0.92 ** | 0.04 | θ = −0.07 + 1.25 × e−x/4.02 | 0.92 ** | 0.05 |
| Rr | θ = −9.25 × 10⁻⁴ + 2.65 × e−x/0.09 | 0.92 ** | 0.03 | θ = −0.02 + 2.27 × e−x/0.10 | 0.92 ** | 0.04 |
| Sr | θ = −5.11 × 10⁻⁴ + 2.61 × e−x/8.55 | 0.92 ** | 0.03 | θ = −0.03 + 1.90 × e−x/10.75 | 0.93 ** | 0.05 |
| Ro | θ = 2.37 × e−x/0.07 | 0.92 ** | 0.04 | θ = −0.05 + 1.51 × e−x/0.10 | 0.93 ** | 0.04 |
| R900–970 | θ = −0.01 + 1.96 × e−x/0.12 | 0.96 ** | 0.02 | θ = −0.02 + 1.89 × e−x/0.13 | 0.95 ** | 0.03 |
| S900–970 | θ = −0.01 + 1.87 × e−x/8.39 | 0.96 ** | 0.02 | θ = −0.04 + 1.65 × e−x/9.65 | 0.96 ** | 0.03 |
| A_Depth500–670 | θ = 4.37 × 10⁷ × e−12.54x | 0.31 ns | 0.11 | θ = 787.28 × e−5.29x | 0.06 ns | 0.1 |
| A_Area500–670 | θ = 2.55 × e−0.17x | 0.91 ** | 0.03 | θ = 1.91 × e−0.15x/0.13 | 0.93 ** | 0.04 |
| A_ND500–670 | θ = e−4.19+0.24x | 0.85 ** | 0.04 | θ = 0.03 × e0.17x | 0.81 ** | 0.06 |
| A_Depth780–970 | θ = e8.28−5.66x | 0.04 ns | 0.12 | θ = 1060.21 × e−4.78x | 0.12 ns | 0.13 |
| A_Area780–970 | θ = 2.66 × e−0.12x | 0.90 ** | 0.05 | θ = 4.02 × e−0.14x | 0.90** | 0.03 |
| A_ND780–970 | θ = 4621.17−4621.39 × e−x/87,464.58 | 0.88 ** | 0.04 | θ = e0.43x | 0.89** | 0.03 |
| A_Depth560–760 | θ = 0.05 + 841.00 × e−x/0.13 | 0.09ns | 0.2 | θ = 10.38×e−3.35x | 0.08ns | 0.11 |
| A_Area560–760 | θ = 2.50 × e−x/7.18 | 0.92 ** | 0.04 | θ = 1.87×e−0.12x | 0.93** | 0.03 |
| A_ND560–760 | θ = e−4.22 + 0.39x | 0.86 ** | 0.04 | θ = 0.02×e0.38x | 0.91** | 0.05 |
| Loamy Soil | 1.40 g cm−3 (n = 29) | RMSE | 1.50 g cm−3 (n = 32) | RMSE | ||
|---|---|---|---|---|---|---|
| Regression Equation | R2 | m3 m−3 | Regression Equation | R2 | m3 m−3 | |
| Rb | θ = 0.01 + 1.65 × e−x/0.05 | 0.88 ** | 0.05 | θ = 2.17 × e−19.47x | 0.87 ** | 0.03 |
| Sb | θ = 1.42 × e−0.48x | 0.88 ** | 0.04 | θ = 1.86 × e−0.51x | 0.87 ** | 0.04 |
| Ry | θ = 2.06 × e−14.43x | 0.87 ** | 0.03 | θ = 3.00 × e−15.70x | 0.87 ** | 0.03 |
| Sy | θ = 1.94 × e−0.46x | 0.87 ** | 0.03 | θ = 2.82 × e−0.51x | 0.87 ** | 0.03 |
| Rg | θ = 1.89 × e−15.63x | 0.87 ** | 0.03 | θ = 2.73 × e−17.00x | 0.87 ** | 0.03 |
| Sg | θ = 0.01 + 1.72 × e−x/2.77 | 0.88 ** | 0.04 | θ = 2.27 × e−0.37x | 0.87 ** | 0.03 |
| Rr | θ = −0.04 + 5.12 × e−x/0.07 | 0.85 ** | 0.1 | θ = 2.78 × e−9.81x | 0.88 ** | 0.05 |
| Sr | θ = 0.03 + 4.33 × e−x/7.06 | 0.86 ** | 0.03 | θ = 2.82 × e−0.11x | 0.87 ** | 0.04 |
| Ro | θ = 0.03 + 3.05 × e−x/10.07 | 0.87 ** | 0.04 | θ = 2.85 × e−13.10x | 0.87 ** | 0.03 |
| R900–970 | θ = −0.03 + 2.99 × e−x/0.10 | 0.92 ** | 0.03 | θ = 0.03 + 5.95 × e−x/5.54 | 0.92 ** | 0.03 |
| S900–970 | θ = −0.03 + 3.51 × e−x/6.29 | 0.92 ** | 0.03 | θ = 0.03 + 5.18 × e−x/0.08 | 0.92 ** | 0.03 |
| A_Depth500–670 | θ = 0.14 + 7.94 × 1028 × e−x/0.02 | 0.45 * | 0.17 | θ = 5.90 × 10⁶ × e−11.06x | 0.32 ns | 0.17 |
| A_Area500–670 | θ = 0.03 + 3.97 × e−x/4.83 | 0.86 ** | 0.03 | θ = 2.92 × e−0.16x | 0.87 ** | 0.04 |
| A_ND500–670 | θ = −0.03 + 0.02 × ex/4.39 | 0.86 ** | 0.05 | θ = −0.05 + 0.03 × e−x/2.67 | 0.89 ** | 0.05 |
| A_Depth780–970 | θ = 400.20 × e−4.27x | 0.04 ns | 0.13 | θ = 0.18−9.99 × 10210 × e−x/0.003 | 0.07 ns | 0.11 |
| A_Area780–970 | θ = 0.05 + 8.30 × e−x/5.55 | 0.84 ** | 0.03 | θ = 0.04 + 6.44 × e−x/6.31 | 0.87 ** | 0.03 |
| A_ND780–970 | θ = 0.02 + 0.004 × ex/12.24 | 0.85 ** | 0.04 | θ = −0.09 + 0.05 × ex/4.40 | 0.90 ** | 0.02 |
| A_Depth560–760 | θ = 0.13 + 2.57 × 10⁸ × e−x/0.05 | 0.34 ns | 0.13 | θ = e5.47−6.00x | 0.24 ns | 0.12 |
| A_Area560–760 | θ = 0.03 + 3.41 × e−x/6.34 | 0.86 ** | 0.03 | θ = 0.04 + 9.62 × e−x/4.84 | 0.87 ** | 0.03 |
| A_ND560–760 | θ = −0.01 + 0.01 × ex/2.29 | 0.86 ** | 0.13 | θ = −0.05 + 0.03 × ex/2.67 | 0.89 ** | 0.04 |
| Clay Loam Soil | 1.30 g cm−3 (n = 15) | RMSE | 1.40 g cm−3 (n = 15) | RMSE | ||
|---|---|---|---|---|---|---|
| Regression Equation | R2 | m3 m−3 | Regression Equation | R2 | m3 m−3 | |
| Rb | θ = 0.23–0.01 × ex/0.04 | 0.86 ** | 0.05 | θ = 0.78 × e−18.73x | 0.80 ** | 0.05 |
| Sb | θ = 1.56 × e−0.93x | 0.68 ** | 0.04 | θ = 0.31–0.02 × e−x/1.58 | 0.84 ** | 0.05 |
| Ry | θ = 1.08 × e−13.22x | 0.90 ** | 0.01 | θ = 0.35–0.003 × ex/0.10 | 0.86 ** | 0.04 |
| Sy | θ = 0.97 × e−0.46x | 0.88 ** | 0.01 | θ = 0.34–0.02 × ex/2.68 | 0.86 ** | 0.04 |
| Rg | θ = 0.28–0.03 × ex/0.08 | 0.88 ** | 0.07 | θ = 0.33–0.02 × ex/0.07 | 0.86 ** | 0.04 |
| Sg | θ = 0.77 × e−0.39x | 0.83 ** | 0.03 | θ = 0.80 × e−0.34x | 0.80 ** | 0.05 |
| Rr | θ = 0.54–0.18 × ex/0.34 | 0.95 ** | 0.01 | θ = 0.45–0.08 × ex/0.21 | 0.90 ** | 0.04 |
| Sr | θ = 0.65–0.28 × ex/42.87 | 0.94 ** | 0.01 | θ = 1.11 × e−0.08x | 0.86 ** | 0.04 |
| Ro | θ = 1.92–1.52 × ex/1.36 | 0.93 ** | 0.01 | θ = 0.41–0.06 × ex/0.16 | 0.88 ** | 0.04 |
| R900–970 | θ = 0.43–0.09 × ex/0.25 | 0.95 ** | 0.01 | θ = 1.03 × e−7.09x | 0.86 ** | 0.04 |
| S900–970 | θ = 0.46–0.12 × ex/19.72 | 0.95 ** | 0.01 | θ = 1.03 × e−0.10x | 0.86 ** | 0.04 |
| A_Depth500–670 | θ = 10−6 × e7.02x | 0.05 ns | 0.15 | θ = 10−6 × e7.41x | 0.22 ns | 0.1 |
| A_Area500–670 | θ = 1.45–1.06 × ex/87.47 | 0.93 ** | 0.01 | θ = 0.39–0.05 × ex/12.58 | 0.88 ** | 0.04 |
| A_ND500–670 | θ = 0.004 × e0.33x | 0.54 * | 0.09 | θ = 0.30–1.92 × e−x/2.99 | 0.87 ** | 0.04 |
| A_Depth780–970 | θ = 1021 × e−26.90 x | 0.29 ns | 0.14 | θ = 0.31–1.18 × 10⁻¹⁸ × ex/0.05 | 0.83 ** | 0.07 |
| A_Area780–970 | θ = 0.52–0.17 × ex/27.73 | 0.94 ** | 0.01 | θ = 0.47–0.09 × ex/19.13 | 0.91 ** | 0.04 |
| A_ND780–970 | θ = 0.003 × ex/0.37 | 0.52 * | 0.12 | θ = 0.23–265,093.37 × e−x/0.46 | 0.64 ** | 0.08 |
| A_Depth560–760 | θ =179.20 × e−7.77x | 0.36 ns | 0.13 | θ = 161.50 × e−7.13x | 0.27 ns | 0.13 |
| A_Area560–760 | θ = 1.18–0.79 × ex/82.95 | 0.93 ** | 0.01 | θ = 0.41–0.06 × ex/16.53 | 0.89 ** | 0.04 |
| A_ND560–760 | θ =0.003 × e0.09x | 0.42 ns | 0.1 | θ = 0.01 × e0.55x | 0.50 * | 0.04 |
| Clay Loam Soil | 1.50 g cm−3 (n = 22) | RMSE | 1.60 g cm−3 (n = 19) | RMSE | ||
|---|---|---|---|---|---|---|
| Regression Equation | R2 | m3 m−3 | Regression Equation | R2 | m3 m−3 | |
| Rb | θ = 0.93–0.41 × ex/0.18 | 0.78 ** | 0.07 | θ= −0.20 + 1.01 × e−x/0.10 | 0.91 ** | 0.06 |
| Sb | θ = 0.91–0.38 × ex/6.05 | 0.78 ** | 0.08 | θ= −0.17 + 1.06 × e−x/2.94 | 0.90 ** | 0.06 |
| Ry | θ = 1.25 × e−10.07x | 0.74 ** | 0.07 | θ= −0.96 + 1.60 × e−x/0.56 | 0.92 ** | 0.05 |
| Sy | θ = 1.25 × e−0.36x | 0.74 ** | 0.07 | θ= −0.53 + 1.20 × e−x/9.69 | 0.91 ** | 0.06 |
| Rg | θ = 0.73–0.23 × ex/0.20 | 0.79 ** | 0.07 | θ= −0.41 + 1.11 × e−x/0.23 | 0.92 ** | 0.06 |
| Sg | θ = 0.85–0.34 × ex/9.10 | 0.78 ** | 0.07 | θ= −0.22 + 1.02 × e−x/5.60 | 0.91 ** | 0.06 |
| Rr | θ = 1.19 × e−6.86x | 0.78 ** | 0.04 | θ = 1.13 × e−7.24x | 0.90 ** | 0.04 |
| Sr | θ = 0.51–0.06 × ex/18.64 | 0.84 ** | 0.05 | θ = 1.16 × e−0.08x | 0.90 ** | 0.05 |
| Ro | θ = 1.22 × e−8.41x | 0.76 ** | 0.05 | θ = −7970.73 + 7971.29 × e−x/4692.96 | 0.94 ** | 0.06 |
| R900-970 | θ = 1.09 × e−6.48x | 0.80 ** | 0.03 | θ = 0.98 × e−6.50x | 0.90 ** | 0.03 |
| S900-970 | θ = 1.09 × e−0.09x | 0.80 ** | 0.04 | θ = 0.43–0.09 × ex/0.25 | 0.94 ** | 0.04 |
| A_Depth500-670 | θ = 4 × 10–13 × e16.58x | 0.42 * | 0.13 | θ = e−13.65+7.60x | 0.42 ns | 0.08 |
| A_Area500-670 | θ = 0.53–0.08 × ex/15.42 | 0.82 ** | 0.05 | θ = 1.83–1.30 × ex/85.28 | 0.93 ** | 0.05 |
| A_ND500-670 | θ = 0.36–4.11 × e−x/2.17 | 0.84 ** | 0.06 | θ = 0.36–1.68 × e−x/3.44 | 0.92 ** | 0.05 |
| A_Depth780-970 | θ = 2.80 × e−2.02x | 0.48 * | 0.12 | θ = 0.34–1.94 × 10⁻¹⁸ × ex/0.05 | 0.79 ** | 0.08 |
| A_Area780-970 | θ = 1.11 × e−0.08x | 0.79 ** | 0.04 | θ= 1.02 × e−0.08x | 0.90 ** | 0.03 |
| A_ND780-970 | θ = 0.01 × e0.39x | 0.16 ns | 0.29 | θ= 0.29–1556.97 × e−x/0.69 | 0.69 ** | 0.08 |
| A_Depth560-760 | θ = 0.12 + 7.17 × 10⁻¹² × ex/0.05 | 0.16 ns | 0.1 | θ= 0.15 + 1.02 × 10⁻²⁹ × ex/0.02 | 0.31 ns | 0.11 |
| A_Area560-760 | θ = 1.21 × e−0.08x | 0.76 ** | 0.05 | θ= 1.77–1.24 × ex/99.08 | 0.94 ** | 0.05 |
| A_ND560-760 | θ = 0.36–10.09 × e−x/0.95 | 0.87 ** | 0.05 | θ= 0.34–4.25 × e−x/1.26 | 0.94 ** | 0.05 |
| Sandy Loam Soil | 1.30 g cm−3 (n = 15) | RMSE | 1.40 g cm−3 (n = 14) | RMSE | ||
|---|---|---|---|---|---|---|
| Regression Equation | R2 | m3 m−3 | Regression Equation | R2 | m3 m−3 | |
| Rb | θ = 1.69 × e−x/0.03 | 0.89 ** | 0.05 | θ = 2.98 × e−38.70x | 0.80 ** | 0.05 |
| Sb | θ = −0.01 + 1.45 × e−x/1.32 | 0.89 ** | 0.05 | θ = 2.84 × e−1.03x | 0.80 ** | 0.05 |
| Ry | θ = 0.01 + 2.61 × e−x/0.03 | 0.90 ** | 0.06 | θ = 3.47 × e−32.20x | 0.81 ** | 0.05 |
| Sy | θ = 0.01 + 2.30 × e−x/1.10 | 0.90 ** | 0.05 | θ = 3.34 × e−1.02x | 0.81 ** | 0.05 |
| Rg | θ = 3.07 × e−34.00x | 0.84 ** | 0.05 | θ = 3.33 × e−34.60x | 0.81 ** | 0.05 |
| Sg | θ = 1.78 × e−x/1.67 | 0.89 ** | 0.05 | θ = 3.07 × e−0.74x | 0.81 ** | 0.05 |
| Rr | θ = 0.03 + 18.83 × e−x/0.03 | 0.90 ** | 0.04 | θ = 0.01 + 4.00 × e−x/0.05 | 0.90 ** | 0.06 |
| Sr | θ = 0.03 + 9.98 × e−x/3.17 | 0.91 ** | 0.04 | θ = 2.99 × e−x/4.92 | 0.88 ** | 0.05 |
| Ro | θ = 0.02 + 3.98 × e−x/0.03 | 0.91 ** | 0.05 | θ = −0.02 + 1.75 × e−x/0.05 | 0.84 ** | 0.05 |
| R900–970 | θ = 0.04 + 49.54 × e−x/0.03 | 0.91 ** | 0.05 | θ = 4.62 × e−16.60x | 0.80 ** | 0.05 |
| S900–970 | θ = 0.04 + 60.26 × e−x/2.07 | 0.90 ** | 0.04 | θ = 4.74 × e−0.24x | 0.80 ** | 0.04 |
| A_Depth500–670 | θ = 109 × e−13.60x | 0.14 ns | 0.11 | θ = 2 × 10⁷ × e−11.30x | 0.14 ns | 0.11 |
| A_Area500–670 | θ = 0.02 + 5.88 × e−x/2.23 | 0.91 ** | 0.04 | θ = 2.27 × e−x/3.38 | 0.86 ** | 0.05 |
| A_ND500–670 | θ = 0.001 × e0.21x | 0.85 ** | 0.03 | θ = −0.13 + 0.06 × ex/12.37 | 0.88 ** | 0.05 |
| A_Depth780–970 | θ = 5 × 10⁸ × e−13.90x | 0.08 ns | 0.16 | θ = 15.36 × e−3.02x | 0.01 ns | 0.12 |
| A_Area780–970 | θ = 0.04 + 63.34 × e−x/2.33 | 0.89 ** | 0.04 | θ = 0.02 + 8.49 × e−x/3.73 | 0.91 ** | 0.05 |
| A_ND780–970 | θ = 0.03 + 1.86 × 10⁻⁴ × ex/1.69 | 0.80 ** | 0.02 | θ = −0.02 + 0.01 × ex/3.55 | 0.94 ** | 0.05 |
| A_Depth560–760 | θ = 0.14 + 2.54 × 10¹⁰ × ex/0.04 | 0.22 ns | 0.12 | θ = 19.60 × e−4.34x | 0.06 ns | 0.12 |
| A_Area560–760 | θ = 0.02 + 4.55 × e−x/3.13 | 0.91 ** | 0.04 | θ = −0.01 + 1.90 × e−x/4.79 | 0.85 ** | 0.05 |
| A_ND560–760 | θ = 0.04 + 9.30 × 10⁻⁵ × ex/1.57 | 0.78 ** | 0.03 | θ = 0.01 + 0.04 × e−x/2.84 | 0.91 ** | 0.05 |
| Sandy Loam | 1.50 g cm−3 (n = 17) | RMSE | 1.60 g cm−3 (n = 22) | RMSE | ||
|---|---|---|---|---|---|---|
| Regression Equation | R2 | m3 m−3 | Regression Equation | R2 | m3 m−3 | |
| Rb | θ = 1.24 × e−24.70x | 0.86 ** | 0.03 | θ = 2.83 × e−34.60x | 0.88 ** | 0.05 |
| Sb | θ = 1.24 × e−0.66x | 0.86 ** | 0.04 | θ = 2.81 × e−0.92x | 0.88 ** | 0.04 |
| Ry | θ = 1.28 × e−20.10x | 0.88 ** | 0.03 | θ = 0.02 + 24.10 × e−x/0.02 | 0.90 ** | 0.04 |
| Sy | θ = 1.28 × e−0.64x | 0.88 ** | 0.03 | θ = 0.02 + 18.89 × e−x/0.63 | 0.89 ** | 0.04 |
| Rg | θ = 1.28 × e−21.70x | 0.88 ** | 0.03 | θ = 0.02 + 16.15 × e−x/0.02 | 0.88 ** | 0.04 |
| Sg | θ = 1.25 × e−0.47x | 0.87 ** | 0.04 | θ = 2.89 × e−30.50x | 0.88 ** | 0.02 |
| Rr | θ = 1.46 × e−13.00x | 0.91 ** | 0.03 | θ = 0.03 + 17.77 × e−x/0.03 | 0.89 ** | 0.05 |
| Sr | θ = 1.39 × e−0.14x | 0.91 ** | 0.03 | θ = 0.03 + 27.49 × e−x/2.74 | 0.90 ** | 0.04 |
| Ro | θ = 1.29 × e−17.30x | 0.90 ** | 0.03 | θ = 0.03 + 36.88 × e−x/0.02 | 0.91 ** | 0.04 |
| R900–970 | θ = 1.62 × e−10.70x | 0.93 ** | 0.03 | θ = 0.02 + 5.37 × e−x/0.06 | 0.89 ** | 0.05 |
| S900–970 | θ = 1.57 × e−0.15x | 0.93 ** | 0.04 | θ = 0.02 + 6.79 × e−x/3.74 | 0.89 ** | 0.05 |
| A_Depth500–670 | θ = 7 × 10⁻⁵ × e4.52x | 0.04 ns | 0.11 | θ = 1037.70 × e−5.42x | 0.02 ns | 0.12 |
| A_Area500–670 | θ = 1.30 × e−0.22x | 0.90 ** | 0.04 | θ = 0.03 + 35.50 × e−x/1.57 | 0.90 ** | 0.04 |
| A_ND500–670 | θ = 0.01 × e0.16x | 0.93 ** | 0.08 | θ = 0.001 × e−0.48x | 0.89 ** | 0.21 |
| A_Depth780–970 | θ = 647.50 × e−5.30x | 0.04 ns | 0.09 | θ = 1012 × e−19.10x | 0.25 ns | 0.13 |
| A_Area780–970 | θ = 1.54 × e−0.13x | 0.92 ** | 0.05 | θ = 0.02 + 10.10 × e−x/3.76 | 0.89 ** | 0.04 |
| A_ND780–970 | θ = 0.01 × e0.32x | 0.95 ** | 0.14 | θ = −0.09 + 0.03 × e−x/4.89 | 0.89 ** | 0.05 |
| A_Depth560–760 | θ = 0.15 + 8.56 × 10−61 × ex/0.01 | 0.01 ns | 0.11 | θ = 116.30 × e−5.94x | 0.07 ns | 0.12 |
| A_Area560–760 | θ = 1.28 × e−0.17x | 0.90 ** | 0.04 | θ = 0.03 + 42.49 × e−x/1.98 | 0.91 ** | 0.04 |
| A_ND560–760 | θ = 0.01 × e0.30x | 0.94 ** | 0.09 | θ = 0.04x − 0.20 | 0.87 ** | 0.05 |
References
- Oltra-Carrio, R.; Baup, F.; Fabre, S.; Fieuzal, R.; Briottet, X. Improvement of soil moisture retrieval from hyperspectral VNIR-SWIR data using clay content information: From laboratory to field experiments. Remote Sens. 2015, 7, 3184–3205. [Google Scholar] [CrossRef] [Green Version]
- Zhou, Q.Y.; Zhang, B.Z.; Jin, J.H.; Li, F.S. Production limits analysis of rain-fed maize on the basis of spatial variability of soil factors in North China. Precis. Agric. 2020, 21, 1187–1208. [Google Scholar] [CrossRef]
- Fascetti, F.; Pierdicca, N.; Pulvirenti, L.; Crapolicchio, R.; Munoz-Sabater, J. A comparison of ASCAT and SMOS soil moisture retrievals over Europe and Northern Africa from 2010 to 2013. Int. J. Appl. Earth Obs. Geoinf. 2016, 45, 135–142. [Google Scholar] [CrossRef]
- Zhang, J.Y.; Zhang, Q.L.; Bao, A.M.; Wang, Y.J. A new remote sensing dryness index based on the near-infrared and red spectral space. Remote Sens. 2019, 11, 456. [Google Scholar] [CrossRef] [Green Version]
- Carrao, H.; Russo, S.; Sepulcrecanto, G.; Barbosa, P. An empirical standardized soil moisture index for agricultural drought assessment from remotely sensed data. Int. J. Appl. Earth Obs. Geoinf. 2016, 48, 74–84. [Google Scholar] [CrossRef]
- Peng, J.; Loew, A.; Merlin, O.; Verhoest, N.E.C. A review of spatial downscaling of satellite remotely sensed soil moisture. Rev. Geophys. 2017, 55, 341–366. [Google Scholar] [CrossRef]
- Eroglu, O.; Kurum, M.; Boyd, D.; Gurbuz, A.C. High spatio-temporal resolution CYGNSS soil moisture estimates using artificial neural networks. Remote Sens. 2019, 11, 2272. [Google Scholar] [CrossRef] [Green Version]
- Koster, R.D.; Dirmeyer, P.A.; Guo, Z.C.; Bonan, G.; Chan, E.; Cox, P.; Gordon, C.T.; Kanae, S.; Kowalczyk, E.; Lawrence, D.; et al. Regions of strong coupling between soil moisture and precipitation. Science 2004, 305, 1138–1140. [Google Scholar] [CrossRef] [Green Version]
- Sobrino, J.A.; Franch, B.; Matter, C.; Jimenez-Munoz, J.C.; Corbari, C. A method to estimate soil moisture from airborne hyperspectral scanner (AHS) and ASTER data application to SEN2FLEX and SEN3EXP campaigns. Remote Sens. Environ. 2012, 117, 415–428. [Google Scholar] [CrossRef]
- Li, F.; Peng, X.F.; Chen, X.W.; Liu, M.L.; Xu, L.W. Analysis of key issues on GNSS-R soil moisture retrieval based on different antenna patterns. Sensors 2018, 18, 2498. [Google Scholar] [CrossRef] [Green Version]
- Rijal, S.; Zhang, X.D.; Jia, X.H. Estimating surface soil water content in the Red River Valley of the north using Landsat 5 TM data. Soil Sci. Soc. Am. J. 2013, 77, 1133–1143. [Google Scholar] [CrossRef] [Green Version]
- Lu, Y.L.; Horton, R.; Zhang, X.; Ren, T.S. Accounting for soil porosity improves a thermal inertia model for estimating surface soil water content. Remote Sens. Environ. 2018, 212, 79–89. [Google Scholar] [CrossRef]
- Heathman, G.C.; Cosh, M.H.; Han, E.J.; Jackson, T.J.; McKee, L.; McAfee, S. Field scale spatiotemporal analysis of surface soil moisture for evaluating point-scale in situ networks. Geoderma 2012, 170, 195–205. [Google Scholar] [CrossRef]
- Zou, P.; Yang, J.S.; Fu, J.R.; Liu, G.M.; Li, D.S. Artificial neural network and time series models for predicting soil salt and water content. Agric. Water Manag. 2010, 97, 2009–2019. [Google Scholar] [CrossRef]
- Bowers, S.A.; Hanks, R.J. Reflection of radiant energy from soils. Soil Sci. 1965, 100, 130–138. [Google Scholar] [CrossRef] [Green Version]
- Skidmore, E.L.; Dickerson, J.D.; Schimmelpfennig, H. Evaluating surface soil water content by measuring reflectance. Soil Sci. Soc. Am. J. 1975, 39, 238–242. [Google Scholar] [CrossRef]
- Muller, E.; Décamps, H. Modeling soil moisture reflectance. Remote Sens. Environ. 2001, 76, 173–180. [Google Scholar] [CrossRef] [Green Version]
- Liu, W.D.; Baret, F.; Gu, X.F.; Tong, Q.X.; Zheng, L.F.; Zhang, B. Relating soil surface moisture to reflectance. Remote Sens. Environ. 2002, 81, 238–246. [Google Scholar] [CrossRef]
- Lobell, D.B.; Asner, G.P. Moisture effects on soil reflectance. Soil Sci. Soc. Am. J. 2002, 66, 722–727. [Google Scholar] [CrossRef]
- Ben-Dor, E.; Chabrillat, S.; Demattê, J.A.M.; Taylor, G.R.; Hill, J.; Whiting, M.L.; Sommer, S. Using imaging spectroscopy to study soil properties. Remote Sens. Environ. 2009, 113, S38–S55. [Google Scholar] [CrossRef]
- Edwards, B.L.; Namikas, S.L.; D’Sa, E.J. Simple infrared techniques for measuring beach surface moisture. Earth Surf. Process. Landf. 2013, 38, 192–197. [Google Scholar] [CrossRef]
- Sekertekin, A.; Marangoz, A.M.; Abdikan, S. ALOS-2 and Sentinel-1 SAR data sensitivity analysis to surface soil moisture over bare and vegetated agricultural fields. Comput. Electron. Agric. 2020, 171, 105303. [Google Scholar] [CrossRef]
- Slaughter, D.C.; Pelletier, M.G.; Upadhyaya, S.K. Sensing soil moisture using NIR spectroscopy. Appl. Eng. Agric. 2001, 17, 241–247. [Google Scholar] [CrossRef]
- Pulvirenti, L.; Squicciarino, G.; Cenci, L.; Boni, G.; Pierdicca, N.; Chini, M.; Versace, C.; Campanella, P. A surface soil moisture mapping service at national (Italian) scale based on Sentinel-1 data. Environ. Model. Softw. 2018, 102, 13–28. [Google Scholar] [CrossRef]
- Leng, P.; Song, X.N.; Li, Z.L.; Wang, Y.W.; Wang, D. Effects of vegetation and soil texture on surface soil moisture retrieval using multi-temporal optical and thermal infrared observations. Int. J. Remote Sens. 2015, 36, 4972–4985. [Google Scholar] [CrossRef]
- Lunt, I.A.; Hubbard, S.S.; Rubin, Y. Soil moisture content estimation using ground penetrating radar reflection data. J. Hydrol. 2005, 307, 254–269. [Google Scholar] [CrossRef]
- Adegoke, J.O.; Carleton, A.M. Relations between soil moisture and satellite vegetation indices in the U.S. Corn Belt. J. Hydrometeorol. 2002, 3, 395–405. [Google Scholar] [CrossRef] [Green Version]
- Sandholt, I.; Rasmussen, K.; Andersen, J. A simple interpretation of the surface temperature/vegetation index space for assessment of surface moisture status. Remote Sens. Environ. 2002, 79, 213–224. [Google Scholar] [CrossRef]
- Kolassa, J.; Gentine, P.; Prigent, C.; Aires, F. Soil moisture retrieval from AMSR-E and ASCAT microwave observation synergy. Part 1: Satellite data analysis. Remote Sens. Environ. 2016, 173, 1–14. [Google Scholar] [CrossRef]
- Demattê, J.A.M.; Nanni, M.R.; da Silva, A.P.; de Melo, J.F.; Dos Santos, W.C.; Campos, R.C. Soil density evaluated by spectral reflectance as an evidence of compaction effects. Int. J. Remote Sens. 2010, 31, 403–422. [Google Scholar] [CrossRef]
- Kolassa, J.; Reichle, R.H.; Liu, Q.; Alemohammad, S.H.; Gentine, P.; Aida, K.; Asanuma, J.; Bircher, S.; Caldwell, T.; Colliander, A.; et al. Estimating surface soil moisture from SMAP observations using a neural network technique. Remote Sens. Environ. 2018, 204, 43–59. [Google Scholar] [CrossRef]
- Achieng, K.O. Modelling of soil moisture retention curve using machine learning techniques: Artificial and deep neural networks vs support vector regression models. Comput. Geosci. 2019, 133, 104320. [Google Scholar] [CrossRef]
- Senyurek, V.; Lei, F.; Boyd, D.; Kurum, M.; Gurbuz, A.C.; Moorhead, R. Machine learning-based CYGNSS soil moisture estimates over ISMN sites in CONUS. Remote Sens. 2020, 12, 1168. [Google Scholar] [CrossRef] [Green Version]
- Heiskanen, J. Comparison of three methods for determining the particle density of soil with liquid pycnometers. Commun. Soil Sci. Plan Anal. 1992, 23, 841–846. [Google Scholar] [CrossRef]
- Coblinski, J.A.; Giasson, E.; Demattê, J.A.M.; Dotto, A.C.; Costa, J.J.F.; Vasat, R. Prediction of soil texture classes through different wavelength regions of reflectance spectroscopy at various soil depths. Catena 2020, 189, 104485. [Google Scholar] [CrossRef]
- Clark, R.N.; Roush, T.L. Reflectance spectroscopy: Quantitative analysis techniques for remote sensing applications. J. Geophys. Res. 1984, 89, 6329–6340. [Google Scholar] [CrossRef]
- Pope, R.M.; Fry, E.S. Absorption spectrum (380–700 nm) of pure water. II. integrating cavity measurements. Appl. Opt. 1997, 36, 8710–8723. [Google Scholar] [CrossRef]
- Whalley, W.R.; Leeds-Harrison, P.B.; Bowman, G.E. Estimation of soil moisture status using near infrared reflectance. Hydrol. Process. 1991, 5, 321–327. [Google Scholar] [CrossRef]
- Tian, J.; Philpot, W.D. Relationship between surface soil water content, evaporation rate, and water absorption band depths in SWIR reflectance spectra. Remote Sens. Environ. 2015, 169, 280–289. [Google Scholar] [CrossRef]
- Kokaly, R.F.; Clark, R.N. Spectroscopic determination of leaf biochemistry using band depth analysis of absorption features and stepwise multiple linear regression. Remote Sens. Environ. 1999, 67, 267–287. [Google Scholar] [CrossRef]
- Mutanga, O.; Skidmore, A.K. Hyperspectral band depth analysis for a better estimation of grass biomass (Cenchrus ciliaris) measured under controlled laboratory conditions. Int. J. Appl. Earth Obs. Geoinf. 2004, 5, 87–96. [Google Scholar] [CrossRef]
- Vasava, H.B.; Gupta, A.; Arora, R.; Das, B.S. Assessment of soil texture from spectral reflectance data of bulk soil samples and their dry-sieved aggregate size fractions. Geoderma 2019, 337, 914–926. [Google Scholar] [CrossRef]
- Eisenberg, D.; Kauzman, W. The Structure and Properties of Water; Oxford University Press: Oxford, UK, 2005; pp. 197–204. [Google Scholar]
- Demattê, J.A.M.; Sousa, A.A.; Alves, M.C.; Nanni, M.R.; Fiorio, P.R.; Campos, R.C. Determining soil water status and other soil characteristics by spectral proximal sensing. Geoderma 2006, 135, 179–195. [Google Scholar] [CrossRef]
- Wozniak, B.; Dera, J. Light Absorption in Sea Water; Springer: New York, NY, USA, 2007; pp. 11–18. [Google Scholar]
- Bablet, A.; Vu, P.V.; Jacquemoud, S.; Viallefont-Robinet, F.; Fabre, S.; Briottet, X.; Sadeghi, M.; Whiting, M.L.; Baret, F.; Tian, J. MARMIT: A multilayer radiative transfer model of soil reflectance to estimate surface soil moisture content in the solar domain (400–2500 nm). Remote Sens. Environ. 2018, 217, 1–17. [Google Scholar] [CrossRef] [Green Version]
- Taghavifar, H.; Mardani, A.; Mohebbi, A.; Taghavifar, H. Investigating the effect of combustion properties on the accumulated heat release of DI engines at rated EGR levels using the ANN approach. Fuel 2014, 137, 1–10. [Google Scholar] [CrossRef]
- Prakash, R.; Singh, D.; Pathak, N.P. A fusion approach to retrieve soil moisture with SAR and optical data. IEEE J. STARS 2012, 5, 196–206. [Google Scholar] [CrossRef]
- Rahimzadeh-bajgiran, P.; Berg, A.A.; Champagne, C.; Omasa, K. Estimation of soil moisture using optical/thermal infrared remote sensing in the Canadian Prairies. ISPRS J. Photogramm. Remote Sens. 2013, 83, 94–103. [Google Scholar] [CrossRef]
- Roosjen, P.P.J.; Bartholomeus, H.M.; Clevers, J.G.P.W. Effects of soil moisture content on reflectance anisotropy laboratory goniometer measurements and RPV model inversions. Remote Sens. Environ. 2015, 170, 229–238. [Google Scholar] [CrossRef]
- Baumgardner, M.F.; Silva, L.R.F.; Biehl, L.L. Reflectance Properties of Soils. Adv. Agron. 1986, 38, 1–44. [Google Scholar] [CrossRef]
- Sadeghi, M.; Babaeian, E.; Tuller, M.; Jones, S.B. Particle size effects on soil reflectance explained by an analytical radiative transfer model. Remote Sens. Environ. 2018, 210, 375–386. [Google Scholar] [CrossRef]
- Hillel, D. Introduction to Environmental Soil Physics; Academic Press: London, UK, 2004; pp. 39–73. [Google Scholar]
- Sarathjith, M.C.; Das, B.S.; Vasava, H.B.; Mohanty, B.; Sahadevan, A.S.; Wani, S.P.; Sahrawat, K.L. Diffuse reflectance spectroscopic approach for the characterization of soil aggregate size distribution. Soil Sci. Soc. Am. J. 2014, 78, 369–376. [Google Scholar] [CrossRef]
- Jin, X.L.; Du, J.; Liu, H.J.; Wang, Z.M.; Song, K.S. Remote estimation of soil organic matter content in the Sanjiang Plain, Northest China: The optimal band algorithm versus the GRA-ANN model. Agric. Forest Meteorol. 2016, 218, 250–260. [Google Scholar] [CrossRef]
- Mather, P.M. Computer Processing of Remotely-Sensed Images: An Introduction, 3rd ed.; Wiley: Chichester, UK, 2004; pp. 19–24. [Google Scholar]
- Rumelhart, D.E.; Hinton, G.E.; Williams, R.J. Learning Internal Representations by Error Propagation: Explorations in the MICROSTRUCTURE of Cognition; Rumelhart, D.E., McClelland, J.L., CORPORATE PDP Research Group, Eds.; MIT Press: Cambridge, MA, USA, 1986; Volume 1, pp. 318–362. [Google Scholar]
- Santi, E.; Paloscia, S.; Pettinato, S.; Fontanelli, G. Application of artificial neural networks for the soil moisture retrieval from active and passive microwave spaceborne sensors. Int. J. Appl. Earth Obs. Geoinf. 2016, 48, 61–73. [Google Scholar] [CrossRef]
- Böttcher, K.; Gläßer, C.; Mooney, S.J. Examining the relationship between soil structure and soil reflectance using soil pore structure characteristics obtained from image analysis. Remote Sens. Lett. 2012, 3, 557–565. [Google Scholar] [CrossRef]
- Whiting, M.L.; Li, L.; Ustin, S.L. Predicting water content using Gaussian model on soil spectra. Remote Sens. Environ. 2004, 89, 535–552. [Google Scholar] [CrossRef]
- Verpoorter, C.; Carrère, V.; Combe, J.P. Visible, near-infrared spectrometry for simultaneous assessment of geophysical sediment properties (water and grain size) using the spectral derivative-modified gaussian model. J. Geophys. Res. Earth 2014, 119, 2098–2122. [Google Scholar] [CrossRef]
- Arsoy, S.; Ozgur, M.; Keskin, E.; Yilmaz, C. Enhancing TDR based water content measurements by ANN in sandy soils. Geoderma 2013, 195, 133–144. [Google Scholar] [CrossRef]

| Soil Texture | Sand (0.02–2 mm, %) | Silt (0.002–0.02 mm, %) | Clay (<0.002 mm, %) | Particle Density (g cm−3) | SOM (g kg−1) |
|---|---|---|---|---|---|
| Sandy soil | 88.80 | 0 | 11.20 | 2.68 ± 0.02 | 1.30 |
| Loamy soil | 43.60 | 40.00 | 16.40 | 2.58 ± 0.02 | 10.90 |
| Clay loam soil | 28.00 | 34.67 | 37.33 | 2.68 ± 0.09 | 8.20 |
| Sandy loam soil | 73.60 | 13.33 | 13.07 | 2.50 ± 0.09 | 17.20 |
| Soil Texture | Soil Bulk Density (g cm−3) | Soil Moisture (m3 m−3) | Treatments |
|---|---|---|---|
| Sandy soil | 1.40 | 0–0.33 | 8 |
| 1.50 | 0–0.42 | 11 | |
| 1.60 | 0–0.40 | 11 | |
| 1.70 | 0–0.37 | 11 | |
| Loamy soil | 1.20 | 0–0.42 | 9 |
| 1.30 | 0–0.45 | 10 | |
| 1.40 | 0–0.46 | 11 | |
| 1.50 | 0–0.42 | 11 | |
| Clay loam soil | 1.30 | 0–0.25 | 6 |
| 1.40 | 0–0.34 | 8 | |
| 1.50 | 0–0.34 | 9 | |
| 1.60 | 0–0.39 | 11 | |
| Sandy loam soil | 1.30 | 0–0.33 | 8 |
| 1.40 | 0–0.29 | 8 | |
| 1.50 | 0–0.32 | 9 | |
| 1.60 | 0–0.32 | 10 |
| Title | Definition and Description | Formula |
|---|---|---|
| Rb | Maximum reflectance with blue edge (490–530 nm) | max(Rb) |
| Sb | Sum reflectance with blue edge | ∑Rb |
| Ry | Maximum reflectance with yellow edge (550–580 nm) | max(Ry) |
| Sy | Sum reflectance with yellow edge | ∑Ry |
| Rg | Maximum reflectance with green peak | max(Rg) |
| Sg | Sum reflectance with green edge (510–560 nm) | ∑Rg |
| Rr | Maximum reflectance with red peak | max(Rr) |
| Sr | Sum reflectance with red edge (580–680 nm) | ∑Rr |
| Ro | Lowest reflectance with red edge | min(Ry) |
| R900–970 | Maximum reflectance with 900–970 nm | max(Ri) |
| S900–970 | Sum reflectance with 900–970 nm | ∑Ri |
| A_Depth500–670 | Absorption depth feature in 500–670 nm | 1-min(Ri) |
| A_Area500–670 | Absorption area feature in 500–670 nm | |
| A_ND500–670 | Normalized absorption depth in 500–670 nm | A_Depthi/A_Areai |
| A_Depth780–970 | Absorption depth feature with 780–970 | 1-min (Ri) |
| A_Area780–970 | Absorption area feature in 780–970 nm | |
| A_ND780–970 | Normalized absorption depth in 780–970 nm | A_Depthi/A_Areai |
| A_Depth560–760 | Absorption depth feature in 560–760 nm | 1-min(Ri) |
| A_Area560–760 | Absorption area feature in 560–760 nm | |
| A_ND560–760 | Normalized absorption depth in 560–760 nm | A_Depthi/A_Areai |
| Spectral Feature Parameters | Sandy Soil (n = 108) | RMSE | Loamy Soil (n = 105) | RMSE | ||
|---|---|---|---|---|---|---|
| Regression Equation | R2 | m3 m−3 | Regression Equation | R2 | m3 m−3 | |
| Rb | θ = 0.44 × e−5.45x | 0.23 * | 0.09 | θ = −0.01 + 1.41 × e−x/0.06 | 0.87 ** | 0.04 |
| Sb | θ = 0.44 × e−0.15x | 0.23 * | 0.09 | θ = −0.02 + 1.28 × e−x/2.28 | 0.87 ** | 0.05 |
| Ry | θ = 1.06 − 0.73 × ex/1.31 | 0.22 * | 0.09 | θ = −0.01 + 1.68 × e−x/0.08 | 0.87 ** | 0.04 |
| Sy | θ = 1.28−0.95 × ex/49.44 | 0.22 * | 0.09 | θ = −0.01 + 1.63 × e−x/2.41 | 0.87 ** | 0.04 |
| Rg | θ = 1.34 × −ex/1.53 | 0.22 * | 0.09 | θ = −0.01 + 1.61 × e−x/0.07 | 0.87 ** | 0.05 |
| Sg | θ = 4.75−4.40 × ex/247.62 | 0.24 * | 0.09 | θ = −0.01 + 1.45 × e−x/3.18 | 0.87 ** | 0.04 |
| Rr | θ = 0.60−0.29 × ex/0.93 | 0.20 * | 0.09 | θ = 0.01 + 2.65 × e−x/0.10 | 0.88 ** | 0.05 |
| Sr | θ = 0.42 × e−0.03x | 0.19 * | 0.09 | θ = 2.32 × e9.44x | 0.87 ** | 0.05 |
| Ro | θ = 0.43 × e−3.23x | 0.20 * | 0.09 | θ = −0.01 + 1.89 × e−x/0.09 | 0.87 ** | 0.05 |
| R900–970 | θ = 0.42 × e−2.49x | 0.21 * | 0.09 | θ = −0.01 + 1.95 × e−x/0.12 | 0.92 ** | 0.03 |
| S900–970 | θ = 0.42 × e−0.04x | 0.21 * | 0.09 | θ = −0.01 + 1.86 × e−x/8.82 | 0.92 ** | 0.04 |
| A_Depth500–670 | θ = e8.12−0.12x | 0.06 ns | 0.11 | θ = 1.06 × 10⁶ × e−10.01x | 0.32 ** | 0.11 |
| A_Area500–670 | θ = 0.43 × e−0.04x | 0.19 * | 0.09 | θ = 2.00 × e−x/6.85 | 0.87 ** | 0.04 |
| A_ND500–670 | θ = 0.09 × e0.09x | 0.16 ns | 0.09 | θ = 0.03 × e0.26x | 0.79 ** | 0.07 |
| A_Depth780–970 | θ = e−1.01x | 0.31 * * | 0.11 | θ = 400.20 × e−4.27x | 0.04ns | 0.12 |
| A_Area780–970 | θ = 0.64−0.33 × ex/89.43 | 0.19 * | 0.09 | θ = 2.99 × e−0.12x | 0.87 ** | 0.05 |
| A_ND780–970 | θ = 0.16 × e0.02x | 0.00 ns | 0.11 | θ = 0.01 × e0.36x | 0.89 ** | 0.06 |
| A_Depth560–760 | θ = e0.34−1.54x | 0.00 ns | 0.11 | θ = 133.28 × e−5.63x | 0.24 * | 0.11 |
| A_Area560–760 | θ = 0.43 × e−0.03x | 0.20 * | 0.09 | θ = 2.00 × e−0.12x | 0.87 ** | 0.07 |
| A_ND560–760 | θ = 0.25−0.95 × e−x/1.65 | 0.18 ns | 0.09 | θ = 0.02 × e0.39x | 0.86 ** | 0.07 |
| Spectral Feature Parameters | Clay Loam Soil (n = 69) | RMSE | Sandy Loam Soil (n = 65) | RMSE | ||
|---|---|---|---|---|---|---|
| Regression Equation | R2 | m3 m−3 | Regression Equation | R2 | m3 m−3 | |
| Rb | θ = 0.79 × e−16.58x | 0.65 ** | 0.04 | θ = −0.02 + 1.19 × e−x/0.04 | 0.79 ** | 0.03 |
| Sb | θ = 0.78 × e−0.46x | 0.62 ** | 0.04 | θ = −0.03 + 1.05 × e−x/1.78 | 0.78 ** | 0.03 |
| Ry | θ = e−10.11x | 0.73 ** | 0.04 | θ = −0.01 + 1.63 × e−x/0.04 | 0.82 ** | 0.03 |
| Sy | θ = 0.36–2.08 × e−x/1.76 | 0.76 ** | 0.04 | θ = −0.01 + 1.50 × e−x/1.44 | 0.81 ** | 0.03 |
| Rg | θ = 0.89 × e−12.01x | 0.70 ** | 0.04 | θ = −0.01 + 1.45 × e−x/0.04 | 0.81 ** | 0.03 |
| Sg | θ = 0.50–0.12 × ex/5.50 | 0.73 ** | 0.04 | θ = −0.02 + 1.23 × e−x/2.22 | 0.80 ** | 0.03 |
| Rr | θ = 2.83–2.31 × ex/1.99 | 0.83 ** | 0.03 | θ = 0.02 + 4.36 × e−x/0.05 | 0.86 ** | 0.02 |
| Sr | θ = 1.15 × e−0.08x | 0.80 ** | 0.02 | θ = 0.01 + 3.43 × e−x/4.64 | 0.86 ** | 0.02 |
| Ro | θ = 1.10–0.62 × ex/0.58 | 0.80 ** | 0.03 | θ = 0.01 + 2.13 × e−x/0.04 | 0.84 ** | 0.02 |
| R900–970 | θ = −4340.76 + 4341.29 × e−x/3432.59 | 0.85 ** | 0.03 | θ = 0.02 + 4.28 × e−x/0.06 | 0.87 ** | 0.02 |
| S900–970 | θ = −5174.75 + 5175.28 × e−x/286102.63 | 0.85 ** | 0.03 | θ = 0.02 + 5.26 × e−x/3.85 | 0.87 ** | 0.02 |
| A_Depth500–670 | θ = e−14.64 + 8.22x | 0.46 ** | 0.06 | θ = 9 × 10⁹ × e−14.90x | 0.10 ns | 0.07 |
| A_Area500–670 | θ = 1.07 × e−0.10x | 0.77 ** | 0.03 | θ = 0.01 + 2.79 × e−x/3.04 | 0.85 ** | 0.02 |
| A_ND500–670 | θ = 0.34–1.48 × e−x/3.60 | 0.81 ** | 0.03 | θ = −0.10 + 0.47 × e−x/11.23 | 0.85 ** | 0.02 |
| A_Depth780–970 | θ = 0.35–1.81 × 10⁻¹⁷ × ex/0.05 | 0.55 ** | 0.02 | θ = 17.68 × e−2.98x | 0.03 ns | 0.04 |
| A_Area780–970 | θ = −30.43 + 30.97 × e−x/1975.07 | 0.84 ** | 0.02 | θ = 0.24 + 6.78 × e−x/4.01 | 0.86 ** | 0.09 |
| A_ND780–970 | θ = 0.26–1019.35 × e−x/0.71 | 0.37 ** | 0.05 | θ = −0.05 + 0.02 × e−x/4.43 | 0.87 ** | 0.03 |
| A_Depth560–760 | θ = 0.17 + 1.63 × 10⁻¹⁷ × e−x/0.03 | 0.13 ns | 0.06 | θ = 1759.92 × e8.36x | 0.15 ns | 0.07 |
| A_Area560–760 | θ = 1.19–0.71 × ex/108.01 | 0.80 ** | 0.03 | θ = 2.32 × e−x/4.26 | 0.84 ** | 0.02 |
| A_ND560–760 | θ = 0.36–2.08 × e−x/1.76 | 0.85 ** | 0.02 | θ = −0.01 + 0.01 × ex/3.47 | 0.85 ** | 0.03 |
| Spectral FeatureParameters | (n = 349) | RMSE | |
|---|---|---|---|
| Regression Equation | R2 | m3 m−3 | |
| Rb | θ = e−0.77–7.92x | 0.35 ** | 0.06 |
| Sb | θ = 0.47 × e−0.23x | 0.35 ** | 0.06 |
| Ry | θ = −0.25 + 0.64 × e−x/0.48 | 0.33 ** | 0.07 |
| Sy | θ = −0.11 + 0.52 × e−x/9.40 | 0.33 ** | 0.07 |
| Rg | θ = 0.46 × e−6.00x | 0.33 ** | 0.07 |
| Sg | θ = −0.01 + 0.47 × e−x/7.00 | 0.34 ** | 0.06 |
| Rr | θ = −0.24 + 0.68 × e−x/0.59 | 0.38 ** | 0.07 |
| Sr | θ = −0.34 + 0.75 × e−x/72.30 | 0.36 ** | 0.08 |
| Ro | θ = −0.44 + 0.82 × e−x/0.79 | 0.34 ** | 0.07 |
| R900-970 | θ = −0.05 + 0.65 × e−x/0.28 | 0.48 ** | 0.05 |
| S900-970 | θ = −0.06 + 0.64 × e−x/20.42 | 0.47 ** | 0.06 |
| A_Depth500-670 | θ = 0.17 + 1.61 × 1036 × e−x/0.62 | 0.09ns | 0.09 |
| A_Area500-670 | θ = −6.56 + 6.91 × e−x/770.41 | 0.31 ** | 0.07 |
| A_ND500-670 | θ = 0.26−0.89 × e−x/3.37 | 0.32 ** | 0.08 |
| A_Depth780-970 | θ = 0.89 × e−0.94x | 0.21 ** | 0.08 |
| A_Area780-970 | θ = −0.07 + 0.60 × e−x/26.70 | 0.43 ** | 0.06 |
| A_ND780-970 | θ = 0.32−0.59 × e−x/4.87 | 0.25 ** | 0.06 |
| A_Depth560-760 | θ = 0.37 × e−0.59x | 0.01ns | 0.09 |
| A_Area560-760 | θ = −0.82 + 1.18 × e−x/133.97 | 0.33 ** | 0.07 |
| A_ND560-760 | θ = 0.27−1.03 × e−x/2.00 | 0.36 ** | 0.07 |
| Soil Type | Factors | R2 | RMSE (m3 m−3) |
|---|---|---|---|
| Sandy soil | 20 | 0.76 ** | 0.07 |
| Loamy soil | 20 | 0.95 ** | 0.04 |
| Clay loam soil | 20 | 0.96 ** | 0.02 |
| Sandy loam soil | 20 | 0.90 ** | 0.04 |
| Whole | 20 | 0.95 ** | 0.03 |
Publisher’s Note: MDPI stays neutral with regard to jurisdictional claims in published maps and institutional affiliations. |
© 2021 by the authors. Licensee MDPI, Basel, Switzerland. This article is an open access article distributed under the terms and conditions of the Creative Commons Attribution (CC BY) license (https://creativecommons.org/licenses/by/4.0/).
Share and Cite
Diao, W.; Liu, G.; Zhang, H.; Hu, K.; Jin, X. Influences of Soil Bulk Density and Texture on Estimation of Surface Soil Moisture Using Spectral Feature Parameters and an Artificial Neural Network Algorithm. Agriculture 2021, 11, 710. https://doi.org/10.3390/agriculture11080710
Diao W, Liu G, Zhang H, Hu K, Jin X. Influences of Soil Bulk Density and Texture on Estimation of Surface Soil Moisture Using Spectral Feature Parameters and an Artificial Neural Network Algorithm. Agriculture. 2021; 11(8):710. https://doi.org/10.3390/agriculture11080710
Chicago/Turabian StyleDiao, Wanying, Gang Liu, Huimin Zhang, Kelin Hu, and Xiuliang Jin. 2021. "Influences of Soil Bulk Density and Texture on Estimation of Surface Soil Moisture Using Spectral Feature Parameters and an Artificial Neural Network Algorithm" Agriculture 11, no. 8: 710. https://doi.org/10.3390/agriculture11080710
APA StyleDiao, W., Liu, G., Zhang, H., Hu, K., & Jin, X. (2021). Influences of Soil Bulk Density and Texture on Estimation of Surface Soil Moisture Using Spectral Feature Parameters and an Artificial Neural Network Algorithm. Agriculture, 11(8), 710. https://doi.org/10.3390/agriculture11080710