Article

Organic Amendment vs. Mineral Fertilization under Minimum Tillage: Changes in Soil Nutrients, Soil Organic Matter, Biological Properties and Yield after 10 Years

by
Diana Martín-Lammerding
1,
José L. Gabriel
1,2,*,
Encarnación Zambrana
1,
Inés Santín-Montanyá
1 and
José L. Tenorio
1
1
Departamento de Medio Ambiente y Agronomía, Instituto Nacional de Investigación y Tecnología Agraria y Alimentaria, INIA-CSIC, Carretera de la Coruña km 7.5, 28040 Madrid, Spain
2
Centro de Estudios e Investigación Para la Gestión de Riesgos Agrarios y Medioambientales, CEIGRAM-UPM, Senda del Rey 13, 28040 Madrid, Spain
*
Author to whom correspondence should be addressed.
Agriculture 2021, 11(8), 700; https://doi.org/10.3390/agriculture11080700
Submission received: 14 June 2021 / Revised: 21 July 2021 / Accepted: 22 July 2021 / Published: 26 July 2021
(This article belongs to the Special Issue Effects of Fertilizer and Irrigation on Crop Production)

Abstract

:
Conservation tillage is recognized as a sustainable management practice, however its combination with organic residues application still constitutes a challenge in some areas. A field trial was established in a semiarid agro-ecosystem to study the effects of different crop nutrient sources under minimum tillage (MT). Application of organic amendments at the beginning of a five-year crop rotation (ORG treatment) was evaluated and compared to the control plot where wheat was continuously grown with traditional mineral fertilization (MIN treatment). In addition to wheat yield and biomass, several soil properties were measured (pH, soil nutrients (i.e., Olsen P, exchangeable K, and mineral N), soil organic matter (i.e., C, N, C/N ratio), potentially mineralizable nitrogen, total microbial activity and heavy metals) throughout the 10-year study. The wheat yield was significantly higher under the ORG treatment than under the MIN, although climatic conditions (e.g., rainfall) exerted a great influence too. The organic amendments increased soil nutrients content mainly right after their application but the levels were adequate for the whole crop rotation. Plots under organic amendment application did not accumulate significantly more soil organic matter than those mineral-fertilized, probably due to the low protective capacity of coarse-textured soils. The application of organic amendments under MT resulted in a promising management agro-ecosystem compared to the mineral fertilized because crop nutrients came from organic wastes, no herbicides were applied while the yields were higher.

1. Introduction

Increasing soil organic matter (SOM) in agro-ecosystems can help mitigate climate change by increasing soil C sequestration while simultaneously increasing soil productivity [1]. Agricultural management choices can affect the carbon (C) cycle either positively or negatively. Conventional farming practices such as intensive deep moldboard tillage and excessive application of agro-chemicals have caused soil degradation and contamination of water resources and the atmosphere [2]. The negative effects of deep moldboard tillage on SOM are well known [3]. Intensive tillage usually causes faster SOM mineralization by breaking the soil’s protective macro-aggregates and increases aeration, which provides more nitrogen (N) to the growing crop but can also degrade soil quality. Semiarid coarse-textured soils are especially susceptible to intensive tillage because of their intrinsic low SOM content [4,5], which results from (i) low biomass production due to water scarcity and (ii) increased mineralization rates together with low humification rates due to elevated temperatures [6]. In Mediterranean semiarid areas, the decline in SOM is the main reason for soil erosion, crusting and loss of aggregate stability, which in turn has resulted in the loss of soil functionality for crop production [7,8,9,10].
In addition to conservation management practices, the use of manures and composts increases the organic matter input in organic agro-systems and it is often associated with increased SOM [11,12]. Although priming effects might occur, usually more SOM is replenished than lost [13]. Application of organic fertilizers helps respond to problems associated with waste management: provides nutrients to the crop, improves soil structure and water holding capacity, and it can also contribute to climate change mitigation, through C sequestration and through reduction of direct CO2 emission during mineral fertilizer production [14,15,16,17]. Rather, a number of problems might arise from excessive or incorrect application or timing of organic amendments, e.g., ammonia volatilization, greenhouse gas emission, nitrate lixiviation, runoff of manure phosphorus (P), salinization of both runoff water and soil, heavy metal accumulation, etc., which result in diffuse contamination and ecological problems [18,19,20].
In addition, the biological mobilization of soil nutrients in organic farming is an important issue because it should couple plant needs with soil processes [21]. Unbalanced addition of nutrients (e.g., P) might occur, especially when the rate of the organic amendment application is based on crop N needs [22]. The decomposition of organic amendments and associated nutrient release is regulated by the chemical composition of the organic residues (e.g., C:N ratio, lignin) as well as by mesofauna and microbial activities [23]. Organic inputs increase the concentration of soil labile carbon, which directly stimulates microbial activity, and it can also introduce external microbial populations [24]. Hydrolysis of fluorescein diacetate (FDA) is used to estimate microbial activity in the soil since the enzymes that hydrolyze FDA (esterases, lipases and proteases) are involved in the microbial decomposition of SOM [25]. Potentially mineralizable nitrogen (PMN) provides an estimate of the soil’s labile N and, along with other biochemical parameters such as FDA hydrolysis, were used as indicators of SOM quality. Some authors state that the application of organic amendments can increase the soil’s heavy metal concentration, especially the copper (Cu) and zinc (Zn) content, due to animal feeding and medical products [26,27]. In some cases, continuous application of organic amendments can lead to soil contamination with heavy metals, which can either accumulate in the soil or be taken up by the edible parts of plants, causing a potential threat to consumers [28].
Although both minimum tillage and application of organic fertilizers are widely studied, how conservation practices interact with the organic amendment application under different pedo-climate conditions is less well understood. Soil texture can influence the extent to which agronomic practices can affect SOM accumulation, e.g., Chivenge et al. [29] found that additions of organic matter are of greater importance for organic C build-up in sandy soils than tillage management, whereas clayey soils are more influenced by tillage than by organic inputs.
The use of diversified rotations and the addition of manures can alter system efficiency, by changing the degree of incorporation and type of material entering the soil [30]. Thus, we hypothesized that the application of organic amendments in a semiarid agro-ecosystem will supply the required nutrients to the crops along the rotation increasing their production in comparison to mineral fertilized plots. We also expected an increase in SOM content and an enhance in biological activity (PMN and FDA) compared to mineral fertilization. For proving the aforementioned hypothesis, we evaluated: (i) wheat yield and straw biomass data, (ii) the soil’s main nutrient content, biological properties and heavy metal accumulation and (iii) accumulated phosphorous (P), potassium (K), mineral N (NMIN), SOC and SN stocks (0–30 cm depth) under two different management systems: MT with an organic amendment application (ORG) versus MT with traditional mineral fertilization (MIN). This manuscript encompasses 10 years of research (2009–2019) based on a field experiment. The results might serve to help define sustainable practices in semiarid areas.

2. Materials and Methods

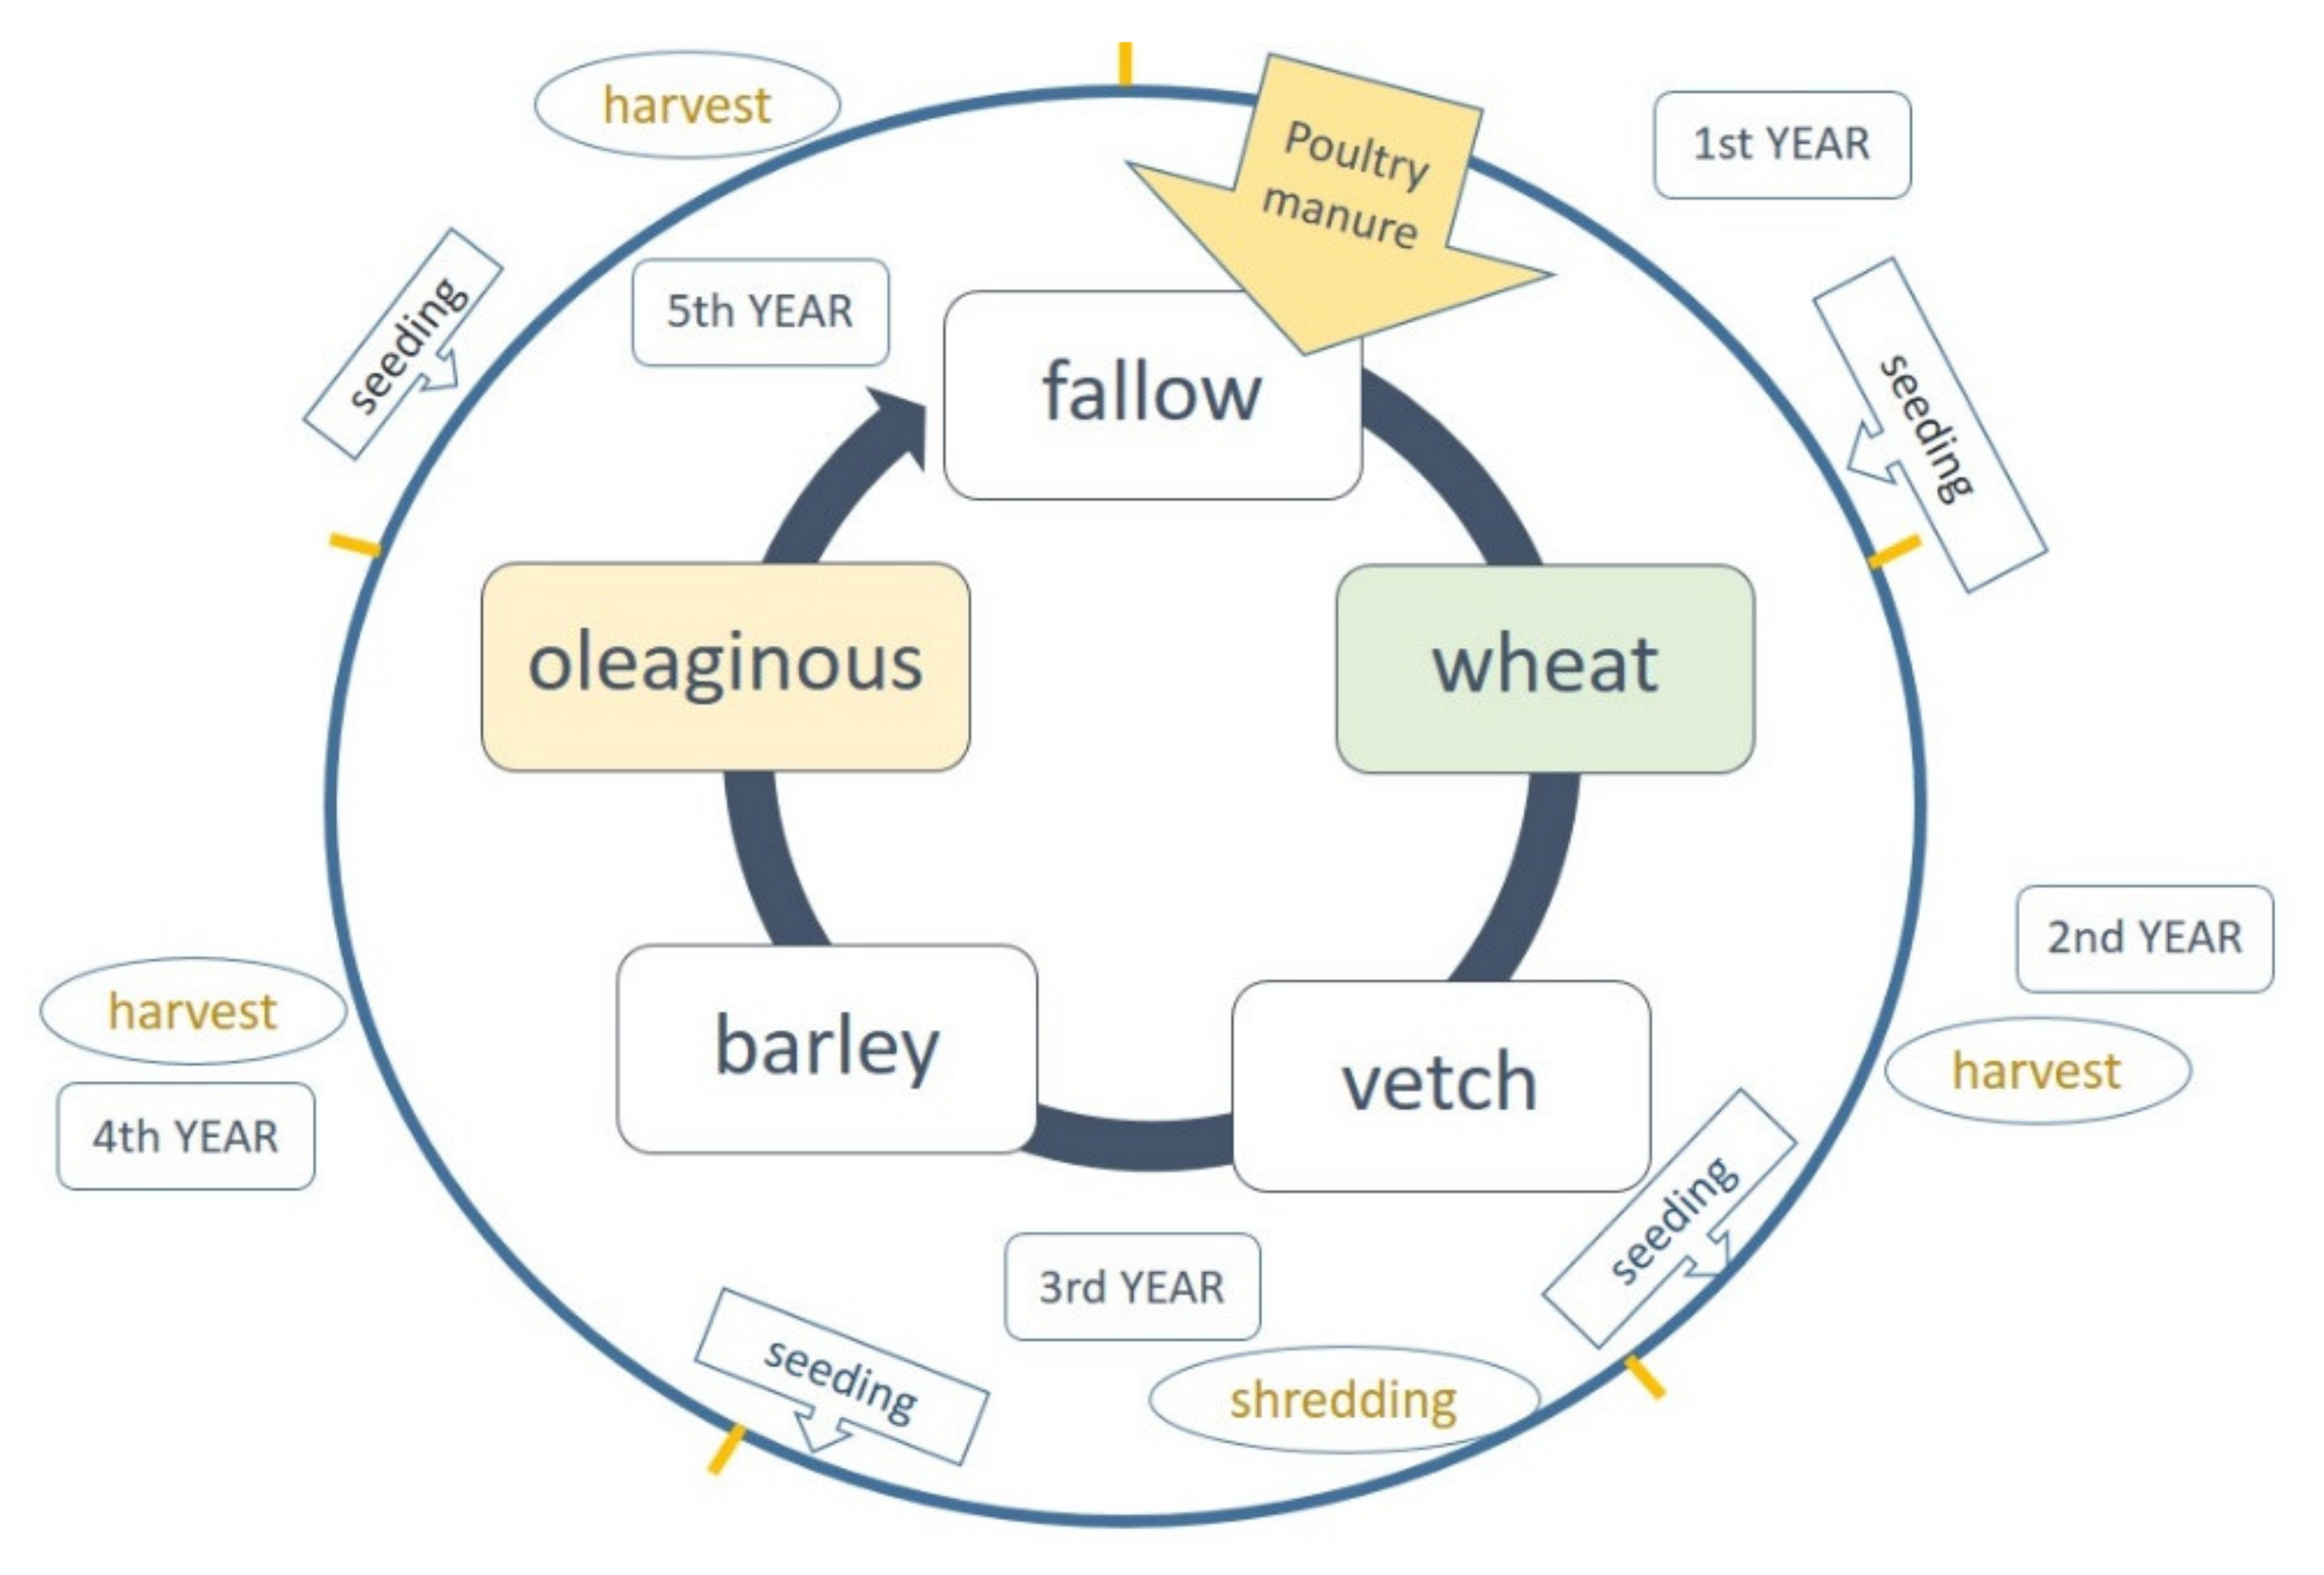
2.1. Experimental Design

This study was conducted in an experimental rainfed field located in Alcalá de Henares (Madrid) in central Spain (40°32′ N, 3°20′ W; altitude 600 m.a.s.l.). The area has a xeric moisture regime and is characterized by a semiarid Mediterranean climate with hot and dry summers, classified as BSk on the Köppen–Geiger scale [31]. The mean annual temperature of the site is 13.4 °C, with mean maximum and minimum temperatures of 20.3 °C and 6.5 °C, respectively. Rainfall is low and irregularly distributed among and within years (average of 353 mm year−1). The soil was classified as a sandy-loam Calcic Haploxeralf [32]. The Ap horizon (0–15 cm) had a sandy-loam texture (50.7% sand (50–2000 µm), 37.8% silt (2–50 µm) and 11.5% clay (<2 µm)), had an available water content of 105 mm (between −30 and −1500 kPa), it was non-saline (0.12 dS m−1) and had around 4% CaCO3. The field trial was established in 2009 in an area that previously had been subjected to conventional tillage for barley production. The soil was homogeneous and the initial nutrient status (from 2008) is shown in Table 1.
We set up a field experiment where we compared different fertilization types (i.e., organic amendment, ORG vs. mineral fertilizer, MIN) under minimum tillage practices. Organic amendments were applied at the beginning of a five-year rainfed crop rotation whereas MIN treatment consisted of wheat monocropping. Thus, after 10 years we were able to compare two whole rotations in the ORG treatment versus the continuously grown wheat under MIN. The five-year crop rotation in the ORG treatment suffered slight modifications over the years and consisted in: fallow—wheat (Triticum aestivum var. Marius) —vetch (Vicia sativa var. Vereda)—barley (Hordeum vulgare var. Kika or Vinagrosa)—oleaginous crop: sunflower (Helianthus annuus var. Petrus) or camelina (Camelina sativa var. Calena)) (Figure 1). The experimental design consisted of five plots for the ORG treatment (one per each crop of the rotation) and one control plot (MIN); both treatments with four replications, resulting in 24 subplots (6 plots × 4 blocks) of 25 m × 10 m.
For minimum tilled seedbed preparation, a chisel plow (depth, 15 cm) followed by a cultivator plow (depth, 7.5 cm) was used. Two weeks after seedbed preparations, in December, cereals, camelina (2015 to present) and vetch were seeded with a colter direct seeder, whereas sunflower (2009–2015) was seeded in May. In the ORG treatment, manure was applied every February on the fallow subplots with a box-type spreader and slightly incorporated into the soil with a chisel plow (15 cm depth). The manure application consisted of approximately 30 Mg ha−1 of composted horse manure (from February 2009 to 2012) or 10 Mg ha−1 of composted poultry manure (from February 2013) since horse manure was no longer available (Table 2). Manure doses were adjusted on the recommended N application for the area based on crops N needs (around 300 kg N ha−1 for the entire rotation). With the horse manure application, 315 kg N ha−1 were added every five years. With the poultry manure, 328 kg N ha−1, 95 kg P ha−1 and 217 kg K ha−1 were applied every five years. Those amounts were in accordance with the estimated nutrient extractions for the five-year rotation: i.e., around 300 kg N ha−1, 45 kg P ha−1 and 200 kg K ha−1 uptake in the crops aerial biomass (of which around 210 kg N ha−1, 35 kg P ha−1 and 48.1 kg K ha−1 were extracted by the harvested seeds).
In the MIN treatment, annual fertilization was similar to the traditionally applied in the region and consisted of 200 kg ha−1 of an 8/24/8 (N/P/K) compound fertilizer at seeding (December) and 200 kg ha−1 side-dressing fertilization (ammonium nitro-sulfate, 27/0/0) applied every March, i.e., 70 kg N ha−1 year−1, 48 kg P ha−1 year−1 and 16 kg K ha−1 year−1.
Given that there was no application of agro-chemicals to control weeds in the ORG plots, seeding rates were 20% higher than conventional rates in the area to compete more successfully (i.e., 210 kg wheat ha−1, 190 kg barley ha−1, 120 kg vetch ha−1 and 8 kg camelina ha−1 or 60,000 sunflower seeds ha−1). On the contrary, in the MIN treatment, post-emergence herbicides were applied when necessary (Metsulfuron metil (30 g ha−1), cloquintocet-mexyl pinoxaden (850 mL ha−1)). Cereals were harvested in June and grain yield and straw biomass (kg dry matter ha−1) were determined by harvesting two surfaces (0.7 m × 0.7 m) in each subplot. After harvest, all crop residues were chopped and left on the surface. In the ORG treatment, vetch was shredded and incorporated as a green manure every May; and the sunflower or camelina yield was not evaluated due to very low production. As the control consisted of the MIN wheat monocrop, only the corresponding ORG wheat yield and straw were compared.

2.2. Soil Sampling and Analysis

Composite soil samples (three in each subplot to obtain a representative sample) were taken in spring from the 24 plots at three differentiated depths: 0–7.5, 7.5–15 and 15–30 cm with a core probe (50 mm in diameter) to establish initial soil properties (i.e., 2008) and then in 2013, 2015, 2017 and 2019 to study the evolution of those properties regarding the treatments. The soil was air-dried, sieved through a 2-mm mesh and a portion was ground for soil organic carbon (SOC) and soil total nitrogen (SN) analysis. SOC content was analyzed following the wet oxidation method [33] and the SN content using the Kjeldahl method [34]. Soil pH was measured in 1:2.5 (soil: deionized water) extract with a pH meter (Basic 20, Crison Instruments, Barcelona, Spain) [35]. Available P content was extracted with sodium bicarbonate 0.5 M (pH 8.5) and absorbance at 667 nm was measured with a spectrophotometer (Genesys 10S UV-VIS, Thermo Fisher Scientific, MA, USA) after color development with ascorbic acid [36,37]. Exchangeable K content was extracted with (AcONH4) 1N and measured with an inductively coupled plasma atomic emission spectrometer (ICP-OES, Optima 5300 DV, Perkin Elmer, MA, USA) [38,39]. Soil NMIN (N-NO3 and N-NH4) was determined spectrophotometrically in 2M KCl extracts with a flow injection analysis system (FIAstar 5000, Foss Tecator, Hilleroed, Denmark). PMN was estimated following the anaerobic incubation method [40], and total microbial activity was estimated using the fluorescein diacetate (FDA) hydrolysis method [25,41]. In 2017, the available and total contents of heavy metals were determined from soil samples. Available contents of Cu, Cr, Ni, Zn, Pb and Cd were extracted using a solution with DTPA 0.005 M, CaCl2 0.01 M and triethanolamine 0.1 M at pH 7.3 [42], whereas for measuring total heavy metals, the soil was digested in a microwave (ETHOS PLUS, Milestone, Sorisole, Italy) with concentrated nitric acid at 210 °C for 25 min. Both available and total heavy metal contents were measured in an ICP-OES (Optima 5300 DV, Perkin Elmer, Massachusetts, United States). All the analyses were performed in triplicate and the results were expressed based on oven-dry soil (105 °C).
To study the evolution of nutrient status and C and N contents in the ORG versus the MIN treatment, we calculated the accumulated Olsen P-stock, exchangeable K-stock, NMIN-stock, SOC-stock and SN-stock (in either kg ha−1 or Mg ha−1) in the first 30 cm assuming an average bulk density of 1.5 Mg m−3.

2.3. Statistical Analysis

Analysis of variance of wheat grain yield and straw biomass was performed with PROC GLM [43] with management (ORG vs. MIN) considered as a fixed factor, year (from 2010 to 2019) considered as a repeated measurement and four replicates.
Changes in the soil profile pH, nutrient content (i.e., P, K, nitrate, ammonium), SOC and SN and biological properties (i.e., PMN and FDA) were assessed separately for each management treatment using PROC MIXED; under ORG, the crop (fallow, wheat, vetch, barley and oleaginous) and depth (0–7.5, 7.5–15 and 15–30 cm) were considered fixed effects and sampling year (2008, 2013, 2015, 2017 and 2019) a repeated measurement with four random replicates. Similarly, changes in soil nutrient contents under MIN were evaluated with PROC MIXED where the depth was considered fixed effect and year a repeated measurement with four random replicates.
P, K, NMIN, SOC and SN stocks were evaluated with PROC MIXED where year (2008, 2013, 2015, 2017 and 2019) was considered as a repeated measurement, and management (ORG and MIN) and crop were considered fixed effects with four replicates.
Data were log-transformed when necessary to meet assumptions of residual normality and homogeneity of variance. The least-square means with a Tukey adjustment was the post hoc test used to assess differences between means.

3. Results and Discussion

3.1. Rainfall

Accumulated rainfall for the cropping seasons since the field trial began is shown in Table 3. Higher precipitations were recorded during the first two cropping seasons (2009–2010 and 2010–2011) and 2017–2018 compared to the historical mean. The 2011–2012 season was very dry and only 22 mm fell between December and late April. Reduced precipitation was also observed from 2013–2014 to 2016–2017 and 2018–2019. Rainfall during 2012–2013 was close to the historical mean value with a rainy March.

3.2. Wheat Grain Yield and Biomass

Wheat grain and straw biomass production under the differentiated management treatments, ORG and MIN, were both significantly influenced by YEAR (Figure 2). Regardless management system, wheat grain yield was significantly higher in 2011 and 2013 (1868 kg ha−1) probably due to higher accumulated rainfall throughout the cropping season and adequate distribution compared to the average rainfall. On the other hand, we found low grain production between 2014 and 2016, with a mean value of 596 kg ha−1. Extreme drought in 2017, when rainfall was only 79 mm (March–May), led to the lowest grain production during the 10-year study. Grain yield significantly varied between the management systems (Figure 2); regardless of the year, under ORG we obtained a mean yield of 1215 kg grain ha−1 whereas under the MIN plots only 831 kg ha−1 which are in accordance with other studies [44]. Wheat straw biomass production variation within years, although significant, showed a different pattern from that of grain yield. Whereas nearly any climatic conditions during autumn and winter can ensure healthy crop development, spring conditions, e.g., rainfall, usually has a decisive impact on nutrient translocation, grain filling and therefore on the final yield [45]. For instance, straw biomass production in 2018 (one of the years with the highest yield) was similar to biomass developed during 2017 (the lowest yield record). In this case, the rainfall recorded during the October–February period was slightly higher in the 2016–2017 campaign (191 mm) than under the 2017–2018 campaign (135.1 mm). However, when considering rainfall during the spring months, differences between both campaigns arise, e.g., rainfall recorded during the March–May period was 212.6 mm in 2018 but much lower in 2017, which accounted for only 79 mm. This finding demonstrates the importance of spring rainfall for final grain yield production. Lampurlanés et al. [46] obtained similar results in a long-term experiment under rainfed Mediterranean conditions, corroborating that the tillering to anthesis period was critical for grain formation and was the most sensitive to drought events.

3.3. pH and Soil Nutrients: Available P, Available K and Mineral N

The pH under ORG decreased progressively from the beginning of the study in 2008 with a pH of 8.08 to 7.85 in 2013 and 7.33 in 2015. However, from 2015 to 2019, the pH value increased significantly, reaching 8.20, whereas, under MIN, the pH did not vary significantly (mean pH, 8.00). This behavior under ORG can be attributed to the differences in organic amendment applied in this field experiment, which changed from horse manure to poultry litter. The application of composted horse manure during the first years (from 2009 to 2012) may have lowered pH values during the first period due to the production of organic acids released during its decomposition, e.g., oxalic acid, citric acid, acetic acid, succinic acid, etc. [47]. However, after 2013, continuous application of poultry litter may have increased the pH value due to the high Ca content of the poultry diet (Table 2, [48]). This increase of soil pH might have influenced nutrient availability such as P and, to a lesser extent, K [49,50].
We found that the mean Olsen-P content increased from the beginning of the study in 2008 from 7.3 mg P kg−1 to 19.9 mg P kg−1 (mean 2013 and 2015) and to 27.9 mg P kg−1 in 2017. After that, it decreased to 18.7 mg P kg−1 in 2019. Meanwhile, plots under MIN showed a lower and constant available P content (mean, 11.2 mg P kg−1). On the other hand, available mean K values under ORG significantly increased from the initial value of 264.9 mg K kg−1 in 2008 to 494.9 mg K kg−1 (mean of 2013 and 2015). However, starting in 2015 available K decreased with time to 392.5 mg K kg−1 in 2017 and finally to 247.5 mg K kg−1 in 2019. Under MIN available K also decreased slightly with time, from 223.7 in 2008 to 189.4 mg K kg−1 in 2019. Both available P and K correlated negatively with pH values. Therefore, the significantly lower contents of P and K from 2015 under ORG could be attributed to the poultry manure application and its associated pH increase [51]. However, in the case of P content, it should also be remembered that poultry manure contains relatively high concentrations of total and soluble P (2–3% total P of which 60–80% is soluble [52]), and thus some of this dissolved P could also have been lost by leaching [53,54].
Under ORG, nitrate showed the lowest values in 2017 (4.4 mg NO3-N kg−1) and the highest in 2019 (28.7 mg NO3-N kg−1), whereas ammonium behaved in the opposite fashion with the highest values in 2017 (9.4 mg NH4-N kg−1) compared to 2019 (2.6 mg NH4-N kg−1). NMIN content under the MIN treatment varied slightly over the years but within a narrow range, from 5.0 to 14.5 mg NMIN kg−1. Variations in soil environmental conditions (e.g., humidity, water-filled pore space, aerobiosis/anaerobiosis, temperature, etc.) might lay behind the differences found under ORG treatment [19]. Quemada and Gabriel [19] found that N supply from organic amendment mineralization depended greatly on soil water content since microorganisms require water to be active and release the extracellular hydrolytic enzymes responsible for decomposition.
As expected, we found a significant influence of crop rotation on the soil’s nutrient content under ORG. Fallow plots, which had received the manure/poultry application 6 months before, showed the highest contents in available P, K and mineral N, whereas the last crop in the rotation, i.e., the oleaginous crop, showed the lowest values. Many authors have also found that the application of an organic amendment significantly increases the soil’s nutrient content after application [55,56]. In relation to P, soil available P and the total P applied with the manure are usually well correlated; however, when it comes down to N, N released from the manure, i.e., NMIN, is highly dependent on the C:N ratios of the residues incorporated into the soil and not only on the total N applied with the amendment [52,57]. Regardless of the year and depth, the Olsen-P content under fallow plots reached 34.1 mg P kg−1 and decreased under the oleaginous crops (14.3 mg P kg−1). In addition, the available K content was highest under fallow conditions (599.2 mg K kg−1) and decreased rapidly under the other crops in the rotation, where available K was significantly lower (mean, 400.6 mg K kg−1).
Nitrate and ammonium behaved differently: whereas the NH4-N content did not vary significantly with the rotation (only a slight increase under vetch), the nitrate content did. NO3-N was highest under fallow soils (30.2 mg NO3-N kg−1) but it decreased rapidly only 1 year after the OM application and was lowest under the wheat crop (8.5 mg NO3-N kg−1). This decrease in nitrate content could have occurred due to wheat N intake and either due to N immobilization, nitrate loss by lixiviation, or a combination of these processes. In our experiment, N immobilization might have played a role in the nitrate decrease given the high C/N ratios of the crop residues in our experiment (wheat C/N ≈ 80) whereas lixiviation rarely occurs under our rainfed conditions. In addition, nitrate content increased after vetch and the oleaginous crop, probably due to N biological fixation under the leguminous crop and the cereal residue decomposition from the previous year. NMIN varied proportionally with nitrate, whereas the ammonium concentration was constantly lower than the nitrate concentration. This behavior is commonly found under coarse-textured soils under rainfed conditions, where waterlogged conditions rarely appear and nitrification rates are high due to aerobic conditions. Eghball et al. [58] stated that the derived nutrients from poultry litter, particularly N, are usually released slowly because only a fraction of N becomes available in the 1st year of application, thus providing nutrients and maintaining crop production for several years after the application has ceased. In contrast, we found a fast release of mineral N since the application of the amendment, which disappeared after only 1 year; however, mineral N content was assured for the following crops in the rotation, probably due to the slower mineralization processes of the organic amendment applied together with straw biomass decomposition.

3.4. Soil Organic Matter, Biological Parameters and Heavy Metal Content

Under ORG, SOC and SN contents varied similarly and were influenced by year: both of them increased from the beginning of the experiment until 2017 and then decreased in 2019. Regardless of the depth, SOC and SN increased significantly from 7.38 to 8.45 g SOC kg−1 and from 0.72 to 0.88 g SN kg−1 from 2013 to 2017, respectively. Afterward, both SOC and SN decreased, but this decrease was only significant for SN and reached 0.75 g SN kg−1 in 2019. An increase in SOC was also found under the MIN treatment from the beginning of the experiment, from 5.6 to 7.4 g SOC kg−1. The mean soil C/N ratio was 10.1 and did not significantly vary with year or management system. Although the behavior and rate differed regarding fertilization type, adopting minimum tillage practices 10 years after conventional tillage resulted in an increase of SOC and SN (due to reduced tillage intensity and higher crop residues left on the surface). Usually, adopting MT can result in a stratification of the organic matter content and other soil properties, especially in the case where organic amendments are applied [59]. However, we did not find a significant stratification of the organic matter, contrary to what other authors have stated. Krauss et al. [59] found a pronounced stratification of SOC after 15 years of combined applications of organic amendments and minimum tillage on clay loamy soil located in Switzerland. The use of the chisel plow in our field trial was therefore a successful practice to incorporate the organic amendments avoiding the accumulation in the surface layer, which can lead to problems derived from gas emissions from manure (e.g., NO, N2O and CH4 emissions, odor).
Microbial activity-related soil properties, PMN and FDA hydrolysis, varied significantly depending on the year (Figure 3). PMN values under ORG significantly increased from the beginning of the study in 2008 until 2017 and then sharply decreased in 2019. Significant differences between ORG and MIN were found only in 2015 where the PMN value under MIN treatment was the lowest. Despite the lack of FDA data from the beginning of the study, we found that from 2015 to 2019 both FDA and PMN followed a similar trend. Total microbial activity, i.e., FDA, was significantly higher under ORG than MIN in 2015 and 2017 but in 2019, FDA values were similar between treatments. Both soil N from SOM mineralization and fertilizer N inputs constitute the sources of N for crop growth. Thus, building up organic matter and labile N (e.g., PMN) is key for sustainable crop production, as it will become less dependent on mineral fertilizers. We found a significant build-up of potentially mineralizable N under ORG compared to those under MIN during the 1st years of the experiment (2015–2017). However, this PMN was lost from 2017 to 2019 resulting in a significant increase in NMIN content. The decrease in PMN and FDA during the last two years of the experiment occurred in both ORG and MIN treatments, although in the latter to a lesser extent. More favorable climatic conditions (e.g., rainfall) after the extreme drought in 2017 could have enhanced OM mineralization processes resulting two years later in lower PMN and FDA values. Under ORG treatment, the fact that the type of organic amendment was changed from horse manure to poultry litter, i.e., from a higher to a lower C:N ratio, could have resulted in a priming effect resulting in even lower PMN and FDA values than under MIN treatment. Our results from the 1st year of the experiment are in agreement with Sánchez-Monedero et al. [60] who found a significant increase in FDA after the organic amendment of a semiarid soil, especially when the applied amendment presented a low degree of stabilization (i.e., a high C:N ratio). Microbial communities’ alterations due to changes in fertilization may lay behind this effect, affecting organic matter decomposition. For instance, Feng et al. [61] found an increase in Bacillus asahii that promoted manure biodegradation under Fluvisols, and other authors such as [62,63] found that incorporating straw into the soil altered the communities of fungi and bacteria, influencing SOC decomposition.
The total heavy metal content analyzed in 2017 (Table 4) did not exceed the generic reference values (NGR) established for Madrid (2006 CAM ORDEN 2770/2006). Moreover, the values measured were, in general, very low and below the toxic levels of plants [64]. Regarding DTPA-extractable heavy metals, the values were very low, probably due to the high pH and the CaCO3 content of the soil of our experiment [65]. We found that under the wheat crop, Zn was significantly higher than under the last two crops in the rotation, i.e., barley and the oleaginous crop. Thus, the recent application of the poultry litter (in 2016) increased the Zn concentration as other authors have also found [66]. Then, the successive crops took Zn, as is an essential microelement for plants.

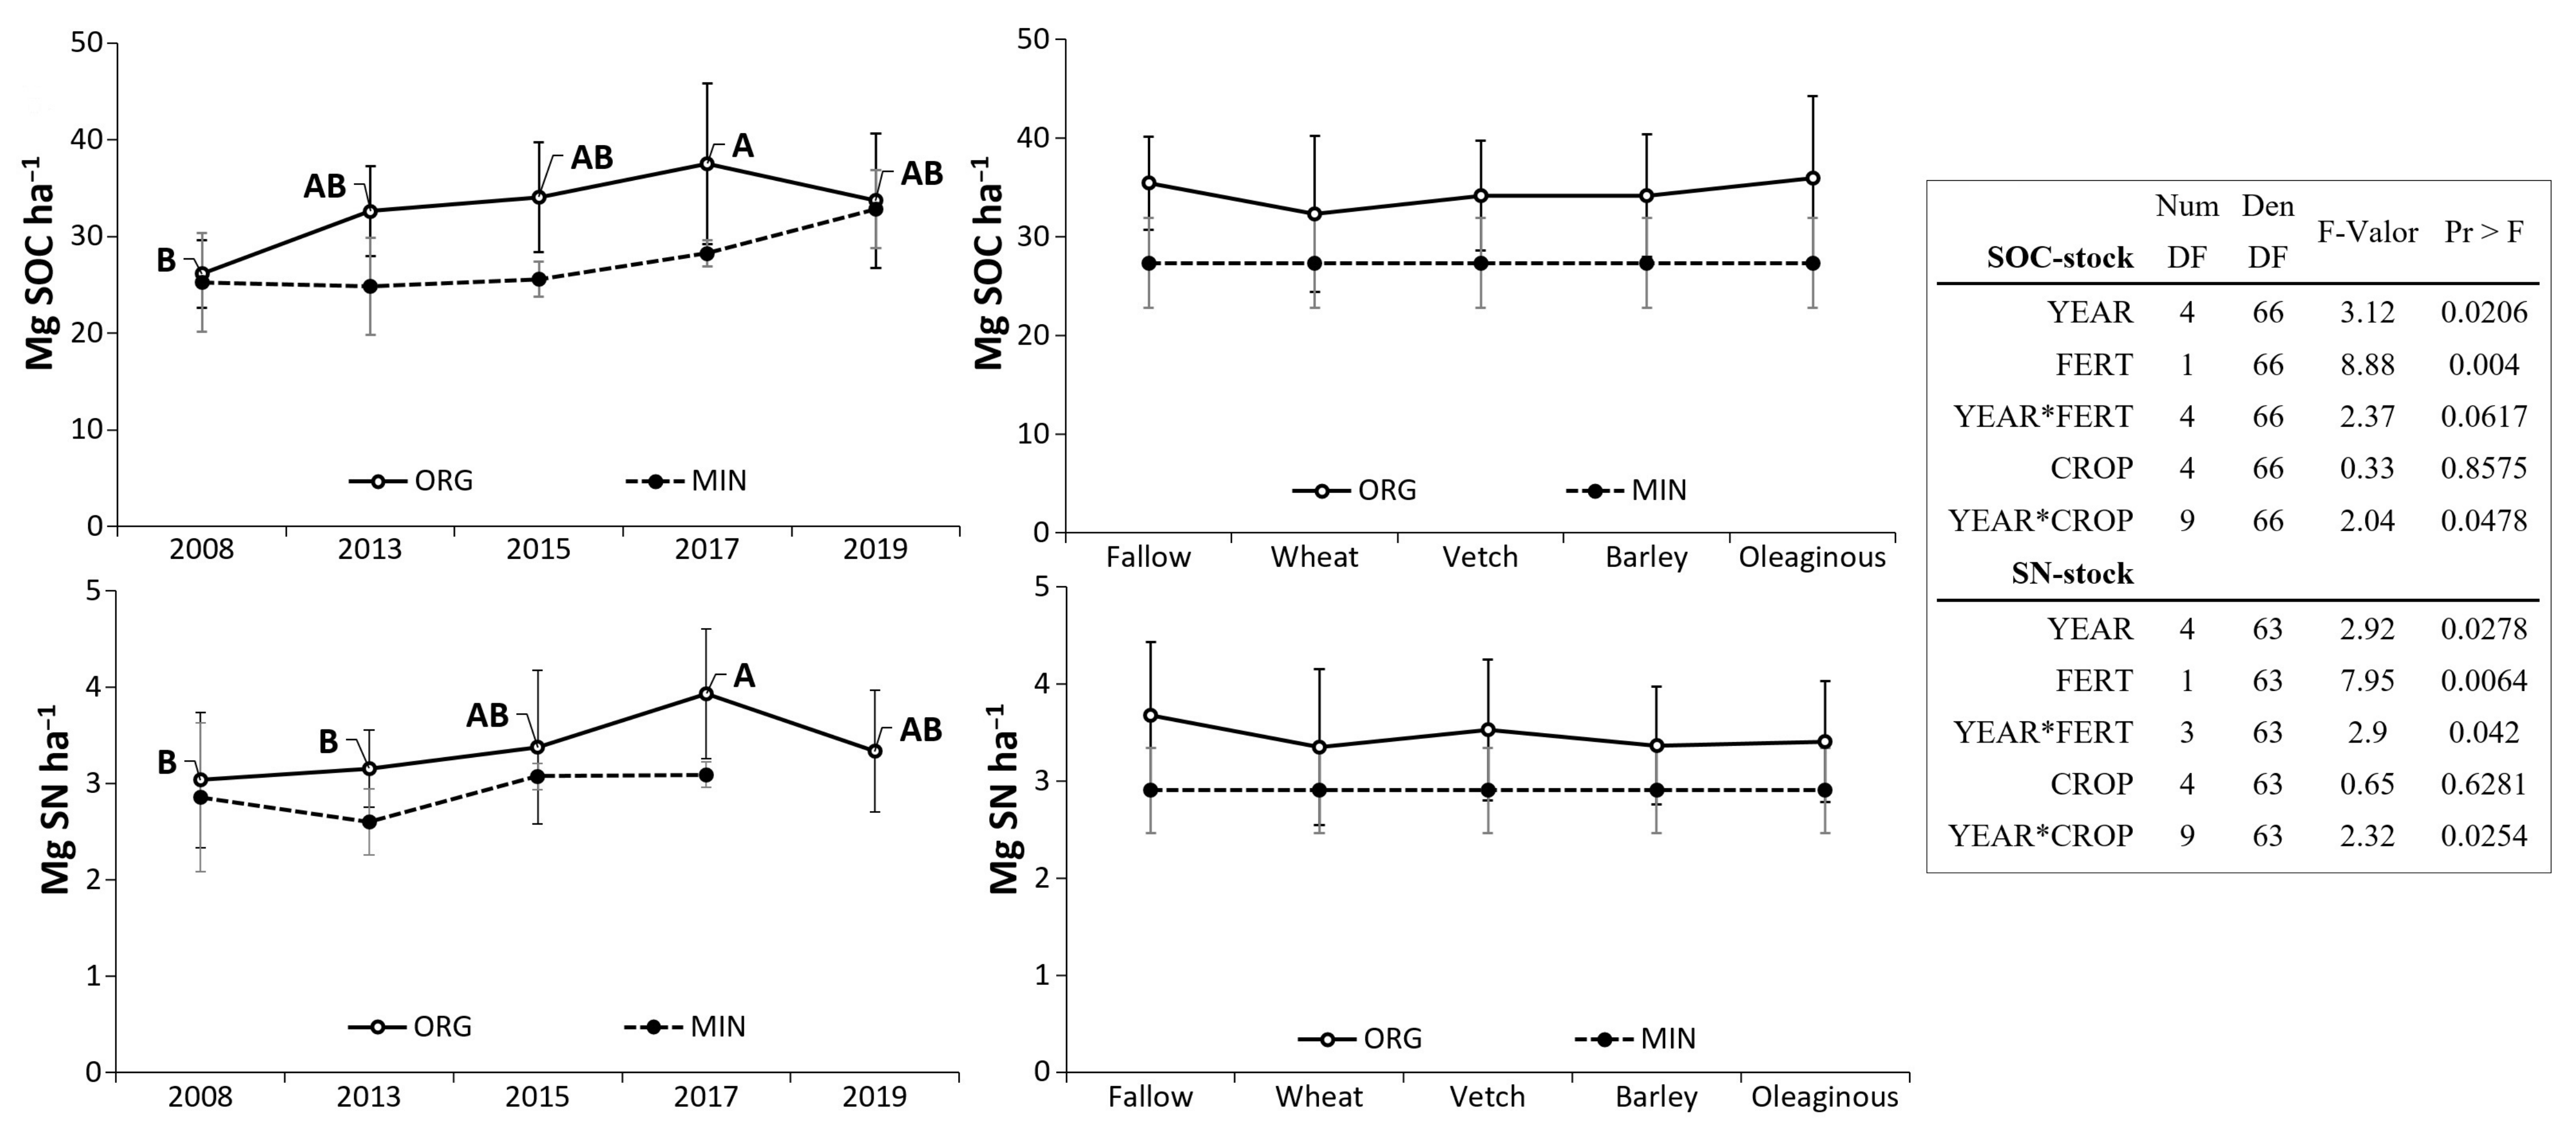
3.5. Nutrients and Organic Matter Stocks

Differences in P, K and NMIN stocks after 10 years of manure application were noticeable in that they varied greatly from the beginning to the end of the experiment (Figure 4). Mean accumulated stocks of P and K under ORG were 66% and 43% higher than the initial content in 2008, respectively, whereas under MIN no significant increase was found (Figure 4). The P stock was significantly higher under ORG in 2013 and 2017 compared to the initial P stock, whereas the K stock was higher during 2013 and 2015 than the initial K stock. Under ORG, the P stock was significantly higher in 2017 than in the other years, reaching 121.2 kg P ha−1 accumulated in the first 30 cm. On the other hand, the K stock increased slightly from 2013 to 2015, and then it decreased significantly with time: from 2261 kg K ha−1 in 2015 to 1722 in 2017 to 1100 kg K ha−1 at the end of the study. The accumulated NMIN stock showed the opposite trend from the K stock, and it was significantly higher in 2019 (140.2 kg NMIN ha−1) than in the other years (mean, 78.4 kg NMIN ha−1). The application of organic amendments resulted in a significant increase in available soil nutrient content in the soil (i.e., P, K and NMIN) compared to the initial values thus, providing nutrients for the crops as other authors have previously stated [15]. Nevertheless changing in the organic amendment applied in this field experiment (from horse manure to poultry) might have significantly influenced some nutrients availability [51]. Organic amendments mineralization and nutrient release might also be influenced by climatic conditions such as humidity and temperature [19].
The accumulated stock of available P was significantly higher under fallow conditions than under the last two crops of the rotation: barley and the oleaginous crop. As we expected, P stock variation followed the order of the rotation after the application of the organic amendment in fallow soil (Figure 4); these differences occurred mainly in the 2015 and 2017 sampling years. Under the wheat crop, we found that the P stock significantly varied with the sampling date, with a greater P stock in 2017 (195.9 kg P ha−1) compared to 2013 and 2019 (mean, 60.9 kg P ha−1). Regardless of the sampling year, the K and NMIN stocks were significantly higher under fallow (2600 kg K ha−1 and 151 kg NMIN ha−1) than under the other crops in the rotation (mean value, 1780 kg K ha−1 and 72.6 kg NMIN ha−1). Moreover, these differences among crops were more noticeable for NMIN stocks in 2015, where NMIN decreased rapidly from 272.7 kg NMIN ha−1 in fallow conditions to 26.1 kg NMIN ha−1 after only 1 year, in wheat. The variability in the NMIN stock was high and only under wheat and the oleaginous crops, the NMIN stock did not vary over the sampling dates. These results are in agreement with [67]. OM fertilization based on crop N requirements often results in an excessive application of P [68]. The N:P ratio from the poultry manure we applied was around 3.4, higher than the common ratios found in the literature which usually ranges from 0.6 to 1 [69]. However, this N:P ratio is still lower than the ratio that plants require (e.g., the N:P ratio for wheat is 4.3–6.8, [70]). When adjusting the crop fertilization needs based on N, a surplus of P is left in the soil [71], which constitutes a potential source of diffuse pollution and environmental risk.
Regardless of the management, the mean value of SOC stock increased around 30% with respect to the beginning of the experiment in 2008 (26.5 Mg SOC ha−1). The same occurred in the accumulated SN stock: it increased from 3.14 Mg SN ha−1 in 2008 to a mean value of 3.47 Mg SN ha−1. We did not find significant differences between ORG and MIN treatments, although the application of an organic amendment slightly increased SOC and SN stocks between 2013 and 2017 compared to the MIN treatment (Figure 5). However, the continuous application of the organic amendment did not correlate with the variations in SOM probably due to the limited carbon sequestration capacity of the soil of the trial.
On the other hand, we expected higher SOC and SN stocks in the plots after OM application, i.e., the fallow subplots, and then a gradual decrease in organic matter content throughout the rotation period, reaching the lowest values in the last crop of the rotation, i.e., an oleaginous crop. However, neither SOC nor SN varied significantly among crops. This lack of differences in SOM content throughout the rotation might have stemmed from the incorporation of the crop residues after harvest (both shoots + roots). In the present study, C input into the soil through crop residues is comparable to that added with the organic amendment (around 3.8 Mg C ha−1) since the root biomass contribution to soil C pools can be larger than that of the above-ground biomass [72]. The C:N ratios of organic amendments and crop residues might differ, whereas the first are usually highly mineralizable due to their low C:N ratio, crop residues present a higher C:N ratio, thus more recalcitrant. The combined effect of both different organic matter inputs with different mineralization rates might have maintained both SOC and SN contents at similar levels during the complete study period.

4. Conclusions

We found that the different management practices, i.e., ORG versus MIN exerted a significant influence on yields, although the differences between them were mainly driven by climatic conditions such as rainfall, mainly that falling in spring. The application of an organic amendment every 5 years provided successful levels of nutrients for crop development for the whole rotation, whereas under MIN, continuous annual application of mineral fertilizers was needed to achieve even lower yields. The selection of the organic amendment to apply in a given agro-ecosystem should be carefully evaluated. Although the application of the horse manure amendment resulted in a beneficial decrease in pH values in this study, the change to poultry litter resulted in an increase in pH values, which is particularly relevant in calcareous soils. These changes in pH might have influenced the availability of crop nutrients, especially P. Contrary to what we expected, we did not find any stratification of SOM or nutrient contents after changing from conventionally tilled to conservation practices. The adoption of minimum tillage after conventional tillage practices led to a slight increase in SOM content since the beginning of the study in 2008 regardless of the type of fertilization. This lack of significant increase in SOM accumulation was probably attributable to the low carbon protective capacity of the coarse-textured soil of the trial that limited C sequestration potential. More research is needed to fully comprehend the processes beyond these results and metagenomic studies would be helpful to assess the changes in the microbial community under different management practices, especially with the addition of organic amendments. We encourage the implementation of conservation practices (e.g., rotation and minimum tillage) in combination with organic amendments because they resulted in higher yields than those achieved with mineral fertilizer application; they do not rely on mineral fertilizers and nutrients from organic wastes are recycled, resulting in promising sustainable management practice.

Author Contributions

Conceptualization, J.L.T. and D.M.-L.; methodology, D.M.-L. and E.Z.; software, D.M.-L.; validation, D.M.-L. and J.L.G.; formal analysis, D.M.-L.; resources, J.L.T., I.S.-M. and J.L.G.; data curation, D.M.-L. and J.L.G.; writing—original draft preparation, D.M.-L.; writing—review and editing, J.L.G. and E.Z.; supervision, J.L.T., I.S.-M. and J.L.G.; project administration, J.L.T. and I.S.-M.; funding acquisition, J.L.T., I.S.-M. and J.L.G. All authors have read and agreed to the published version of the manuscript.

Funding

This work was funded by INIA (AT2017-003), the Ministry of Science and Innovation (RTA2017-00006-C03-01, AGL2017-83283-C2-1/2-R), the EJPSoil [CarboSeq] project (which has received funding from the European Union’s Horizon 2020 research and innovation programme under grant agreement No 862695), the Community of Madrid (AGRISOST-CM S2018/BAA-4330) and European Structural funding 2014-2020 (ERDF y ESF).

Institutional Review Board Statement

It does not apply.

Informed Consent Statement

It does not apply.

Data Availability Statement

It does not apply.

Acknowledgments

The authors want to thank the work performed by La Canaleja field staff (David Sanmartín and José Silveria) and the laboratory staff (Mar Albarrán and Gabriel Antón).

Conflicts of Interest

The authors declare no conflict of interest and the funders had no role in the design of the study; in the collection, analyses, or interpretation of data; in the writing of the manuscript, or in the decision to publish the results.

References

  1. Nissen, T.M.; Wander, M.M. Management and soil-quality effects on fertilizer-use efficiency and leaching. Soil Sci. Soc. Am. J. 2003, 67, 1524–1532. [Google Scholar] [CrossRef] [Green Version]
  2. Lal, R. Soils and sustainable agriculture. A review. Agron. Sust. Develop. 2008, 28, 57–64. [Google Scholar] [CrossRef]
  3. Franzluebbers, A.J. Achieving Soil Organic Carbon Sequestration with Conservation Agricultural Systems in the Southeastern United States. Soil Sci. Soc. Am. J. 2010, 74, 347–357. [Google Scholar] [CrossRef] [Green Version]
  4. Madejón, E.; Murillo, J.M.; Moreno, F.; Lopez, M.V.; Arrúe, J.L.; Alvaro-Fuentes, J.; Cantero, C. Effect of long-term conservation tillage on soil biochemical properties in Mediterranean Spanish areas. Soil Till. Res. 2009, 105, 55–62. [Google Scholar] [CrossRef] [Green Version]
  5. Rodríguez-Martín, J.A.; Alvaro-Fuentes, J.; Gonzalo, J.; Gil, C.; Ramos-Miras, J.J.; Grau-Corbí, J.M.; Boluda, R. Assessment of the soil organic carbon stock in Spain. Geoderma 2016, 264, 117–125. [Google Scholar] [CrossRef] [Green Version]
  6. Gervois, S.; Ciais, P.; de Noblet-Ducoudré, N.; Brisson, N.; Vuichard, N.; Viovy, N. Carbon and water balance of European croplands throughout the 20th century. Global Biogeochem. Cycles 2008, 22. [Google Scholar] [CrossRef] [Green Version]
  7. Blanco-Canqui, H.; Lal, R. Mechanisms of carbon sequestration in soil aggregates. Crit. Rev. Plant Sci. 2004, 23, 481–504. [Google Scholar] [CrossRef]
  8. Elliot, E.T. Aggregate structure and carbon, nitrogen and phosphorus in native and cultivated soils. Soil Sci. Soc. Am. J. 1986, 50, 627–633. [Google Scholar] [CrossRef]
  9. Fernández-Ugalde, O.; Virto, I.; Bescansa, P.; Imaz, M.J.; Enrique, A.; Karlen, D.L. No-tillage improvement of soil physical quality in calcareous, degradation-prone, semiarid soils. Soil Till. Res. 2009, 106, 29–35. [Google Scholar] [CrossRef]
  10. Saygin, S.D.; Erpul, G.; Basaran, M. Comparison of aggregate stability measurement methods for clay-rich soils in Asartepe catchment of Turkey. Land Degrad. Dev. 2017, 28, 199–206. [Google Scholar] [CrossRef]
  11. Lin, Y.; Ye, G.; Kuzyakov, Y.; Liu, D.; Fan, J.; Ding, W. Long-term manure application increases soil organic matter and aggregation, and alters microbial community structure and keystone taxa. Soil Biol. Biochem. 2019, 134, 187–196. [Google Scholar] [CrossRef]
  12. Maillard, É.; Angers, D.A. Animal manure application and soil organic carbon stocks: A meta-analysis. Glob. Chang. Biol. 2014, 20, 666–679. [Google Scholar] [CrossRef] [PubMed]
  13. Liang, J.; Zhou, Z.; Huo, C.; Shi, Z.; Cole, J.R.; Huang, L.; Konstantinidis, K.T.; Li, X.; Liu, B.; Luo, Z.; et al. More replenishment than priming loss of soil organic carbon with additional carbon input. Nat. Commun. 2018, 9, 3175. [Google Scholar] [CrossRef] [PubMed] [Green Version]
  14. Adeli, A.; Shankle, M.W.; Tewolde, H.; Sistani, K.R.; Rowe, D.E. Nutrient dynamics from broiler litter applied to no-till cotton in an upland soil. Agron. J. 2008, 100, 564–570. [Google Scholar] [CrossRef] [Green Version]
  15. Diacono, M.; Montemurro, F. Long-term effects of organic amendments on soil fertility. A review. Agron. Sust. Develop. 2010, 30, 401–422. [Google Scholar] [CrossRef] [Green Version]
  16. Hijbeek, R.; van Ittersum, M.K.; ten Berge, H.F.; Gort, G.; Spiegel, H.; Whitmore, A.P. Do organic inputs matter–a meta-analysis of additional yield effects for arable crops in Europe? Plant Soil 2017, 411, 293–303. [Google Scholar] [CrossRef] [Green Version]
  17. Nyakatawa, E.Z.; Reddy, K.C.; Sistani, K.R. Tillage, cover cropping, and poultry litter effects on selected soil chemical properties. Soil Till. Res. 2001, 58, 69–79. [Google Scholar] [CrossRef]
  18. Cabrera, V.E.; Stavast, L.J.; Baker, T.T.; Wood, M.K.; Cram, D.S.; Flynn, R.P.; Ulery, A.L. Soil and runoff response to dairy manure application on New Mexico rangeland. Agric. Ecosyst. Environ. 2009, 131, 255–262. [Google Scholar] [CrossRef]
  19. Quemada, M.; Gabriel, J.L. Approaches for increasing nitrogen and water use efficiency simultaneously. Glob. Food Sec. 2016, 9, 29–35. [Google Scholar] [CrossRef] [Green Version]
  20. Rodríguez-Martín, J.A.; López-Arias, M.; Grau-Corbí, J.M. Heavy metals contents in agricultural topsoils in the Ebro basin (Spain). Application of the multivariate geoestatistical methods to study spatial variations. Environ. Pollut. 2006, 144, 1001–1012. [Google Scholar] [CrossRef] [PubMed]
  21. Quemada, M.; Lassaletta, L.; Leip, A.; Jones, A.; Lugato, E. Integrated management for sustainable cropping systems: Looking beyond the greenhouse balance at the field scale. Glob. Chang. Biol. 2020, 26, 2584–2598. [Google Scholar] [CrossRef]
  22. Sharpley, A.N.; Chapra, S.C.; Wedepohl, R.; Sims, J.T.; Daniel, T.C.; Reddy, K.R. Managing Agricultural Phosphorus for Protection of Surface Waters: Issues and Options. J. Environ. Qual. 1994, 23, 437–451. [Google Scholar] [CrossRef]
  23. Li, Z.; Peng, S.L.; Rae, D.J.; Zhou, G. Litter decomposition and nitrogen mineralization of soils in subtropical plantation forests of southern China, with special attention to comparison between legumes and non-legumes. Plant Soil 2001, 229, 105–116. [Google Scholar] [CrossRef]
  24. Bongiorno, G.; Bünemann, E.K.; Oguejiofor, C.U.; Meier, J.; Gort, G.; Comans, R.; Mäder, P.; Brussaard, L.; de Goede, R. Sensitivity of labile carbon fractions to tillage and organic matter management and their potential as comprehensive soil quality indicators across pedoclimatic conditions in Europe. Ecol. Indic. 2019, 99, 38–50. [Google Scholar] [CrossRef]
  25. Adam, G.; Duncan, H. Development of a sensitive and rapid method for the measurement of total microbial activity using fluorescein diacetate (FDA) in a range of soils. Soil Biol. Biochem. 2001, 33, 943–951. [Google Scholar] [CrossRef] [Green Version]
  26. Hejna, M.; Moscatelli, A.; Onelli, E.; Baldi, A.; Pilu, S.; Rossi, L. Evaluation of concentration of heavy metals in animal rearing system. Ital. J. Anim. Sci. 2019, 18, 1372–1384. [Google Scholar] [CrossRef] [Green Version]
  27. Toor, G.S.; Haggard, B.E.; Donoghue, A.M. Water Extractable Trace Elements in Poultry Litters and Granulated Products. J. Appl. Poult Res. 2007, 16, 351–360. [Google Scholar] [CrossRef]
  28. Khan, A.; Khan, S.; Khan, M.A.; Qamar, Z.; Waqas, M. The uptake and bioaccumulation of heavy metals by food plants, their effects on plants nutrients, and associated health risk: A review. Environ. Sci. Pollut. Res. 2015, 22, 13772–13799. [Google Scholar] [CrossRef]
  29. Chivenge, P.P.; Murwira, H.K.; Giller, K.E.; Mapfumo, P.; Six, J. Long-term impact of reduced tillage and residue management on soil carbon stabilization: Implications for conservation agriculture on contrasting soils. Soil Till. Res. 2007, 94, 328–337. [Google Scholar] [CrossRef]
  30. Govaerts, B.; Verhulst, N.; Castellanos-Navarrete, A.; Sayre, K.D.; Dixon, J.; Dendooven, L. Conservation agriculture and soil carbon sequestration: Between myth and farmer reality. Crit. Rev. Plant Sci. 2009, 28, 97–122. [Google Scholar] [CrossRef]
  31. Peel, M.C.; Finlayson, B.L.; McMahon, T.A. Updated world map of the Köppen-Geiger climate classification. Hydrol. Earth Syst. Sci. 2007, 11, 1633–1644. [Google Scholar] [CrossRef] [Green Version]
  32. Soil Survey Staff. Keys to Soil Taxonomy; USDA-Natural Resources Conservation Service: Washington, DC, USA, 2014; p. 372. [Google Scholar]
  33. Nelson, D.W.; Sommers, L.E. Total carbon, organic carbon, and organic matter. In Methods of Soil Analysis. Part 3. Chemical Methods; Sparks, D.L., Page, A.L., Helmke, P.A., Loeppert, R.H., Soltanpour, P.N., Tabatabai, M.A., Johnston, C.T., Sumner, M.E., Eds.; American Society of Agronomy-Soil Science Society of America: Madison, WI, USA, 1996; pp. 961–1010. [Google Scholar]
  34. Bremner, J.M. Nitrogen-Total. In Methods of Soil Analysis. Part 3. Chemical Methods; Sparks, D.L., Page, A.L., Helmke, P.A., Loeppert, R.H., Soltanpour, P.N., Tabatabai, M.A., Johnston, C.T., Sumner, M.E., Eds.; American Society of Agronomy-Soil Science Society of America: Madison, WI, USA, 1996; pp. 1085–1121. [Google Scholar]
  35. Thomas, G.W. Soil pH and soil acidity. In Methods of Soil Analysis. Part 3. Chemical Methods; Sparks, D.L., Page, A.L., Helmke, P.A., Loeppert, R.H., Soltanpour, P.N., Tabatabai, M.A., Johnston, C.T., Sumner, M.E., Eds.; American Society of Agronomy-Soil Science Society of America: Madison, WI, USA, 1996; pp. 475–490. [Google Scholar]
  36. Kuo, S. Phosphorus. In Methods of Soil Analysis. Part 3. Chemical Methods; Sparks, D.L., Page, A.L., Helmke, P.A., Loeppert, R.H., Soltanpour, P.N., Tabatabai, M.A., Johnston, C.T., Sumner, M.E., Eds.; American Society of Agronomy-Soil Science Society of America: Madison, WI, USA, 1996; pp. 869–919. [Google Scholar]
  37. Watanabe, F.S.; Olsen, S.R. Test of an ascorbic acid method for determining phosphorous in water and NaHCO3 extracts from soil. Soil Sci. Soc. Am. J. 1965, 29, 677–678. [Google Scholar] [CrossRef]
  38. Helmke, P.A.; Sparks, D.L. Lithium, Sodium, Potassium, Rubidium, and Cesium. In Methods of Soil Analysis. Part 3. Chemical Methods; Sparks, D.L., Page, A.L., Helmke, P.A., Loeppert, R.H., Soltanpour, P.N., Tabatabai, M.A., Johnston, C.T., Sumner, M.E., Eds.; American Society of Agronomy-Soil Science Society of America: Madison, WI, USA, 1996; pp. 551–574. [Google Scholar]
  39. Soltanpour, P.N.; Johnson, G.W.; Workman, S.M.; Benton Jones, J.; Miller, R.O. Inductively Coupled Plasma emission spectrometry and Inductively Coupled Plasma-Mass spectrometry. In Methods of Soil Analysis. Part 3. Chemical Methods; Sparks, D.L., Page, A.L., Helmke, P.A., Loeppert, R.H., Soltanpour, P.N., Tabatabai, M.A., Johnston, C.T., Sumner, M.E., Eds.; American Society of Agronomy-Soil Science Society of America: Madison, WI, USA, 1996; pp. 91–139. [Google Scholar]
  40. Waring, S.A.; Bremner, J.M. Ammonium production in soil under waterlogged conditions as an index of nitrogen availability. Nature 1964, 201, 951–952. [Google Scholar] [CrossRef]
  41. Green, V.S.; Stott, D.E.; Diack, M. Assay for fluorescein diacetate hydrolytic activity: Optimization for soil samples. Soil Biol. Biochem. 2006, 38, 693–701. [Google Scholar] [CrossRef]
  42. Lindsay, W.; Norvell, W. Development of a DTPA soil test for Zinc, Iron, Manganese and Copper. Soil Sci. Soc. Am. J. 1978, 42, 421–428. [Google Scholar] [CrossRef]
  43. SAS Institute Inc. SAS/ACCESS® 9.4 Interface to ADABAS: Reference; SAS Institute Inc.: Cary, NC, USA, 2013. [Google Scholar]
  44. Koutroubas, S.D.; Antoniadis, V.; Damalas, C.A.; Fotiadis, S. Effect of Organic Manure on Wheat Grain Yield, Nutrient Accumulation, and Translocation. Agron. J. 2016, 108, 615–625. [Google Scholar] [CrossRef]
  45. Soon, Y.K.; Malhi, S.S.; Wang, Z.H.; Brandt, S.; Schoenau, J.J. Effect of seasonal rainfall, N fertilizer and tillage on N utilization by dryland wheat in a semi-arid environment. Nutr. Cycl. Agroecosyst. 2008, 82, 149–160. [Google Scholar] [CrossRef]
  46. Lampurlanés, J.; Plaza-Bonilla, D.; Alvaro-Fuentes, J.; Cantero-Martinez, C. Long-term analysis of soil water conservation and crop yield under different tillage systems in Mediterranean rainfed conditions. Field Crop Res. 2016, 189, 59–67. [Google Scholar] [CrossRef] [Green Version]
  47. Simandi, P.; Takayanagi, M.; Inubushi, K. Changes in the pH of Two Different Composts Are Dependent on the Production of Organic Acids. Soil Sci. Plant Nut. 2005, 51, 771–774. [Google Scholar] [CrossRef]
  48. Hue, N.V. Correcting soil acidity of a highly weathered Ultisol with chicken manure and sewage sludge. Commun. Soil Sci. Plant Anal. 1992, 23, 241–264. [Google Scholar] [CrossRef]
  49. Huang, P.M. Chemistry of Potassium in Soils. In Chemical Processes in Soils; Tabatabai, M., Sparks, D., Eds.; Wiley: Hoboken, NJ, USA, 2005; pp. 227–292. [Google Scholar]
  50. Sims, J.; Pierzynski, G.M. Chemistry of Phosphorus in Soils. In Chemical Processes in Soils; Tabatabai, M., Sparks, D., Eds.; Wiley: Hoboken, NJ, USA, 2005; pp. 151–192. [Google Scholar]
  51. Hinsinger, P. Bioavailability of soil inorganic P in the rhizosphere as affected by root-induced chemical changes: A review. Plant Soil 2001, 237, 173–195. [Google Scholar] [CrossRef]
  52. Cooperband, L.; Bollero, G.; Coale, F. Effect of poultry litter and composts on soil nitrogen and phosphorus availability and corn production. Nutr. Cycling Agroecosyst. 2002, 62, 185–194. [Google Scholar] [CrossRef]
  53. von Wandruszka, R. Phosphorus retention in calcareous soils and the effect of organic matter on its mobility. Geochem. Trans. 2006, 7, 6. [Google Scholar] [CrossRef] [PubMed] [Green Version]
  54. Tomer, M.D.; Wilson, C.G.; Moorman, T.B.; Cole, K.J.; Heer, D.; Isenhart, T.M. Source-Pathway Separation of Multiple Contaminants during a Rainfall-Runoff Event in an Artificially Drained Agricultural Watershed. J. Environ. Qual. 2010, 39, 882–895. [Google Scholar] [CrossRef] [Green Version]
  55. Gascho, G.J.; Hubbard, R.K. Long-term impact of broiler litter on chemical properties of a Coastal Plain soil. J. Soil Water Conserv. 2006, 61, 65–74. [Google Scholar]
  56. Harmel, R.D.; Harmel, B.; Patterson, M.C. On-Farm Agro-Economic Effects of Fertilizing Cropland with Poultry Litter. J. Appl. Poult. Res. 2008, 17, 545–555. [Google Scholar] [CrossRef]
  57. Eghball, B.; Power, J.F. Phosphorus- and Nitrogen-Based Manure and Compost Applications Corn Production and Soil Phosphorus. Soil Sci. Soc. Am. J. 1999, 63, 895–901. [Google Scholar] [CrossRef] [Green Version]
  58. Eghball, B.; Ginting, D.; Gilley, J.E. Residual effects of manure and compost applications on corn production and soil properties. Agron. J. 2004, 96, 442–447. [Google Scholar] [CrossRef] [Green Version]
  59. Krauss, M.; Berner, A.; Perrochet, F.; Frei, R.; Niggli, U.; Mäder, P. Enhanced soil quality with reduced tillage and solid manures in organic farming—A synthesis of 15 years. Sci. Rep. 2020, 10, 4403. [Google Scholar] [CrossRef] [PubMed] [Green Version]
  60. Sánchez-Monedero, M.A.; Mondini, C.; Cayuela, M.L.; Roig, A.; Contin, M.; De Nobili, M. Fluorescein diacetate hydrolysis, respiration and microbial biomass in freshly amended soils. Biol. Fertil. Soils 2008, 44, 885–890. [Google Scholar] [CrossRef]
  61. Feng, Y.; Chen, R.; Hu, J.; Zhao, F.; Wang, J.; Chu, H.; Zhang, J.; Dolfing, J.; Lin, X. Bacillus asahii comes to the fore in organic manure fertilized alkaline soils. Soil Biol. Biochem. 2015, 81, 186–194. [Google Scholar] [CrossRef] [Green Version]
  62. Chen, Z.; Wang, H.; Liu, X.; Zhao, X.; Lu, D.; Zhou, J.; Li, C. Changes in soil microbial community and organic carbon fractions under short-term straw return in a rice–wheat cropping system. Soil Till. Res. 2017, 165, 121–127. [Google Scholar] [CrossRef]
  63. Zheng, W.; Zhao, Z.; Gong, O.; Zhai, B.; Li, Z. Responses of fungal–bacterial community and network to organic inputs vary among different spatial habitats in soil. Soil Biol. Biochem. 2018, 125, 54–63. [Google Scholar] [CrossRef]
  64. Madejón, P.; Murillo, J.M.; Marañón, T.; Cabrera, F.; Soriano, M.A. Trace element and nutrient accumulation in sunflower plants two years after the Aznalcóllar mine spill. Sci. Total Environ. 2003, 307, 239–257. [Google Scholar] [CrossRef]
  65. Walter, I.; Martínez, F.; Cuevas, G. Biosolid amendment of a calcareous, degraded soil in a semiarid environment. Span. J. Agric. Res. 2006, 4, 47–54. [Google Scholar] [CrossRef] [Green Version]
  66. Schomberg, H.H.; Endale, D.M.; Jenkins, M.B.; Sharpe, R.R.; Fisher, D.S.; Cabrera, M.L.; McCracken, D.V. Soil Test Nutrient Changes Induced by Poultry Litter under Conventional Tillage and No-Tillage. Soil Sci. Soc. Am. J. 2009, 73, 154–163. [Google Scholar] [CrossRef]
  67. Hoover, N.L.; Law, J.Y.; Long, L.A.M.; Kanwar, R.S.; Soupir, M.L. Long-term impact of poultry manure on crop yield, soil and water quality, and crop revenue. J. Environ. Manag. 2019, 252, 109582. [Google Scholar] [CrossRef] [PubMed]
  68. DeLaune, P.B.; Moore, P.A., Jr.; Lemunyon, J.L. Effect of Chemical and Microbial Amendment on Phosphorus Runoff from Composted Poultry Litter. J. Environ. Qual. 2006, 35, 1291–1296. [Google Scholar] [CrossRef]
  69. Evanylo, G.K.; Mullins, G.L. Utilization of Organic Waste as Nutrient Sources and Soil Amendments. In Agronomy Handbook Publ. 424–100; Virginia Coop Ext.: Blacksburg, VA, USA, 2000; pp. 99–109. [Google Scholar]
  70. Kelley, K.W.; Sweeney, D.W. Placement of Preplant Liquid Nitrogen and Phosphorus Fertilizer and Nitrogen Rate Affects No-Till Wheat Following Different Summer Crops. Agron. J. 2007, 99, 1009–1017. [Google Scholar] [CrossRef]
  71. Sims, J.T.; Edwards, A.C.; Schoumans, O.F.; Simard, R.R. Integrating Soil Phosphorus Testing into Environmentally Based Agricultural Management Practices. J. Environ. Qual. 2000, 29, 60–71. [Google Scholar] [CrossRef]
  72. Rasse, D.P.; Rumpel, C.; Dignac, M.-F. Is soil carbon mostly root carbon? Mechanisms for a specific stabilisation. Plant Soil 2005, 269, 341–356. [Google Scholar] [CrossRef]
Figure 1. Schematic agronomic calendar, manure application, seeding and harvesting of the crops in the rotation of the ORG treatment.
Agriculture 11 00700 g001
Figure 2. Wheat grain yield and straw biomass production (kg dry matter ha−1) under the differentiated management practices (ORG vs. MIN) since the beginning of the experimental trial. Bars indicate the standard deviation of the data. Means followed by uppercase different letters are significantly different among years and those followed by lowercase letters are different between ORG and MIN treatments for the same year for either yield or straw biomass (p < 0.1). Type III analysis of variance (PROC GLM) for evaluating YEAR and fertilization (FERT) influences on wheat yield and biomass. “DF” is the degrees of freedom.
Agriculture 11 00700 g002
Figure 3. PMN (as mg N-NH4 kg−1 7d−1) and FDA hydrolysis (as mg fluorescein kg−1 3h−1) under ORG and MIN for the different years. Bars indicate the standard deviation of the data. Uppercase letters indicate that means are significantly different among years and lowercase letters indicate that means are different between management practices (p < 0.05).
Agriculture 11 00700 g003
Figure 4. Influence of Year and Crop on the stocks of P, K and NMIN (NO3-N + NH4-N) under ORG compared to the MIN treatment. Bars indicate the standard deviation of the data. Uppercase letters indicate that means are significantly different among years and lowercase letters indicate that means are different between fertilization (p < 0.05). Analysis of variance (PROC MIXED) for evaluating YEAR, fertilization (FERT) and CROP influences on soil nutrient stocks. P, K and NMIN stocks were log-transformed to meet the assumptions of residual normality and homogeneity of variance. The interaction FERT*CROP lacked of Degrees of Freedom for the analysis.
Agriculture 11 00700 g004
Figure 5. Influence of Year and Crop on the stocks of SOC and SN under ORG compared to the MIN treatment. Bars indicate the standard deviation of the data. Uppercase letters indicate that means are significantly different among years and lowercase letters indicate that means are different between management practices (p < 0.05). Analysis of variance (PROC MIXED) for evaluating YEAR, fertilization (FERT) and CROP influences on soil organic matter (SOC). The interaction FERT*CROP lacked Degrees of Freedom for the analysis.
Agriculture 11 00700 g005
Table 1. Initial soil main nutrient content in 2008, mean values ± std dev (n = 12). Soil Organic Carbon (SOC), Soil Nitrogen (SN), Olsen available Phosphorus (P), available Potassium (K) and Mineral Nitrogen content (NMIN = NH4-N + NO3-N).
Soil DepthpH (1:2.5)SOCSNPKNMIN
cm g kg−1mg kg−1
0–7.58.15 ± 0.296.85 ± 0.740.76 ± 0.077.7 ± 2.1328.9 ± 32.36.81 ± 3.09
7.5–158.24 ± 0.346.13 ± 1.120.72 ± 0.166.7 ± 1.9297.9 ± 46.45.50 ± 3.78
15–308.20 ± 0.355.29 ± 0.880.66 ± 0.116.5 ± 2.9272.0 ± 47.46.10 ± 4.59
Table 2. Main nutrient contents of the horse manure and the poultry litter: Organic Matter (OM, %), Organic Carbon (OC, %), Kjeldahl N (N, %), Phosphorous (P, g kg−1), Potassium (K, g kg−1) and Calcium (Ca, g kg−1).
OM (%)OC (%)N (%)C/NPKCa
% g kg−1
Composted Horse Manure3120.31.0519.3---
Composted Poultry Manure5030.43.289.39.521.766.2
Table 3. Accumulated rainfall (mm) during the cropping season (from October to June) and the historic mean value (1957–2019). Data were collected from the meteorological station located close to the field experiment in La Canaleja (INIA).
Cropping SeasonRainfall (mm) October–June
2009–2010493.1
2010–2011513.6
2011–2012193.6
2012–2013369.0
2013–2014233.9
2014–2015265.5
2015–2016290.2
2016–2017203.4
2017–2018454.4
2018–2019241.3
HISTORIC MEAN (1957–2019)325.8
Table 4. Total and available heavy metal content (mg kg−1) for the beginning of the experiment (2008), in 2017 and the generic reference values (total content) for Madrid (NGR) classified for “other uses”, mean ± sd dev (n = 20). “n.d.” denoted “not detected”.
CdCrCuZnPbNi
mg kg−1
TotalNGR39080117075405
Initial0.08 ± 0.0125.49 ± 2.5414.61 ± 1.1623.49 ± 3.1013.06 ± 3.057.08 ± 0.41
20170.15 ± 0.1429.41 ± 3.448.79 ± 1.939.11 ± 8.397.66 ± 3.5716.08 ± 2.72
AvailableInitial0.02 ± 0.01n.d.1.30 ± 0.161.35 ± 0.212.55 ± 0.350.22 ± 0.11
20170.03 ± 0.020.02 ± 0.031.90 ± 0.612.91 ± 1.204.13 ± 1.124.64 ± 1.33
Publisher’s Note: MDPI stays neutral with regard to jurisdictional claims in published maps and institutional affiliations.

