Article

Urease Inhibitors Effects on the Nitrogen Use Efficiency in a Maize–Wheat Rotation with or without Water Deficit

by
Raúl Allende-Montalbán
1,2,
Diana Martín-Lammerding
1,
María del Mar Delgado
1,
Miguel A. Porcel
1 and
José L. Gabriel
1,3,*
1
Environment and Agronomy Department, Instituto Nacional de Investigación y Tecnología Agraria y Alimentaria (INIA, CSIC), Ctra. de la Coruña km. 7,5, 28040 Madrid, Spain
2
Department of Agricultural Chemistry and Food Science, Universidad Autónoma de Madrid, Av. Francisco Tomás y Valiente 7, 28049 Madrid, Spain
3
Centro de Estudios e Investigación para la Gestión de Riesgos Agrarios y Medioambientales (CEIGRAM), Paseo de la Senda del Rey 13, 28040 Madrid, Spain
*
Author to whom correspondence should be addressed.
Agriculture 2021, 11(7), 684; https://doi.org/10.3390/agriculture11070684
Submission received: 29 June 2021 / Revised: 13 July 2021 / Accepted: 16 July 2021 / Published: 20 July 2021
(This article belongs to the Special Issue Effects of Fertilizer and Irrigation on Crop Production)

Abstract

:
The use of urease inhibitors in irrigated systems decreases both soil ammonium (NH4+) and nitrate (NO3) availability, and, thus, could be an easy tool to reduce N loss due to ammonia volatilization and NO3 leaching. The main goal of this experiment was to assess the effect of urease inhibitors on N use efficiency, N losses, and their economic impact in a maize-wheat field experiment. In this study, 10 treatments were compared, combining the urea fertilizer with or without urease inhibitor, applied in one or two dressings, and under optimal or sub-optimal irrigation. A single application of urease inhibitor (IN1d), coupled with the conventional urea, helped to reduce the nitrate leaching risk both during the maize period (even when compared to the two dressing treatment) and after harvest. In addition, this improvement was achieved together with an increase in economic benefit, even when compared with the application of the same amount of regular urea split into two dressings. Under low water availability systems, the benefits of applying urease inhibitors increased with respect to the application of regular urea, making this technique a very promising strategy for adaptation to climate change in arid and semiarid regions.

1. Introduction

Nitrogen (N) is an essential macronutrient for all organisms and N-containing fertilizers are the most widely applied fertilizers in agriculture [1]. Among N-based fertilizers, urea is the most commonly used [2] due to its high N content (46%), its relatively low cost, and its ease of use [3]. However, the efficiency of urea application is low due to its high hydrolysis rate, which generates more mineral N than the crop can assimilate in the first stage. Some of this N can be immobilized in the soil, but the excess is lost through ammonia (NH3) volatilization or nitrate (NO3) leaching [4]. In order to avoid NH4+ losses in soil, there are several techniques that have proven their effectiveness. It is possible to hinder the nitrification process (either through anaerobic conditions or through the use of nitrification inhibitors) to avoid excess NO3 in the soil and its potential leaching. To avoid losses due to NH3 volatilization, the tactic of incorporating NH4+ into the soil is generally used, either by burying the fertilizer with mechanical labor, by introducing it with irrigation or taking advantage of rain, or by injecting the fertilizer directly into the soil. In this way, the release into the atmosphere of spontaneously generated gaseous NH3 is inhibited and its conversion to NH4+ is improved. Finally, the fixation of NH4+ in the soil can be enhanced by increasing the ion exchange capacity of the soil, which is related to the clay proportions in the soil, or by increasing the amount of organic matter [5]. However, these processes, except when in artificial soils, are slow and expensive.
The global average losses of NH3 from urea fertilizers are estimated to be close to 14% (range of 10–19%) [6], but they can reach up to 40% of applied urea-N in warm and tropical regions [7]. This not only implies economic losses for farmers, but also generates a negative impact on the environment and human health due to the eutrophication generated by the leaching of nitrates, the greenhouse gas emissions, and the increase in air fine particles caused by ammonia volatilization [8].
One way to reduce N losses consists of adjusting the N concentration in soil to the crop demand, which can be achieved by dividing the N application into several dressings during the crop development [9]. As some authors have pointed out, split applications of N can improve crop yields and N use efficiency parameters, such as the agronomic efficiency (AEN) and the N recovery efficiency (REN) [10]. However, split applications have some downsides, such as an increase in the amount and difficulty of field work, which typically leads to an increase in the overall crop costs. Another proposed method for reducing N loses is the use of urease inhibitors. Urea hydrolysis is facilitated by urease, a nickel-dependent enzyme that catalyzes the hydrolysis of urea to one mole of carbon dioxide (CO2) and two moles of ammonia, which can oxidize to nitrate. As a key enzyme for the global N cycle, this hydrolase is widely distributed in nature and is released naturally by soil microorganisms [11]. Urease inhibitors reduce urea hydrolysis, adjusting the release of N mineral forms to match crop demand, therefore increasing the crop nitrogen use efficiency (NUE). However, their effect on crop yield is variable [12]. The reduction in NH3 losses caused by the urease inhibitors can range from 0% to 94% of the NH3 lost when using urea alone. Crop yield can also vary depending on the crop management and conditions, but overall, Silva et al. [13] calculated in a meta-analysis that urease inhibitors can increase crop yield by up to a 5%. In the last decade, climate change has become a growing threat to crop development, with more frequent harsh climate conditions leading to a crop yield reduction. In this context, water shortages and droughts will become an increasingly common and severe problem in warm countries. Therefore, it is of great interest to study methods to reduce the impact of water shortage on crops, making the effects derived from the interaction between N nutrition and water availability especially relevant [14].
Globally, maize and wheat are the second and third most produced crops, respectively. In 2019, 1148 Mt of maize and 766 Mt of wheat were produced, which respectively represented 38.5% and 25.7% of the world’s total cereal production [15]. In the 2020–2029 period, global cereal production is projected to expand by 375 Mt, reaching 3054 Mt in 2029, mainly driven by higher yields. In Spain, wheat and maize are two of the most important crops and, therefore, increasing the economic and environmental benefits in these systems is key to increasing their medium- and long-term sustainability.
This experiment was based on the concept that the better the coupling between the mineral nitrogen in the soil and the crop demand, the better the nitrogen use efficiency. We expected to prove that the application of urease inhibitor could produce an increase in the nitrogen use efficiency, reducing, at the same time, machinery use. Therefore, the main goal of this experiment was to quantify the effect the application of a urease inhibitor, joined to the traditional urea fertilizer with two different fertilizer application schedules and irrigation rates, had on nitrogen use efficiency. The impact of these factors was quantified based on the yield response, the grain quality, and the soil mineral nitrogen and enzymatic activity.

2. Materials and Methods

2.1. Field Experiment

This field experiment was conducted from April 2018 to July 2019 at the “La Canaleja” field station of the National Institute of Agricultural and Food Research and Technology (INIA). The field station is located in Alcalá de Henares, (Madrid province), Spain (40°32′ N, 3°20′ W, 600 masl). The climate is Mediterranean semi-arid, with an annual rainfall of 389 mm (186–547 mm), mainly occurring in autumn and spring and almost negligible in summer, and a mean annual temperature of 13.5 °C. The soil was classified as a Typic Calcixerept by the soil taxonomy classification [16] and as a Calcic Cambisol by the Food and Agriculture Organization (FAO) classification [17]. Further information can be found in Table 1.
The experiment included a maize and wheat crop rotation, which consisted of maize sown on 14 May and harvested on 8 October, followed by wheat sown on 14 February and harvested on 10 July. The maize (plant density of 80,000 plants ha−1) and wheat (sowing rate of 230 kg ha−1) were grown in an irrigated field with a 16 × 16 m2 permanent sprinkle system. The P and K fertilization consisted of 50 kg P2O5 and 50 kg K2O, before maize sowing, following the traditional dose in the region, in order to avoid a phosphorus (P) or potassium (K) deficit. The soil management consisted of conventional tillage plowing to 20 cm depth two weeks before maize or wheat sowing, followed by disc plowing for sowing bed preparation. All crop residues were left over the surface until plowing.
The maize fertilizer rate was 170 kg N ha−1, based on the optimum observed for the region in previous experiments [18,19]. The five fertilization treatments consisted of: C (control without N fertilization), U2d (170 kg N ha−1 of urea split into two dressings at 4–6 and 8 fully expanded leaves), U1d (170 kg N ha−1 of urea applied at 4–6 fully expanded leaves), IN2d (170 kg N ha−1 of urea with urease inhibitor split into two dressings at 4–6 and 8 fully expanded leaves), and IN1d (170 kg N ha−1 of urea with urease inhibitor applied at 4–6 fully expanded leaves). The first fertilizer dressing (85 or 170 kg N ha−1 depending on the treatment) was applied on 18 June and the second on 17 July. The five treatments were duplicated based on two different irrigation rates. Each treatment had four replications randomly distributed in forty 8 × 8 m2 plots included in a 1.25 ha maize field. The spring wheat crop was sown over the previous maize treatments and received no fertilization for a better appreciation of the residual effect of urease inhibitor, application schedule, and irrigation intensity on yield and grain quality.
The irrigation schedule and doses were estimated from the daily values of crop evapotranspiration (ETc) and rainfall. This was calculated as ETc = Kc × ET0, where ET0 was the reference evapotranspiration, calculated by the FAO Penman-Monteith model [20] using daily local data, and Kc was daily obtained by the Martinez-Cob [21] method. Total water input was divided into plots with an optimal irrigation intensity equivalent to the ETc demand (100%) and plots with suboptimal irrigation (75%) in order to analyze the effect of water deficit. The total water irrigated during the maize crop was 700 mm (in the 100% treatments) and 525 mm (in the 75% treatments). As the applied water presented an average of 12.3 mg N-NO3 L1 over the course of the cropping season, the total amount of nitrate applied via irrigation was 86.0 and 64.5 kg N ha1 in the 100% and 75% treatments, respectively. The spring wheat was also irrigated in order to supply the difference between the potential evapotranspiration and the actual precipitation. The total water irrigated was 145 mm (in the 100% treatments) and 110 mm (in the 75% treatments). In this case, the N incorporated with the irrigation water was 17.5 and 13.1 kg N ha1 in the 100% and 75% treatments, respectively.

2.2. Crop Analysis: Yield, Grain Quality, N Content, and Nutritional Status

At maize harvest, a 5 m stripe in the central row was harvested by hand and separated into plant components (grain vs. rest of aboveground biomass), and a subsample of each component was oven-dried (65 °C) and weighed. A subsample of each plant component was also used to determine total N concentration by the Dumas combustion method (LECO FP–428 analyzer, St. Joseph, MI, USA). For each plot, the N content of each crop component was calculated by multiplying its dry biomass by its N concentration and adding both to obtain the total crop N content. At wheat harvest, the grain biomass was registered by sampling a 5 m stripe in a central row by hand. A subsample was oven-dried (65 °C), weighed, and analyzed for N concentration and total N content.
The crop nutritional status of the maize was evaluated with a Dualex® Scientific (Force-A, Orsay, France) chlorophyll meter, a leaf clip sensor that measures chlorophyll content (Chl) as the difference between the light transmitted at the red and infrared wavelengths. The device also measured flavonols (Flav) and anthocyanins (Anth), two substances which are highly correlated with the crop stress and the nutritional balance index (NBI) [22,23]. Readings were carried out over the maize crop cycle from 12 June (before first dressing) to 3 October (before harvest). On each sampling date, 20 measurements were taken from the uppermost fully developed leaf (or in the ear leaf once flowering) of 20 representative plants in the central rows of each plot, following the sampling method defined for maize by Gabriel et al. [24]. The representative value of each plot was the twenty-measurement average.
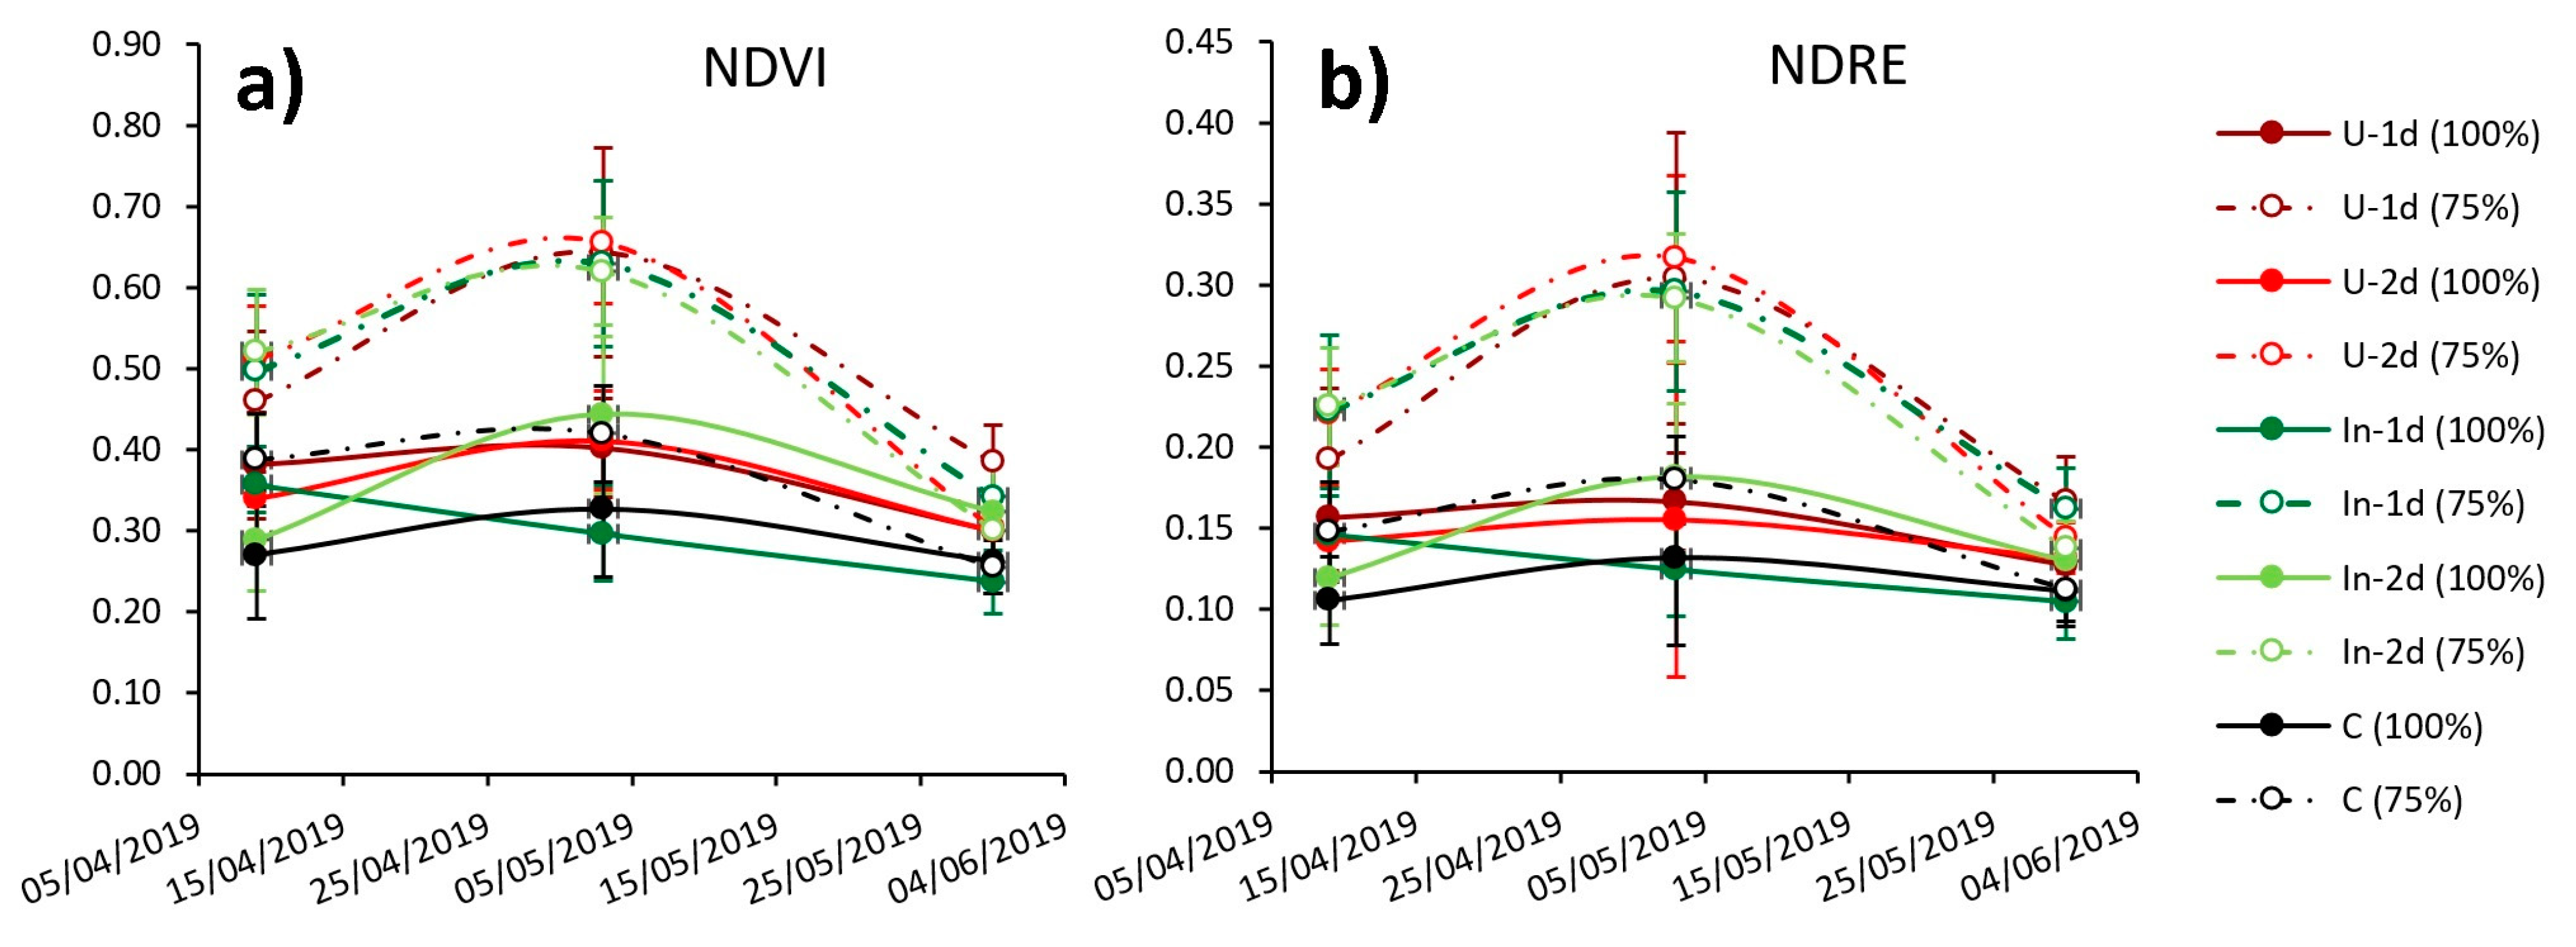
The crop nutritional status of the wheat was evaluated with RapidScan® (Holland Scientific Inc., Lincoln, NE, USA). In this case, the measurements consisted of the proximal measurement of the normalized difference vegetation index (NDVI, structural and growth index) and the normalized difference red edge (NDRE, nitrogen content index), integrating measurements every 0.5 s in the central 7 m row per plot. These measurements were taken three times: 9 April, 3 May (flowering), and 30 May.

2.3. Soil Inorganic N Content (Nmin) and Urease Activity

The soil nitrate and ammonium content were determined at four dates: before the maize crop sowing (11 May), at flowering (6 August), after maize harvest (11 October), and after wheat harvest (14 July). A combined sample from three soil cores was taken from each plot by 0.2 m intervals with an Eijkelkamp® helicoidal auger (Eijkelkamp Agrisearch Equipment, Geisbeek, the Netherlands). The samples were taken at a depth of up to 0.6 m. The samples were placed in a plastic box and firmly closed immediately, transported, and refrigerated (4–6 °C). Within the five consecutive days, a soil subsample of each box was extracted with 2M KCl (~5 g of soil: 50 mL of KCl), centrifuged, decanted, and a subsample of the supernatant volume was stored in a freezer until later analysis (FIAstar™ 5000, FOSS Analytical AB, Höganäs, Sweden). The nitrate concentration was determined by the Griess-Ilosvay method [25], and ammonium was measured using the method of Solorzano [26]. Soil Nmin was calculated for each layer and plot. The soil urease activity was also measured in the soil samples obtained at maize flowering and harvest, quantifying the residual effect of the inhibitor in the soil. The methodology followed was that suggested by Kandeler and Gerber [27].

2.4. N Efficiency Parameters

The components of N use efficiency that were calculated for each crop included: agronomic efficiency (AEN), the N recovery efficiency (REN), nitrogen use efficiency (NUE), and nitrogen surplus (Nsurplus) based on Ayuso, Gabriel and Quemada [28]. The AEN (Equation (1)) refers to the kg of crop yield increase obtained per kg of N applied (i.e., the ratio of the difference between the grain yield of a treatment (Grain_yieldTreatment) and the average grain yield of the control (Grain_yieldControl) to the N applied in the specific treatment from fertilizer (NFertilizer) and irrigation water (Nirrigation)). The REN (Equation (2)) refers to the kg of crop N uptake per kg of N applied, calculated as the ratio of the difference between the crop N uptake by a treatment (Nuptake-Treatment) and the average crop N uptake by the control (Nuptake-Control), to the N fertilizer applied. The NUE (Equation (3)) was calculated as the N exported from the system as grain (Nuptake-grain) divided by the N input (N from fertilizer and irrigation). Finally, the Nsurplus (Equation (4)) was calculated as the difference between the N inputs from the fertilizer, the irrigation water, and initial mineral N (Nmin_ini) and the N outputs (as crop N uptake (Nuptake) and final soil mineral N (Nmin_final).
AEN N = ( Grain _ yield Treatment Grain _ yield Control ) ( N Fertilizer +   N Irrigation )
RE N = ( N uptake Treatment N uptake Control ) ( N Fertilizer )
NUE   = ( N uptake grain ) ( N Fertilizer +   N Irrigation )
N Surplus = ( N min _ ini + N Fertilizer +   N Irrigation ) ( N min _ final + N uptake )

2.5. Statistical Analysis

Statistical analysis was carried out using SPSS for Windows (v. 23.0). A Shapiro-Wilk test was carried out in order to assess data homogeneity. All multifactor analyses were performed using a GLM or Kruskal-Wallis test. Post hoc multiple comparisons of means were carried out using Duncan’s or Games-Howell´s test as appropriate. Only a p value of < 0.10 or lower was considered statistically significant.

3. Results

3.1. Maize Crop Analysis

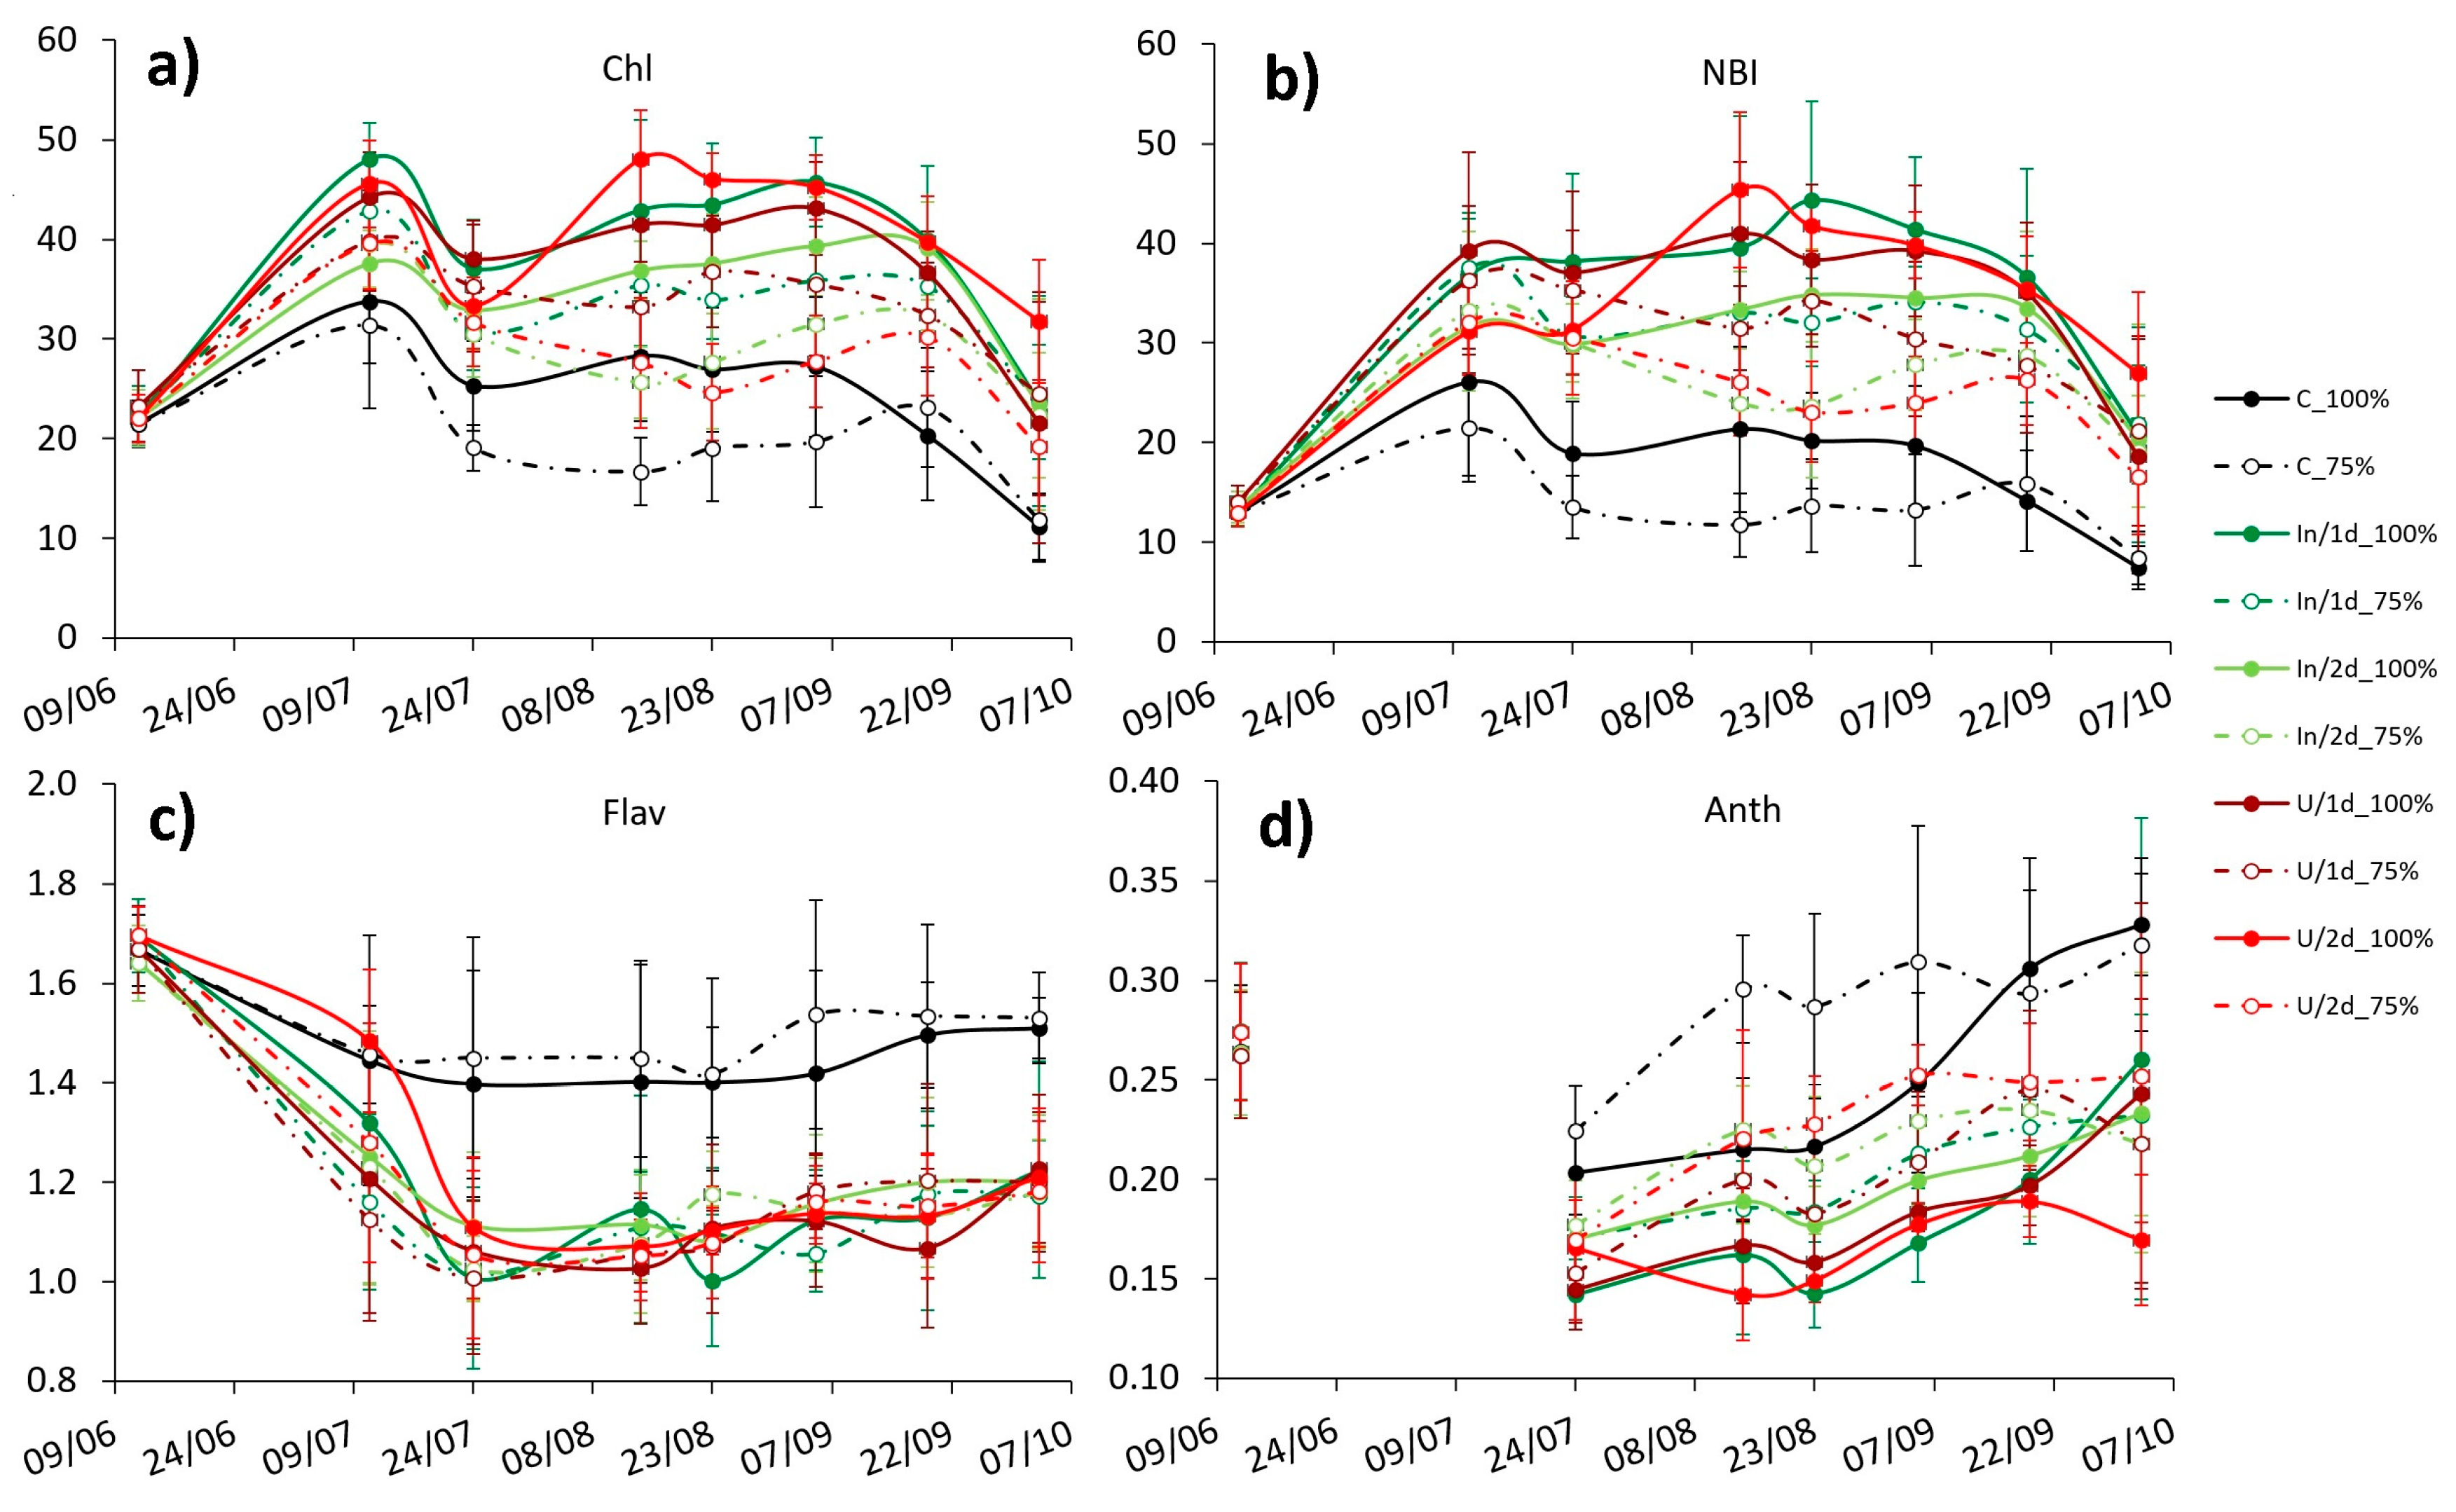
Over the maize crop cycle, there were differences in maize nutritional status between fertilized and non-fertilized treatments and between optimally (100%) and sub-optimally (75%) irrigated plots, but differences were not so clear between the different fertilizer treatments (Figure 1). Nevertheless, some tendencies require further analysis. For instance, both treatments with split dressings presented some incipient deficiencies (lower NBI and Chl indexes and higher Flav and Anth) during the period between the first and the second dressing. However, while the U2d treatment recovered after the second dressing, the IN2d needed more time. This effect was more evident in the NBI index. Moreover, the Anth were more related to water stress and the Flav to nitrogen.
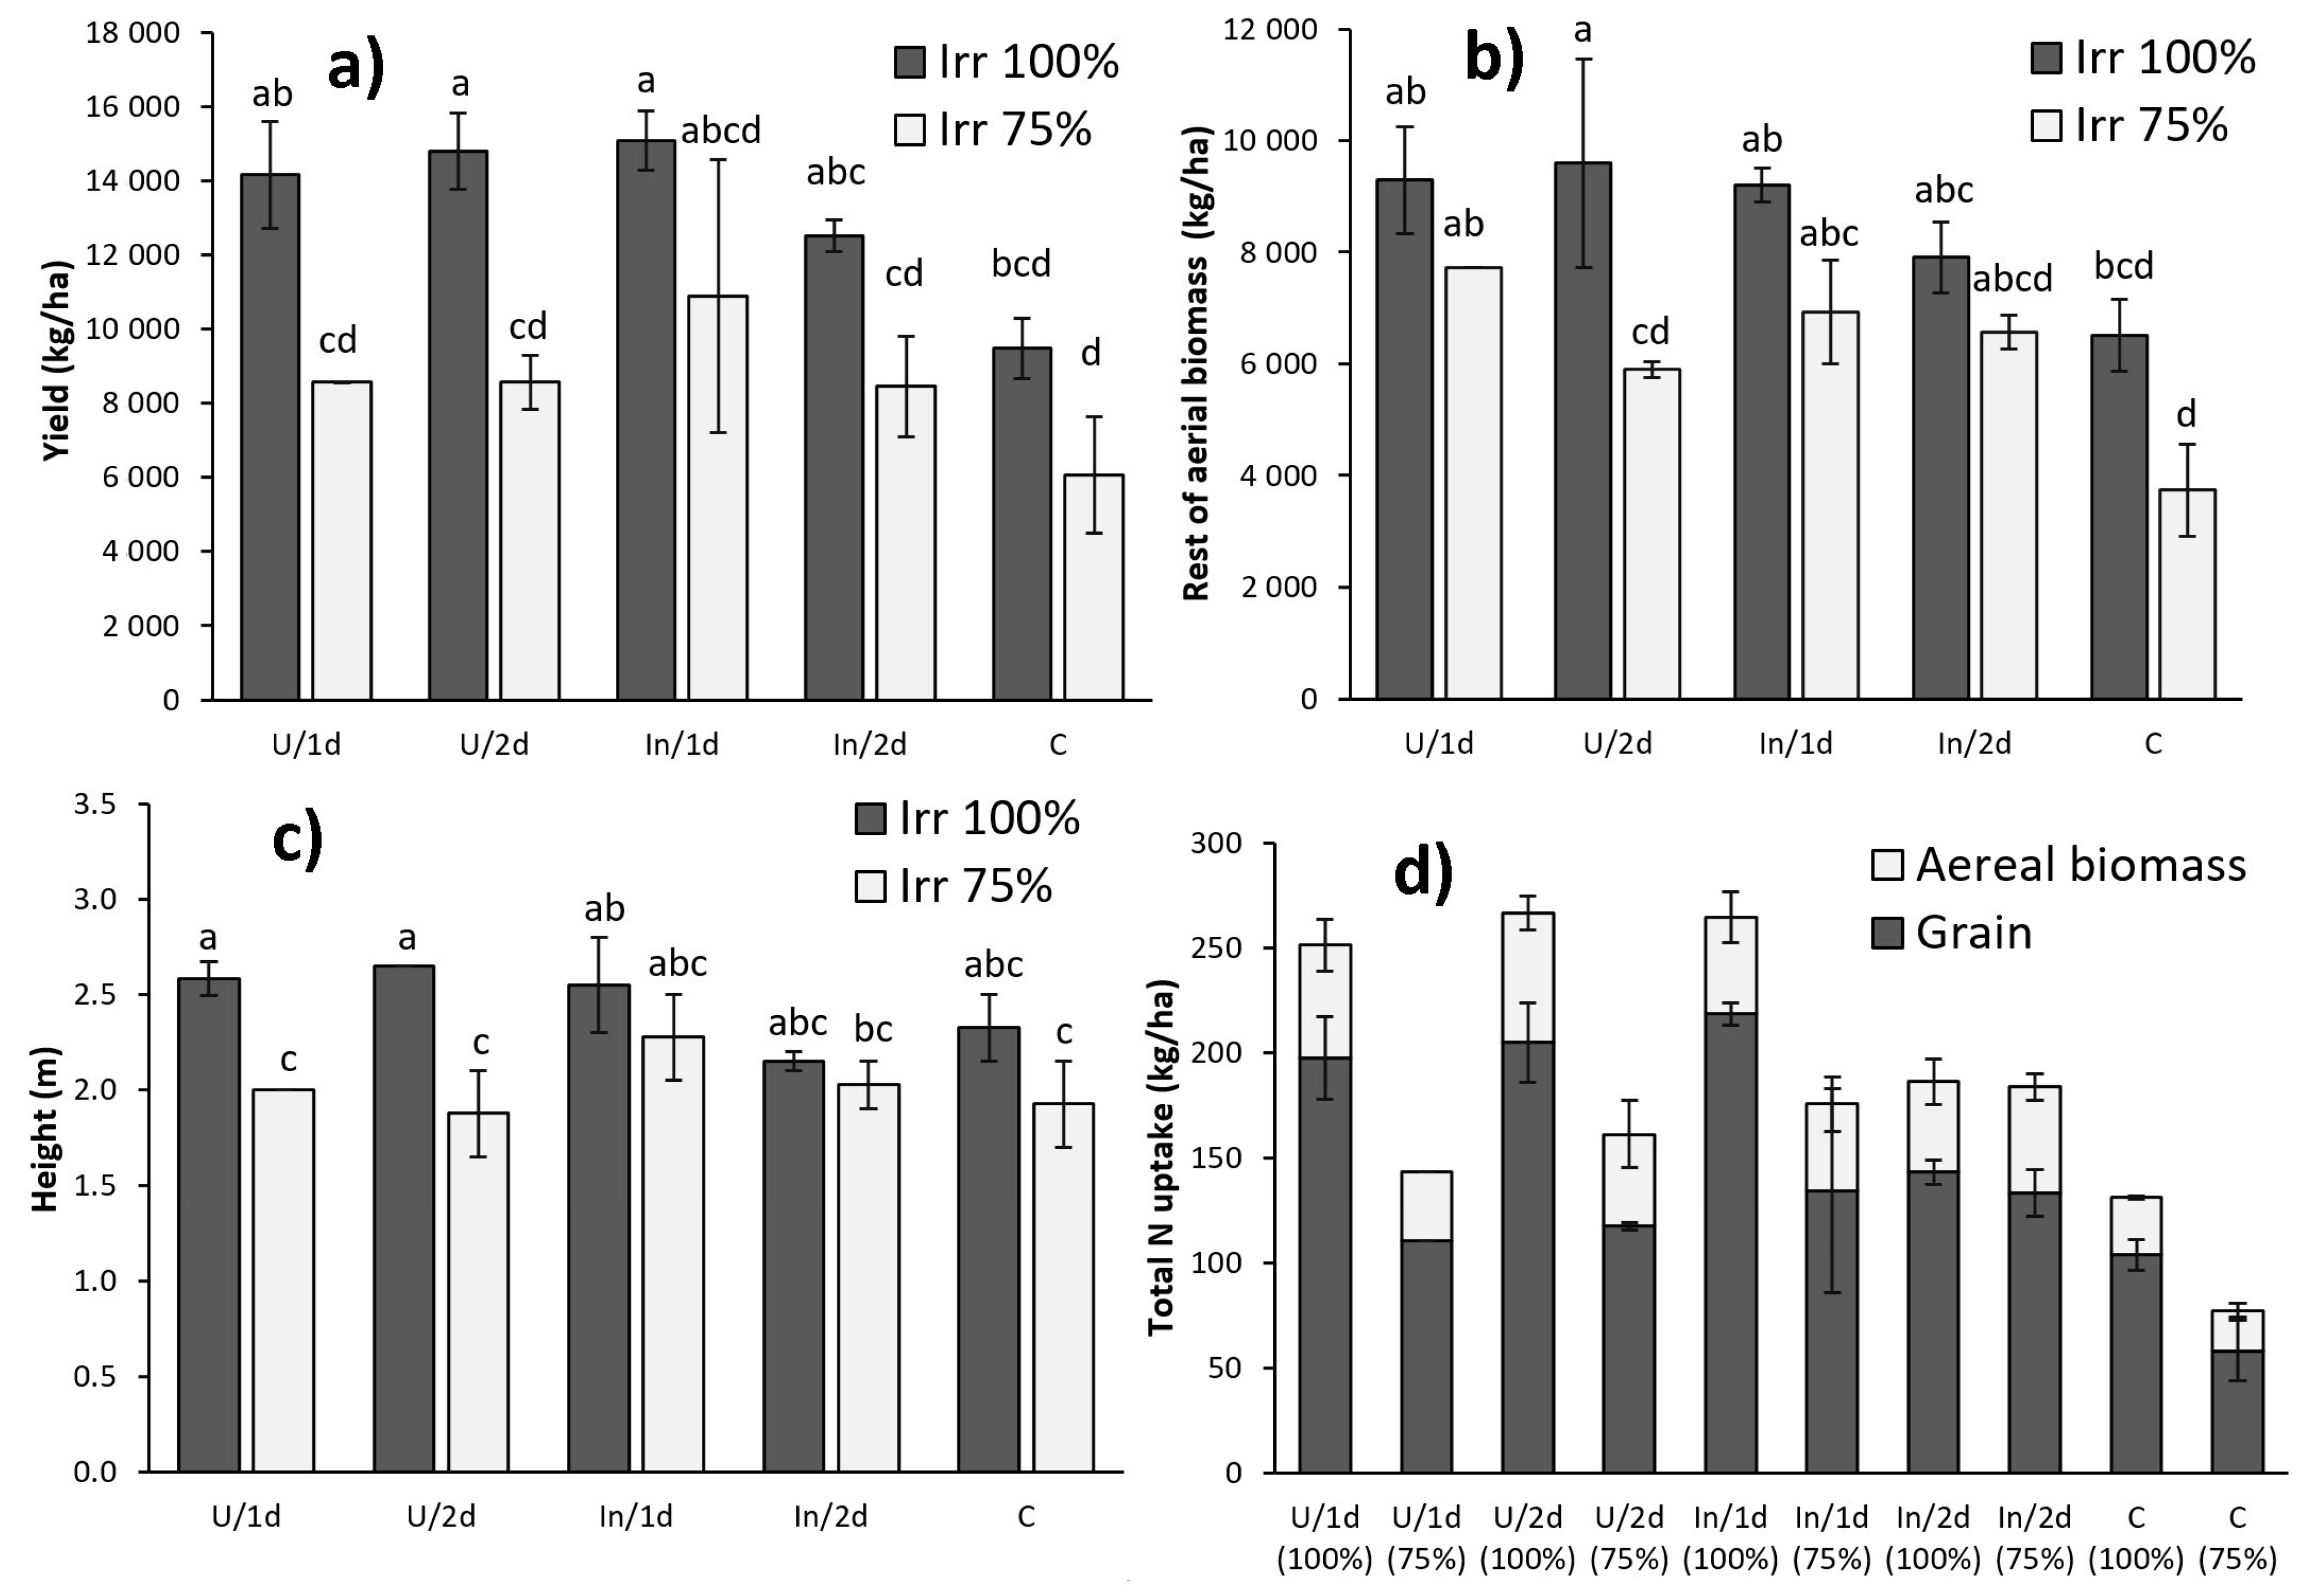
At maize harvest, there were differences in maize height, grain yield, and straw biomass between the control and the fertilized treatments (Figure 2). Looking at the fertilized treatments, there were no final differences between both regular urea treatments (U1d and U2d) and IN1d, but the three presented larger growth values than the IN2d. These results (joined to the maize nitrogen status observed with sensors) indicated that the urease inhibitor delayed N availability for the crop. On the one hand, when the fertilizer with the inhibitor was applied at early crop stages, the N mineralization was coupled with the crop demand. However, when the inhibitor application was split, the N availability was decoupled.
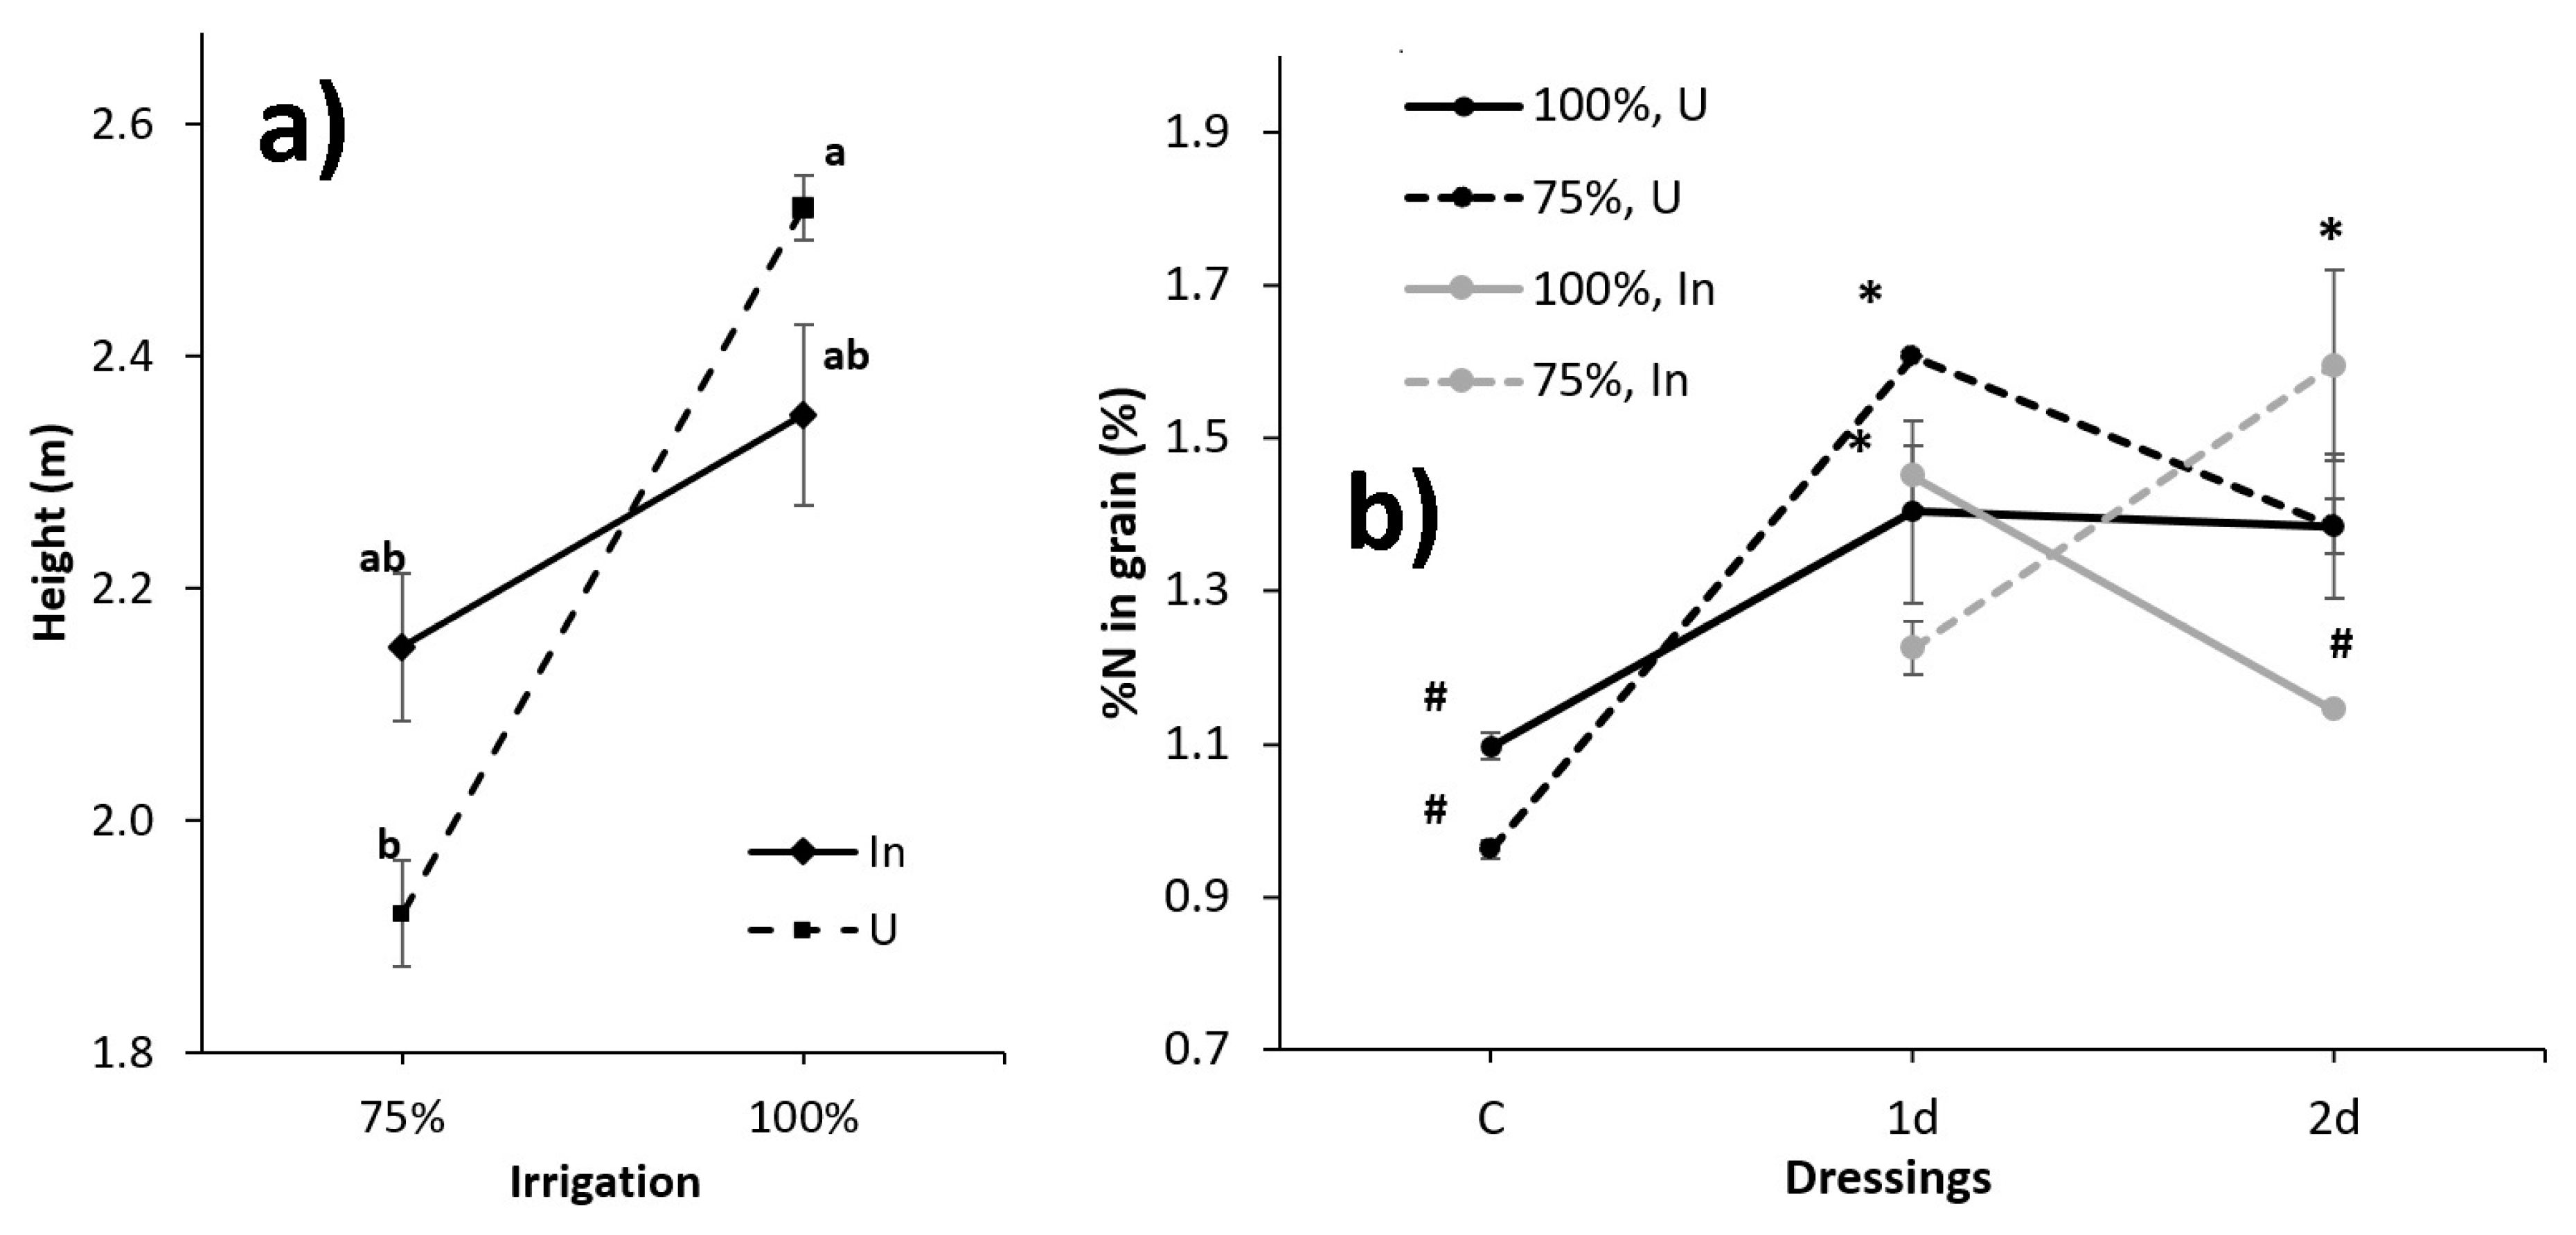
Irrigation intensity was the most significant factor (Table 2) in terms of yield, aerial biomass, and plant height, with a consistent reduction in the values obtained for each of these variables under sub-optimal irrigation conditions (75%). However, the detrimental effect of sub-optimal irrigation was attenuated by using urease inhibitors, although this relationship was only significantly established for plant height (Figure 3).
The number of fertilizer dressings also had an important impact on the data obtained. Regardless of fertilization type, one dressing treatments showed the largest grain yield, aerial biomass, plant height, N concentration, and N uptake in grain, although these results were only significant compared to the non-fertilized control. However, on the other hand, N concentration and uptake in the rest of the aerial biomass was higher in the two dressings treatments, although these differences were not significant (Table 3).
When the use of urease inhibitors was studied alone, data showed low and a statistically non-significant impact of this factor on the data obtained. However, significant differences were observed in the joint effect of inhibitors with other factors. As seen previously, the detrimental effect caused by the reduction in irrigation intensity to sub-optimal levels (75%) can, in turn, significantly reduce the yield, biomass, and N concentration of the crop. However, this effect was slightly attenuated in our experiment after the use of urease inhibitors, as this effect was statistically significant for plant height. A similar case was observed regarding the combination of urease inhibitors with the different number of dressings. In this case, a light and non-significant increase was observed in the N uptake in grain when all the fertilizer was applied in one dressing. On the other hand, when the fertilizer was divided in two dressings, the N uptake in grain was reduced with the use of urease inhibitors (Table 3).
It is interesting to analyze the result obtained between the interaction of the three factors (inhibitor, irrigation, and dressings) and the N concentration in grain. It was observed that when no inhibitor and only one dressing were applied, a non-significant increase in the concentration of N in the grain was obtained in the sub-optimal irrigation conditions (75%). This difference disappeared when the crop was fertilized with two dressings. However, the opposite effect was observed when urease inhibitors were applied, obtaining non-significantly higher N concentrations in the grain of the optimally irrigated maize (100%) when one dressing was applied, while, when two dressings were applied, the N concentration in grain was not significantly higher in corn with suboptimal irrigation (75%). The results, therefore, showed that urease inhibitors could increase the N concentration in grain when applied together with two dressings under sub-optimal irrigation conditions. In all cases, the absence of fertilization (C) showed the worst results (Figure 3).
Grain N concentration in IN1d,100%, IN2d,75%, and all urease alone (U) treatments, except for U1d,75%, showed higher values than both controls. Nevertheless, while the differences were generally not significant, both IN1d,100% and IN2d,75% presented the highest N concentrations in grain among all the treatments studied. On the other hand, the optimally irrigated IN1d, U2d, and U1d showed a tendency to increase Nuptake in grain when compared to the other treatments, especially the controls. Regarding Nuptake and N concentration in aerial biomass, the differences between treatments were not statistically significant, and, therefore, it was not possible to obtain any remarkable data from them.

3.2. Wheat Crop Analysis

As the wheat crop was not fertilized, it showed a great dependency on the residual nitrogen content left in the soil by the previous crop, maize. In this case, the greater effect observed was the N availability in the previous maize sub-optimally irrigated treatments. These treatments presented larger wheat development, observed in a larger NDVI, and a better nitrogen status, observed in a larger NDRE (Figure 4). This also corresponded with the N content and absorption observed at harvest in the grain. Sub-optimal irrigation (75%) was associated with an increase in N concentration (p < 0.01) and N uptake (
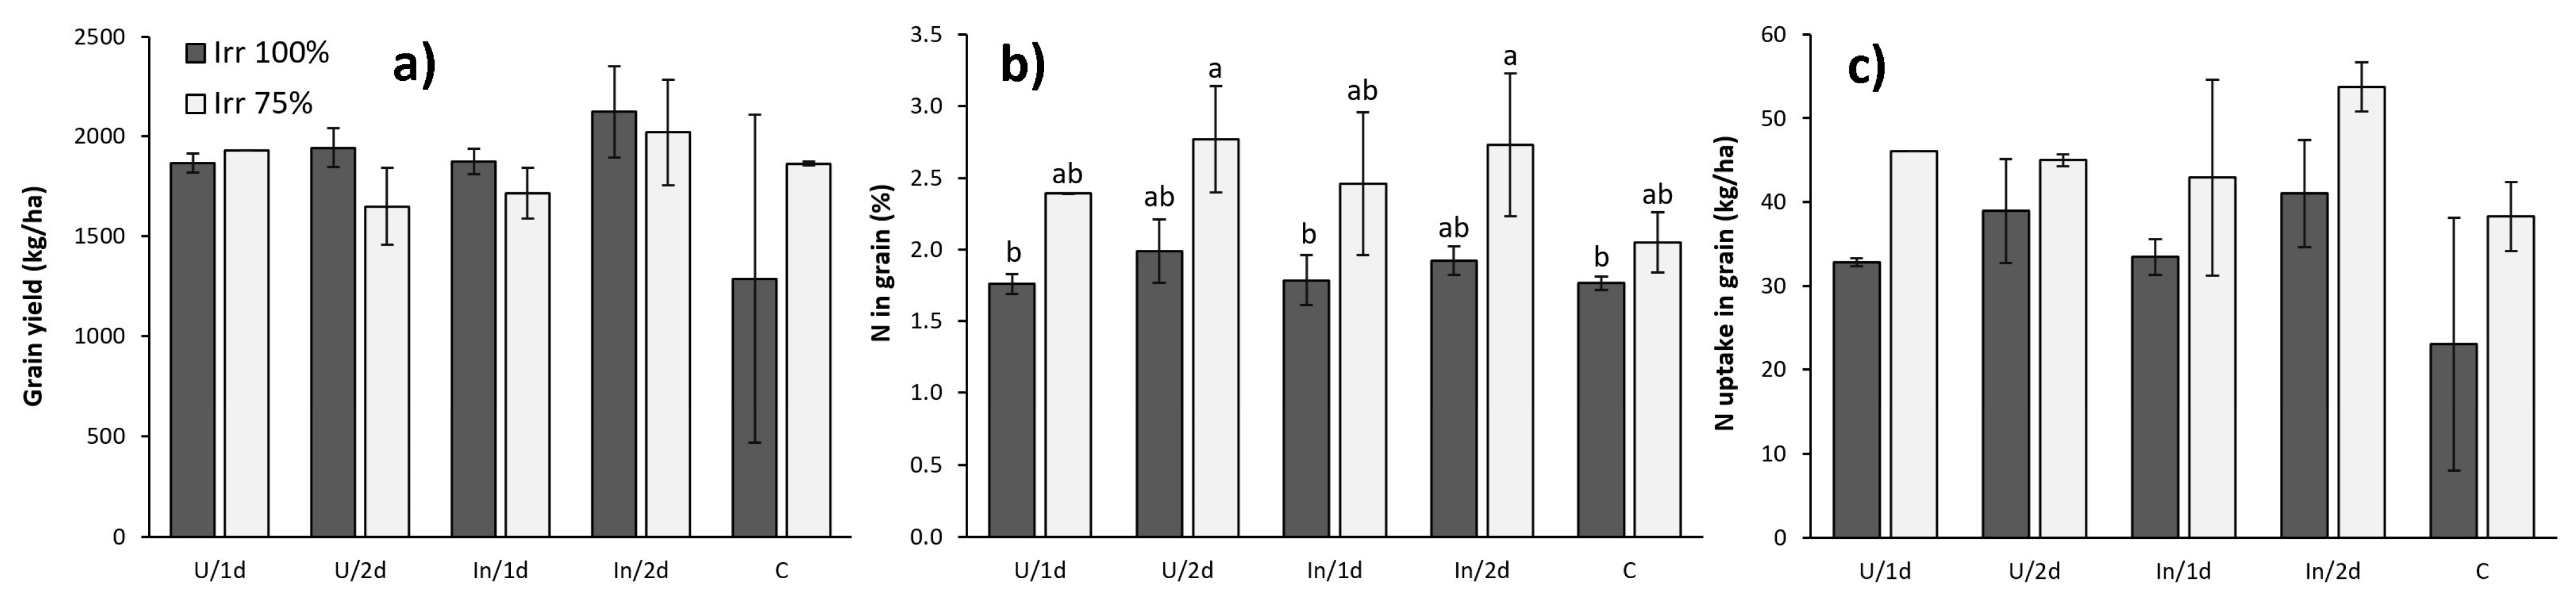
p < 0.05) in grain. However, the irrigation effect was not so clear in the plant development. Urease inhibitor use and the number of dressings showed no statistically significant differences between treatments, although wheat treated with the urease inhibitor appeared to have higher grain yield than the urea-alone fertilized counterpart. The number of dressing seemed to have very little impact on the data obtained, although the two dressing treatments showed a slightly and non-statistically significant increase in the results obtained compared to the one dressing treatments (Figure 5).
Among all the treatments studied, IN2d seemed to have the best performance for all the studied factors, followed by U2d, reinforcing the previous maize nitrogen residual effect (Figure 5). Within the fertilized treatments, U1d and IN1d showed the lowest performance, being the no fertilized control, as the treatment with the lowest results, even though in all cases, these differences were not significant.

3.3. Soil Inorganic N Content

Initial soil inorganic N content in the 0–60 cm layer was slightly high (110 kg N ha−1), even though rapeseed was sown in order to homogenize and extract the residual Nmin excess. The entire field was homogeneous and no differences were found between treatments. At flowering, the N
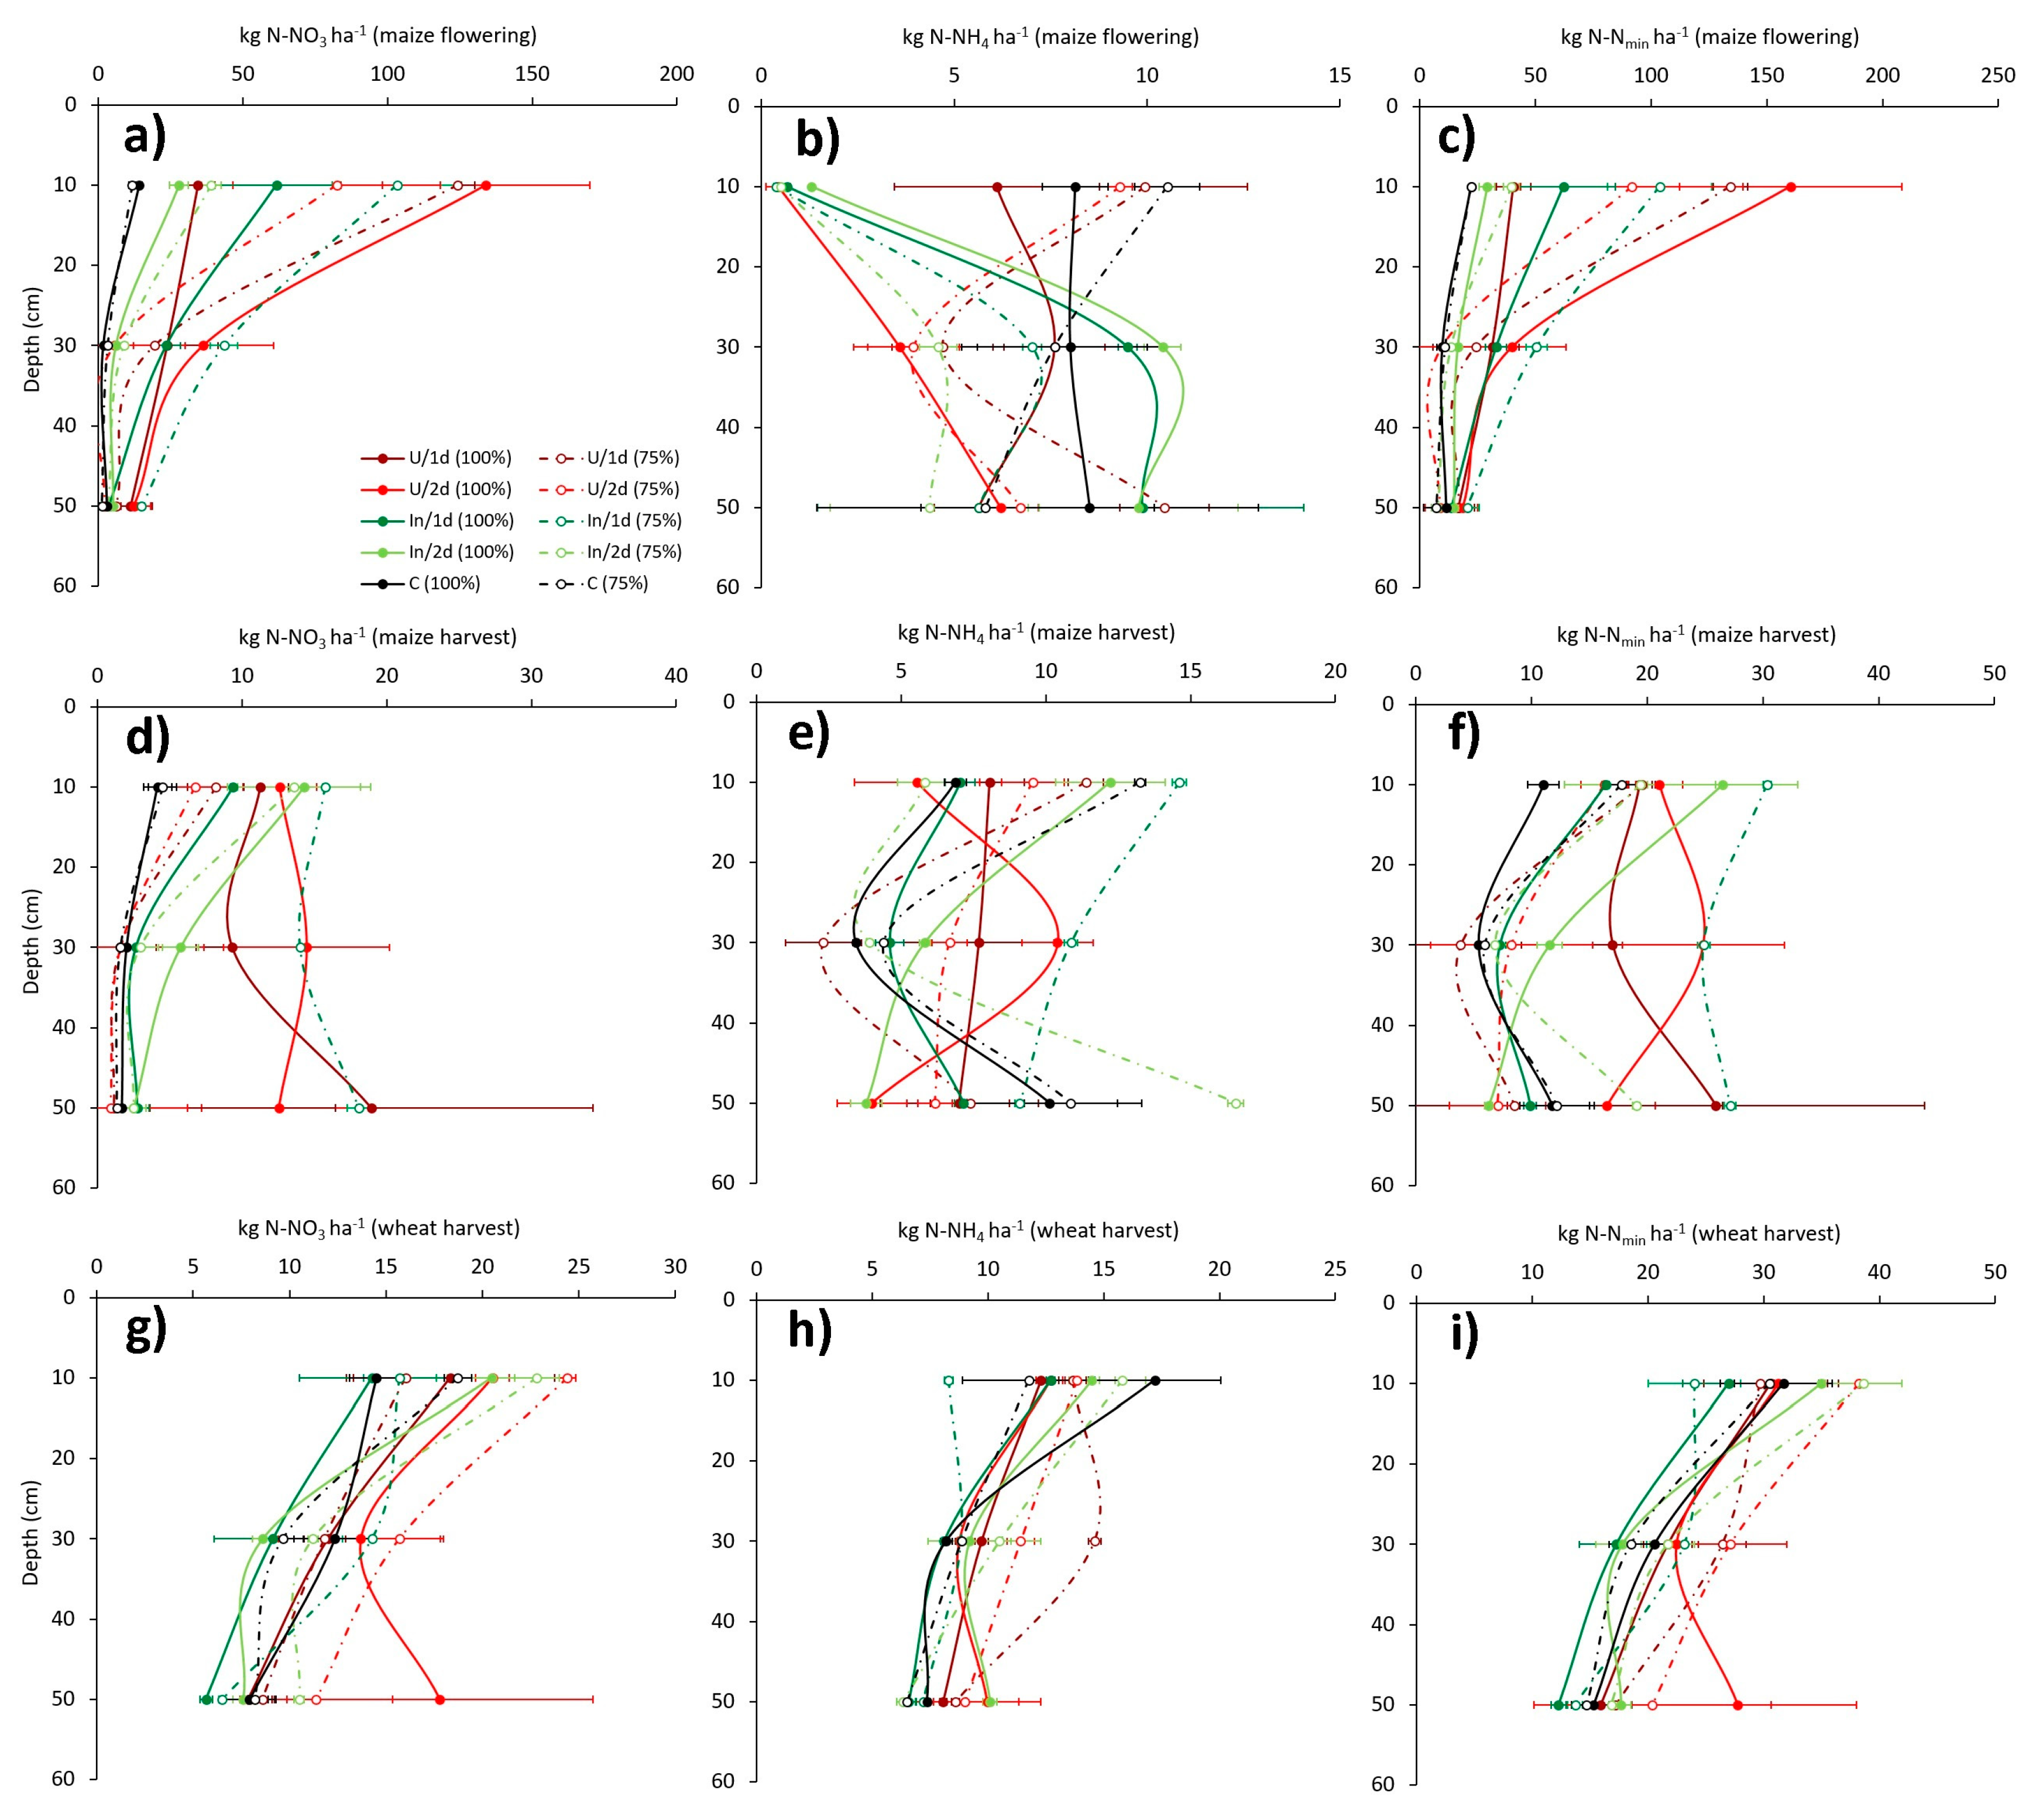
min changed from one treatment to the other and both the number of dressings and the use of inhibitor induced an effect. On the one hand, when the entire N was applied in one dressing, the use of urease inhibitors in the IN1d treatment allowed a larger amount of Nmin in the upper layer at flowering, reducing the Nmin at the lower, and reducing the leaching risk (Figure 6). Comparatively, U2d increased the Nmin in the upper layer greatly, but a considerable amount was leached down along the profile, increasing the nitrate leaching risk. Finally, the IN2d drastically reduced the amount of Nmin available at flowering along the profile, which reduced the nitrate leaching risk, but also reduced the N availability for the maize to values similar to those of the non-fertilized control. In general, sub-optimal irrigation produced larger accumulation of Nmin in the upper layer, mainly due to the reduction in drainage and a reduction in the plant uptake.
After maize harvest, the soil was depleted of Nmin. Both U treatments presented 62 kg N ha−1 at the upper 60 cm, between 34 and 44 kg N ha−1 in the IN treatments, and 28 kg N ha−1 in the control. The amount of NH4+ was similar in all treatments and depths (around 7 kg N ha−1 per treatment and depth), but NO3 changed depending on the treatment and at different depths. On the surface, all the fertilized treatments presented a similar amount of NO3 (12 kg N ha−1 on average), larger than the control treatment (4 kg N ha−1). Moreover, the fertilized treatments applied in two dressings tended to increase the residual NO3 with respect to that applied in one dressing at the surface (on average, 13.5 vs 10.3 kg N ha−1, respectively). At a depth of 30 cm, differences increased between the treatments. In general, treatments fertilized with regular urea presented larger residual NO3 than the IN treatments (with an average difference of 7.7 N ha −1), and treatments that applied the fertilizer in two dressings presented larger values than those seen in the one dressing application (with an average difference of 4.1 N ha−1). Differences with respect to the control treatments were reduced for the IN treatments, but not for the U treatments. Finally, in the deeper layer, this tendency persisted and the IN treatments and the control presented similar results (2.3 kg N ha−1 on average), much lower than the U treatments (15.7 kg N ha−1 on average). Without plants in the field, this NO3 in the lower part of the soil profile was prone to be leached via successive rainfall events, but it could also be indicative of previous leaching during the maize cropping season. It was also remarkable how inhibitors reduced the proportion of Nmin as NO3 with respect to the NH4+ (approaching the natural values observed in unfertilized soil), when compared with the regular urea fertilized treatment, reducing the risk of NO3 leaching. Finally, the same tendencies observed after maize harvest were observed after wheat harvest. In this case, the differences were even smaller and all soils reached similar values of depletion as those observed in the unfertilized control plots. There was no effect from irrigation, the use of inhibitors, or the fertilizer timing.

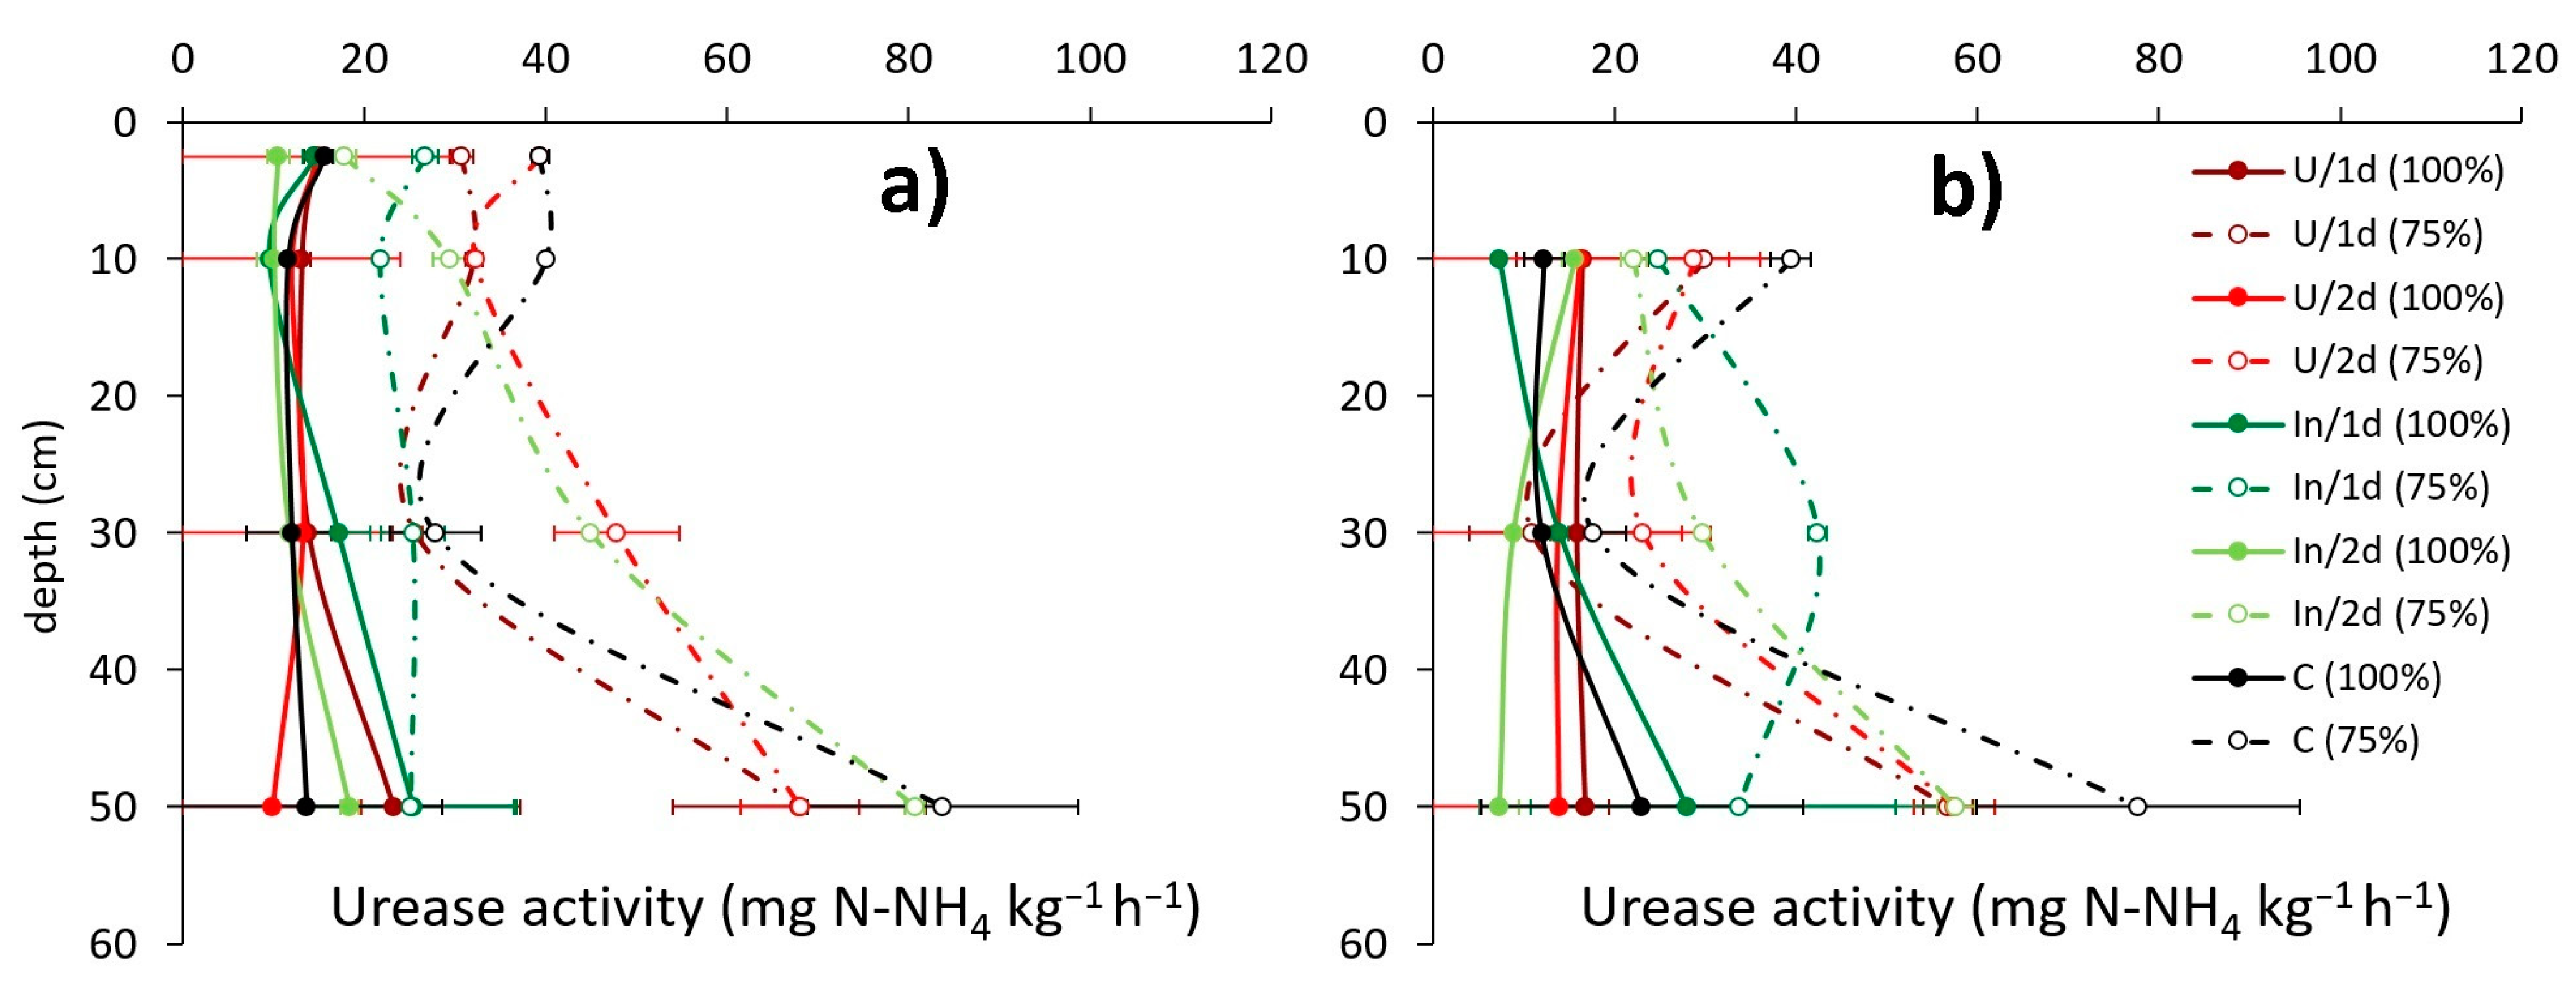
3.4. Soil Urease Activity

The urease activity data showed greater enzymatic activity for treatments with sub-optimal irrigation. Regarding the treatments with poor irrigation, the treatments without inhibitors (U1d, U2d and C) showed a similar behavior over time with high urease activities on the surface, which tended to decrease around 30 cm in depth, and a general increase at 50 cm depth (Figure 7). Treatments with urease inhibitors, on the other hand, presented other behaviors, with the IN2d treatment showing a constant urease activity increase while descending in the soil profile. The IN1d treatment showed relatively low activity in the entire soil profile during flowering, while at harvest this activity increased at the 30 cm depth.
Regarding the optimal irrigated treatments, soil urease activity at flowering showed differences between treatments. On the one hand, IN treatments presented lower urease activity (as expected) in the upper layer (at 0–20 cm depth in both IN1d and IN2d treatments, and at 0–5 cm depth for the IN2d treatment only). This effect showed that the inhibition power was still working even after the 49 days between the first dressing and the flowering sampling. On the other hand, there was also an increase in the upper layer urease activity in the U treatments (larger for U1d) with respect to the unfertilized control. This effect suggested an increase in the microorganisms decomposing urea due to the larger urea availability. This tendency was not so clear in the deeper layers. In this case, the treatments where urea was applied in one dressing (U1d and IN1d) presented some tendency to increase urease activity, likely due to urea leaching down without the inhibitor. The variability was very high at these layers, and thus the conclusions were not so clear. However, the reduction in the irrigation presented the most important effect. All treatments, including the unfertilized control, presented higher values for the urease activity along the soil profile, indicating that under these drier conditions, soil microorganisms were more active.
Soil urease activity at harvest was very similar, and values moved on the same range as at flowering. Between 20 and 60 cm, the values were very similar to those obtained at flowering and with the same variability, making conclusions unclear. However, on the surface, some differences appeared. In this case, both the U treatments demonstrated larger urease activity than the control. Moreover, the IN2d treatment showed a similar tendency, with a fast recovery of soil microorganism populations. However, the IN1d treatment still presented lower urease activity than the unfertilized control.

3.5. N Efficiency Parameters

Regarding the N efficiency parameters, irrigation was the factor with the greatest effect on the AEN, REN, and NUE parameters, being able to reduce up to 50% of the efficiency of the use of N in crops developed without urease inhibitors, while Nsurplus could be multiplied by three (Table 4). However, the results indicated that the detrimental effect on N efficiency observed in the sub-optimally irrigated treatments could be ameliorated significantly through the use of urease inhibitors, achieving reductions in AEN between 6–27% depending on the treatment. In the case of the IN2d treatment, the use of urease inhibitors increased REN by more than 100%. At the same time, Nsurplus was reduced as a consequence of the use of urease inhibitors in the IN2d treatment. However, this was not the case with the IN1d treatment, where Nsurplus increased with insufficient irrigation (75%), even though this increase was lower for the IN1d treatment than for any of the U treatments.
In general, when the irrigation effect was not considered, the IN1d treatment presented with a high efficiency, which was almost equal to the efficiency obtained by the U2d treatment. The efficiency obtained by the U1d treatment was slightly lower than it was for U2d and IN1d. Finally, the IN2d treatment presented with the lowest of values, mostly because of its lower yield and total N uptake.

3.6. Economic Efficiency Parameters

There were three main differences in the economic inputs between treatments: the amount of fertilizer, the price of the fertilizer, and the number of applications. The amount of fertilizer was the same (370 kg of urea ha−1) in the four fertilized treatments, while it was zero in the control. With respect to the price of the fertilizer, it was EUR 27.50 for the sack of 40 kg of regular urea and EUR 29.50 for the urea with inhibitor. Finally, each fertilizer application had a cost of EUR 5 ha−1 (considering only fuel consumption and tractor/machinery amortization). The average maize grain price (not including the recent global increase) in Spain was EUR 0.174 kg−1, standardized to 14% of humidity [29]. Equally, the average wheat grain price was EUR 0.185 kg−1, standardized to 11% of humidity [29]. Considering all these values, the final benefit for each treatment was calculated. As a result, the IN1d treatment had the most interesting relative benefit with EUR 2714.45 ha−1 (3099.3 if the wheat period was included), but without statistical differences with U2d or U1d (Table 5). The IN2d treatment presented a lower economic benefit, mostly because of the combination of the high cost and the lower incomes, but without statistical differences with respect U1d. The unfertilized control presented the lowest benefits, even when the relative cost was EUR 0 ha−1, due to the very low yield. Moreover, the IN1d presented larger benefits when irrigation water was a limitation, increasing the differences between U1d and U2d. Under these conditions, IN2d also increased in benefits, reaching the margins obtained by the U treatments.

4. Discussion

4.1. N Availability and Assimilation

This experiment demonstrated the importance of N availability coupling with N crop demands in order to increase economic and N use efficiency. As other authors have previously observed [30,31], the use of urease inhibitors delayed the subsequent N availability along the maize cropping period of NH4+ and NO3. This effect was also observed in this experiment in both soil Nmin measurements at maize flowering and harvest and in the Dualex® measurements. Along the same line, and considering only the optimally irrigated treatments, U1d, U2d, and IN1d presented better N availability and crop demand coupling than IN2d, which resulted in a larger maize yield and N use efficiency. Moreover, there was a tendency to improve maize yield and different N use efficiencies in IN1d with respect to U1d, equaling or even improving the N fertilization in two dressings. This had a large beneficial impact on the economic balance, but also on the environmental impact. IN1d reduced the machinery required in the field (reducing the time, gas, oil, CO2 emissions, and soil compaction effect) and also decreased soil Nmin availability, prone to be leached (NO3) or volatilized (NH3, N2O, NO, and N2) under different conditions [32]. This effect in crop yield was in the line with the observations made by Abalos et al. [30] and Martins et al. [33]. However, other authors reported different results under different cropping systems [31,34], mostly because the N availability was not a limiting factor. Finally, IN1d improved N translocation to grain (higher N concentration in grain and lower in the rest of the aerial biomass), followed by U1d and, to a lesser extent, in U2d. This effect aligns with the observed faster decrease in the chlorophyll content of the leaves measured with the Dualex® at the final stages.

4.2. Irrigation Effect

When water limitations were applied to the maize, differences in maize yield or N uptake were reduced. Liebig already described this effect in 1840 in his Law of the Minimum. Under these conditions, plant growth was mostly limited by water, allowing larger soil Nmin accumulation. Among the sub-optimally irrigated treatments, the differences in grain and biomass N uptake were more similar than among optimally irrigated treatments. However, there was some tendency toward an increase in height, yield, or N uptake in both IN treatments. This tendency could be produced by the initial soil N availability observed in the optimally irrigated treatments. Some authors, such as Passioura and Angus [35], already suggested this effect, reporting that the application of lower N rates under water deficient systems might enhance water use efficiency. In this case, however, the lower rates were replaced by slower soil Nmin release. N use efficiency under the sub-optimally irrigated treatments was consistently lower than under optimally irrigated conditions. These results also reinforced the hypothesis of Quemada and Gabriel [9], suggesting that sub-optimal water input systems typically reduced N use efficiency if the same amount of fertilizer was applied. Finally, there was some response to the number of dressings. In both cases (U2d and IN2d), splitting the fertilizer increased both grain and aerial biomass N concentration, probably because of larger N losses due to the longest presence of the N under available forms than in the one dressing treatments.

4.3. Urease Activity

The urease activity analysis presented interesting results as well. On the one hand, as expected, there was a decrease in the urease activity in the IN treatments (larger at maize flowering and almost negligible at harvest), similar to the conclusions obtained by other authors [36,37]. However, on the other hand, there was a large increase in the urease activity in the sub-optimally irrigated treatments. It was not possible to establish a clear reason for this under this experimental design, but it could possibly be explained by the lower soil organic matter and urea hydrolysis rates during the cropping season under these sub-optimally irrigated treatments due to the water limitations and, after wetting for the urease activity measurement, there was a primer effect much like the one described by Quemada and Gabriel [9]. This effect could also be the reason for the higher urease activity observed at the bottom level of the soil profile. Finally, after maize harvest only, the IN1d treatment still presented lower surface urease activity than the unfertilized control. This could be a result of some larger effect on the soil microorganism population, probably due to the higher urease inhibitor concentration. At this rate, it seems that the soil was not able to recover even after four months. Further studies should be conducted in order to identify the real impact of the high concentrations of urease inhibitors on the soil.

4.4. N Use Efficiency Parameters

With respect to the N use efficiency parameters analyzed in this study, the AEN values were in range with 75% of the dataset observed by Ladha et al. [38] in a meta-analysis (between 15 and 33 kg grain kg N−1). However, the AEN value of the IN2d treatment was lower than this range, showing its deficiencies. Something similar happened with the REN. The NUE of the inputs introduced in the system was relatively high for all the treatments compared with other maize studies. This effect was probably induced by some soil N mining. This soil N mining can be observed in the control treatment, presenting a NUE larger than one. In this case, the N in the grain was 40% larger than the external N introduced with the irrigation water. Finally, Nsurplus presented the amount of N not computed in this balance (soil N mineralization, N losses by leaching or gas emission, and the N incorporated into the soil organic matter). We could see that there was a neutral balance in the control treatment, because the Nsurplus was close to zero, which meant that the soil N mineralization was in equilibrium with the loses for this maize N uptake. We could also explain the difference between IN1d and IN2d treatments (48.3 kg N ha−1) based on the N uptake by the crop (35.2 kg N ha−1). In addition, something similar happened between U1d and U2d treatments, with a difference in the Nsurplus between them of 16.6 kg N ha−1, similar to the 16.6 kg N ha−1 of difference on the N uptake between them. However, it was not clear the reason for the differences between U and IN treatments, and further studies are needed.
Attending to the Nmin movement along the profile observed between dates (planting, flowering, and harvest), we could expect lower NO3 loses in the IN treatments. Moreover, urease inhibitors are supposed to reduce NH3 gas emissions. As the NH4+ does not leach easily, there are only three reasons for the increase of the Nsurplus in the treatments fertilized with urease inhibitors: (i) urea leaching, (ii) urea fixation in the soil organic matter (inside live microorganisms or in the different dead organic matter pools), or (iii) a decrease in the mineralization rates. The increase of urea leaching in the IN treatments seems improbable because there was not a clear effect on the urease activity at greater depths, neither at flowering nor at harvest. Therefore, the more probable cause might be the increase of N in organic forms or a decrease in the N mineralization rate. This behavior is supported by the fact that insufficiently irrigated treatments showed, in general, larger Nsurplus than the optimally irrigated ones. More comprehensive studies should be carried out in order to better understand these processes, as, with these data and the experimental design, it was impossible to discriminate between both factors.
Finally, although similar N use efficiency and economic benefit indexes were observed for IN1d, U2d, and U1d during maize production, the differences increased after the complete maize-wheat study. In this case, the IN1d was presented as a win-win strategy, with the largest net economic benefit and the highest NUE (which also means a lower environmental impact), closely followed by the U2d and the U1d. It is likewise interesting to note that the differences with respect to the IN2d were also reduced. In this line, Kawakami et al. [39] also reported an improvement in the NUE after the use of urease inhibitors in sub-optimally urea fertilized cotton. Moreover, although the net economic benefit and N use efficiency rates decreased when water was limited, the IN treatments increased the win-win effect with respect to the same sub-optimally irrigated U treatments, increasing both the economic benefit and the N use efficiency. This is a very important finding, as one of the most significant effects of climate change will be rainfall reduction and increased water scarcity in arid and semiarid regions, much like the one presented in this study.

5. Conclusions

A single application of urease inhibitor (IN1d) coupled with the conventional urea can help to reduce the nitrate leaching risk both during the maize period (even when compared to the two dressing treatments) and after harvest. In addition, this improvement was achieved together with an increase in economic benefit, even when compared with the application of the same amount of regular urea split into two dressings. Moreover, the N efficiency parameters showed that it was not only the most efficient treatment studied, but also that the amount of fertilizer applied could be reduced in a larger proportion than in the others (as the larger Nsurplus suggests), and the number of dressings could be reduced from two to one. However, when the urea with the inhibitor was split in two dressings, the Nmin availability was uncoupled with the maize demand, reducing maize yield, and N use efficiency.
The inhibitor effect seemed to persist more than 100 days in the soil when the application rate was high, but it also seemed that the inhibitor presented a reduced movement capacity along the profile, reducing the risk of ground water contamination with these molecules. Finally, under low water availability systems, the benefits of applying urease inhibitors increased with respect to the application of regular urea, making this technique a very promising strategy for adaptation to climate change under arid and semiarid regions.
All the results observed in this study require further confirmation from additional experiments from different fields and laboratories to test not only the possible different behaviors, but also the different aspects that we were not able to demonstrate in this one.

Author Contributions

Conceptualization, J.L.G.; methodology, J.L.G. and D.M.-L.; formal analysis, J.L.G., M.A.P. and R.A.-M.; resources, J.L.G. and M.d.M.D.; data curation, J.L.G., M.A.P. and R.A.-M.; writing—original draft preparation, J.L.G. and R.A.-M.; writing—review and editing, J.L.G., R.A.-M., D.M.-L., and M.d.M.D.; visualization, J.L.G. and R.A.-M.; supervision, J.L.G.; project administration, J.L.G.; funding acquisition, J.L.G. and M.d.M.D. All authors have read and agreed to the published version of the manuscript.

Funding

This work was funded by the Ministry of Science and Innovation (AGL2017-83283-C2-1/2-R), the Community of Madrid (AGRISOST-CM S2018/BAA-4330), and European Structural funding 2014-2020 (ERDF y ESF).

Institutional Review Board Statement

It does not apply.

Informed Consent Statement

It does not apply.

Data Availability Statement

It does not apply.

Acknowledgments

The authors wish to thank the work done by La Canaleja field staff (David Sanmartín and José Silveria) and the laboratory staff (Mar Albarrán and Álvaro Moreno).

Conflicts of Interest

The authors declare no conflict of interest. The funders had no role in the design of the study; in the collection, analyses, or interpretation of data; in the writing of the manuscript, or in the decision to publish the results.

References

  1. Sigurdarson, J.J.; Svane, S.; Karring, H. The molecular processes of urea hydrolysis in relation to ammonia emissions from agriculture. Rev. Environ. Sci. Biotechnol. 2018, 17, 241–258. [Google Scholar] [CrossRef] [Green Version]
  2. Heffer, P.; Prud’homme, M. Global Nitrogen Fertiliser Demand and Supply: Trend, Current Level and Outlook; International Fertilizer Association (IFA): Melbourne, VIC, Australia, 2016; pp. 4–8. [Google Scholar]
  3. Artola, E.; Cruchaga, S.; Ariz, I.; Moran, J.F.; Garnica, M.; Houdusse, F.; Mina, J.M.G.; Irigoyen, I.; Lasa, B.; Aparicio-Tejo, P.M. Effect of N-(n-butyl) thiophosphoric triamide on urea metabolism and the assimilation of ammonium by Triticum aestivum L. Plant Growth Regul. 2011, 63, 73–79. [Google Scholar] [CrossRef]
  4. Chien, S.H.; Prochnow, L.I.; Cantarella, H. Chapter 8 Recent Developments of Fertilizer Production and Use to Improve Nutrient Efficiency and Minimize Environmental Impacts. Adv. Agron. 2009, 102, 267–322. [Google Scholar]
  5. Kissel, D.E.; Cabrera, M.L.; Paramasivam, S. Ammonium, Ammonia, and Urea Reactions in Soils. In Nitrogen in Agricultural Systems; Schepers, J.S., Raun, W.R., Eds.; American Society of Agronomy: Madison, WI, USA; John Wiley and Sons, Ltd.: Hoboken, NJ, USA, 2008; Volume 49, pp. 101–155. [Google Scholar]
  6. Bouwman, A.F.; Boumans, L.J.M.; Batjes, N.H. Estimation of global NH3 volatilization loss from synthetic fertilizers and animal manure applied to arable lands and grasslands. Glob. Biogeochem. 2002, 16, 8-1–8-14. [Google Scholar]
  7. Cantarella, H.; Mattos, D.; Quaggio, J.A.; Rigolin, A.T. Fruit yield of Valencia sweet orange fertilized with different N sources and the loss of applied N. Nutr. Cycl. Agroecosyst. 2003, 67, 215–223. [Google Scholar] [CrossRef]
  8. Cameron, K.C.; Di, H.J.; Moir, J.L. Nitrogen losses from the soil/plant system: A review. Ann. Appl. Biol. 2013, 162, 145–173. [Google Scholar] [CrossRef]
  9. Quemada, M.; Gabriel, J.L. Approaches for increasing nitrogen and water use efficiency simultaneously. Glob. Food Sec. 2016, 9, 29–35. [Google Scholar] [CrossRef] [Green Version]
  10. Davies, B.; Coulter, J.A.; Pagliari, P.H. Timing and rate of nitrogen fertilization influence maize yield and nitrogen use efficiency. PLoS ONE. 2020, 15. [Google Scholar] [CrossRef]
  11. Follmer, C. Insights into the role and structure of plant ureases. Phytochemistry 2008, 69, 18–28. [Google Scholar] [CrossRef]
  12. Abalos, D.; Sanz-Cobena, A.; Misselbrook, T.; Vallejo, A. Meta-analysis of the effect of urease and nitrification inhibitors on crop productivity and nitrogen use efficiency. Agric. Ecosyst. Environ. 2014, 189, 136–144. [Google Scholar] [CrossRef]
  13. Silva, A.G.B.; Sequeira, C.H.; Sermarini, R.A.; Otto, R. Urease Inhibitor NBPT on Ammonia Volatilization and Crop Productivity: A Meta-Analysis. Agron. J. 2017, 109, 1–13. [Google Scholar] [CrossRef]
  14. Song, Y.; Li, J.; Liu, M.; Meng, Z.; Liu, K.; Sui, N. Nitrogen increases drought tolerance in maize seedlings. Funct. Plant Biol. 2019, 46, 350–359. [Google Scholar] [CrossRef]
  15. Food and Agriculture Organization of the United Nations (FAO). FAOSTAT Database; Food and Agriculture Organization of the United Nations (FAO): Rome, Italy, 2019. [Google Scholar]
  16. USDA-Natural Resources Conservation Service. Soil Survey Staff, Keys to Soil Taxonomy, 12th ed.; USDA-Natural Resources Conservation Service: Washington, DC, USA, 2014.
  17. IUSS Working Group WRB. World Reference Base for Soil Resources 2006; IUSS Working Group WRB: Rome, Italy, 2007. [Google Scholar]
  18. Gabriel, J.L.; Zarco-Tejada, P.J.; López-Herrera, P.J.; Pérez-Martín, E.; Alonso-Ayuso, M.; Quemada, M. Airborne and ground level sensors for monitoring nitrogen status in a maize crop. Biosyst. Eng. 2017, 160, 124–133. [Google Scholar] [CrossRef]
  19. Quemada, M.; Gabriel, J.L.; Zarco-Tejada, P. Airborne hyperspectral images and ground-level optical sensors as assessment tools for maize nitrogen fertilization. Remote Sens. 2014, 6, 2940–2962. [Google Scholar] [CrossRef] [Green Version]
  20. Allen, R.G.; Pereira, L.S.; Raes, D.; Smith, M. Crop Evapotranspiration—Guidelines for Computing Crop Water Requirements-FAO Irrigation and Drainage Paper 56; FAO: Rome, Italy, 1998. [Google Scholar]
  21. Martínez-Cob, A. Use of thermal units to estimate corn crop coefficients under semiarid climatic conditions. Irrig. Sci. 2008, 26, 335–345. [Google Scholar] [CrossRef] [Green Version]
  22. Tremblay, N.; Wang, Z.; Cerovic, Z.G. Sensing crop nitrogen status with fluorescence indicators. A review. Agron. Sustain. Dev. 2012, 32, 451–464. [Google Scholar] [CrossRef] [Green Version]
  23. Cerovic, Z.G.; Masdoumier, G.; Ghozlen, N.B.; Latouche, G. A new optical leaf-clip meter for simultaneous non-destructive assessment of leaf chlorophyll and epidermal flavonoids. Physiol. Plant. 2012, 146, 251–260. [Google Scholar] [CrossRef]
  24. Gabriel, J.L.; Quemada, M.; Alonso-Ayuso, M.; Lizaso, J.I.; Martín-Lammerding, D. Predicting N status in maize with clip sensors: Choosing sensor, leaf sampling point, and timing. Sensors 2019, 19, 3881. [Google Scholar] [CrossRef] [PubMed] [Green Version]
  25. Keeney, D.R.; Nelson, D.W. Nitrogen—Inorganic Forms. In Methods of Soil Analysis; John Wiley and Sons, Ltd: Hoboken, NJ, USA, 1983; pp. 643–698. [Google Scholar]
  26. Solorzano, L. Determination of ammonia in natural waters by the phenolhypoclorite method. Limnol. Ocean. 1969, 14, 799–801. [Google Scholar]
  27. Kandeler, E.; Gerber, H. Short-term assay of soil urease activity using colorimetric determination of ammonium. Biol. Fertil. Soils. 1988, 6, 68–72. [Google Scholar] [CrossRef]
  28. Alonso-Ayuso, M.; Gabriel, J.L.; Quemada, M. Nitrogen use efficiency and residual effect of fertilizers with nitrification inhibitors. Eur. J. Agron. 2016, 80, 1–8. [Google Scholar] [CrossRef] [Green Version]
  29. MAPA. Boletínes Mensuales y anuarios de Estadística; Ministerio de Agricultura, Pesca y Alimentación: Madrid, Spain, 2021. (In Spanish)
  30. Abalos, D.; Sanz-Cobena, A.; Misselbrook, T.; Vallejo, A. Effectiveness of urease inhibition on the abatement of ammonia, nitrous oxide and nitric oxide emissions in a non-irrigated Mediterranean barley field. Chemosphere 2012, 89, 310–318. [Google Scholar] [CrossRef]
  31. Sanz-Cobena, A.; Sánchez-Martín, L.; García-Torres, L.; Vallejo, A. Gaseous emissions of N2O and NO and NO3- leaching from urea applied with urease and nitrification inhibitors to a maize (Zea mays) crop. Agric. Ecosyst. Environ. 2012, 149, 64–73. [Google Scholar] [CrossRef]
  32. Sanz-Cobena, A.; García-Marco, S.; Quemada, M.; Gabriel, J.L.; Almendros, P.; Vallejo, A. Do cover crops enhance N2O, CO2 or CH4 emissions from soil in Mediterranean arable systems? Sci. Total Environ. 2014, 466–467, 164–174. [Google Scholar] [CrossRef] [Green Version]
  33. Martins, M.R.; Sant’Anna, S.A.C.; Zaman, M.; Santos, R.C.; Monteiro, R.C.; Alves, B.J.R.; Jantalia, C.P.; Boddey, R.M.; Urquiaga, S. Strategies for the use of urease and nitrification inhibitors with urea: Impact on N2O and NH3 emissions, fertilizer-15 N recovery and maize yield in a tropical soil. Agric. Ecosyst. Environ. 2017, 247, 54–62. [Google Scholar] [CrossRef]
  34. Rozas, H.S.; Echeverría, H.E.; Studdert, G.A.; Andrade, F.H. No-till maize nitrogen uptake and yield: Effect of urease inhibitor and application time. Agron. J. 1999, 91, 950–955. [Google Scholar] [CrossRef]
  35. Passioura, J.B.; Angus, J.F. Improving Productivity of Crops in Water-Limited Environments. Adv. Agron. 2010, 106, 37–75. [Google Scholar]
  36. Soares, J.R.; Cantarella, H.; Menegale, M.L.C. Ammonia volatilization losses from surface-applied urea with urease and nitrification inhibitors. Soil Biol. Biochem. 2012, 52, 82–89. [Google Scholar] [CrossRef]
  37. Dawar, K.; Zaman, M.; Rowarth, J.S.; Blennerhassett, J.; Turnbull, M.H. The impact of urease inhibitor on the bioavailability of nitrogen in urea and in comparison with other nitrogen sources in ryegrass (Lolium perenne L.). Crop Pasture Sci. 2010, 61, 214–221. [Google Scholar] [CrossRef]
  38. Ladha, J.K.; Pathak, H.; J. Krupnik, T.; Six, J.; van Kessel, C. fficiency of Fertilizer Nitrogen in Cereal Production: Retrospects and Prospects. Adv. Agron. 2005, 87, 85–156. [Google Scholar]
  39. Kawakami, E.M.; Oosterhuis, D.M.; Snider, J.L.; Mozaffari, M. Physiological and yield responses of field-grown cotton to application of urea with the urease inhibitor NBPT and the nitrification inhibitor DCD. Eur. J. Agron. 2012, 43, 147–154. [Google Scholar] [CrossRef]
Figure 1. (a) Chlorophyll (Chl), (c) flavonol (Flav), (d) anthocyanins (Anth), and (b) NBI indexes (dimensionless) estimated with the Dualex® for the different treatments along the maize cycle. Arrows represent the two fertilizer dressings. Bars represent the standard error. Treatments were a combination of urease inhibitor use (In), simple urea use (U), or no fertilizer (C), with fertilizer application in one (1 d) or two (2 d) dressings and optimally irrigated (100%) or sub-optimally irrigated (75%).
Agriculture 11 00684 g001
Figure 2. (a) Maize grain yield (dry matter), (b) aerial biomass (dry matter), (c) height and (d) N uptake for the different fertilization and irrigation treatments. Letters indicate statistical differences between treatments (p < 0.05). Treatments were a combination of urease inhibitor use (In), simple urea use (U), or no fertilizer (C), with fertilizer application in one (1 d) or two (2 d) dressings and optimally irrigated (100%) or sub-optimally irrigated (75%).
Agriculture 11 00684 g002
Figure 3. (a) Combined effects of urease inhibitor use and irrigation intensity in plant height and (b) combined effects of inhibitor use, irrigation intensity (100% or 75%), and number of dressings in %N in grain. In the %N in grain plot. Significant differences among treatments are indicated by the letters a, ab and b. * indicates significant differences (p < 0.05) with the sub-optimally irrigated control (C75%) treatment. # indicates significant differences (p < 0.05) with the In2d, 75% treatment.
Agriculture 11 00684 g003
Figure 4. (a) NDVI and (b) NDRE indexes estimated with the RapidScan® in the different treatments along the wheat cycle. Bars represent the standard error. Treatments were a combination of urease inhibitor use (In), simple urea use (U), or no fertilizer (C), with fertilizer application in one (1 d) or two (2 d) dressings and optimally irrigated (100%) or sub-optimally irrigated (75%).
Agriculture 11 00684 g004
Figure 5. (a) Wheat grain yield (dry matter), (b) N concentration in grain, and (c) N uptake in grain for the different treatments. Bars represent the standard error. Letters indicate statistical differences between treatments (p < 0.05). Treatments were a combination of urease inhibitor use (In), simple urea use (U), or no fertilizer (C), with fertilizer application in one (1 d) or two (2 d) dressings and optimally irrigated (100%) or sub-optimally irrigated (75%).
Agriculture 11 00684 g005
Figure 6. Soil mineral N content ((a,d,g) NO3, (b,e,h) NH4, and (c,f,i) Nmin = NO3 + NH4) along the soil profile at different crop stages ((ac) flowering, (df) maize harvest and (gi) wheat harvest). Bars represent the standard error. Treatments were a combination of urease inhibitor use (In), simple urea use (U), or no fertilizer (C), with fertilizer application in one (1 d) or two (2 d) dressings and optimally irrigated (100%) or sub-optimally irrigated (75%).
Agriculture 11 00684 g006
Figure 7. Soil urease activity along the soil profile at maize (a) flowering and (b) harvest. Bars represent the standard error. Treatments were a combination of urease inhibitor use (In), simple urea use (U), or no fertilizer (C), with fertilizer application in one (1 d) or two (2 d) dressings and optimally irrigated (100%) or sub-optimally irrigated (75%).
Agriculture 11 00684 g007
Table 1. Soil physical-chemical properties at the beginning of the experiment.
0–20 cm20–40 cm40–60 cm60–80 cm80–100 cm
ApBwk1Bwk1Bwk2Bwk2
Sand (%; 2–0.05 mm)66.260.260.257.757.7
Silt (%; 0.05–0.002 mm)20.317.317.324.024.0
Clay (%; <0.002 mm)13.522.522.518.318.3
Stones (%)<1<1<1<1<1
pH7.937.877.968.218.42
EC (dS m−1)0.0870.0710.090.1040.1
C/N8.568.437.728.318.11
K (kg K2O ha−1)691.5440.7393.3369.5325.5
P (kg P2O5 ha−1)80.66145.230.836.1
N-NH4 (kg N ha−1)9.99.38.87.47.5
N-NO3 (kg N ha−1)33.228.819.91513.4
Ca (kg CaO ha−1)11,23612,77913,52318,33817,606
Mg (kg MgO ha−1)1830155410271023981
Table 2. The p-value for different factors in relation to its effect on the different measured variables. Significant differences among treatments in reference to a specific factor were highlighted in bold and with the letters α (p < 0.01), β (p < 0.05), and γ (p < 0.10). * indicates interaction between factors.
FigureGrain YieldAerial BiomassHeightGrain N ConcentrationAerial Biomass N ConcentrationGrain Nuptake Aerial Biomass Nuptake
No. of dressings (Dress)0.037 β0.005 α0.1910.002 α0.099 γ0.002 α0.049 β
Urease inhibitor (UI)0.8440.4580.8130.8320.8910.9860.700
Irrigation (Irr)0.001 α0.002 α0.003 α0.9920.2040.001 α0.322
Dress * UI0.2220.9620.2120.9590.6600.1260.681
Dress * Irr0.6580.8840.6110.015 β0.4370.2250.708
UI * Irr0.4290.5200.055 γ0.1570.2660.1710.188
Dress * UI * Irr0.8670.2410.4610.029 β0.7230.2020.749
Table 3. N concentration and N uptake in grain and aerial biomass from optimal (100%) and sub-optimally (75%) irrigated maize. Letters indicate statistical differences between treatments (p < 0.05). Treatments were a combination of urease inhibitor use (In), simple urea use (U), or no fertilizer (C), with fertilizer application in one (1 d) or two (2 d) dressings and optimally irrigated (100%) or sub-optimally irrigated (75%).
TreatmentIrrigationGrain N Concentration (%)Aerial Biomass N Concentration (%)Nuptake in Grain (kg N ha−1)Nuptake in Aerial Biomass (kg N ha−1)
U1d100%1.403 abc0.463197.5 abc54.1
75%1.290 bcd0.358110.5 de32.9
U2d100%1.383 abc0.517204.9 ab62.0
75%1.380 abc0.601117.5 de43.8
IN1d100%1.451 ab0.389218.6 a46.3
75%1.223 bcde0.471134.4 cd41.1
IN2d100%1.143 cde0.432143.2 bcd43.1
75%1.595 a0.614133.2 cd50.5
C100%1.098 de0.340104.0 de27.1
75%0.963 e0.41558.1 e19.2
Table 4. Nitrogen efficiency parameters. Treatments were a combination of urease inhibitor use (In), simple urea use (U), or no fertilizer (C), with fertilizer application in one (1 d) or two (2 d) dressings and optimally irrigated (100%) or sub-optimally irrigated (75%).
U1d100%U1d75%U2d100%U2d75%In1d100%In1d75%In2d100%In2d75%C100%C75%
Maize period
AEN (kggrain kgN−1)18.310.720.710.721.920.611.910.20.00.0
REN0.470.280.530.360.520.420.220.450.00.0
NUE0.770.470.800.500.850.570.560.571.210.90
Nsurplus (kg N ha−1)52.0169.036.5151.467.486.4135.1115.336.561.0
Maize and wheat period
AEN (kggrain kgN−1)19.210.421.89.222.618.914.210.30.00.0
REN0.480.300.550.370.530.420.270.490.000.00
NUE0.840.630.890.660.920.720.670.751.231.24
Nsurplus (kg N ha−1)30.794.7−4.065.428.678.285.642.8−8.38.1
Table 5. Economic analysis. Treatments were a combination of urease inhibitor use (In), simple urea use (U), or no fertilizer (C), with fertilizer application in one (1 d) or two (2 d) dressings and optimally irrigated (100%) or sub-optimally irrigated (75%).
Total Cost (EUR ha−1)Maize Yield (kg 14% ha−1)Maize Incomes (EUR ha−1)Total Maize Benefit
(EUR ha−1)
Wheat Yield
(kg 11% ha−1)
Wheat Incomes
(EUR ha−1)
Total Maize + Wheat Benefit (EUR ha−1)
U1d100%259.38161482809.842550.462072383.252933.71
U1d75%259.3897641698.951439.582143396.411835.99
U2d100%264.38168662934.742670.362157399.133069.49
U2d75%264.3897651699.051434.681831338.721773.40
IN1d100%277.8817,1972992.362714.482080384.813099.29
IN1d75%277.8812,4242161.831883.951904352.222236.17
IN2d100%282.8814,2822485.052202.182356435.952638.13
IN2d75%282.8896401677.331394.462242414.761809.21
C100%0.0010,8131881.441881.441429264.392145.83
C75%0.0069101202.361202.362069382.811585.17
Publisher’s Note: MDPI stays neutral with regard to jurisdictional claims in published maps and institutional affiliations.

