Article

Energy Assessment of Sorghum Cultivation in Southern Ukraine

1
Belt and Road Initiative Institute for Chinese-European Studies, Guangdong University of Petrochemical Technology, Maoming 525000, China
2
Department of Tractors and Agricultural Machinery, Operating and Maintenance, Mykolayiv National Agrarian University, 54020 Mykolaiv, Ukraine
3
Department of Crop and Horticulture, Mykolayiv National Agrarian University, 54020 Mykolaiv, Ukraine
4
Department of Economics and Finance, Odesa National Maritime University, 65029 Odesa, Ukraine
5
SCIRE Foundation, 00867 Warsaw, Poland
*
Author to whom correspondence should be addressed.
Agriculture 2021, 11(8), 695; https://doi.org/10.3390/agriculture11080695
Submission received: 5 June 2021 / Revised: 21 July 2021 / Accepted: 22 July 2021 / Published: 23 July 2021

Abstract

:
Global climate changes and fossil fuel reserve depletion are drivers for the search for environmentally friendly renewable energy sources. In Europe, biomass represents the main alternative to fossil fuels. Among energy crops, sorghum is a promising crop for arid regions. The biomass yield and energy efficiency of sorghum (both silage and grain) were studied based on field experiments conducted in Southern Ukraine. The following climate changes were identified: an increase in temperature and a decrease in precipitation. The total energy inputs for sweet sorghum were estimated at 11.256 GJ/ha. The main contributors to the energy inputs are mineral fertilizers (56.99%). The experiment showed that a yield of 40.6 t/ha could be achieved with annual precipitation of 350 mm. The energy efficiency ratio was determined to be 11.18. The total energy inputs for grain sorghum was 16.081 GJ/ha. Its yield (grain) varied from 1.92 to 7.05 t/ha. The energy efficiency ratio of grain sorghum ranged from 2.8 to 16.7.

1. Introduction

Energy demand is increasing due to population growth and improved living standards. This has resulted in an increase in global pollution and a reduction in fossil energy resources. Natural energy resources should be used effectively to mitigate the above negative effects. Moreover, the share of renewable energy should be of a high proportion [1,2,3]. On the whole, the use of renewable energy may be a viable option. This decision could meet energy requirements and simultaneously reduce harmful emissions, including carbon dioxide emissions [4,5].
Modern civilization is currently looking for renewable and environmentally friendly combustible energy resources [6]. Municipal and industrial waste, agricultural products, and by-products can be valuable energy sources for a sustainable energy future [7,8]. Organic raw materials can be used as feedstock for biofuel production.
The use of energy crops (such as maize, sorghum, etc.) as biofuel production feedstock compete with other food crops for arable land. It is possible to cultivate lignocellulosic plants on marginal lands to avoid competition for land. Some grasses (like miscanthus, switchgrass, foxtail millet, etc.) are suitable to be grown on marginal lands [9,10]. Lignocellulosic biomass is an alternative feedstock for bioethanol production [11]. Sorghum biomass (for example, sorghum bicolor) can be used as feedstock for lignocellulosic bioethanol production. Moreover, its average bioethanol yield exceeds yields for other lignocellulosic feedstock [12].
Biofuels are usually produced from biomass (energy crops, crop residues, animal waste, etc.), and they are viable energy sources. In EU countries, agricultural biomass is the primary energy resource in biofuel production [1,13,14].
Many studies have proven that plants that are grown for energy production reduce carbon dioxide emissions [1,2,13,15]. The most common biomass for biofuel (bioethanol, biogas, pellets, etc.) production are the following: corn (grain and silage), sugarcane, sugar beet, and sorghum (grain and silage) [16,17,18,19]. These crops have demonstrated great energy potential as substitutes for fossil fuels and abating greenhouse gas emissions.
Maize is a widespread crop that produces biofuels such as bioethanol and biomethane [20]. This crop has a relatively high biomass yield [21,22]. Moreover, maize is well adapted to monoculture [23]. However, this has a detrimental effect on soil degradation, lower yield, etc. [24]. Therefore, biorefineries should be supplied with different feedstock [22,25,26]. Crops must be a source of biomass and ensure the biodiversity of ecosystems [27,28]. Sorghum is a relative of maize [15]. However, unlike maize, this crop has better drought resistance and requires less fertilizer [29,30]. These features are gaining importance due to global climate change.
Sorghum is the alternative feedstock for biofuel production. It can be used for direct firing (electricity and heat generation), conversion to bioethanol (fermentation), and biomethane production (anaerobic digestion). Refs [31,32,33,34] proved that sweet sorghum could be efficiently converted into biogas and ethanol. Bioconversion was significantly improved with pretreatment. Wannasek et al. [35] highlighted that sorghum could be used as the main crop for biogas production since it has a high specific methane yield. Its methane yield is similar to maize silage.
Sorghum has several advantages compared to other energy crops. This crop is well adapted to drought, high air temperatures, and soil salinity. Wannasek et al. [35] confirmed (via experimental data) the drought resistance of this crop. Unlike other crops, sorghum has lower requirements for water and fertilizer per unit of biomass [36]. This is a significant factor, as energy crops must have a positive energy balance. Moreover, sorghum is a fast-growing crop. Therefore, it can be used in crop rotation, and the production of ethanol and biogas from sorghum minimizes competition with other food crops [37,38]. These properties of sorghum, combined with progressive agricultural technologies, make this crop a promising feedstock for biofuel production [39,40].
The energy efficiency of its cultivation depends on many factors such as cultivar, soil, climate conditions, agricultural practices, and both direct and indirect energy inputs [39]. Energy balance is a tool to determine the energy efficiency of any renewable resource [41,42]. High energy efficiency of biomass production is the basis for a sustainable energy system [43]. To determine the above efficiency, energy inputs and outputs must be taken into account and analyzed. Energy balance depends on crops and production systems. The energy efficiency of the production process is determined by the energy outputs to energy inputs ratio [44,45].
Sweet sorghum as an energy and fodder crop is of great practical interest for agriculture in general and especially for arid regions of Ukraine. Sorghum provides high yields in conditions of heat and drought. The positive properties of this crop include the fact that it is undemanding to the quality of soils [22,39].
The implementation of energy-saving sorghum production technology is important. This is a valuable crop for drought prone regions, which is typical for southern Ukraine. Moreover, sorghum is superior to corn in yield [46].
Ukraine has fertile soil and low population density. This makes Ukraine a large exporter of agricultural products [47,48]. Therefore, the country has great potential for developing bioenergy.
Many scientists have studied sorghum as a bioenergy crop. Morozova et al. [49] assessed methane yields from energy crops, including sweet sorghum. The impact of mean daily temperature and precipitation on sorghum yield was studied by Kiesel and Lewandowski [50], Zegada-Lizarazu et al. [51], Kotrla and Prčík [52], etc. An evaluation of different production systems was carried out by López-Sandin et al. [53]. Jankowski et al. [54] studied the energy balance of sorghum production in Poland. Energy input and output of sorghum growth as a bioenergy crop was evaluated by Ren et al. [55]. Sorghum as a feedstock for biofuel production studied by many researchers [56].
Sorghum is currently a rare crop in Ukraine. In 2019, its (grain sorghum) gross harvest was 192 thousand tons and its yield was 4.08 t/ha [46]. Sweet sorghum is produced in limited quantities.
Soil and climate conditions in the South of Ukraine are quite different compared to Western European countries, China, Mexico, etc. Ukraine is located in Eastern Europe. Its area is 603 thousand square kilometers. Farmers cultivate around 26 million hectares of arable land from around 41 million hectares of agricultural land.
The territory of Ukraine has been divided into five climate zones: Northern, Southern, Western, Eastern, and Central (Figure 1). The climate zones have similar weather conditions (temperature and precipitation). The boundaries of administrative units (oblasts) are shown within the climate zones [57,58,59].
Therefore, their experience cannot be applied to Ukraine. This stipulates for the study of sorghum growing in the specific warm and arid conditions of southern Ukraine. Moreover, little attention has been paid to the energy balance for sweet and grain sorghum.
The purpose of this study is to analyze the energy balance and to determine the energy efficiency ratio of growing sweet and grain sorghum in conditions of warm and droughty climates in the South of Ukraine. To achieve this purpose, the following goals were set up:
  • To trace changes in precipitation and mean daily temperature;
  • To carry out an energy analysis of sweet sorghum production;
  • To reveal the influence of external factors (precipitation, sowing date, plant density) on the energy efficiency of grain sorghum production.
This study is a continuation of the previous author’s study concerning energy analysis of biomass energy systems [60,61,62,63,64].

2. Materials and Methods

This study focuses on the assessment of the energy efficiency of sorghum production (both silage and grain) and proposes the use of an integrated methodology combining statistical analysis and performing field experiments. This methodology is based on the following steps: the analysis of climate conditions (precipitation and air temperature); the collection of field experiment data; the assessment of the energy inputs and outputs; calculation of energy efficiency ratio; the assessment of water use efficiency; and a correlation-regression analysis of a grain sorghum energy efficiency ratio.
Field experiments were carried out in the Mykolaiv and Kherson regions of Ukraine.

2.1. Field Experiment

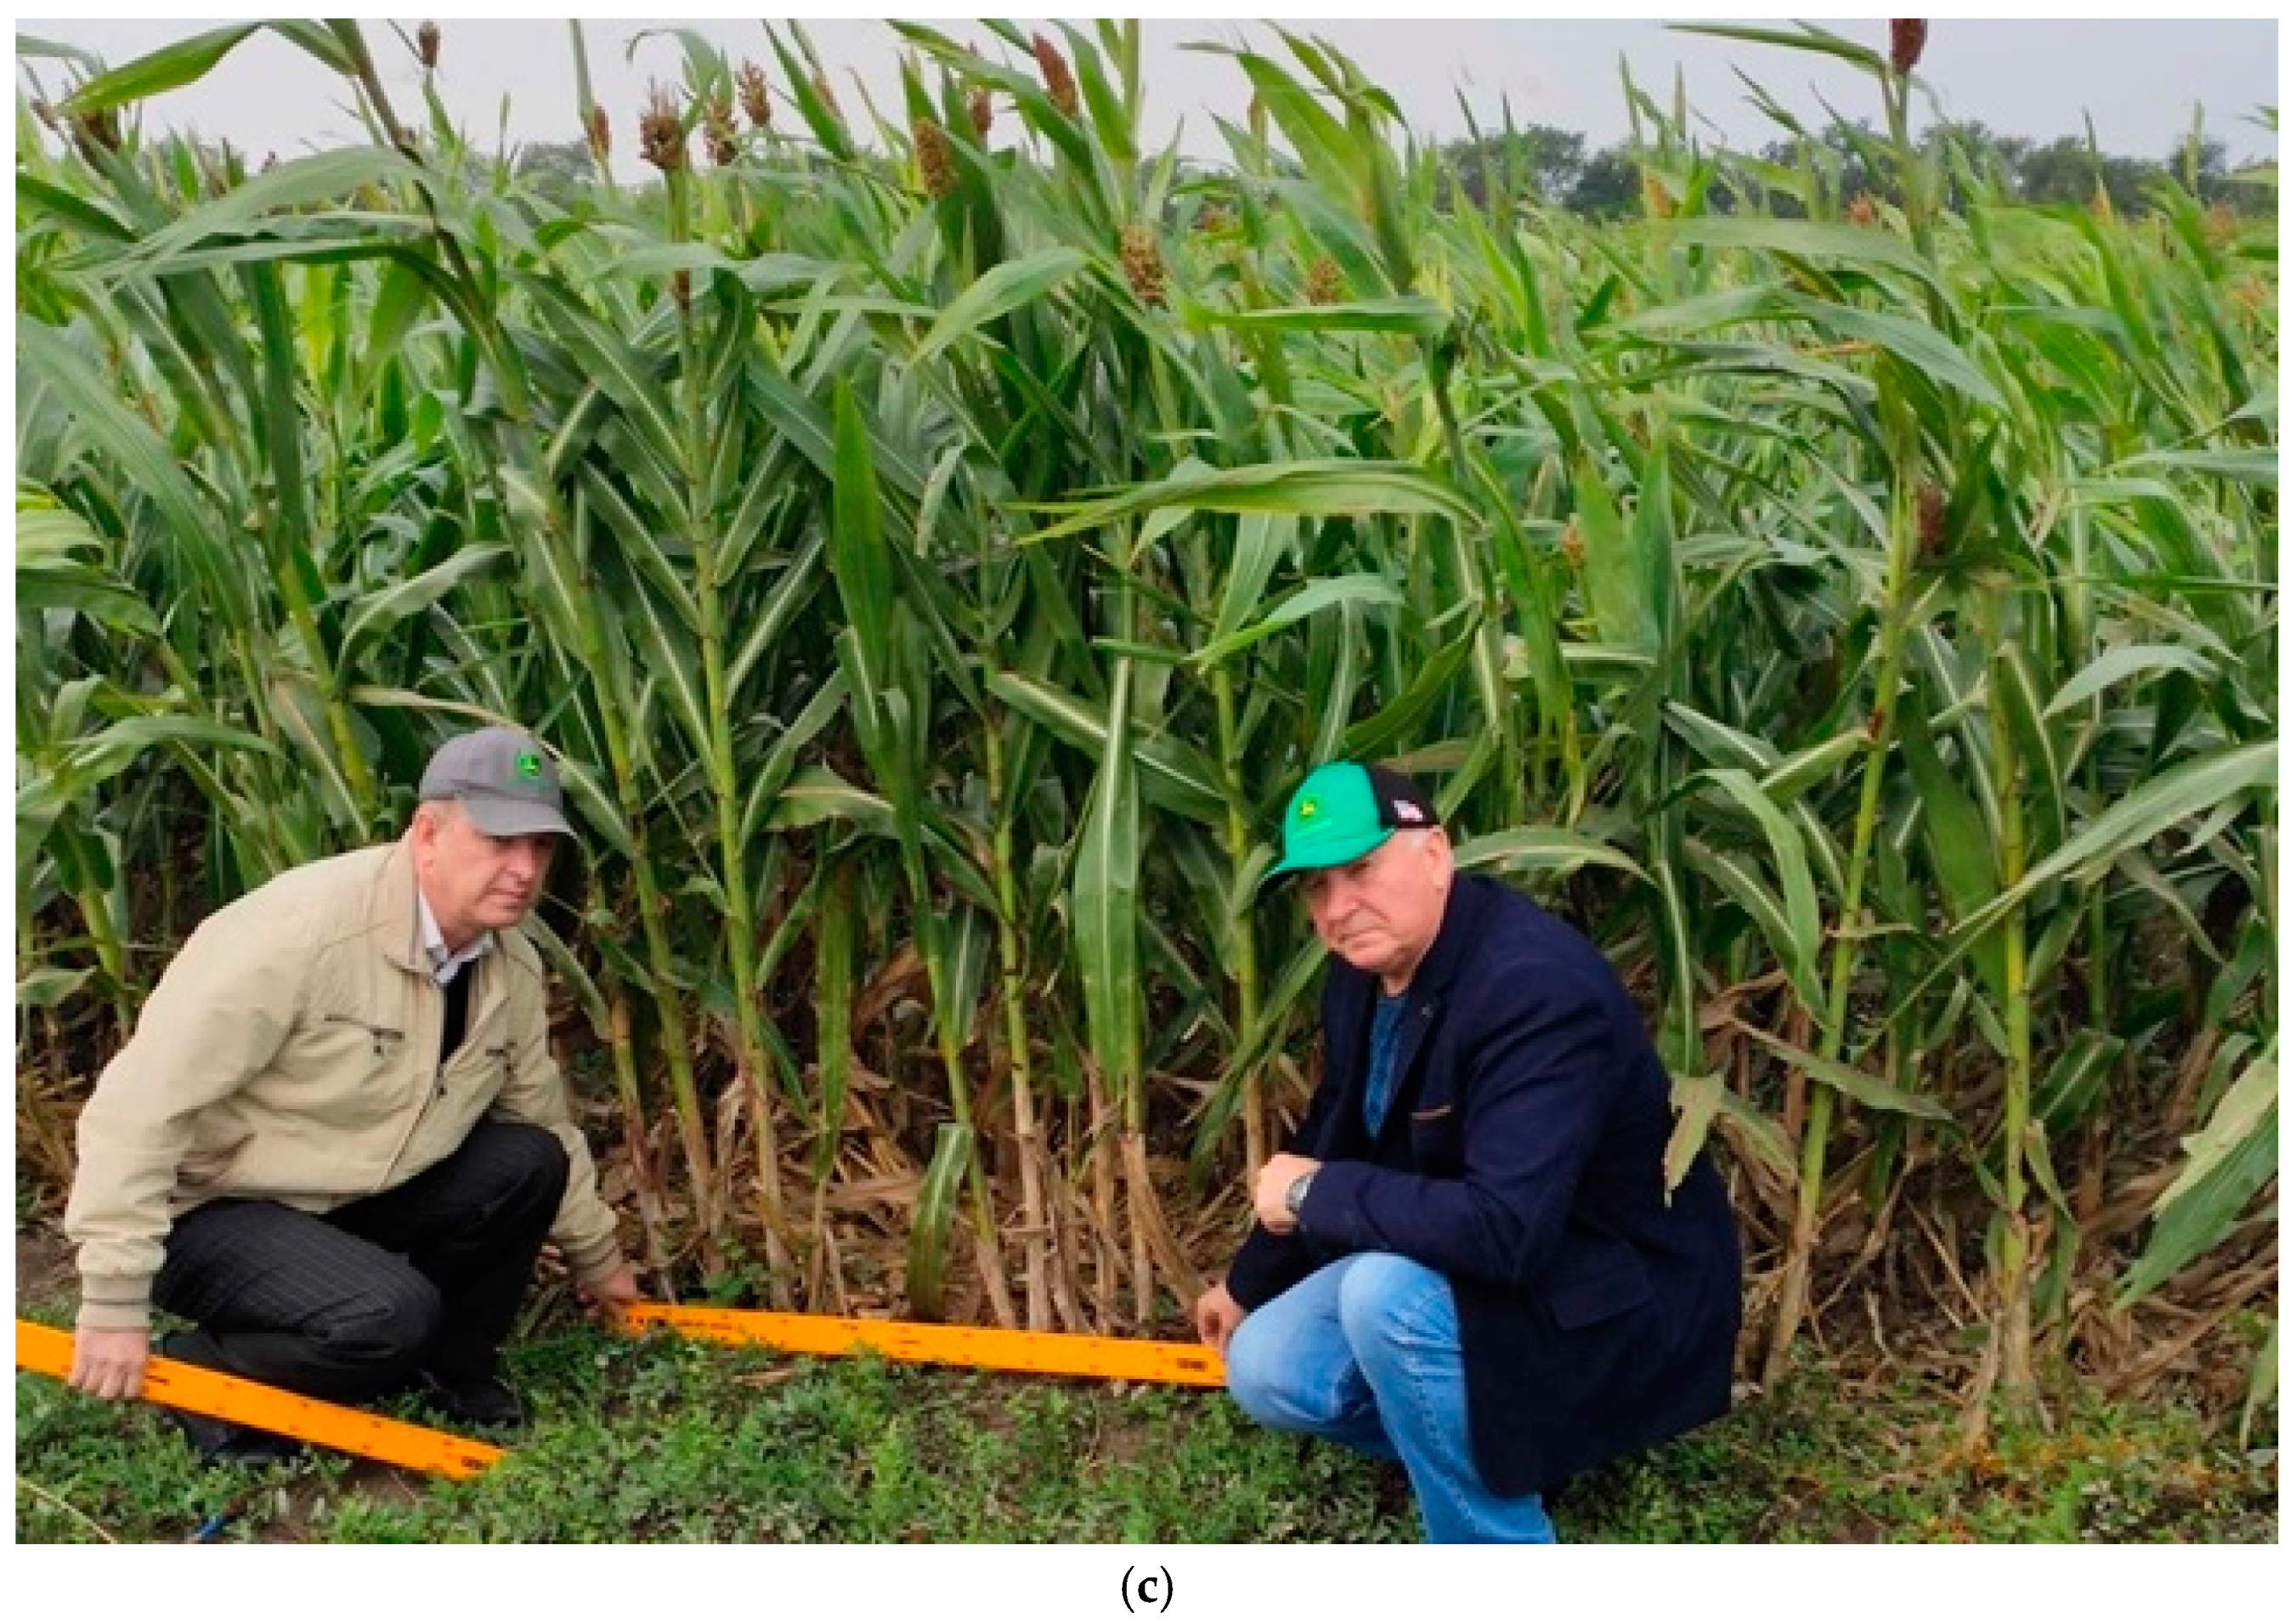
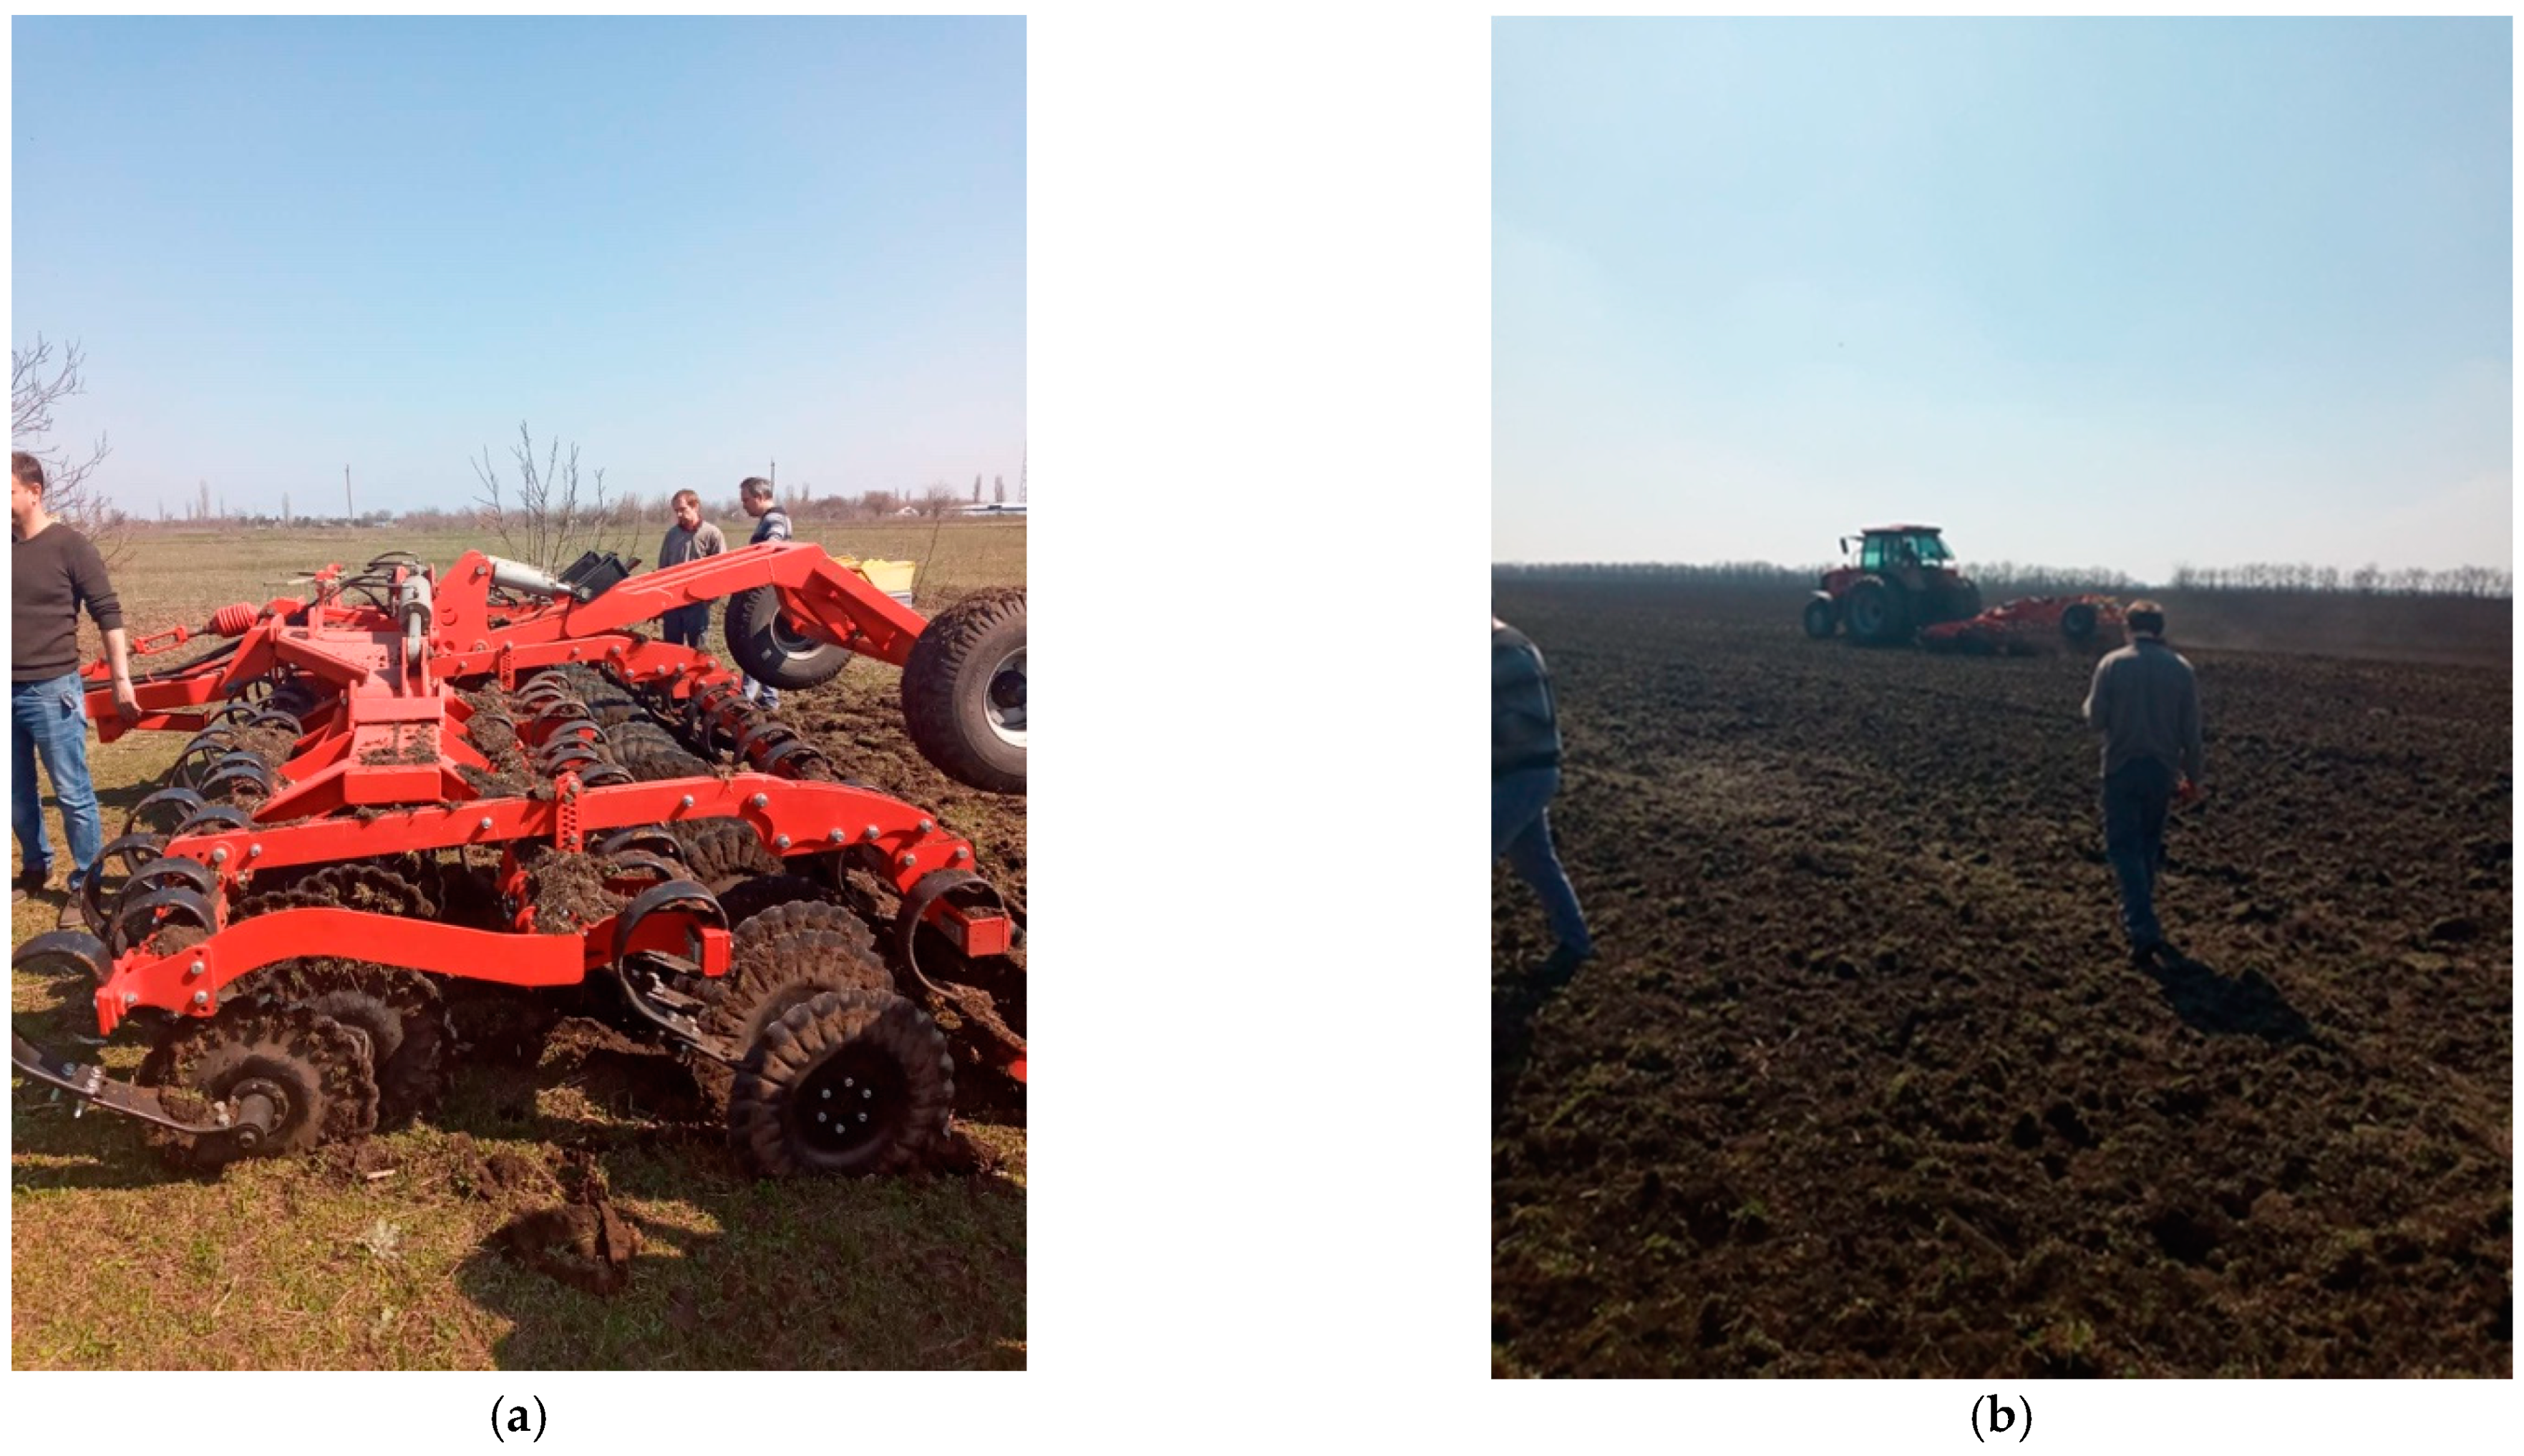
Field experiments were performed in the Mykolaiv and Kherson regions. Sweet sorghum was grown in the Mykolaiv region and grain sorghum was grown in the Kherson region (Figure 2).
The experiments were carried out in 2020 in the Mykolaiv region, Ukraine (46°58′06″ N; 31°42′39″ E). The experimental field had an area of 5 ha. The experiment had a randomized design with three replications. Winter wheat was a preceding crop for sweet sorghum. The pH of the soil was within the range from 6.8 to 7.2. Soil properties were found as follows: soil organic carbon, from 2.9 to 3.2 g·kg−1; phosphorus, from 31 to 38 mg·kg−1; and potassium, from 332 to 525 mg·kg−1. The bulk density of soil was 1400 kg·m−3. Sweet sorghum was cultivated following a conventional agricultural practice (Table 1).
Grain sorghum has been studied for three years. The experiments were performed in 2015-2018 in the Kherson region, Ukraine (46°38′03″ N; 32°26′20″ E). The experimental field had an area of 3 ha. Soil properties were found as follows: soil organic carbon, 2.34–2.9 g·kg−1; phosphorus, 49–65 mg·kg−1; and potassium, 280–360 mg·kg−1. The preceding crop was winter wheat too. The production of grain sorghum is presented in Table 2.
The experiments were carried out for three years on non-irrigated lands. A two-factor field experiment was established by the method of randomized split plots. All studies, observations, and sampling were performed in quadruplicate. The number of variants in the experiment was eight, the total number of plots was thirty-two. In the field experiment, we studied two factors. Factor A is the plant density, thousand units per ha: 100, 140, 180, and 220. Factor B is the sowing dates: early, at a soil temperature of 8-10 °C (the first decade of May) and late, at a soil temperature of 14–16 °C (the third decade of May).
During the three-year experiment, there has been a fluctuation in annual rainfall. Therefore, additionally, we investigated the third factor: how rainfall impacts yield and an energy efficiency ratio.

2.2. Energy Inputs

Total energy inputs include direct and indirect energy inputs. The indirect energy inputs are divided into two groups. The first one is the energy used for the production of fertilizers and chemicals such as herbicides, pesticides, fungicides, etc. The second group of indirect inputs is the energy used in the manufacturing of tractors, implements, and other farm machinery.
The total energy inputs are determined by the formula:
T E I = D E I + I D E I 1 + I D E I 2 + I D E I 3 ,   MJ / ha ,
where DEI is the direct energy inputs, MJ/ha; IDEI1 is the indirect energy inputs (embodied energy of technological materials such as fertilizers, seeds, pesticides, etc.), MJ/ha; IDEI2 is the indirect energy associated with the manufacturing of farm machinery, MJ/ha; and IDEI3 is the indirect energy associated with stationary equipment, MJ/ha.
The direct energy inputs are calculated by the following formula:
D E I = i = 1 n ( B i · E E Q f i ) + E E Q e · W ,   MJ / ha ,
where Bi is the liquid or gaseous fuel of ith type consumed by agricultural machinery, kg/ha; EEQfi is the energy equivalent of ith fuel, MJ/kg; W is the electricity consumption, kWh/ha; n is the number of fuels; and EEQe is the energy equivalent of electricity, MJ/kWh.
The Indirect energy inputs of the first group are:
I D E I 1 = j = 1 m ( M C i · E E Q C j ) ,   MJ / ha ,
where EEQCj is the energy equivalent of jth chemical (or fertilizer), MJ/kg; MCj is the mass consumption of jth chemical (or fertilizer), kg/ha; and m is the number of chemicals used by technological processes.
The indirect energy inputs of the second group are determined by manufacturing energy requirements for farm machinery such as tractors, combine harvesters, cultivators, etc. They depend on the following factors: a certain machinery mass, utilization lifetime, productivity, etc. The indirect energy inputs of the second group can be calculated by the formula:
I D E I 2 = k = 1 l ( E E Q M k · O M k U L T k · F C k ) ,   MJ / ha ,
where EEQMj is the energy equivalent of kth machinery, MJ/kg; OMk is the operation mass of kth machinery, kg; ULTk is the utilization lifetime of kth machinery, h; FCk is the operation field capacity of kth machinery, ha/h; and l is the number of farm machinery used for a certain crop growing.
Energy inputs of stationary technological operations are determined by their energy consumption. They are equal to:
I D E I 3 = E E Q F · F · a 100 · T · W h a ,   MJ / ha ,
where IDEI3 is the energy equivalent of production facilities, MJ/m2; F is the area of production premises, m2; a is the depreciation, %; T is the utilization time of the facilities per year, hours; and Wha is the productivity of stationary equipment per hour.
The capacity of stationary equipment is usually measured in tons per hour. Its productivity (in hectares per hour) is determined as follows:
W h a = W m R P ,   ha / h ,
where RP is the application rate of the material (for example, seed treatment before sowing), or crop yield (when processing products), t/ha; and Wm is the equipment capacity, t/h.
The calculations used energy equivalents listed in Table 3 [65,66,67,68,69,70,71,72].

2.3. Energy Output and Energy Efficiency

Energy output flow (EOF) of sweet sorghum production is the energy generated by a product. It is calculated as the production of calorific values of silage and a yield:
E O F = Y s i · L H V s i ,   MJ / ha ,
where LHVsi is the specific calorific value of silage, MJ/kg; and Ysi is the yield of silage, kg/ha.
For grain sorghum, the energy output flow is generated by a product (grain) and by-product (straw):
E O F = Y s · L H V s + Y g · L H V g ,   MJ / ha ,
where LHVs is the lower heating value of straw, MJ/kg; Ys is the yield of straw, kg/ha; LHVg is the lower heating value of grain, MJ/kg; and Yg is the yield of grain, kg/ha.
The energy efficiency ratio of technology is the ratio of the total energy outputs to the total energy inputs:
E E R = T E I E O F .

2.4. Measurement of Yield

Sorghum grain and silage yields were measured at harvest time. The yields were determined by the method of mechanized harvesting. Under this method, harvesting was carried out from a selective plot of the field, which is most typical. The yield is determined by the following formula:
Y s = 10 , 000 · M n 3 · B · L ,   t / ha ,
where MN is the mass of grain or silage from a plot, t; L is the length of a plot, m; and B is the combine header width, m.
The width is equal to a reaper width of a combine-harvester. A Claas Jaguar 830 was used to harvest sorghum silage. Sorghum grain was harvested by a Sampo 500.

2.5. Data Analysis

The results of the experiment were processed to determine energy indicators such as energy inputs, energy outputs, and energy efficiency ratio.
To study the relationship between random quantitative variables, a correlation-regression analysis was used. The correlation quantifies the strength of the linear relationship and regression expresses this relationship by an equation. This method was used to study the influence of external factors (precipitation, sowing date, and plant density) on a grain sorghum energy efficiency ratio. The built-in functions of MS Excel were used.

3. Results

3.1. Weather Conditions

Experiments on sweet sorghum cultivation were performed in the south of the Mykolaiv Region. According to long-term observations, there is a steady downward trend in annual rainfall (Figure 3) [73,74,75]. Thus, since 1970, they have decreased from 450 mm to 400 mm in 2019, i.e., by 12%. However, there are significant fluctuations in the range from 250 to 705 mm (Table 4). This must be taken into account when choosing hybrids and technology for their cultivation.
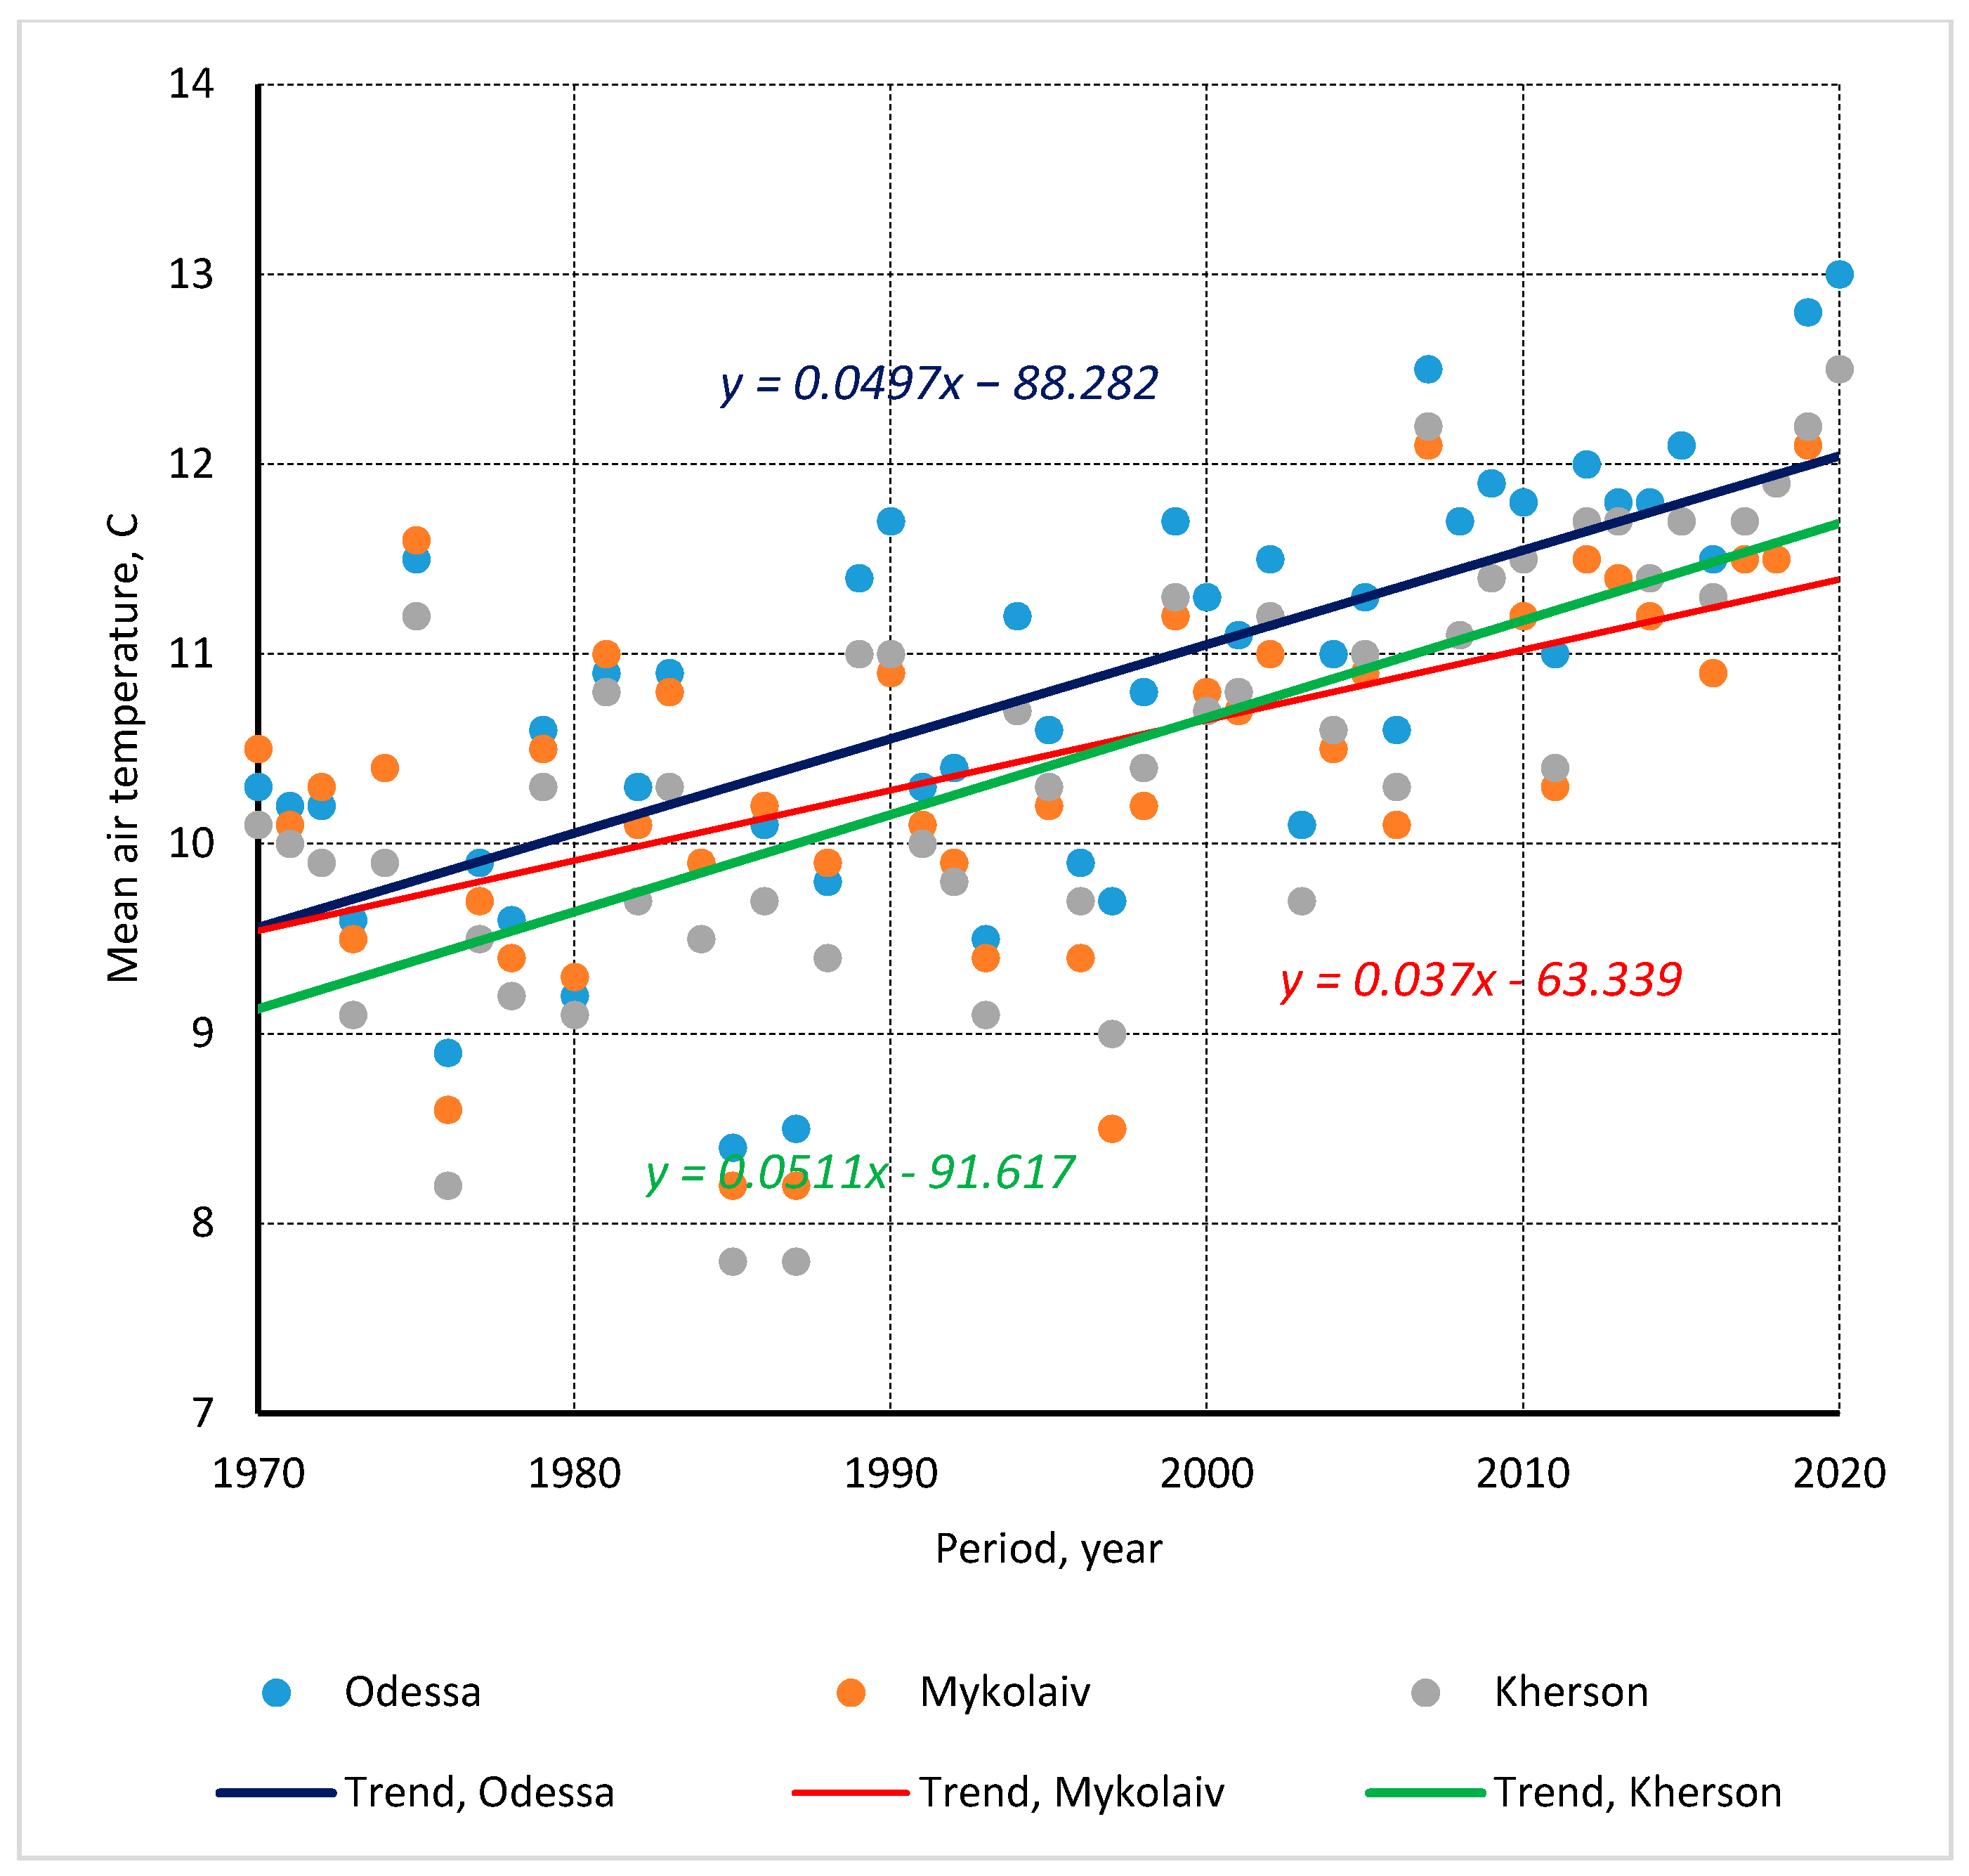
The average annual temperature tends to increase. Over the past 50 years, it has increased from 9.6 °C to 11.25 °C (i.e., by 17%) (Figure 4, Table 5) [73]. Therefore, energy crops must be drought resistant.
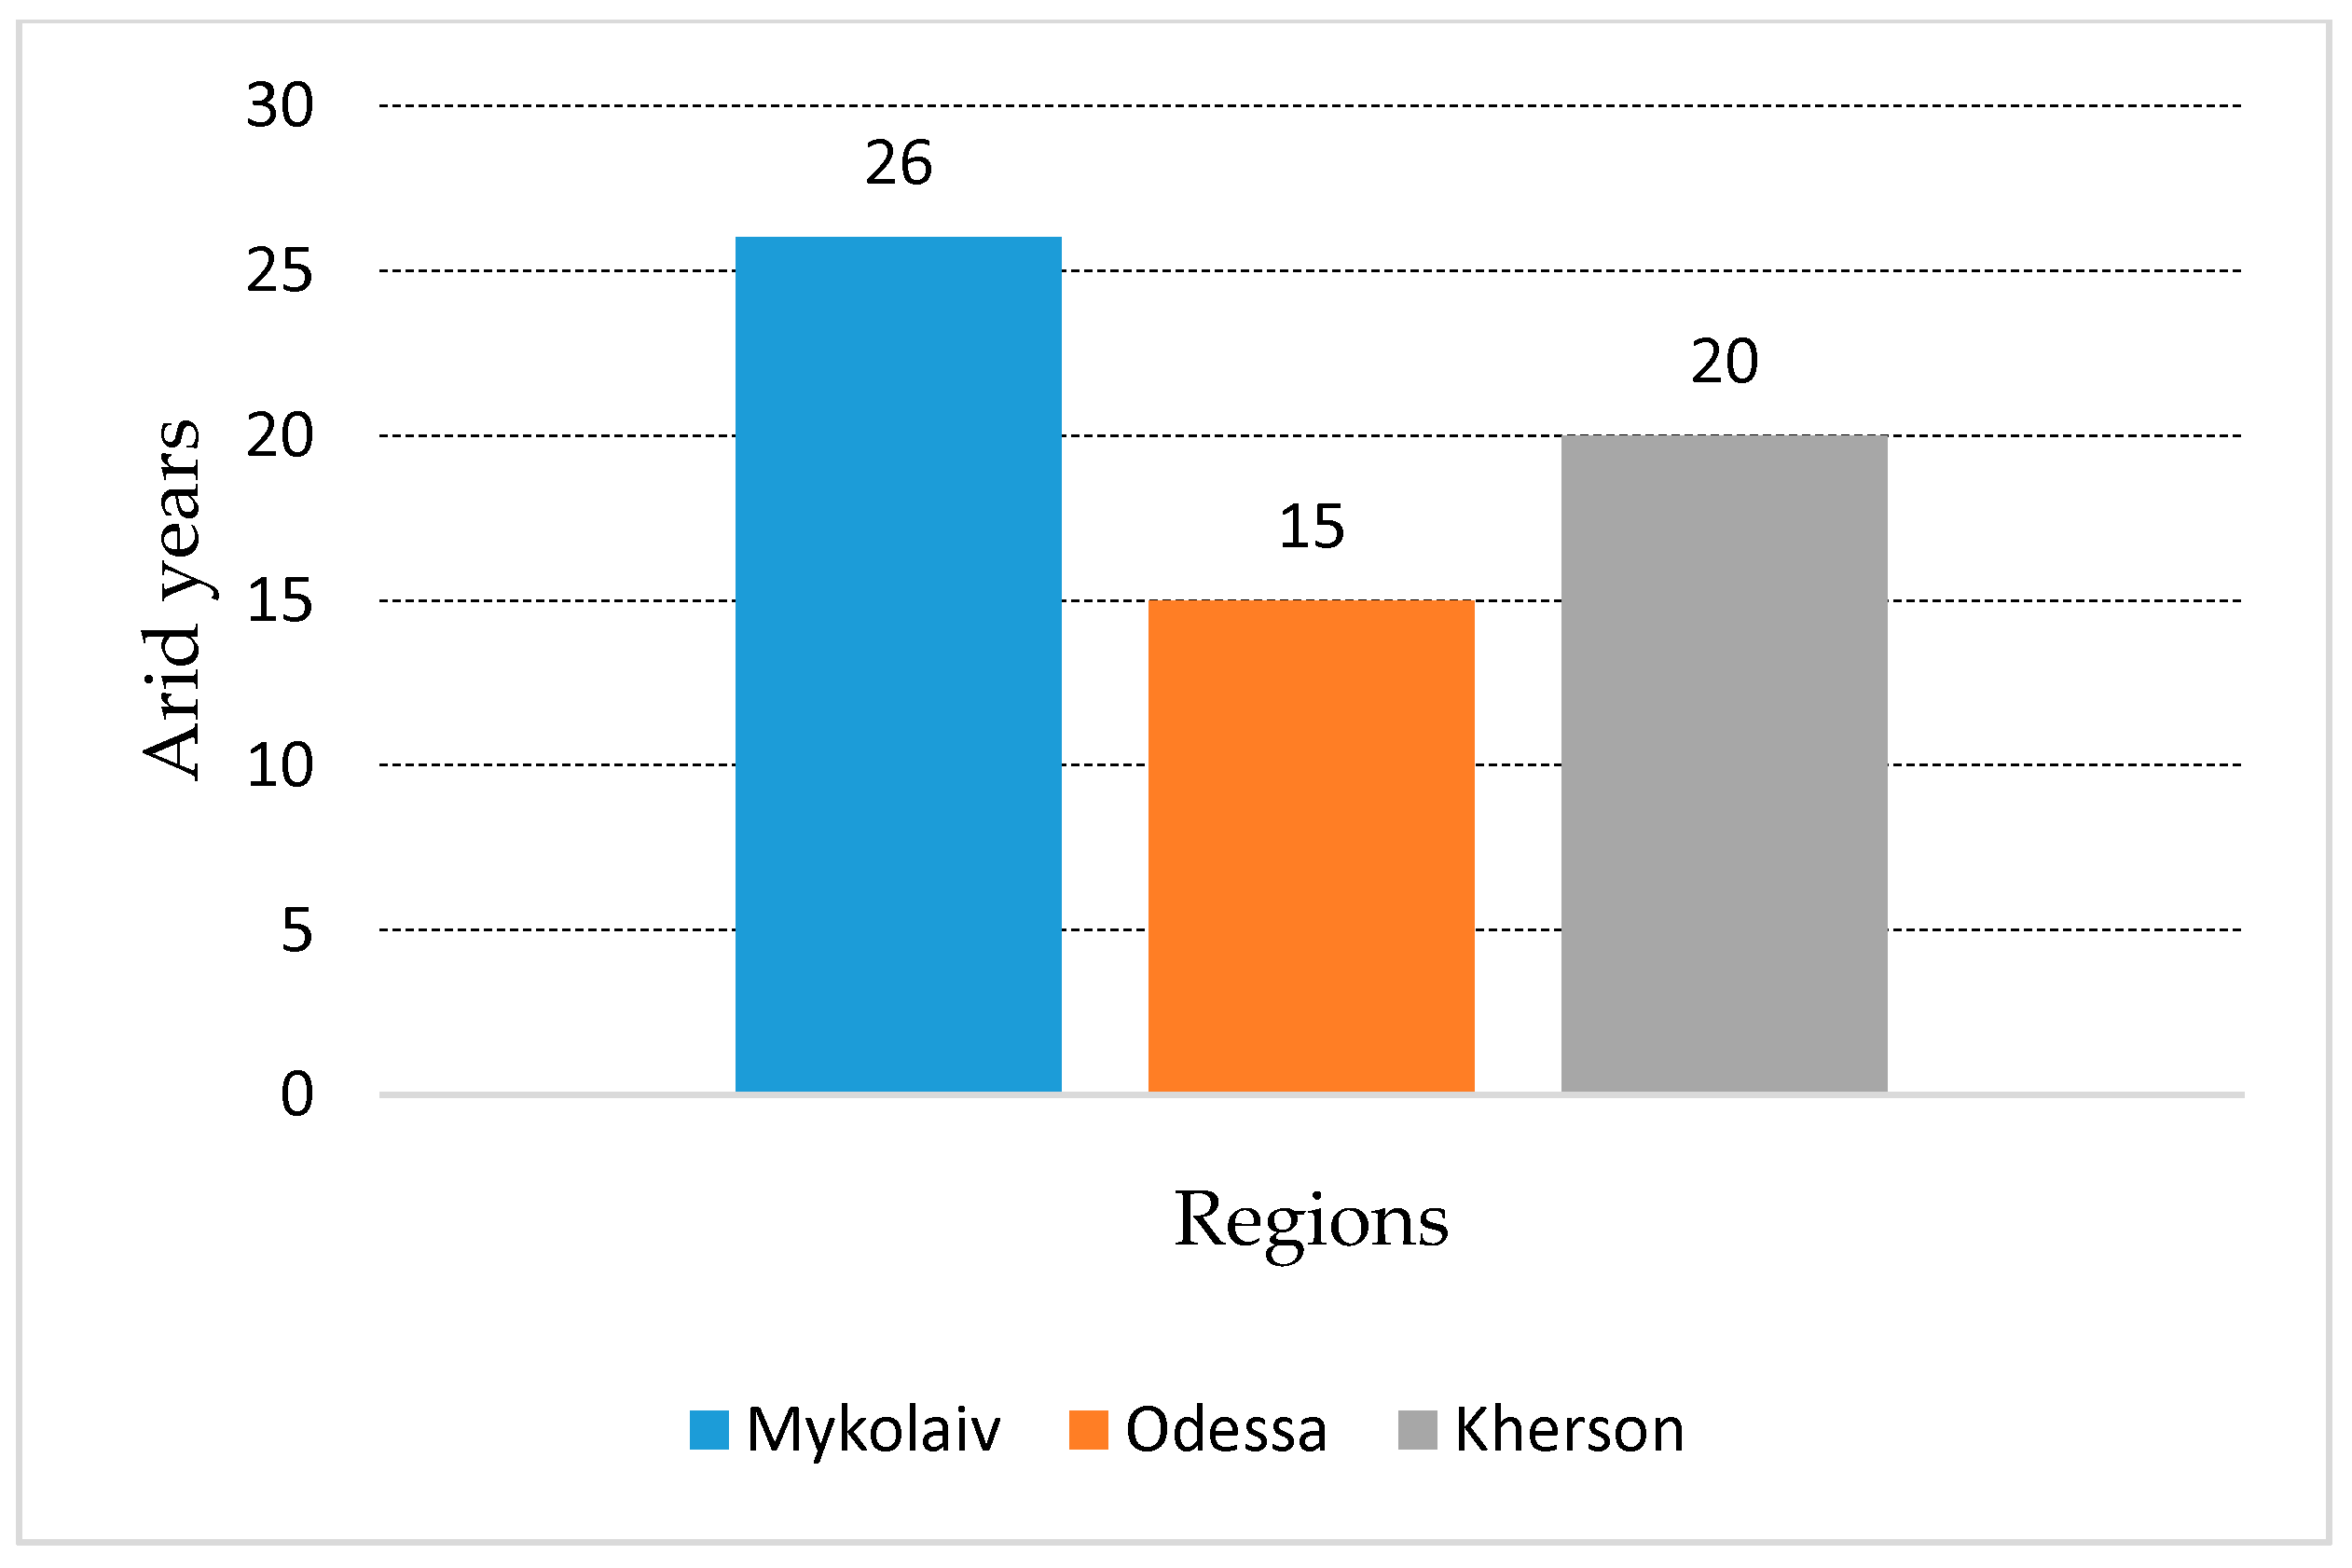
For the past 50 years, 26 years in the Mykolaiv region were arid (Figure 5). The Mykolaiv region suffers from climate changes (drought) more than the neighboring regions. The situation in Odesa and Kherson regions was better, especially in the Odesa region. This forces farmers to adjust existing technologies and look for new drought-resistant crops to be grown. For this reason, we chose the Mykolaiv and Kherson regions for field experiments.
The average monthly precipitation and air temperatures are shown in Figure 6. The growth period of sorghum is from May to September, with most of the precipitation in June. The sum of rainfall during the growth period was 214 mm.
Yield depends on several factors, including precipitation. Water productivity of selected crops is presented in Table 6 [76]. Maize has better water productivity compared to other crops. Sorghum holds a second position. However, on dryland sweet sorghum has almost the same indicator. Taking into account the water productivity of sorghum, it can be predicted that under favorable weather conditions, a yield of sweet sorghum may be increased by 0.5–2.1 t/ha.

3.2. Energy Assessment

The input data used in the production of sorghum silage and their quantitative values are given in Table 7. The average sorghum silage yield was determined at 40.6 t/ha. Indirect energy consumption, which is associated with technological materials (fertilizers, plant protection products, and seeds), is 6580.14 MJ/ha (Table 8). Fertilizers and chemicals are the predominant energy inputs.
The total energy inputs were 12.277 GJ/ha. With a yield of 40.6 t/ha, the energy output of sorghum silage was 128.86 GJ/kg and the energy efficiency ratio of this technology was 11.18. The specific energy consumption per unit of output is equal to 0.302 MJ/t (Table 9).
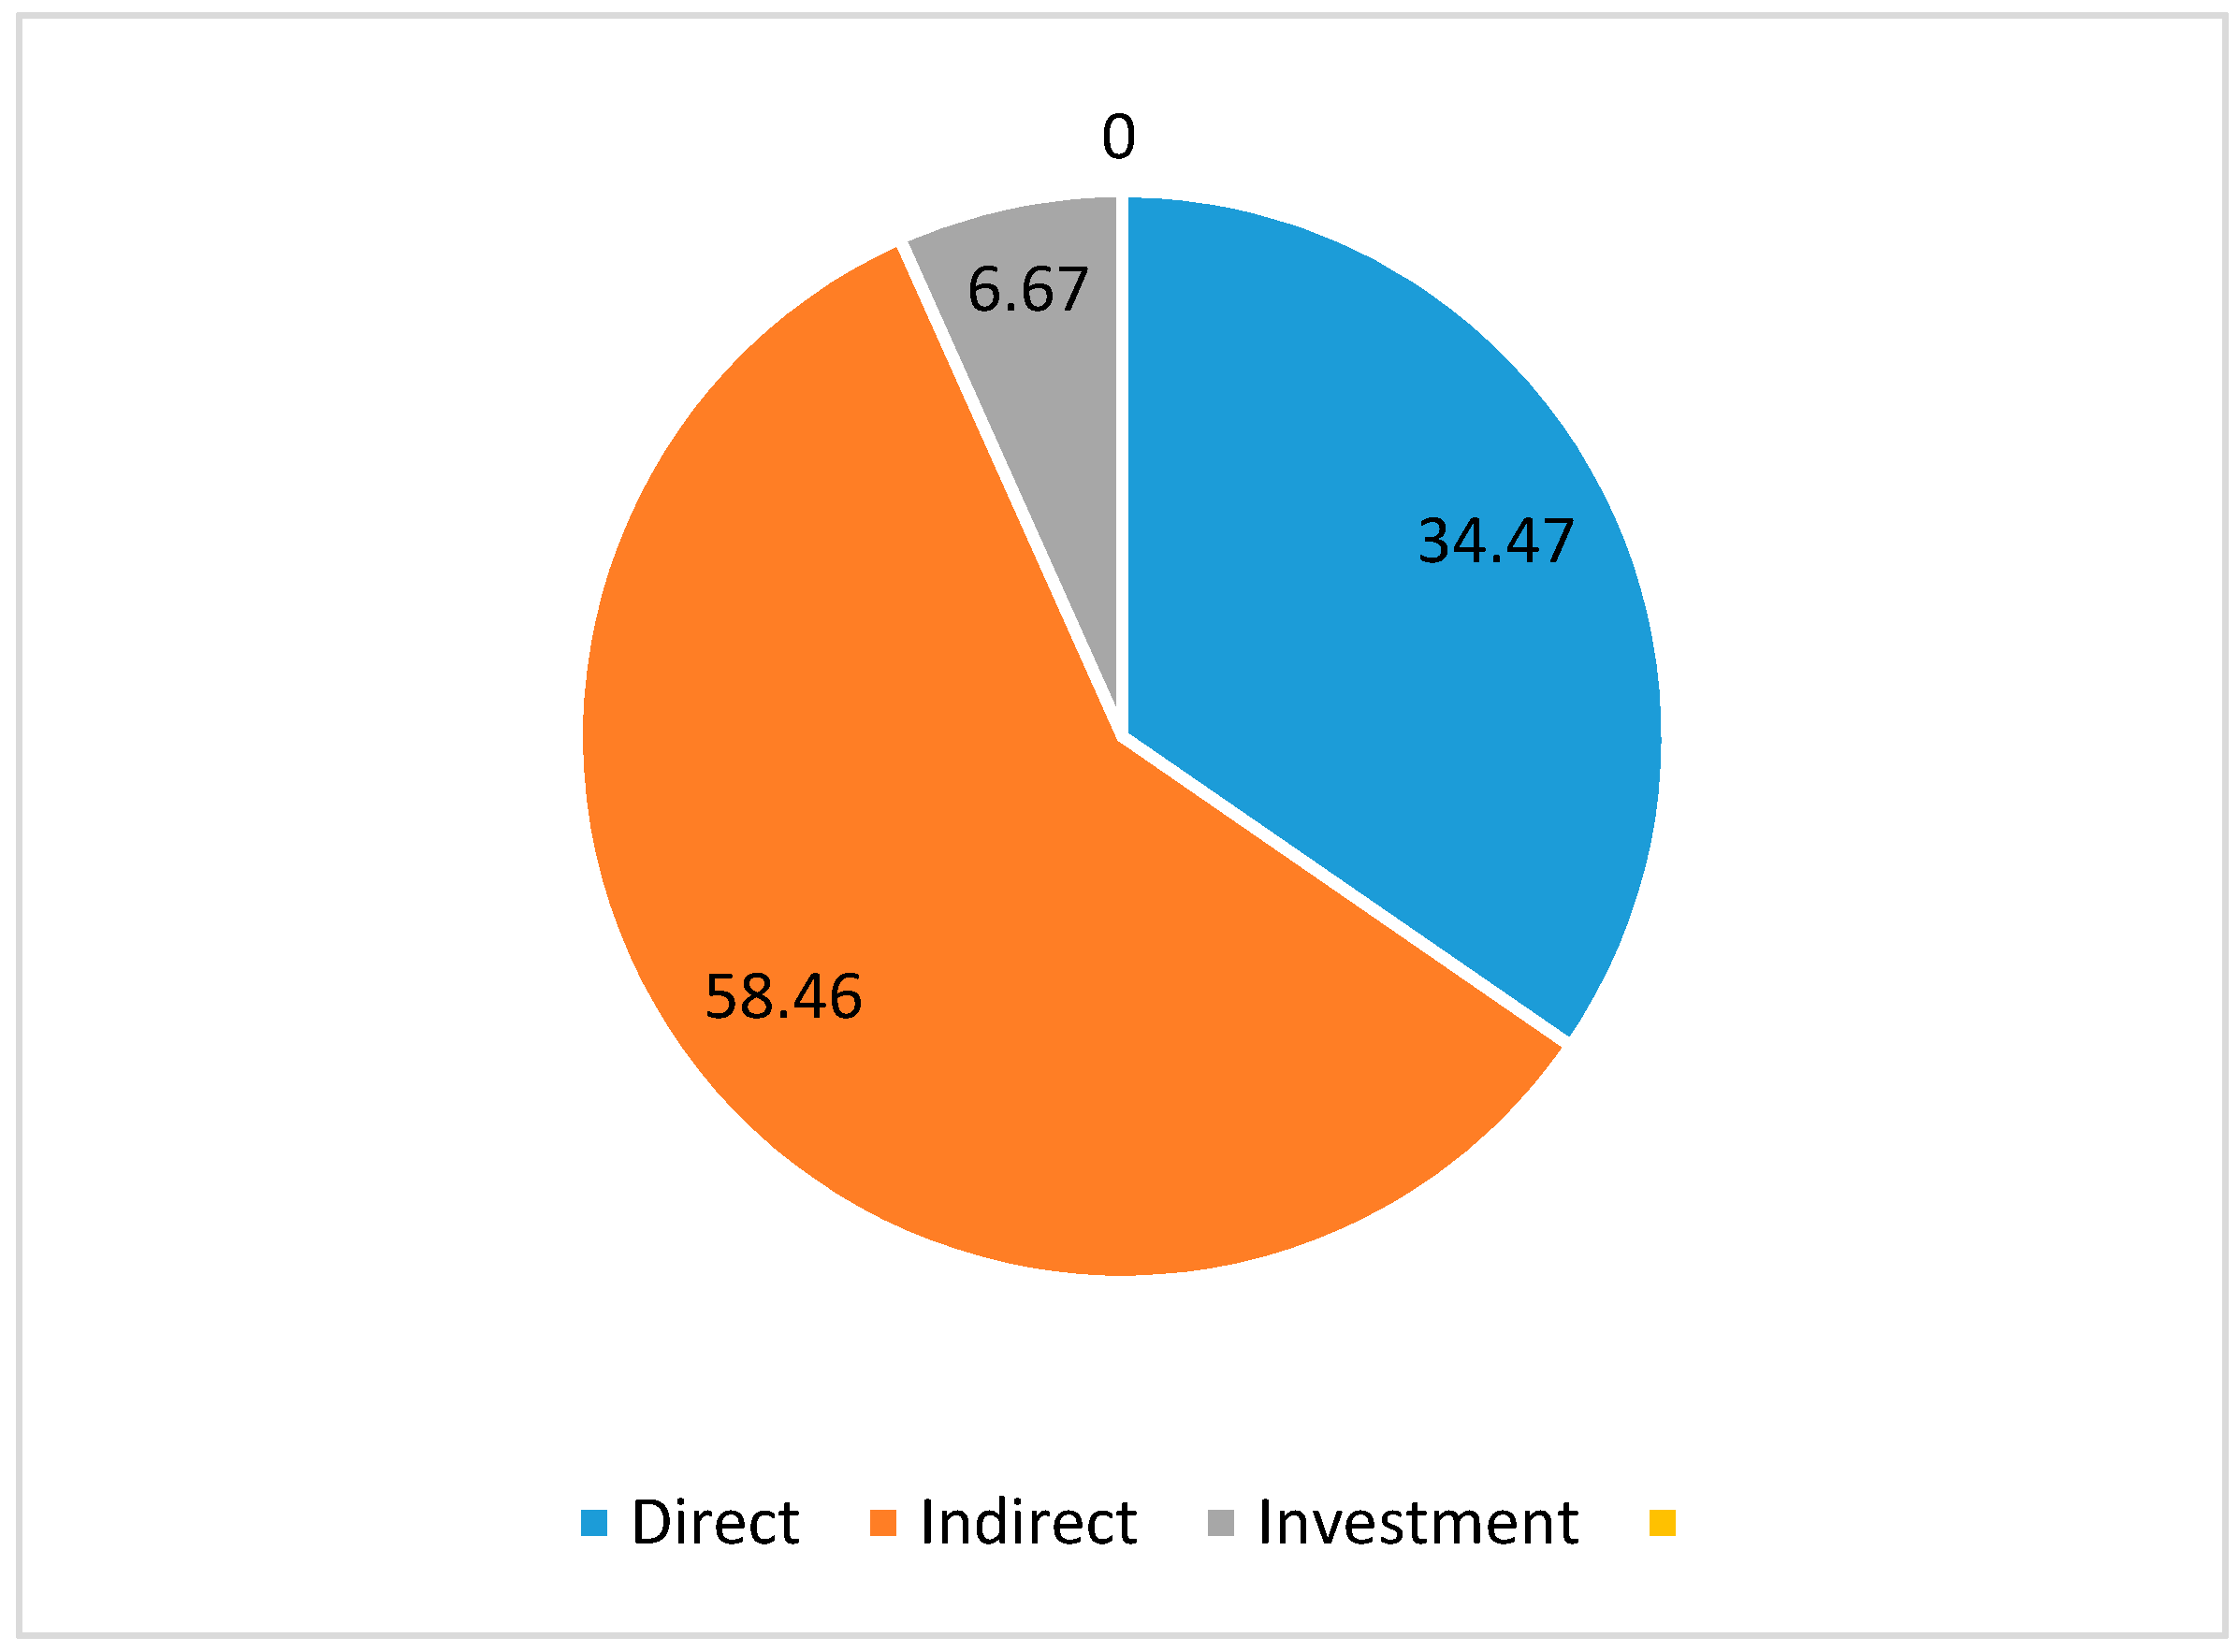
The distribution of energy inputs is shown in Figure 7. The major share is the indirect energy inputs (fertilizers and chemicals) at 58.46%. The share of investment energy inputs (the indirect energy associated with the manufacturing of farm machinery, and stationary equipment) is only 6.67%. And the direct energy inputs hold the second position with a rate of 34.85%. The above data may be used for life-cycle energy and environmental analysis of the further transformation of biomass into bioenergy [20,22,23,77,78].
The structure of energy inputs by technological operations was analyzed. The most energy-intensive are harvesting operations and basic tillage. The proportion of remaining operations was as follows: sowing, 15.8% and crop management, 12.33% (Table 10).

3.3. International Experience

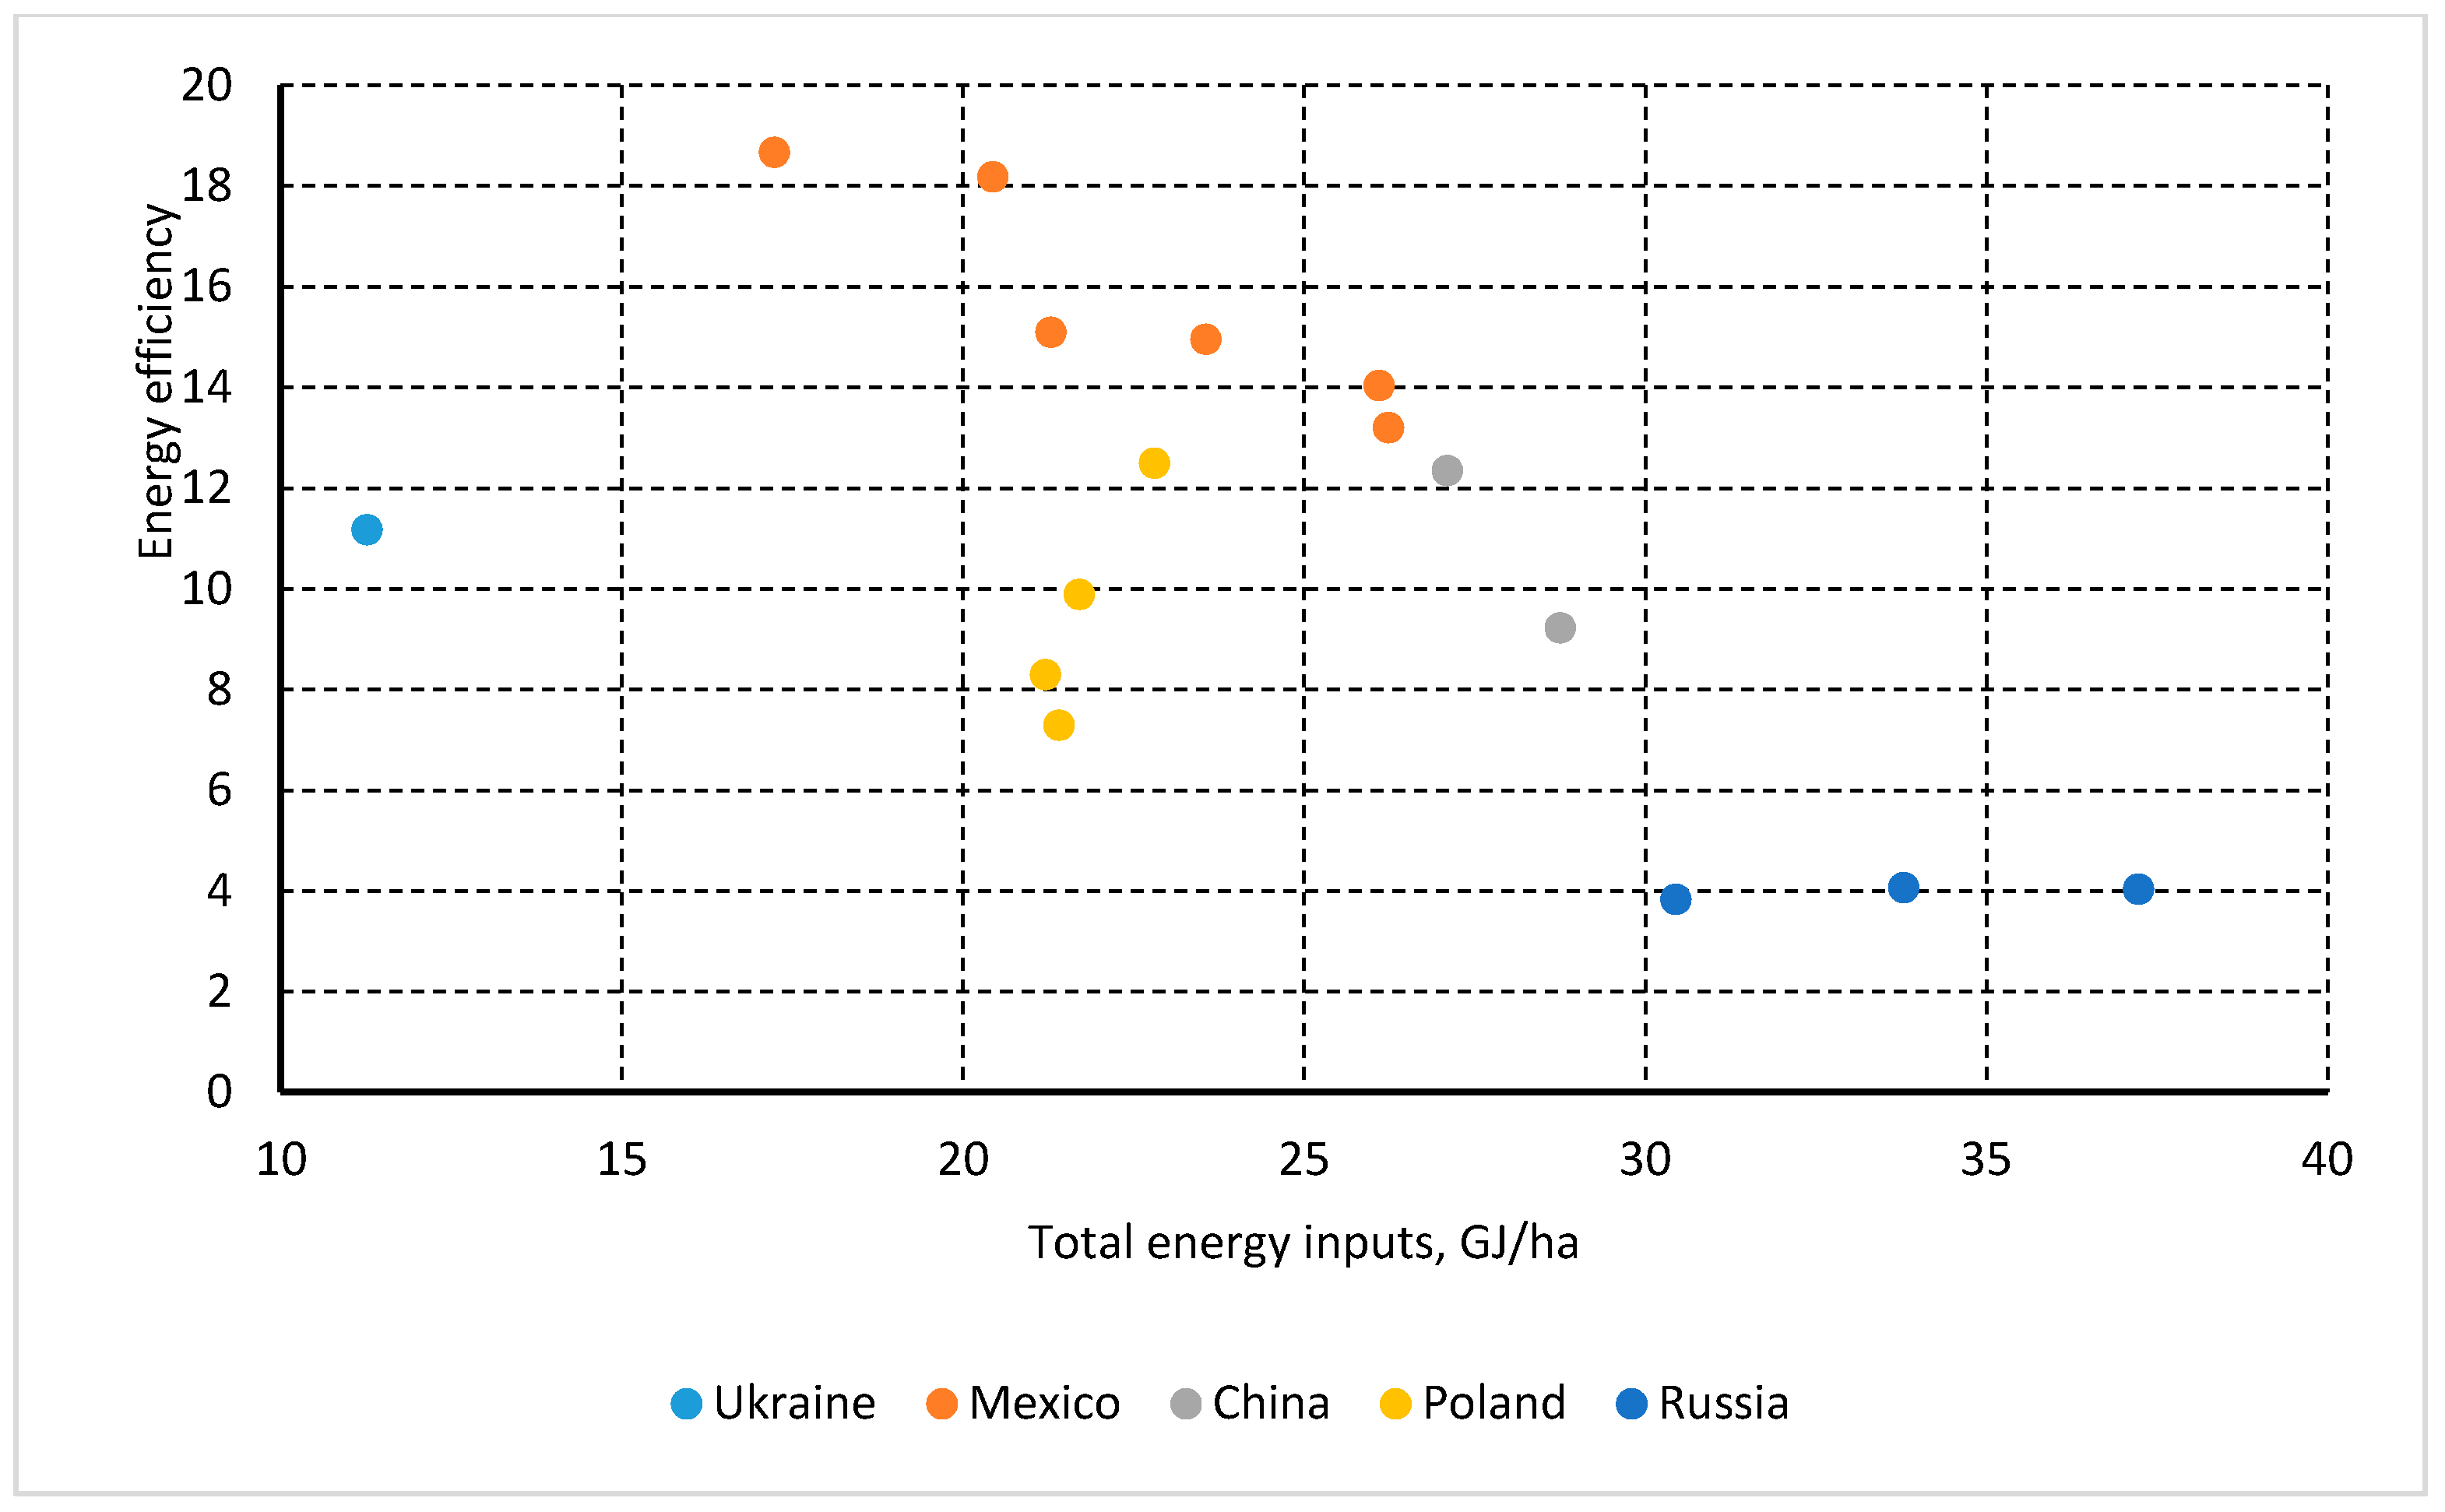
We compared the obtained results with foreign achievements of sweet sorghum cultivation in the North Caucasus, China, Poland, and Mexico [53,54,55,56]. The energy inputs in sweet sorghum production depend on technology, soil, and climate conditions. In European countries, they range from 7.9 to 28.7 GJ/ha [22,79]. In the USA, the energy inputs vary from 7.9 to 30 GJ/ha (i.e., almost the same) [55]. For conditions in Mexico, sweet sorghum production requires from 17 to 26 GJ/ha. In China, the total energy inputs were determined at up to 28.7 GJ/ha [56].
An increase in total energy inputs (due to the application of fertilizers) results in a higher yield. A lower yield in southern Ukraine compared to Western European countries is the result of the specific weather and climatic conditions that do not allow farmers to increase the use of fertilizers (Figure 8).
Energy crops should have minimum energy inputs and a maximum energy efficiency ratio [80]. In Central-Eastern Europe (Poland), the above ratio ranges from 7.3 to 12.5 [54]. In South Europe (Italy), this indicator varied from 1.9 to 15 [79]. In China, the energy efficiency ratio is similar to Poland. It is within the range from 9.3 to 12.4 [55]. In this study, for the south of Ukraine, the energy efficiency ratio was 11.18. The comparison of energy efficiency is presented in Figure 9. The energy inputs in Ukraine are almost half compared to Poland and China. However, the energy efficiency ratio is somewhat less than in Poland and around 30% less than in China.
The analysis shows that the energy efficiency ratio of sweet sorghum silage in Ukraine is at an acceptable level. Research on the impact of increasing the use of fertilizers on the value of the energy efficiency ratio is of scientific and practical interest.

3.4. Energy Efficiency of Grain Sorghum

Both our own data and data of other researchers were used in the analysis [81,82]. A hybrid that gives the best results in southern Ukraine was studied.
The input energy and material flows are presented in Table 11. The total energy inputs were 16.081 GJ/ha. Indirect energy inputs were 9.879 GJ/ha or 61.43%. The distribution of energy inputs is like the distribution of energy inputs for sweet sorghum. However, the total energy inputs are 50% higher. This fact is the result of more fertilization.
Previous studies have found that the most significant factors that affect the yield of grain sorghum are: sowing date, plant density, and precipitation. The average air temperature determined sowing dates. The early sowing date was at a temperature from 8 to 10 °C. And the late sowing date was considered if the average soil temperature was from 14 to 16 °C. Precipitation and sowing date depend on weather conditions and, therefore, they are random variables. Plant density can be adjusted in the technological process. Correlation-regression analysis was carried out to identify the influence of these factors on an energy efficiency ratio. The initial data for correlation-regression analysis are given in Table 12.
Multiple regression has been found in the following form (square of the correlation coefficient R2 = 0.766):
E E R = 11.213 05.525 · X 1 + 0.0157 · X 2 0.013 · X 3 ,
where X1 is the sowing date; X2 is the annual rainfall, mm; X3 is the plant density, thousand seeds/ha.
The correlation matrix was analyzed (Table 13).
As can be seen, there is no correlation between the variables (correlation coefficient is equal to R = 0). Among the variables, the sowing date (R = −0.73088) and precipitation (R = −0.456368) have the largest relationship. The influence of plant density has the least effect (R = −0.15388).
The energy efficiency ratio ranged from 2.646 to 16.757. The average value was 6.773. The maximum energy efficiency ratio was under plant density of 140,000 seeds per hectare, early sowing date, and maximum precipitation. This indicator was higher compared to sweet sorghum at annual precipitation of 350 mm.

3.5. Water Use Efficiency

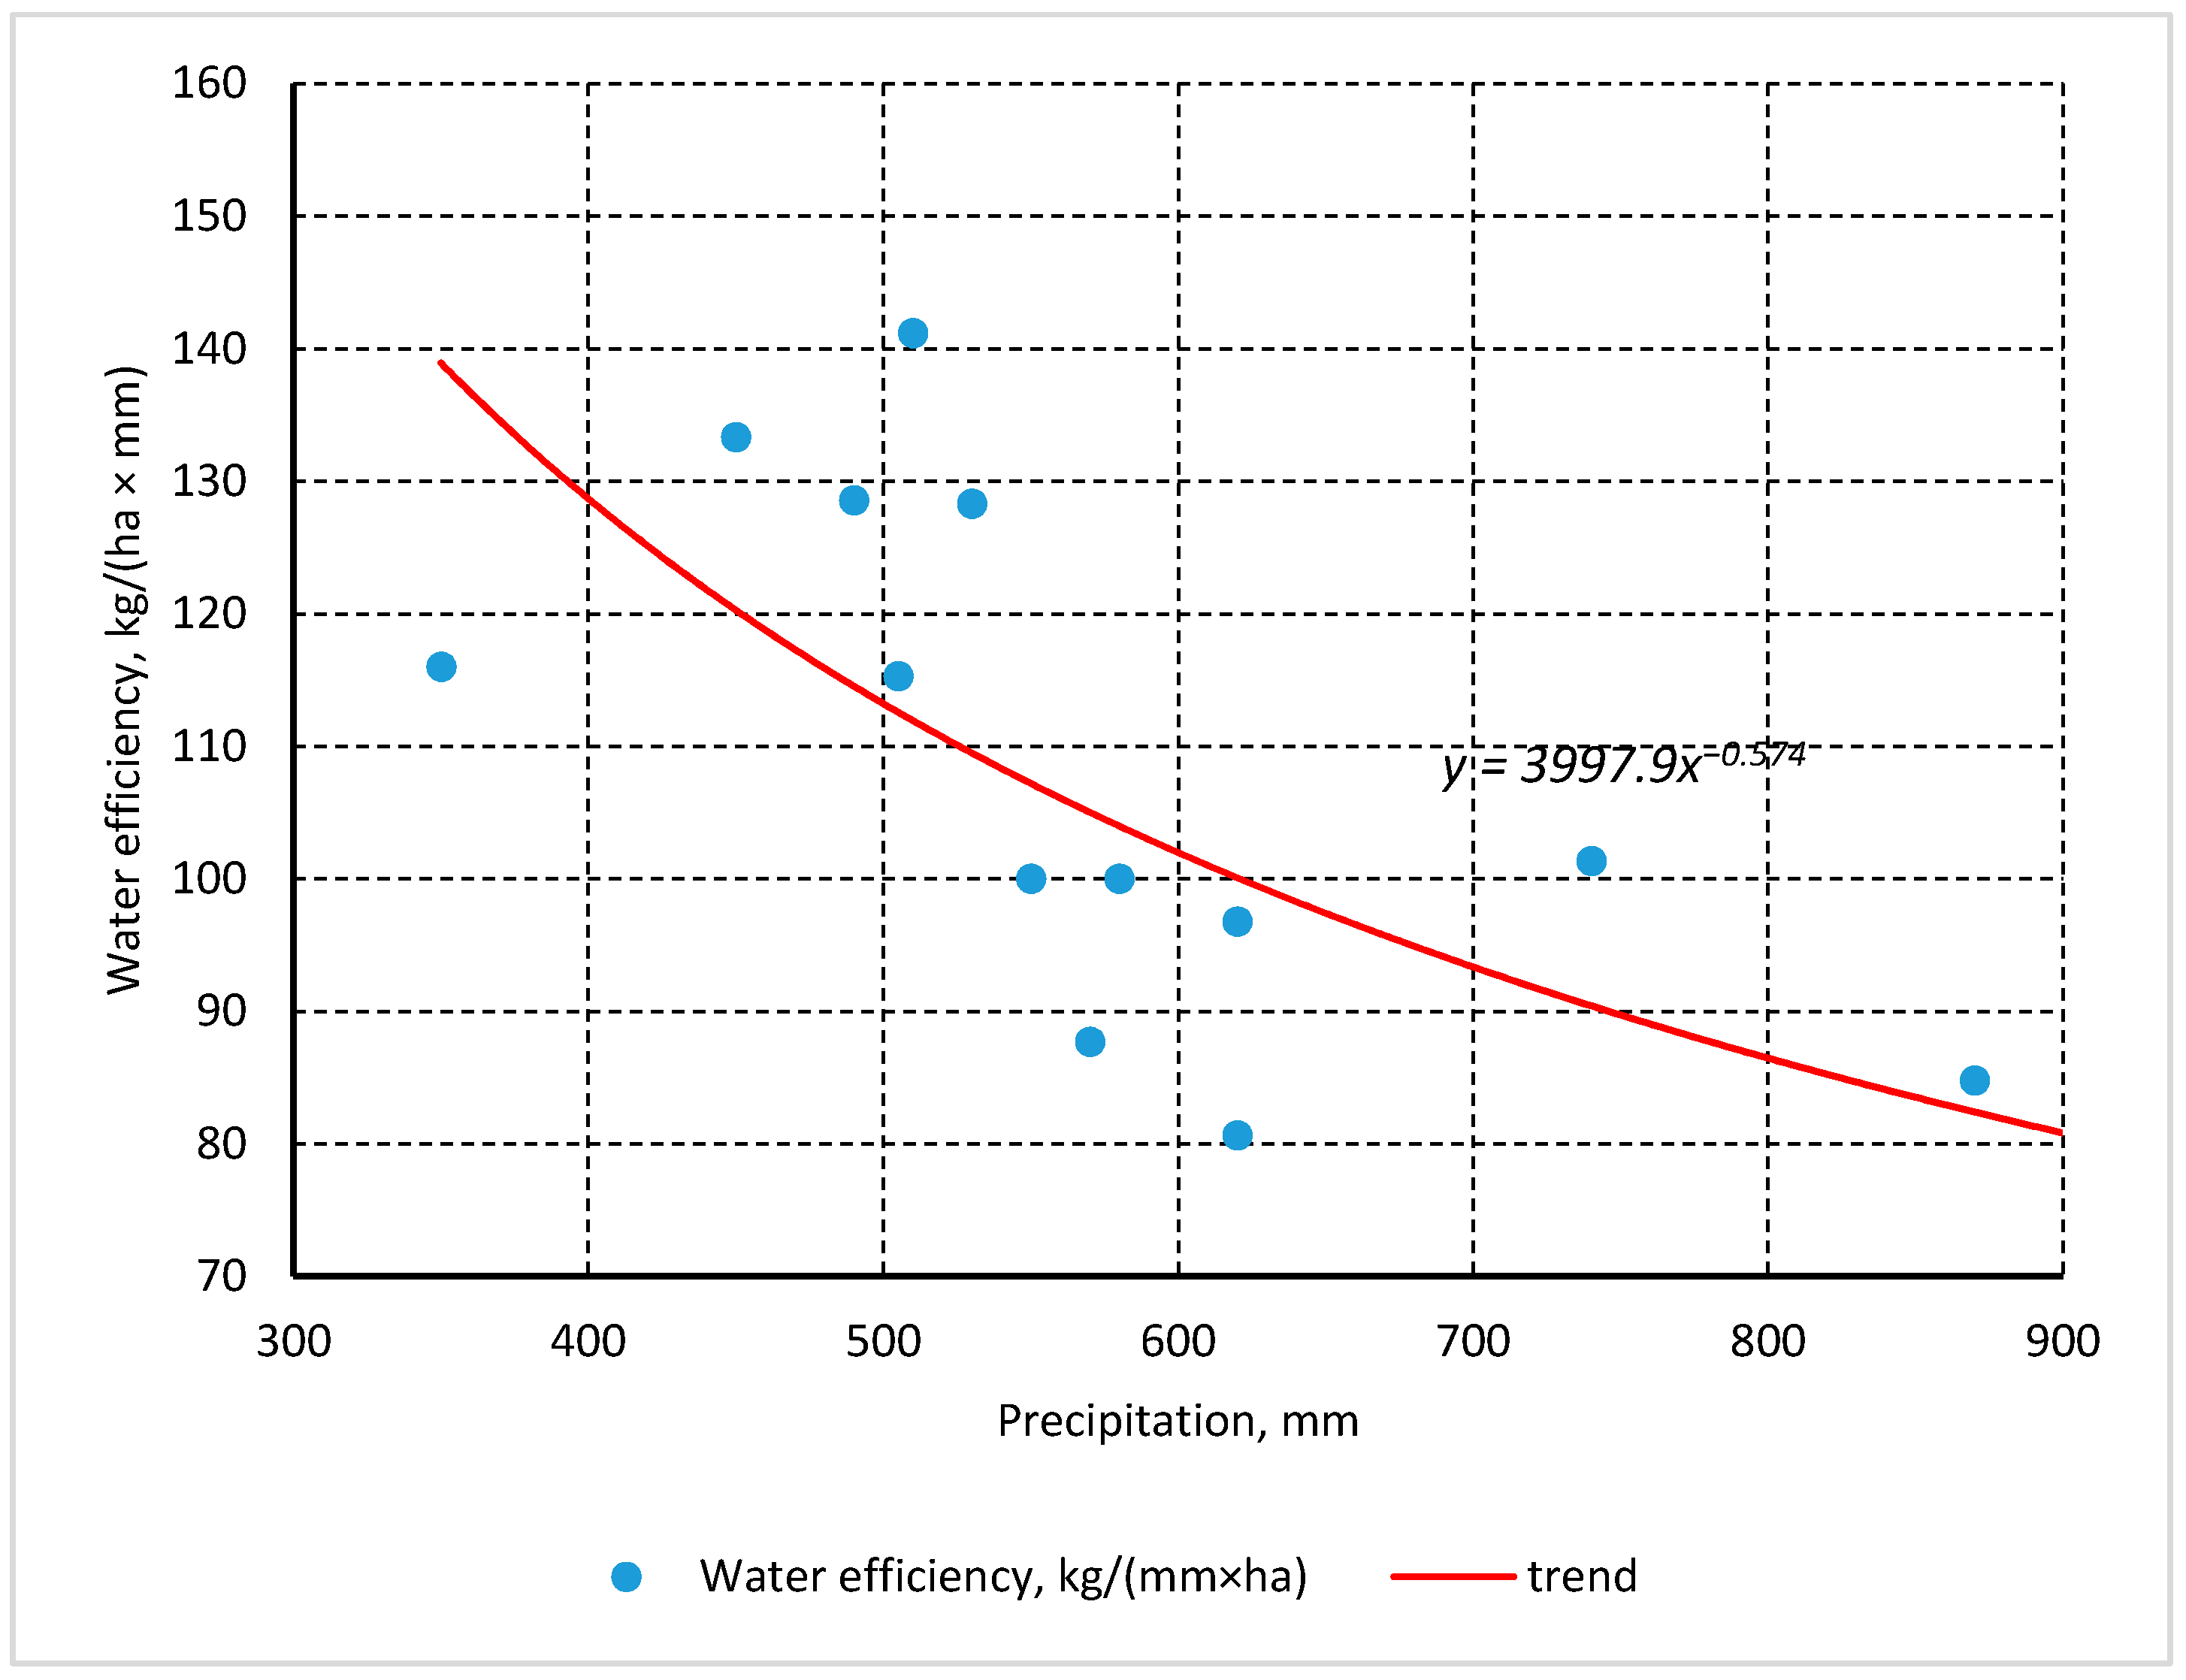
We analyzed water use efficiency for sweet sorghum. There has been a decrease in water requirement versus annual precipitation (Figure 10). Water use efficiency was determined at 116 kg/(mm × ha). The highest value of this indicator was observed in Poland: from 128 to 141 kg/(mm × ha) with a rainfall of 450–510 mm per year. As can be seen, the water use efficiency depends on annual rainfall. This indicator decreases with increasing precipitation.
We analyzed water use efficiency for grain sorghum as a function of plant density and annual precipitation (Figure 11). The efficiency of water use is maximum at a plant density of 140 thousand seeds per hectare and minimum at 220 thousand seeds per hectare. In the observed precipitation range of 288.9 to 523.1 mm, this indicator tends to increase. The maximum yield increase is observed at a plant density of 140,000 seeds per hectare. This increase is almost 2.04 kg/(mm × ha). At a plant density of 220,000 seeds per hectare, the above indicator was around 1.5 kg/(mm × ha).

4. Discussion

4.1. Sorghum for Biorefinery

Ukraine currently requires 1.77 million tons of petrol and 5.37 million tons of diesel fuel [83]. National experts assess marginal lands to be around 4 million hectares [84]. These lands can be used to cultivate sorghum. Silage or grain can be converted into vehicle biofuels such as biomethane (upgraded biogas) and ethanol.
For sorghum silage, specific methane yields range from 52 to 84 m3/t (fresh mass) [85,86]. Thus, if sweet sorghum is cultivated on marginal lands, biomethane production can reach 162.4 million tons. It is enough to get biomethane of 8.4 to 13.6 billion m3. It is equal to 6.8–11.1 million tons of petrol.
Sorghum has a high content of sugar and, therefore, may be fermented directly. Ethanol yields of sorghum are, l/t: sweet sorghum, 27.1 and grain sorghum, 316 [87,88]. The properties of sorghum and its potential production volumes allow the production of approximately 4.4 million cubic meters of ethanol, which is equivalent to 2.1 million tons of gasoline. So utilization of marginal lands to grow sorghum will meet all national demand in fuels for spark-ignition engines. However, before launching large-scale growing of sorghum for biofuel production, feasibility and sustainability analyzes are needed. It should be emphasized that a characteristic feature of sorghum is its drought tolerance.

4.2. Climate Change

Climate change is a global environmental problem. This phenomenon threatens civilization and its economy. Ukraine is vulnerable to the influence of climate change. Air high temperatures, droughts, and other extreme climate events are now severe in Ukraine than some decades before. Southern Ukraine is most affected by climate change. If since the late nineteenth century, the global average temperature has increased by 1.18 °C [79], the average temperature in southern Ukraine (from 1970 to 2020) has risen by 2 (for Mykolaiv and Kherson regions) to 2.7 °C (for Odesa region) (Figure 5). This increase is twice the global temperature rise.
Ukraine has also witnessed decreasing annual precipitation (Figure 4). The Mykolaiv region is the driest. Over the past ten years, nine years have been dry. The best situation is in the Odesa region. During the same time, there were only three drought years. The Kherson region occupies an intermediate position. Thus, farmers are forced to adapt technologies to the prevailing conditions. The cultivation of drought-resistant crops, such as sorghum, is also gaining in importance.

4.3. Energy Efficiency of Sweet Sorghum

Sweet sorghum has a higher biomass yield compared to maize. This study evaluated the feasibility of sweet sorghum as an energy crop in southern Ukraine. Our findings indicate on relatively high energy efficiency ratio, although this indicator is less than best European practices. Indirect energy inputs were found at 58.46% of the total energy inputs. And they have a significant impact on the energy efficiency of this crop production technology. Figures of indirect energy inputs in Ukraine are equal to similar values in Mexico (around 50%) and much less than in China and Poland (approximately 77%). Fertilizer inputs are low compared to foreign practice. If we had 6.6 GJ/ha, that selected countries had the following figures, GJ/ha: China, from 21 to 26 [55]; Poland, around 16.5 [22]; and Mexico, around 15 [53].
In European countries, the energy efficiency ratio of sweet sorghum ranges from 1.9 [79] to 15 [36]. In China, this parameter is within the range of 9.3 to 12.4 [55]. In this study, the energy efficiency ratio was found at 11.18. This parameter for maize biomass is higher. In European countries, it can reach 32–39 [21]. As a rule, the energy efficiency ratio varies from 15.8 to 18.6 [22]. The exception is China, where sweet sorghum is more energy effective [55]. Thus, in Europe energy efficiency of sorghum is lower compared to maize biomass. However, sorghum needs fewer energy inputs, is undemanding to soil, and resistant to drought.
Sweet sorghum is relatively new in Ukraine. And its optimized production practices have not been established. As these results report to a single year of research, more studies should be carried out for eventual confirmation of its value under Ukrainian conditions.

4.4. Energy Efficiency of Grain Sorghum

Grain sorghum generates less biomass compared to sweet sorghum. Its production requires more energy inputs. Indirect energy inputs constitute around 61.43% of the total energy inputs. This figure exceeds the share of indirect energy inputs for sweet sorghum. Its energy efficiency ratio ranges from 2.65 to 16.76. We have revealed a function of the energy efficiency ratio on plant density, precipitation, and sowing date. We recommend using early sowing date to have as high as possible the energy efficiency ratio.
The best results were obtained with annual precipitation of 523.1 mm and early sowing dates. Under these conditions, the energy efficiency ratio ranged from 12.27 to 16.757. Its specific value depends on the planting density and reaches its maximum value at a plant density of 140,000 seeds per hectare. Late sowing dates led to a significant decrease in the energy efficiency ratio. Its value dropped to 3.445–4.488 (Table 12). From the above, we can draw the following conclusion. The early sowing date at a plant density of 100,000 to 140,000 seeds per hectare is the best strategy for growing grain sorghum.

4.5. Water Use Efficiency

Water use efficiency is of significant importance in crop production. Experiments were carried out in rainfed fields. We found that water use efficiency for sweet sorghum is a function of precipitation. In Mykolaiv region conditions, water use efficiency was determined at 115 kg/(ha×mm). It is possible to obtain 40.6 t/ha of sorghum silage (wet basis) with 350 mm of precipitation. This factor decreases with increasing precipitation. This information can be used to program the crop.
The study of grain sorghum showed that water use efficiency ranged from 12 to 18 kg/(mm × ha). It reaches its highest value at a plant density of 140,000 seeds per hectare. An increase in plant density leads to a sharp (23–27%) decrease in water use efficiency.

5. Conclusions

The analysis showed the following climate change in the south of Ukraine: an increase in average annual air temperature (17% for the past 50 years) and a decrease in precipitations (12% for the past 50 years). Sorghum is a promising crop for the production of biofuels (pellets, bioethanol, and biogas) due to its high yield and its resistance to arid climates.
The yield potential and energy balance of sweet sorghum were revealed in the South of Ukraine. Despite little annual precipitation (less than 400 mm), the yield of 40.6 t/ha was got. This value exceeded the national average yield of maize silage in Ukraine (25.91 t/ha in 2019). Therefore, sweet sorghum can complement other energy crops to be used in biorefinery. Moreover, this crop has a short growing period (5 months) and can be applied in rotation with other crops.
Production of sweet sorghum silage is a promising alternative to maize silage due to its high energy efficiency ratio, the value of which in the South of Ukraine may exceed 10. Due to fertile soil and an energy-saving technology (no ploughing), the energy efficiency ratio of 11.18 has been achieved. The maximum value of this indicator in some countries reaches 18.
Grain sorghum has a lower value of the energy efficiency ratio compared to sweet sorghum silage. Correlation regression analysis showed that the sowing period has the greatest influence. Early sowing provides a significant increase in energy efficiency. The optimal plant density is 140,000 seeds per hectare.
The field experiment has proven that sweet sorghum can be cultivated with a high energy efficiency ratio in Southern Ukraine. Further studies will reveal the dependence of an energy efficiency ratio on several factors such as plant density, terms of sowing, annual precipitation, cultivars, etc. It is planned that these studies will continue for the next three years.

Author Contributions

Conceptualization, V.H.; methodology, V.H. and V.N.; software, O.B.; validation, V.H. and M.F.; formal analysis, V.H. and V.N.; investigation, O.B.; resources, O.B.; data curation, M.F.; writing—original draft preparation, V.H. and V.N.; writing—review and editing, O.B. and V.N.; visualization, M.F.; supervision, V.H. and M.F.; project administration, O.B.; funding acquisition, O.B. All authors have read and agreed to the published version of the manuscript.

Funding

This study was carried out as part of the project “Belt and Road Initiative Institute for Chinese–European studies” and was funded by the Guangdong University of Petrochemical Technology.

Institutional Review Board Statement

Not applicable.

Informed Consent Statement

Informed consent was obtained from all subjects involved in the study.

Data Availability Statement

Data sharing not applicable.

Acknowledgments

The authors would like to thank all the quality professionals who helped the research.

Conflicts of Interest

The authors declare no conflict of interest.

References

  1. Bórawski, P.; Bełdycka-Bórawska, A.; Szymańska, E.; Jankowski, K.J.; Dubis, B.; Dunn, J.W. Development of renewable energy sources market and biofuels in The European Union. J. Clean. Prod. 2019, 228, 467–484. [Google Scholar] [CrossRef]
  2. Koval, V.; Mikhno, I.; Trokhymets, O.; Kustrich, L.; Vdovenko, N. Modeling the interaction between environment and the economy considering the impact on ecosystem. E3S Web Conf. 2020, 166, 13002. [Google Scholar] [CrossRef]
  3. Nitsenko, V.; Mardani, A.; Streimikis, J.; Shkrabak, I.; Klopov, I.; Novomlynets, O.; Podolska, O. Criteria for Evaluation of Efficiency of Energy Transformation Based on Renewable Energy Sources. Montenegrin J. Econ. 2018, 14, 237–247. [Google Scholar] [CrossRef]
  4. Su, Y.; Zhang, P.; Su, Y. An overview of biofuels policies and industrialization in the major biofuel producing countries. Renew. Sustain. Energy Rev. 2015, 50, 991–1003. [Google Scholar] [CrossRef]
  5. Rocha, A.; Araújo, A.; Carvalho, A.; Sepulveda, J. A New Approach for Real Time Train Energy Efficiency Optimization. Energies 2018, 11, 2660. [Google Scholar] [CrossRef] [Green Version]
  6. Kan, T.; Strezov, V.; Evans, T. Thermochemical Behaviour of Sewage Sludge during Its Slow Pyrolysis. Int. J. Adv. Mech. Civil Eng. 2015, 2, 64–67. Available online: http://www.iraj.in/journal/journal_file/journal_pdf/13-180-143981296164-67.pdf (accessed on 9 February 2021).
  7. Zaharioiu, A.; Bucura, F.; Ionete, E.I.; Ionete, R.E.; Ebrasu, D.; Sandru, C.; Marin, F.; Oancea, S.; Niculescu, V.; Miricioiu, M.G.; et al. Thermochemical Decomposition of Sewage Sludge—An Eco-Friendly Solution for a Sustainable Energy Future by Using Wastes. Rev. Chim. 2020, 71, 171–181. [Google Scholar] [CrossRef]
  8. Constantinescu, M.; Bucura, F.; Ionete, R.-E.; Niculescu, V.-C.; Ionete, E.I.; Zaharioiu, A.; Oancea, S.; Miricioiu, M.G. Comparative Study on Plastic Materials as a New Source of Energy. Mater. Plast. 2019, 56, 41–46. [Google Scholar] [CrossRef]
  9. Feltus, F.A.; vanDenBrink, J.P. Bioenergy grass feedstock: Current options and prospects for trait improvement using emerging genetic, genomic, and systems biology toolkits. Biotechnol. Biofuels 2012, 5, 80. [Google Scholar] [CrossRef] [Green Version]
  10. Sharma, M.K.; Sharma, R.; Cao, P.; Harkenrider, M.; Jenkins, J.; Grimwood, J.; Zhang, J.; Udvardi, M.K.; Schmutz, J.; Ronald, P.C. Targeted Switchgrass BAC Library Screening and Sequence Analysis Identifies Predicted Biomass and Stress Response-Related Genes. BioEnergy Res. 2015, 9, 109–122. [Google Scholar] [CrossRef]
  11. Rivera-Burgos, L.A.; Volenec, J.J.; Ejeta, G. Biomass and Bioenergy Potential of Brown Midrib Sweet Sorghum Germplasm. Front. Plant Sci. 2019, 10, 1142. [Google Scholar] [CrossRef] [PubMed]
  12. Roozeboom, K.L.; Wang, D.; McGowan, A.R.; Propheter, J.L.; Staggenborg, S.A.; Rice, C.W. Long-term Biomass and Potential Ethanol Yields of Annual and Perennial Biofuel Crops. Agron. J. 2019, 111, 74–83. [Google Scholar] [CrossRef] [Green Version]
  13. Marks-Bielska, R.; Bielski, S.; Novikova, A.; Romaneckas, K. Straw Stocks as a Source of Renewable Energy. A Case Study of a District in Poland. Sustainability 2019, 11, 4714. [Google Scholar] [CrossRef] [Green Version]
  14. Stolarski, M.J.; Śnieg, M.; Krzyżaniak, M.; Tworkowski, J.; Szczukowski, S. Short rotation coppices, grasses and other herbaceous crops: Productivity and yield energy value versus 26 genotypes. Biomass Bioenergy 2018, 119, 109–120. [Google Scholar] [CrossRef]
  15. Mathur, S.; Umakanth, A.V.; Tonapi, V.A.; Sharma, R.; Sharma, M.K. Sweet sorghum as biofuel feedstock: Recent advances and available resources. Biotechnol. Biofuels 2017, 10, 1–19. [Google Scholar] [CrossRef] [Green Version]
  16. Bai, Y.; Luo, L.; Van Der Voet, E. Life cycle assessment of switchgrass-derived ethanol as transport fuel. Int. J. Life Cycle Assess. 2010, 15, 468–477. [Google Scholar] [CrossRef] [Green Version]
  17. Havrysh, V.I.; Nitsenko, V.S. Current state of world alternative motor fuels market. Actual Probl. Econ. 2016, 7, 41–52. [Google Scholar]
  18. Cosedido, V.; Vacas, R.; Macarulla, B. Agronomic and digital phenotyping evaluation of sweet sorghum public varieties and F1 hybrids with potential for ethanol production in Spain. Maydica 2013, 58, 42–53. [Google Scholar]
  19. Baliuk, S.; Solovey, V.; Zakharova, M.; Kucher, A.; Truskavetskyi, S. Analysis of Information Support for the Condition of Soil Resources in Ukraine. Agric. Sci. Pr. 2015, 2, 77–84. [Google Scholar] [CrossRef]
  20. Meyer-Aurich, A.; Lochmann, Y.; Klauss, H.; Prochnow, A. Comparative Advantage of Maize- and Grass-Silage Based Feedstock for Biogas Production with Respect to Greenhouse Gas Mitigation. Sustainability 2016, 8, 617. [Google Scholar] [CrossRef] [Green Version]
  21. Muylle, H.; Van Hulle, S.; De Vliegher, A.; Baert, J.; Van Bockstaele, E.; Roldán-Ruiz, I. Yield and energy balance of annual and perennial lignocellulosic crops for bio-refinery use: A 4-year field experiment in Belgium. Eur. J. Agron. 2015, 63, 62–70. [Google Scholar] [CrossRef]
  22. Jankowski, K.; Dubis, B.; Budzyński, W.S.; Bórawski, P.; Bułkowska, K. Energy efficiency of crops grown for biogas production in a large-scale farm in Poland. Energy 2016, 109, 277–286. [Google Scholar] [CrossRef]
  23. Sivcev, I.; Kljajic, P.; Kostic, M.; Sivcev, L.; Stankovic, S. Management of western corn rootworm (Diabrotica virgifera virgifera). Pestic. Fitomed. 2012, 27, 189–201. [Google Scholar] [CrossRef]
  24. Mayer, F.; Gerin, P.A.; Noo, A.; Foucart, G.; Flammang, J.; Lemaigre, S.; Sinnaeve, G.; Dardenne, P.; Delfosse, P. Assessment of factors influencing the biomethane yield of maize silages. Bioresour. Technol. 2014, 153, 260–268. [Google Scholar] [CrossRef]
  25. Bacenetti, J.; Fusi, A.; Negri, M.; Guidetti, R.; Fiala, M. Environmental assessment of two different crop systems in terms of biomethane potential production. Sci. Total Environ. 2014, 466-467, 1066–1077. [Google Scholar] [CrossRef]
  26. Koval, V.; Sribna, Y.; Mykolenko, O.; Vdovenko, N. Environmental concept of energy security solutions of local communities based on energy logistics. In Proceedings of the 19th International Multidisciplinary Scientific GeoConference SGEM, Albena, Bulgaria, 28 June–6 July 2019; Volume 19, pp. 283–290. [Google Scholar] [CrossRef]
  27. Schorling, M.; Enders, C.; Voigt, C. Assessing the cultivation potential of the energy cropMiscanthus × giganteusfor Germany. GCB Bioenergy 2014, 7, 763–773. [Google Scholar] [CrossRef]
  28. Andriushchenko, K.; Kovtun, V.; Shergina, L.; Rozhko, O.; Yefimenko, L. Agro-based Clusters: A Tool for Effective Management of Regional Development in the ERA of Globalisation. TEM J. 2020, 9, 198–204. [Google Scholar] [CrossRef]
  29. Guo, Y.Y.; Tian, S.S.; Liu, S.S.; Wang, W.Q.; Sui, N. Energy dissipation and antioxidant enzyme system protect photosystem II of sweet sorghum under drought stress. Photosynthetica 2017, 56, 861–872. [Google Scholar] [CrossRef]
  30. Assefa, Y.; Staggenborg, S.A.; Prasad, V.P.V. Grain Sorghum Water Requirement and Responses to Drought Stress: A Review. Crop Manag. 2010, 9, 1–11. [Google Scholar] [CrossRef] [Green Version]
  31. Kołodziej, B.; Antonkiewicz, J.; Stachyra, M.; Bielińska, E.; Wiśniewski, J.; Luchowska, K.; Kwiatkowski, C. Use of sewage sludge in bioenergy production—A case study on the effects on sorghum biomass production. Eur. J. Agron. 2015, 69, 63–74. [Google Scholar] [CrossRef]
  32. Dar, R.; Dar, E.; Kaur, A.; Phutela, U.G. Sweet sorghum-a promising alternative feedstock for biofuel production. Renew. Sustain. Energy Rev. 2018, 82, 4070–4090. [Google Scholar] [CrossRef]
  33. Cattani, M.; Sartori, A.; Bondesan, V.; Bailoni, L. In vitro Degradability, Gas Production, and Energy Value of Different Hybrids of Sorghum after Storage in Mini-Silos. Ann. Anim. Sci. 2016, 16, 769–777. [Google Scholar] [CrossRef] [Green Version]
  34. Ostovareh, S.; Karimi, K.; Zamani, A. Efficient conversion of sweet sorghum stalks to biogas and ethanol using organosolv pretreatment. Ind. Crop. Prod. 2015, 66, 170–177. [Google Scholar] [CrossRef]
  35. Wannasek, L.; Ortner, M.; Amon, B.; Amon, T. Sorghum, a sustainable feedstock for biogas production? Impact of climate, variety and harvesting time on maturity and biomass yield. Biomass Bioenergy 2017, 106, 137–145. [Google Scholar] [CrossRef]
  36. Amaducci, S.; Colauzzi, M.; Battini, F.; Fracasso, A.; Perego, A. Effect of irrigation and nitrogen fertilization on the production of biogas from maize and sorghum in a water limited environment. Eur. J. Agron. 2016, 76, 54–65. [Google Scholar] [CrossRef]
  37. Batog, J.; Frankowski, J.; Wawro, A.; Łacka, A. Bioethanol Production from Biomass of Selected Sorghum Varieties Cultivated as Main and Second Crop. Energies 2020, 13, 6291. [Google Scholar] [CrossRef]
  38. Barcelos, C.A.; Maeda, R.N.; Anna, L.M.M.S.; Pereira, N. Sweet sorghum as a whole-crop feedstock for ethanol production. Biomass- Bioenergy 2016, 94, 46–56. [Google Scholar] [CrossRef]
  39. Bonin, C.L.; Heaton, E.A.; Cogdill, T.J.; Moore, K.J. Management of Sweet Sorghum for Biomass Production. Sugar Tech 2016, 18, 150–159. [Google Scholar] [CrossRef]
  40. Mishra, J.S.; Kumar, R.; Rao, S.S. Performance of Sweet Sorghum (Sorghum bicolor) Cultivars as a Source of Green Fodder Under Varying Levels of Nitrogen in Semi-arid Tropical India. Sugar Tech 2016, 19, 532–538. [Google Scholar] [CrossRef]
  41. Haciseferoğullari, H.; Acaroğlu, M.; Gezer, I. Determination of the Energy Balance of the Sugar Beet Plant. Energy Sources 2003, 25, 15–22. [Google Scholar] [CrossRef]
  42. Kalinichenko, A.; Havrysh, V.; Nitsenko, V. Alternative Vehicle Fuel Management: Impact on Energy Security Indicators. In Infrastructure and Environment; Springer Science and Business Media LLC: Berlin, Germany, 2019; pp. 367–374. [Google Scholar]
  43. Pervanchon, F.; Bockstaller, C.; Girardin, P. Assessment of energy use in arable farming systems by means of an agro-ecological indicator: The energy indicator. Agric. Syst. 2002, 72, 149–172. [Google Scholar] [CrossRef]
  44. Larnaudie, V.; Rochón, E.; Ferrari, M.D.; Lareo, C. Energy evaluation of fuel bioethanol production from sweet sorghum using very high gravity (VHG) conditions. Renew. Energy 2016, 88, 280–287. [Google Scholar] [CrossRef]
  45. Mikhno, I.; Koval, V.; Shvets, G.; Garmatiuk, O.; Tamošiūnienė, R. Green Economy in Sustainable Development and Improvement of Resource Efficiency. Central Eur. Bus. Rev. 2021, 10, 99–113. [Google Scholar] [CrossRef]
  46. State Statistics Service of Ukraine. Agriculture of Ukraine. Statistical Yearbook 2019; State Statistics Service of Ukraine: Kyiv, Ukraine, 2020. Available online: http://www.ukrstat.gov.ua/druk/publicat/kat_u/2020/zb/09/zb_sg_Ukr_2019.pdf (accessed on 26 March 2021).
  47. State Statistics Service of Ukraine. 2020. Available online: http://www.ukrstat.gov.ua/ (accessed on 26 March 2021).
  48. Babych, M.M. Food security indicators in Ukraine: Development trends. Ekon. APK 2018, 5, 41–50. [Google Scholar]
  49. Morozova, I.; Oechsner, H.; Roik, M.; Hülsemann, B.; Lemmer, A. Assessment of Areal Methane Yields from Energy Crops in Ukraine, Best Practices. Appl. Sci. 2020, 10, 4431. [Google Scholar] [CrossRef]
  50. Kiesel, A.; Lewandowski, I. Miscanthus as biogas substrate—Cutting tolerance and potential for anaerobic digestion. GCB Bioenergy 2017, 9, 153–167. [Google Scholar] [CrossRef]
  51. Zegada-Lizarazu, W.; Elbersen, H.W.; Cosentino, S.L.; Zatta, A.; Alexopoulou, E.; Monti, A. Agronomic aspects of future energy crops in Europe. Biofuels Bioprod. Biorefining 2010, 4, 674–691. [Google Scholar] [CrossRef]
  52. Kotrla, M.; Prčík, M. Evaluating the Effects of Climatic Parameters on Growth and Biomass Production of Miscanthus in Climate Conditions of Southern Slovakia. Pol. J. Environ. Stud. 2019, 29, 669–675. [Google Scholar] [CrossRef]
  53. López-Sandin, I.; Gutiérrez-Soto, G.; Gutiérrez-Díez, A.; Herrera, N.M.; Gutiérrez-Castorena, E.; Zavala-García, F.; Sandin, L.; Soto, G.; Díez, G.; Herrera, M.; et al. Evaluation of the Use of Energy in the Production of Sweet Sorghum (Sorghum bicolor (L.) Moench) Under Different Production Systems. Energies 2019, 12, 1713. [Google Scholar] [CrossRef] [Green Version]
  54. Jankowski, K.J.; Dubis, B.; Sokólski, M.M.; Załuski, D.; Bórawski, P.; Szempliński, W. Productivity and energy balance of maize and sorghum grown for biogas in a large-area farm in Poland: An 11-year field experiment. Ind. Crop. Prod. 2020, 148, 112326. [Google Scholar] [CrossRef]
  55. Ren, L.T.; Liu, Z.X.; Wei, T.Y.; Xie, G.H. Evaluation of energy input and output of sweet sorghum grown as a bioenergy crop on coastal saline-alkali land. Energy 2012, 47, 166–173. [Google Scholar] [CrossRef]
  56. Tang, S.; Wang, Z.; Chen, C.; Xie, P.; Xie, Q. The prospect of sweet sorghum as the source for high biomass crop. J. Agric. Sci. Bot. 2018, 2, 5–11. [Google Scholar] [CrossRef]
  57. Shvidenko, A.; Buksha, I.; Krakovska, S.; Lakyda, P. Vulnerability of Ukrainian Forests to Climate Change. Sustainability 2017, 9, 1152. [Google Scholar] [CrossRef] [Green Version]
  58. Andreichenko, A.; Andreichenko, S.; Smentyna, N. Ensuring Biosphere Balance in the Context of Agricultural Waste Management. Philos. Cosmol. 2021, 26, 46–61. [Google Scholar] [CrossRef]
  59. Kostenko, I. The Draft Law of Ukraine “On the Extraction and Utilization of Natural Resources of the Moon and Other Celestial Bodies”. Adv. Space Law 2020, 6, 29–42. [Google Scholar] [CrossRef]
  60. Kalinichenko, A.; Havrysh, V. Feasibility study of biogas project development: Technology maturity, feedstock, and utilization pathway. Arch. Environ. Prot. 2019, 45, 68–83. [Google Scholar] [CrossRef]
  61. Kalinichenko, A. Sensitivity Analysis in Investment Project of Biogas Plant. Appl. Ecol. Environ. Res. 2017, 15, 969–985. [Google Scholar] [CrossRef]
  62. Jiang, Y.; Havrysh, V.; Klymchuk, O.; Nitsenko, V.; Balezentis, T.; Streimikiene, D. Utilization of Crop Residue for Power Generation: The Case of Ukraine. Sustainability 2019, 11, 7004. [Google Scholar] [CrossRef] [Green Version]
  63. Havrysh, V.; Kalinichenko, A.; Brzozowska, A.; Stebila, J. Life Cycle Energy Consumption and Carbon Dioxide Emissions of Agricultural Residue Feedstock for Bioenergy. Appl. Sci. 2021, 11, 2009. [Google Scholar] [CrossRef]
  64. Bazaluk, O.; Havrysh, V.; Nitsenko, V. Energy and Environmental Assessment of Straw Production for Power Generation. E3S Web Conf. 2021, 228, 1010. [Google Scholar] [CrossRef]
  65. Aguilera, E.; Guzmán, G.I.; Infante-amate, J.; García-ruiz, R.; Herrera, A.; Villa, I.; Embodied Energy in Agricultural Inputs. Incorporating a Historical Perspective. DT-SEHA 15. 2015. Available online: http://hdl.handle.net/10234/141278 (accessed on 5 April 2021).
  66. Skowrońska, M.; Filipek, T. Life cycle assessment of fertilizers: A review. Int. Agrophys. 2014, 28, 101–110. [Google Scholar] [CrossRef]
  67. Ledgard, S.F.; Boyes, M.; Brentrup, F. Life cycle assessment of local and imported fertilisers used on New Zealand farms. In Adding to the Knowledge Base for the Nutrient Manager; Occasional Report No. 24.; Christensen: Lincoln, NE, USA, 2011; Available online: https://www.massey.ac.nz/~flrc/workshops/11/Manuscripts/Ledgard_2011.pdf (accessed on 1 February 2021).
  68. Wood, S.; Cowie, A. A Review of Greenhouse Gas Emission Factors for Fertiliser Production. For IEA Bioenergy Task 38. 2004. Available online: https://www.sciencetheearth.com/uploads/2/4/6/5/24658156/2004_wood_a_review_of_greenhouse_gas_emission_factors.pdf (accessed on 1 February 2021).
  69. Veiga, J.P.S.; Romanelli, T.L.; Gimenez, L.; Busato, P.; Milan, M. Energy embodiment in Brazilian agriculture: An overview of 23 crops. Sci. Agric. 2015, 72, 471–477. [Google Scholar] [CrossRef]
  70. Todde, G.; Murgia, L.; Caria, M.; Pazzona, A. A Comprehensive Energy Analysis and Related Carbon Footprint of Dairy Farms, Part 2: Investigation and Modeling of Indirect Energy Requirements. Energies 2018, 11, 463. [Google Scholar] [CrossRef] [Green Version]
  71. Demirel, B.; Gürdil, G.A.C.; Gadalla, O. Biomass energy potential from agricultural production in Sudan. ETHABD 2019, 2, 35–38. Available online: https://dergipark.org.tr/tr/download/article-file/757591 (accessed on 13 April 2021).
  72. Manyuchi, M.M.; Frank, R.; Mbohwa, C.; Muzenda, E. Potential to use sorghum brewers spent grains as a boiler fuel. BioResources 2017, 12, 7228–7240. Available online: https://bioresources.cnr.ncsu.edu/resources/potential-to-use-sorghum-brewers-spent-grains-as-a-boiler-fuel/#:~:text=The%20potential%20of%20using%20sorghum,for%20the%20production%20of%20bioelectricity.&text=After%20a%20full%20proximate%20analysis,fixed%20carbon%20content%20of%2041.6%25 (accessed on 13 April 2021).
  73. Monthly and Annual Precipitation in Nikolaev. 2021. Available online: http://www.pogodaiklimat.ru/history/33846_2.htm (accessed on 5 April 2021).
  74. Monthly and Annual Precipitation in Kherson. 2021. Available online: http://www.pogodaiklimat.ru/history/33902_2.htm (accessed on 5 April 2021).
  75. Monthly and Annual Precipitation in Odessa. 2021. Available online: http://www.pogodaiklimat.ru/history/33837_2.htm (accessed on 5 April 2021).
  76. Sadras, V.O.; Grassini, P.; Steduto, P. Status of Water Use Efficiency of Main Crops. SOLAW Background Thematic Report—TR07. 2012. Available online: http://www.fao.org/fileadmin/templates/solaw/files/thematic_reports/TR_07_web.pdf (accessed on 10 April 2021).
  77. Nitsenko, V.S.; Havrysh, V.I. Enhancing the stability of a vertically integrated agro-industrial companies in the conditions of uncertainty. Actual Probl. Econ. 2016, 10, 167–172. [Google Scholar]
  78. Koval, V.; Mikhno, I.; Hajduga, G.; Gaska, K. Economic efficiency of biogas generation from food product waste. E3S Web Conf. 2019, 100, 00039. [Google Scholar] [CrossRef] [Green Version]
  79. Garofalo, P.; D’Andrea, L.; Vonella, A.V. Sweet sorghum in a bioethanol supply chain: Effects of different soil and nitrogen management on energy performances and greenhouse gas emissions. Ital. J. Agrometeorol. 2016, 2, 15–24. [Google Scholar] [CrossRef]
  80. Bielski, S.; Romaneckas, K.; Novikova, A.; Šarauskis, E. Are Higher Input Levels to Triticale Growing Technologies Effective in Biofuel Production System? Sustainability 2019, 11, 5915. [Google Scholar] [CrossRef] [Green Version]
  81. Boiko, M. The impact of sowing density and time on the productivity of grain sorghum hybrids under conditions in the South of Ukraine. Ukr. Black Sea Reg. Agrar. Sci. 2016, 3, 96–103. [Google Scholar]
  82. Ikoeva, V.A.; Okazova, Z.P. Efficiency of cultivation of sweet sorghum for green fodder and silage in the steppe zone of the republic of north Ossetia-Alania. Mod. Sci. Educ. 2014, 5. Available online: https://www.science-education.ru/pdf/2014/5/194.pdf (accessed on 16 April 2021).
  83. Statistical Yearbook of Ukraine for 2018. Kyiv; 2019. Available online: http://www.ukrstat.gov.ua/druk/publicat/kat_u/2019/zb/11/zb_yearbook_2018_e.pdf (accessed on 5 July 2021).
  84. Bioplat EU Project-Horizon. 2020. Available online: https://bioplat.eu/about (accessed on 3 July 2021).
  85. Herrmann, C.; Idler, C.; Heiermann, M. Biogas crops grown in energy crop rotations: Linking chemical composition and methane production characteristics. Bioresour. Technol. 2016, 206, 23–35. [Google Scholar] [CrossRef] [PubMed] [Green Version]
  86. Battista, F.; Frison, N.; Bolzonella, D. Energy and Nutrients’ Recovery in Anaerobic Digestion of Agricultural Biomass: An Italian Perspective for Future Applications. Energies 2019, 12, 3287. [Google Scholar] [CrossRef] [Green Version]
  87. Rakhmetova, S.O.; Vergun, O.M.; Blume, R.Y.; Bondarchuk, O.P.; Shymanska, O.V.; Tsygankov, S.P.; Yemets, A.I.; Blume, Y.B.; Rakhmetov, D.B. Ethanol Production Potential of Sweet Sorghum in North and Central Ukraine. Open Agric. J. 2020, 14, 321–338. [Google Scholar] [CrossRef]
  88. Gaffney, O.; Steffen, W. The Anthropocene equation. Anthr. Rev. 2017, 4, 53–61. [Google Scholar] [CrossRef]
Figure 1. Climate zones of Ukraine (Source: adapted from [57]).
Agriculture 11 00695 g001
Figure 2. Sweet sorghum production: (a) a disc harrow; (b) shallow tillage; and (c) field studies.
Agriculture 11 00695 g002aAgriculture 11 00695 g002b
Figure 3. Precipitation for the South of Ukraine (1970–2020).
Agriculture 11 00695 g003
Figure 4. Average annual air temperature in the Southern regions of Ukraine.
Agriculture 11 00695 g004
Figure 5. Arid periods for past 50 years, years.
Agriculture 11 00695 g005
Figure 6. Monthly air temperature and precipitation during the sweet sorghum growing.
Agriculture 11 00695 g006
Figure 7. The structure of energy inputs, %.
Agriculture 11 00695 g007
Figure 8. Yield versus total energy consumption.
Agriculture 11 00695 g008
Figure 9. Energy efficiency ratio.
Agriculture 11 00695 g009
Figure 10. Water use efficiency for sweet sorghum.
Agriculture 11 00695 g010
Figure 11. Water use efficiency for grain sorghum.
Agriculture 11 00695 g011
Table 1. Production of sweet sorghum.
Farming OperationDescription
TillageSkimming (6–8 cm)
Cultivation (8–10 cm)
Harrowing
Sowing
Fertilization
5 May; 75 cm inter row spacing; 105 seeds per hectare; cultivar—Silo 700 D
18.7 kgN/ha, 78.7 kgP2O5/ha (before sowing)
20 kgN/ha (feeding, ammonium nitrate)
Weed controlinter-row cultivation
Chemicals: 0.025 kg/ha (glyphosate); 4 kg/ha (PIK)
HarvestingSeptember, milk ripe
Table 2. Production of grain sorghum.
Farming OperationDescription
TillageSkimming (6–8 cm)
Ploughing (23–25 cm)
Cultivation (5–7 cm)
Harrowing
SowingPre-sowing cultivation (3–4 cm)
4 April; 75 cm inter row spacing;
105, 1.4 × 10⁵, 1.8 × 10⁵, 2.2 × 10⁵ seeds per hectare; cultivar—Sontsedar
FertilizationSuperphosphate—300 kg/ha; ammonium sulfate—150 kg/ha;
ammonium nitrate—87 kg/ha
Weed controlinter-row cultivation
Chemicals: 4.1 kg/ha (glyphosate, PiK)
HarvestingSeptember
Table 3. Energy equivalents of basic technological materials.
Resource (Substance)Unit of MeasurementEnergy Equivalent
Energy Resources
Diesel fuelMJ/kg56.8
GasolineMJ/kg60.2
Electric energyMJ/kWh12.1
Mineral Fertilizers
NitrogenMJ/kg active substance52.02–121.21
PhosphorusMJ/kg active substance12.6–63.02
PotassiumMJ/kg active substance6.7–17.77
Ammonium nitrateMJ/kgN40.0
Ammonium sulphateMJ/kgN42
SuperphosphateMJ/kgP13
Mineral fertilizers Zorka (10:40 N: P2O5)MJ/kg13.72
Biomaterial
Seed materialMJ/kg59.5
Sorghum silage (fresh)MJ/kg3.1
Sorghum grainMJ/kg12.60
Sorghum strawMJ/kg12.38
Crop protecting
GlyphosadMJ/kg454
LifosadMJ/kg454
PIKMJ/kg1020
Machinery
TractorMJ/kg138
ImplementMJ/kg69
Stationary equipmentMJ/m25025
Table 4. Annual precipitation.
RegionMinimum, mmMaximum, mmAverage, mm
Mykolaiv243705426
Odessa247754463
Kherson276685447
Table 5. Air temperature.
RegionMinimum, °CMaximum, °CAverage, °C
Mykolaiv8.512.510.5
Odessa8.41310.8
Kherson7.812.510.4
Table 6. Water productivity.
CropYield, kg/(mm × ha)−1
IrrigatedDryland
Maize11–326–23
Sorghum3–225–21
Wheat6–175–10
Sunflower4–93–5
soybean6–96–10
Table 7. Input and output material and energy flows.
IndicatorUnitValue
I. Input Flows
Diesel fuelkg/ha63.5
Gasolinekg/ha8
Electric energykWh/ha11.38
Mineral fertilizers Zorka (10:40 N: P2O5)kg/ha187
Sweet sorghum seedskg/ha6
Herbicide glyphosatekg/ha0.025
PIC herbicidekg/ha8
II. Output Flow
Sweet sorghum silaget/ha40.6
Table 8. Indirect energy inputs.
Technological MaterialInput, kg/haEnergy Equivalent, MJ/kgEnergy Content, MJ/ha
nitrogen18.786.801623.16
phosphorus74.812.60942.48
Lifosad8454.003632.00
PIK (herbicide)0.0251020.0025.50
seed659.50357.00
Total: 6580.14
Table 9. The main energy indicators of the technology.
IndicatorUnitValue
Energy Inputs
directGJ/ha3.926
Indirect (fertilizers and chemicals)GJ/ha6.580
InvestmentGJ/ha0.750
Total energy inputsGJ/ha11.256
Total energy consumption per unit of sweet sorghum silageGJ/t0.277
Energy Output
Sweet sorghum outputGJ/ha125.860
Energy efficiency ratio-11.18
Table 10. Structure of energy consumption by technological operations (direct and investment costs).
Technological OperationEnergy Inputs
MJ/ha%
I. Basic tillage and application of mineral fertilizers1157.0128.20
II. Pre-sowing tillage and sowing648.1715.80
III. Crop management505.9912.33
IV. Harvesting1791.9243.67
Total:4103.09100.00
Table 11. Input material and energy flows.
IndicatorUnitValue
Diesel fuelkg/ha72.93
Gasolinekg/ha8
Electric energykWh/ha9.3
superphosphatekg/ha300
ammonium sulfatekg/ha150
ammonium nitratekg/ha87
sorghum seedskg/ha6
Herbicide glyphosatekg/ha0.025
PIC herbicidekg/ha8
Table 12. Energy efficiency (cultivar—Sontsedar).
Terms of SowingAnnual Rainfall, mmPlant Density, Thousand Seeds per HectareEnergy Efficiency Ratio
Early258.91006.518
Early258.91407.559
Early258.91805.640
Early258.92205.536
Late258.91003.446
Late258.91402.814
Late258.91802.956
Late258.92202.646
Early348.91008.568
Early348.91409.936
Early348.91807.414
Early348.92207.277
Late348.91006.049
Late348.91404.939
Late348.91805.188
Late348.92204.645
Early523.110014.451
Early523.114016.757
Early523.118012.504
Early523.122012.273
Late523.11004.488
Late523.11403.664
Late523.11803.849
Late523.12203.445
Table 13. Correlation matrix.
X1X2X3Y
X11
X201
X3001
Y−0.730880.456368−0.153881
Publisher’s Note: MDPI stays neutral with regard to jurisdictional claims in published maps and institutional affiliations.