
QTL Analysis of Rice Grain Size Using Segregating Populations Derived from the Large Grain Line

 ,
, 
Abstract
:1. Introduction
2. Materials and Methods
2.1. Plant Materials
2.2. Phenotype Evaluation
2.3. DNA Extraction
2.4. Fluidigm Genotyping
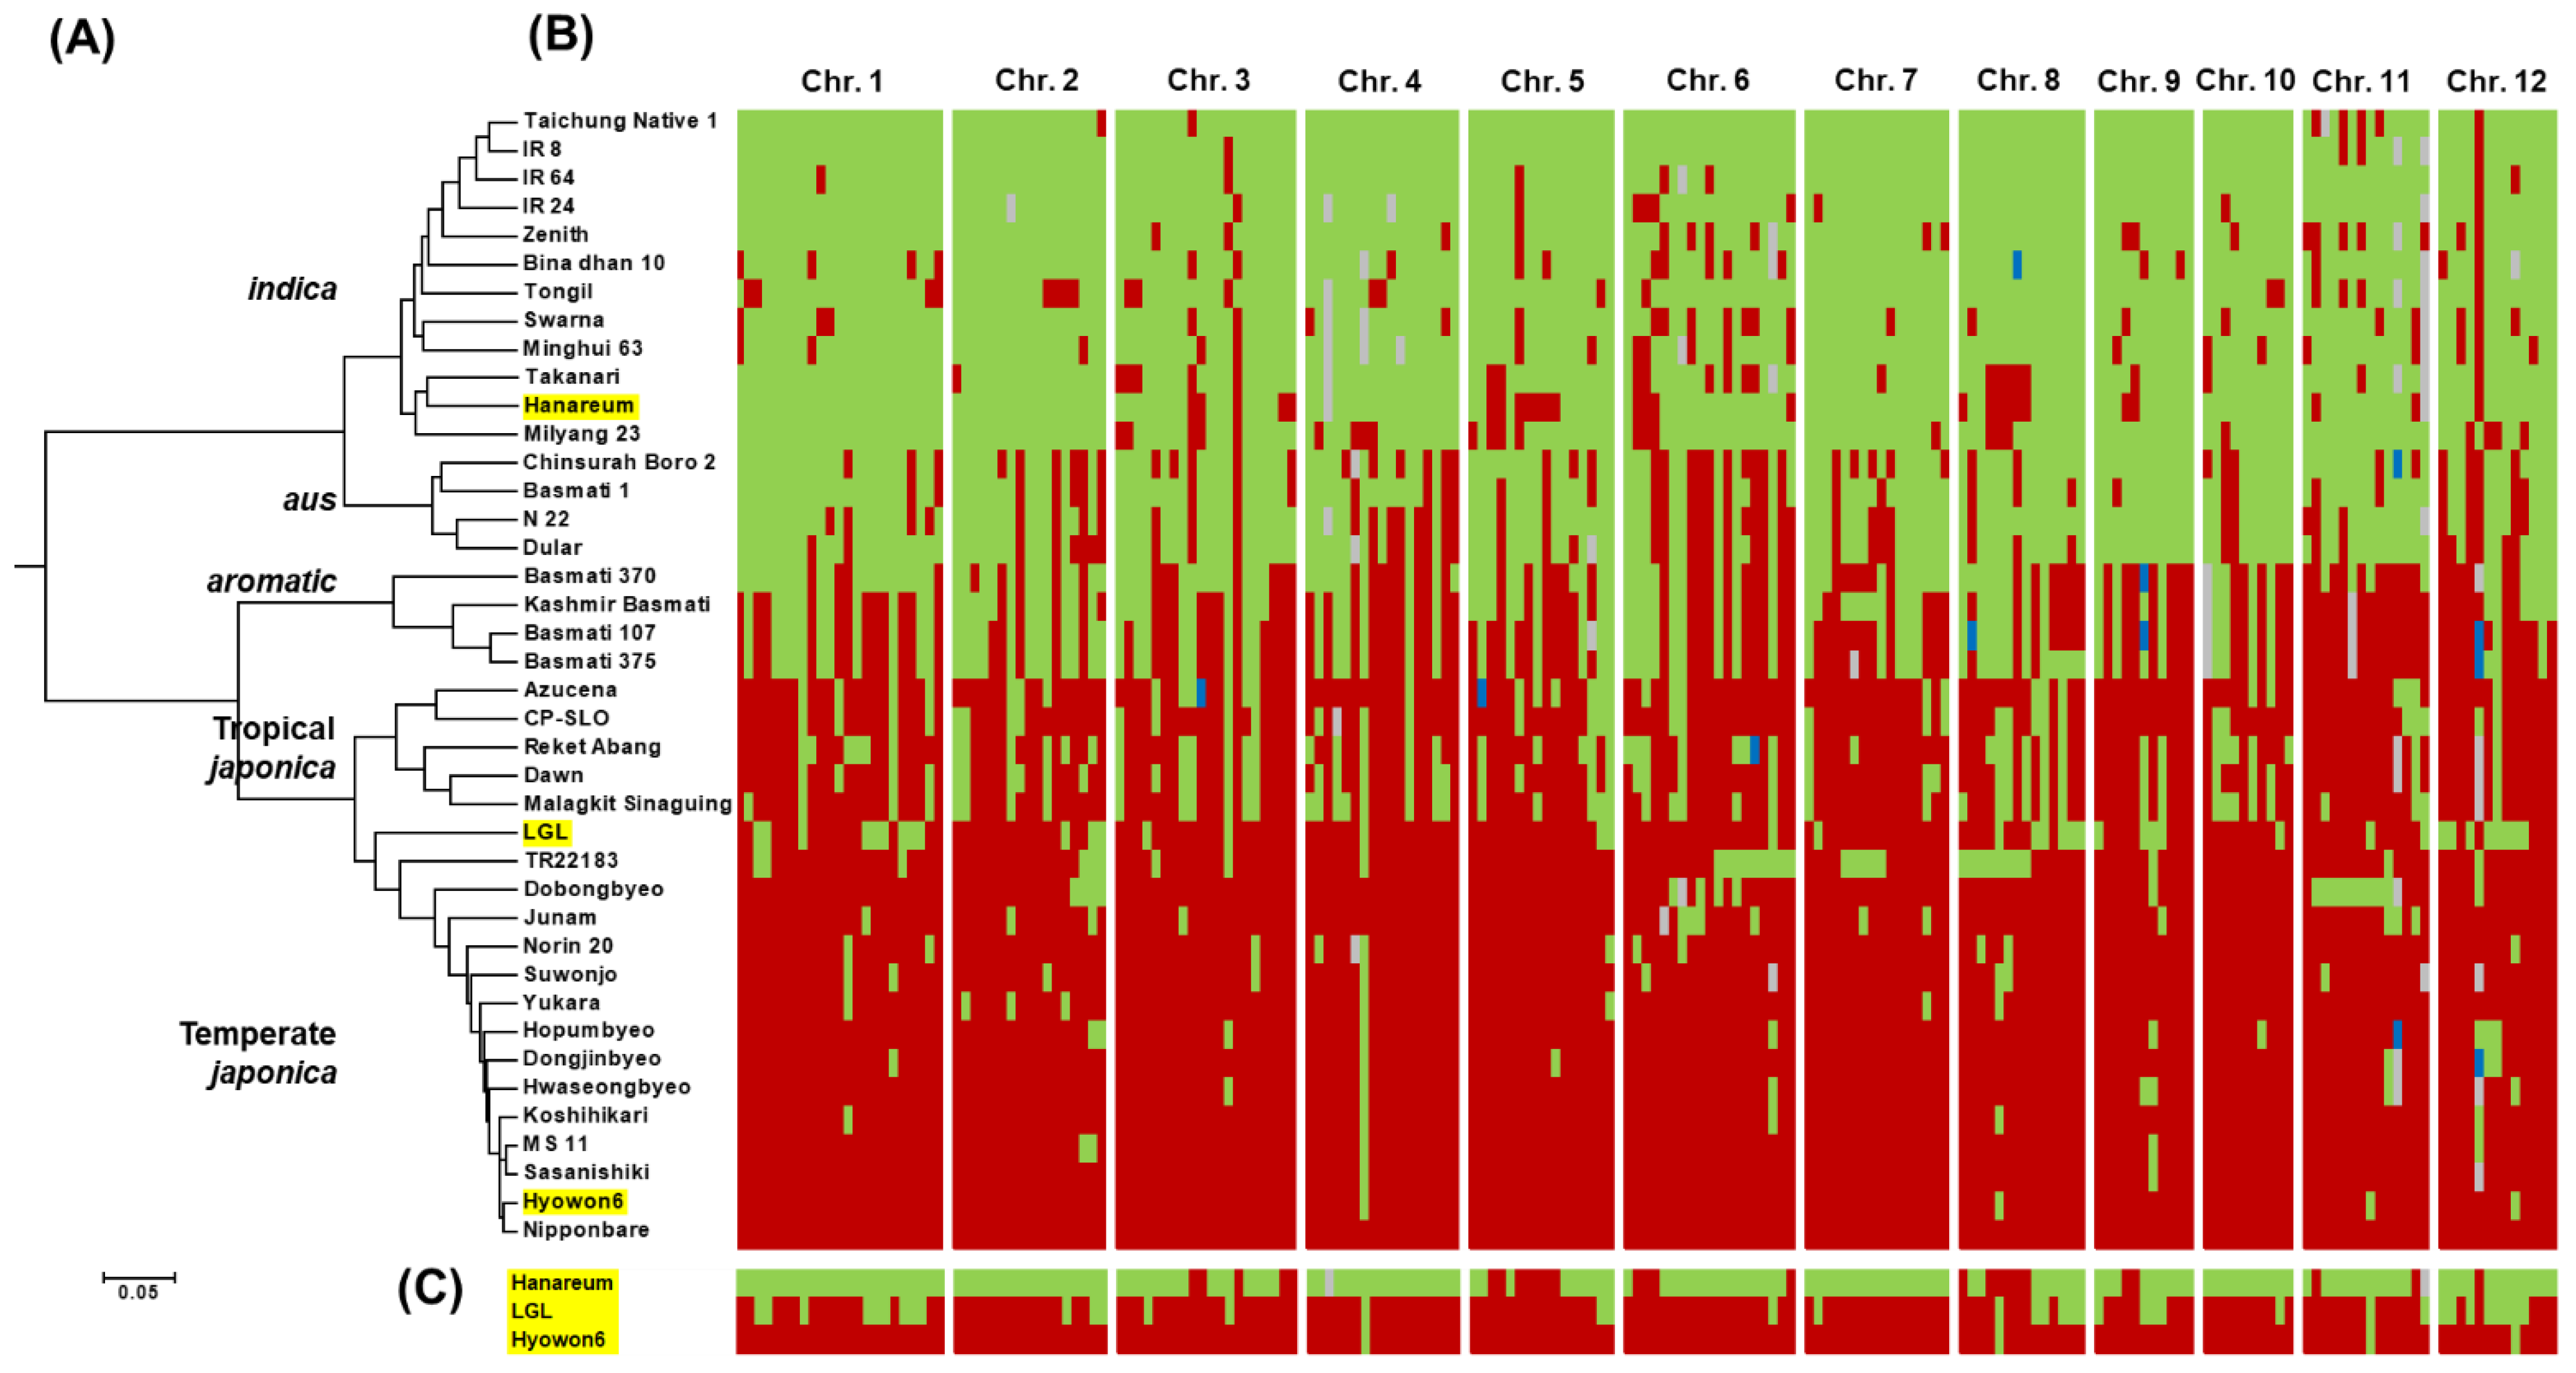
2.5. Phylogenetic Analysis
2.6. Linkage Map Construction and QTL Analysis
3. Results
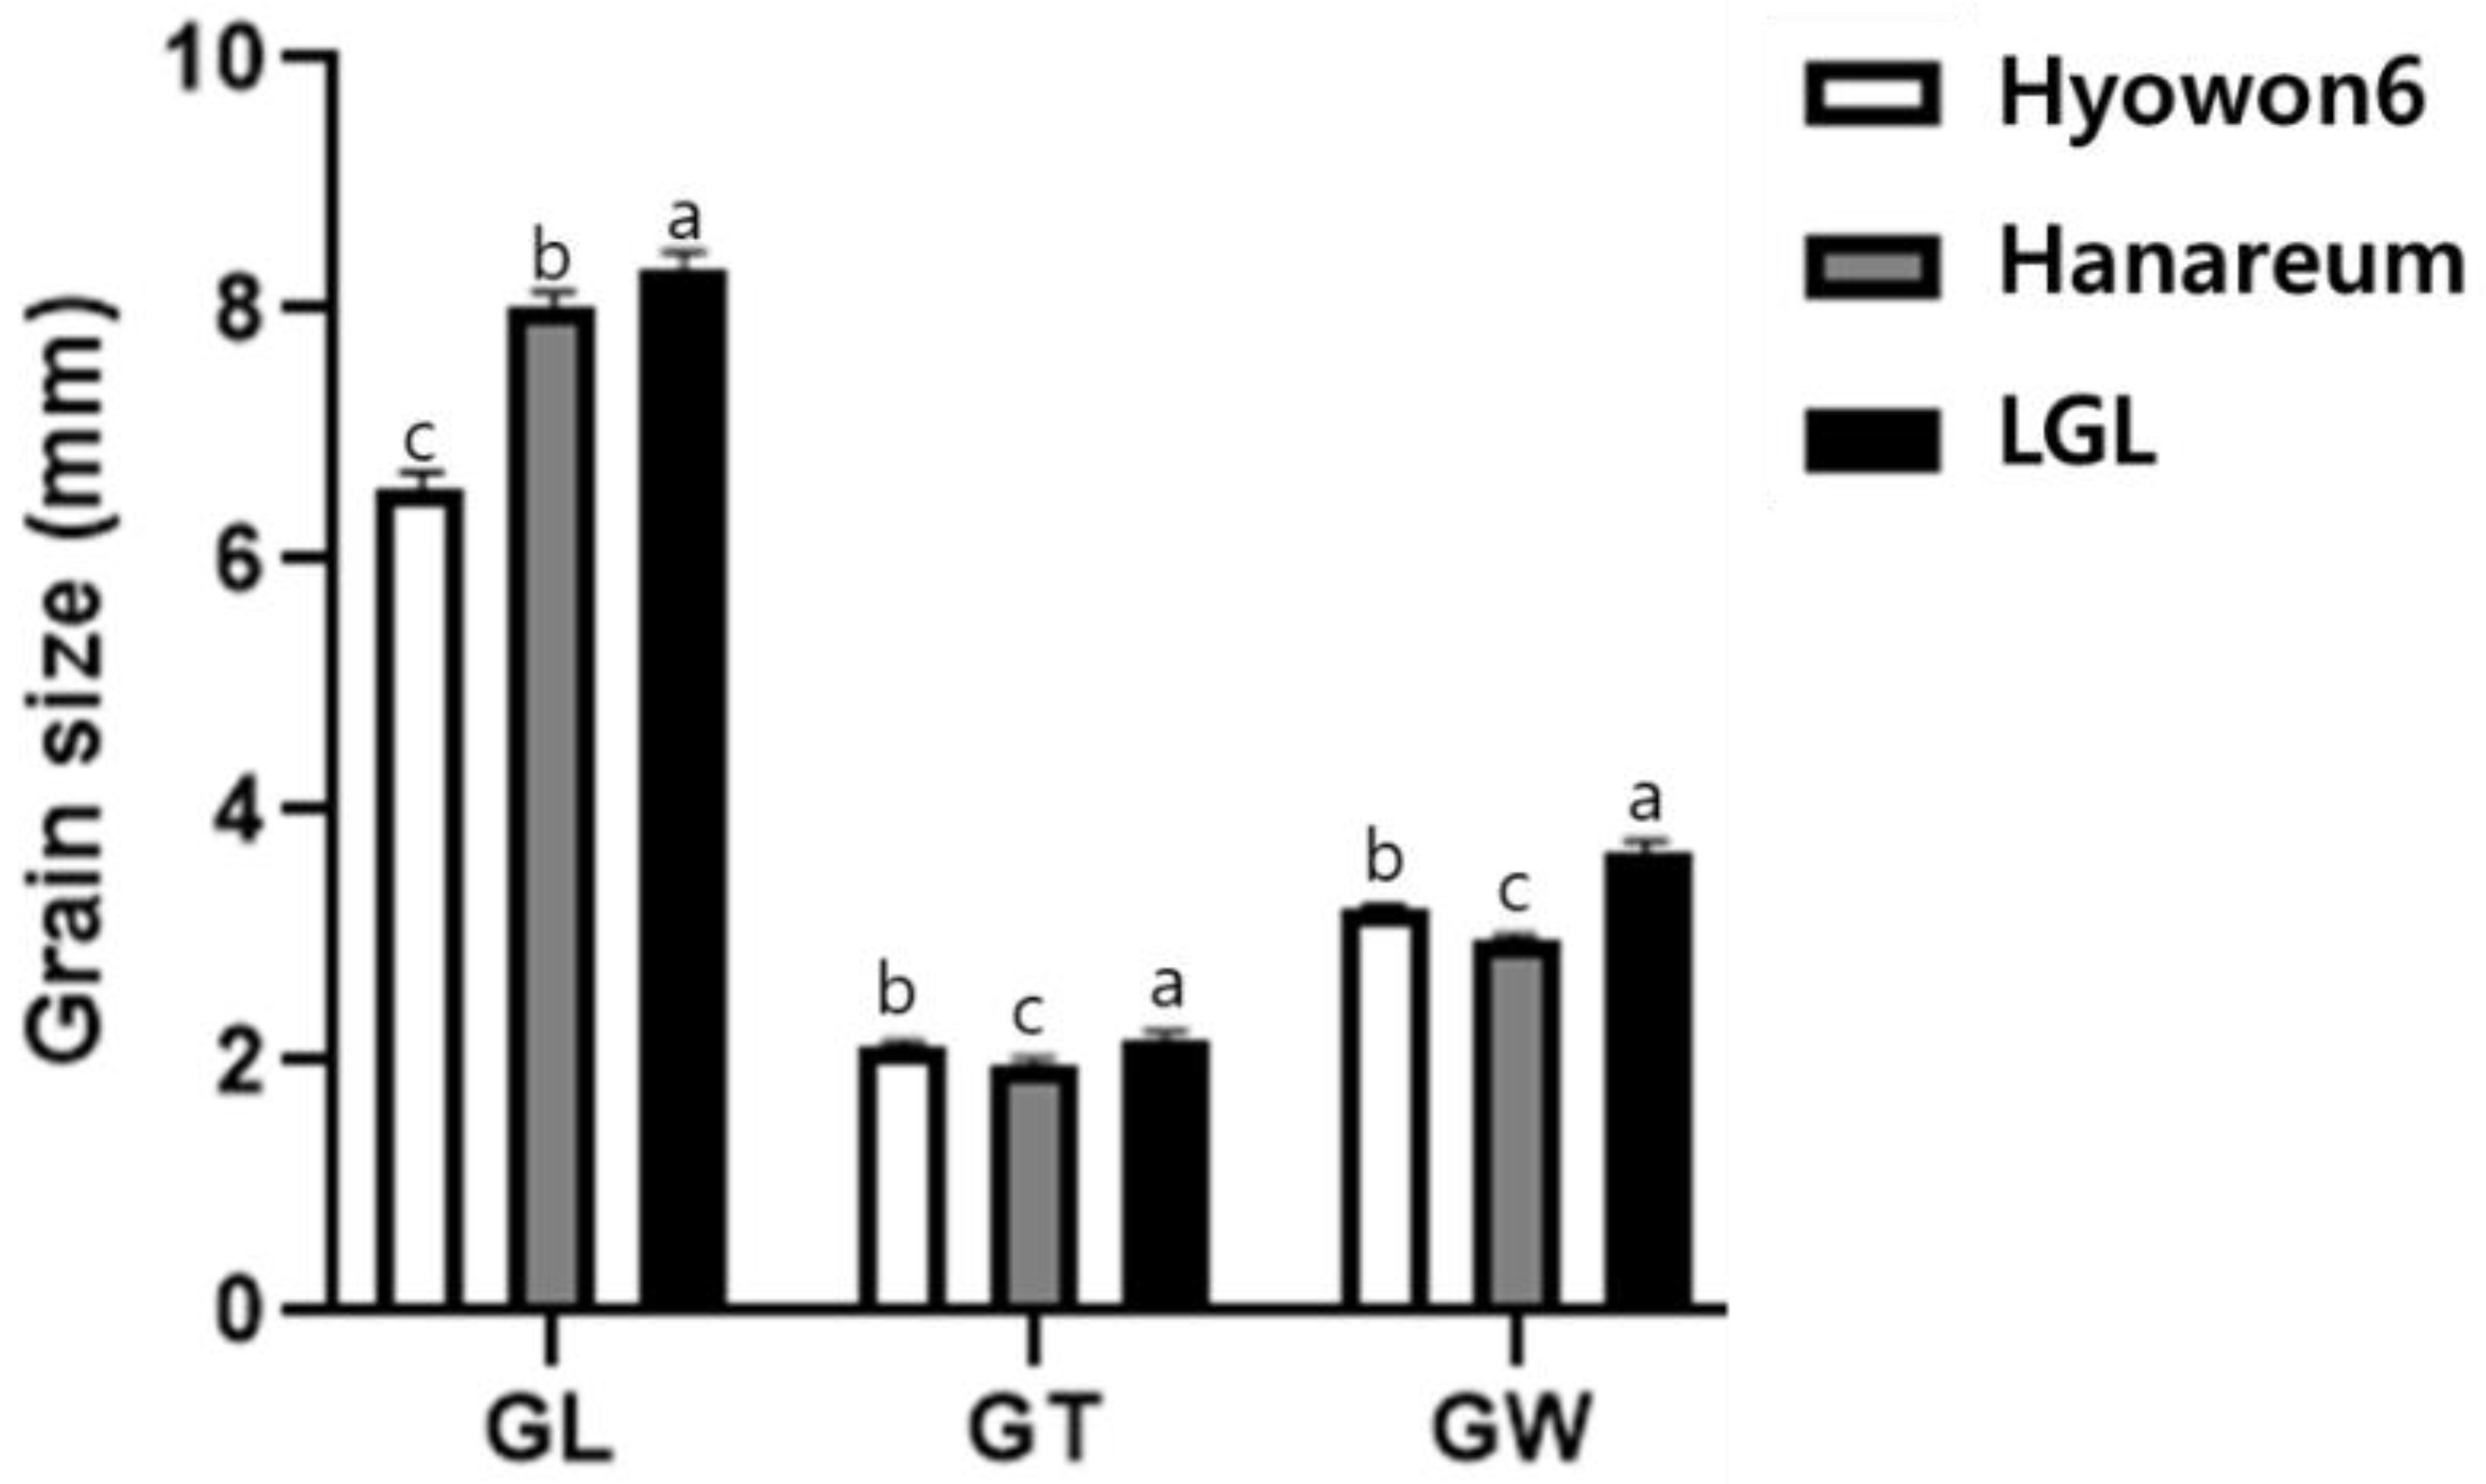
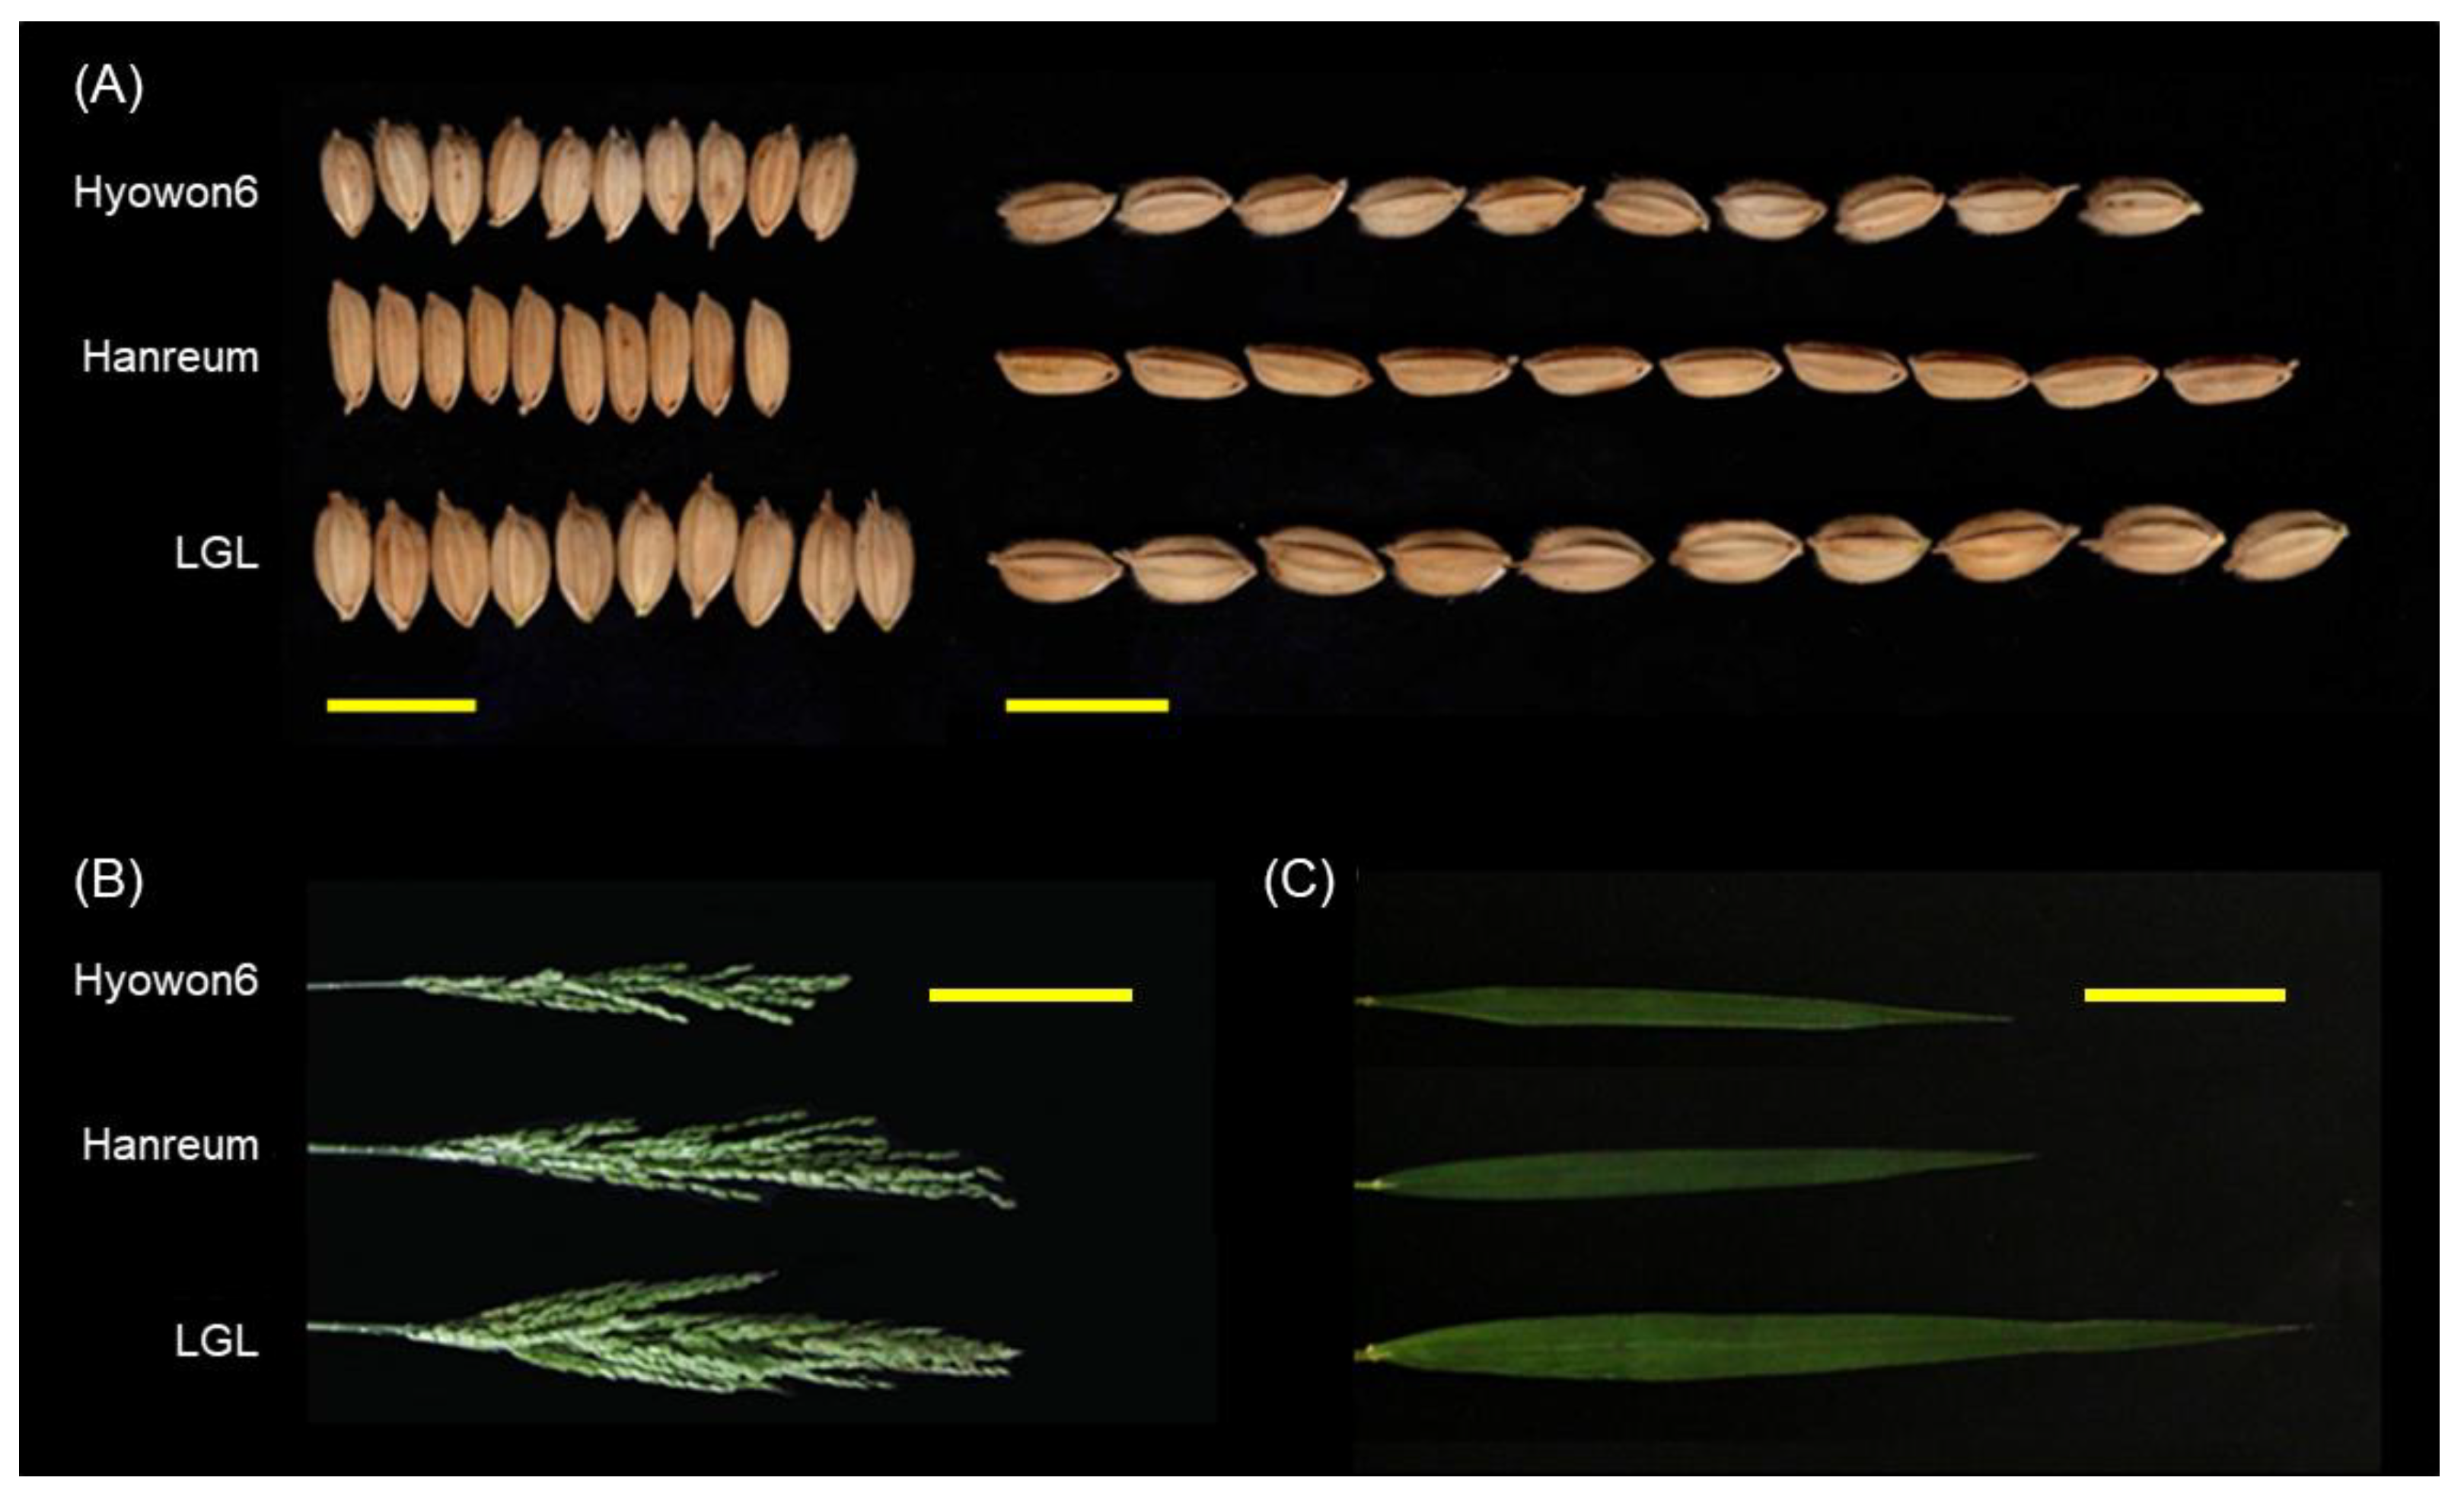
3.1. Characterization of LGL
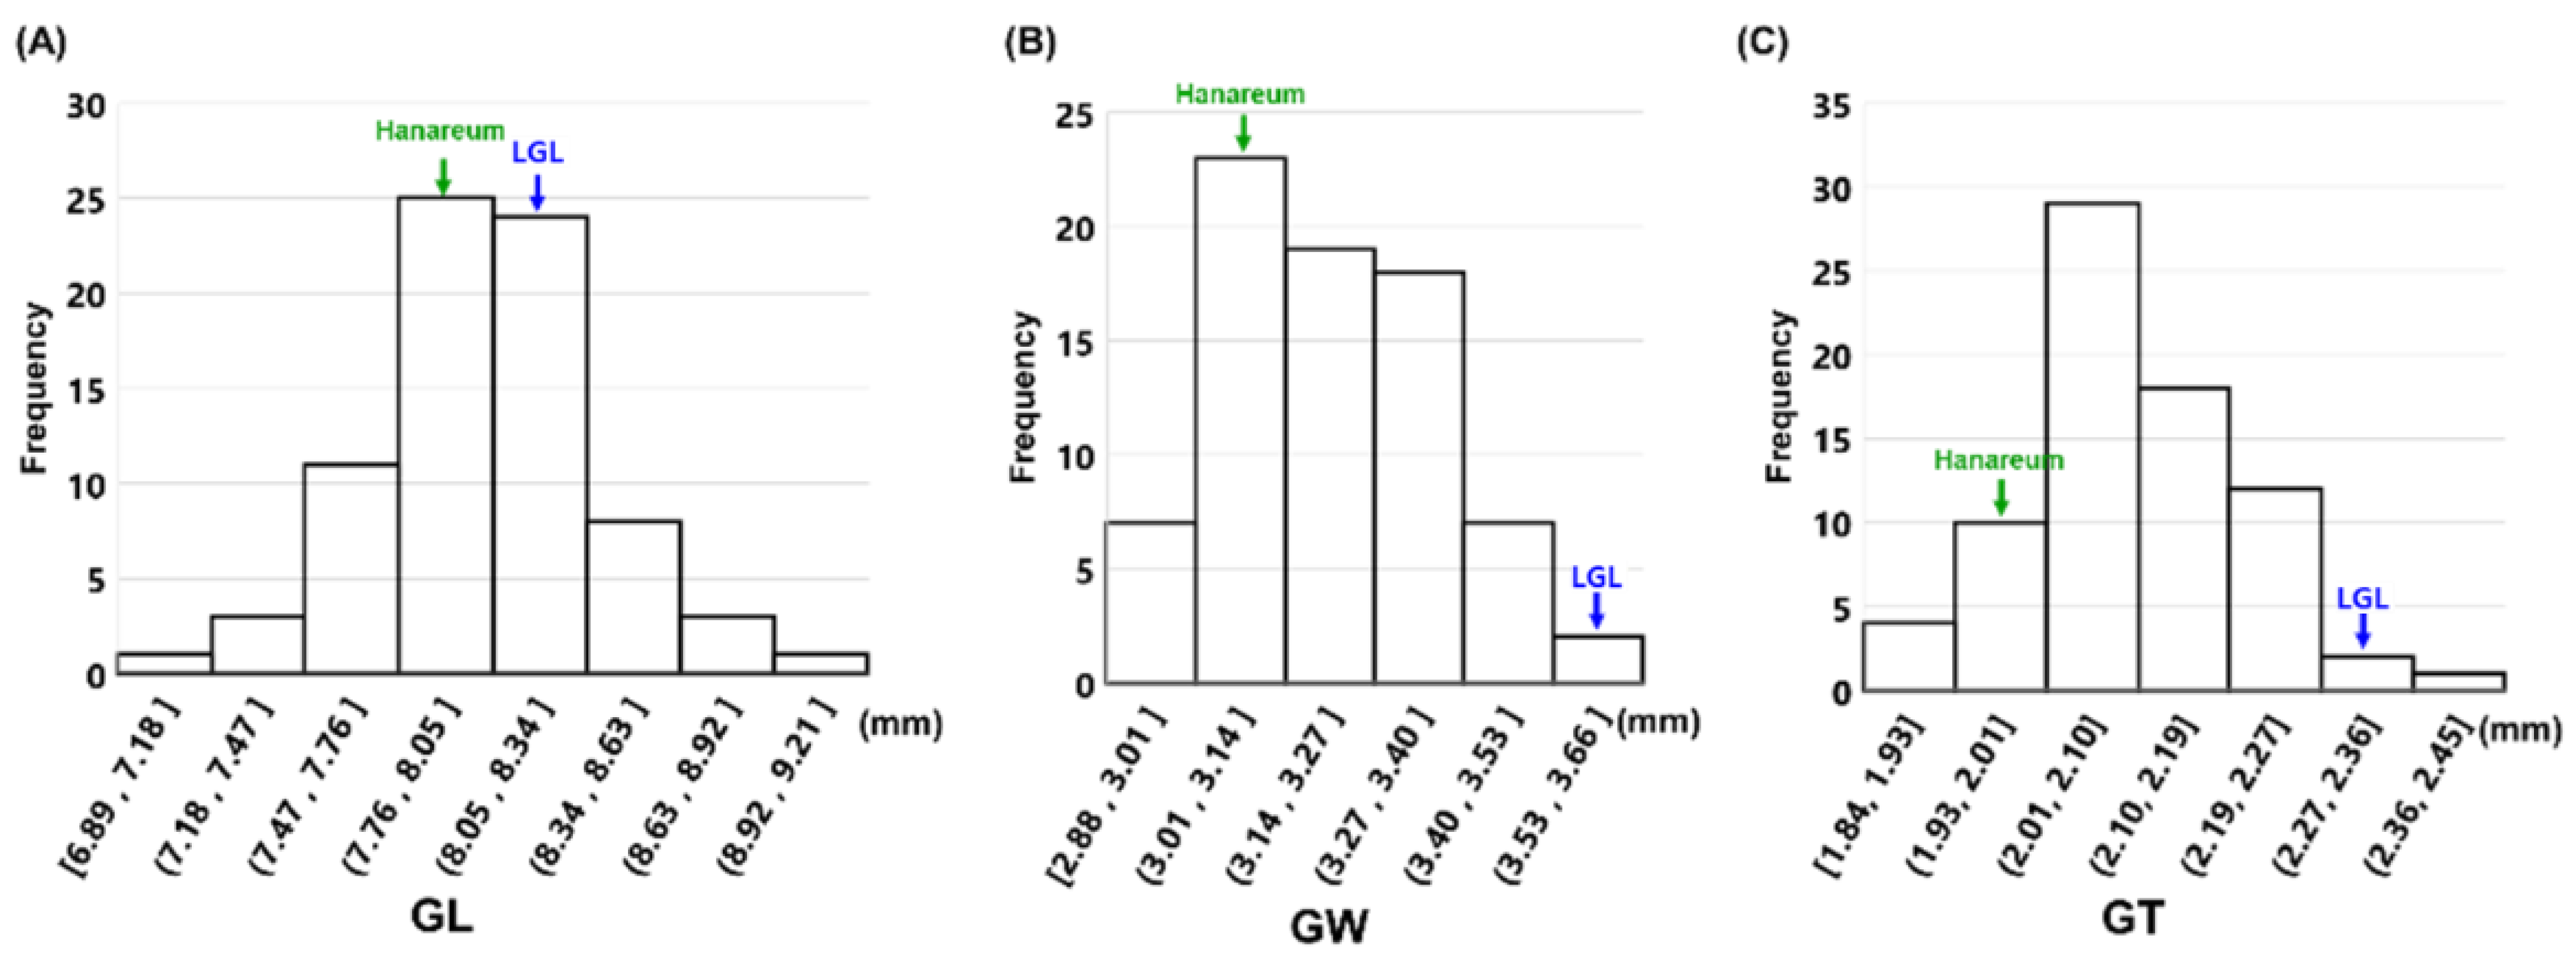
3.2. Phenotypic Variation in the F2 Population
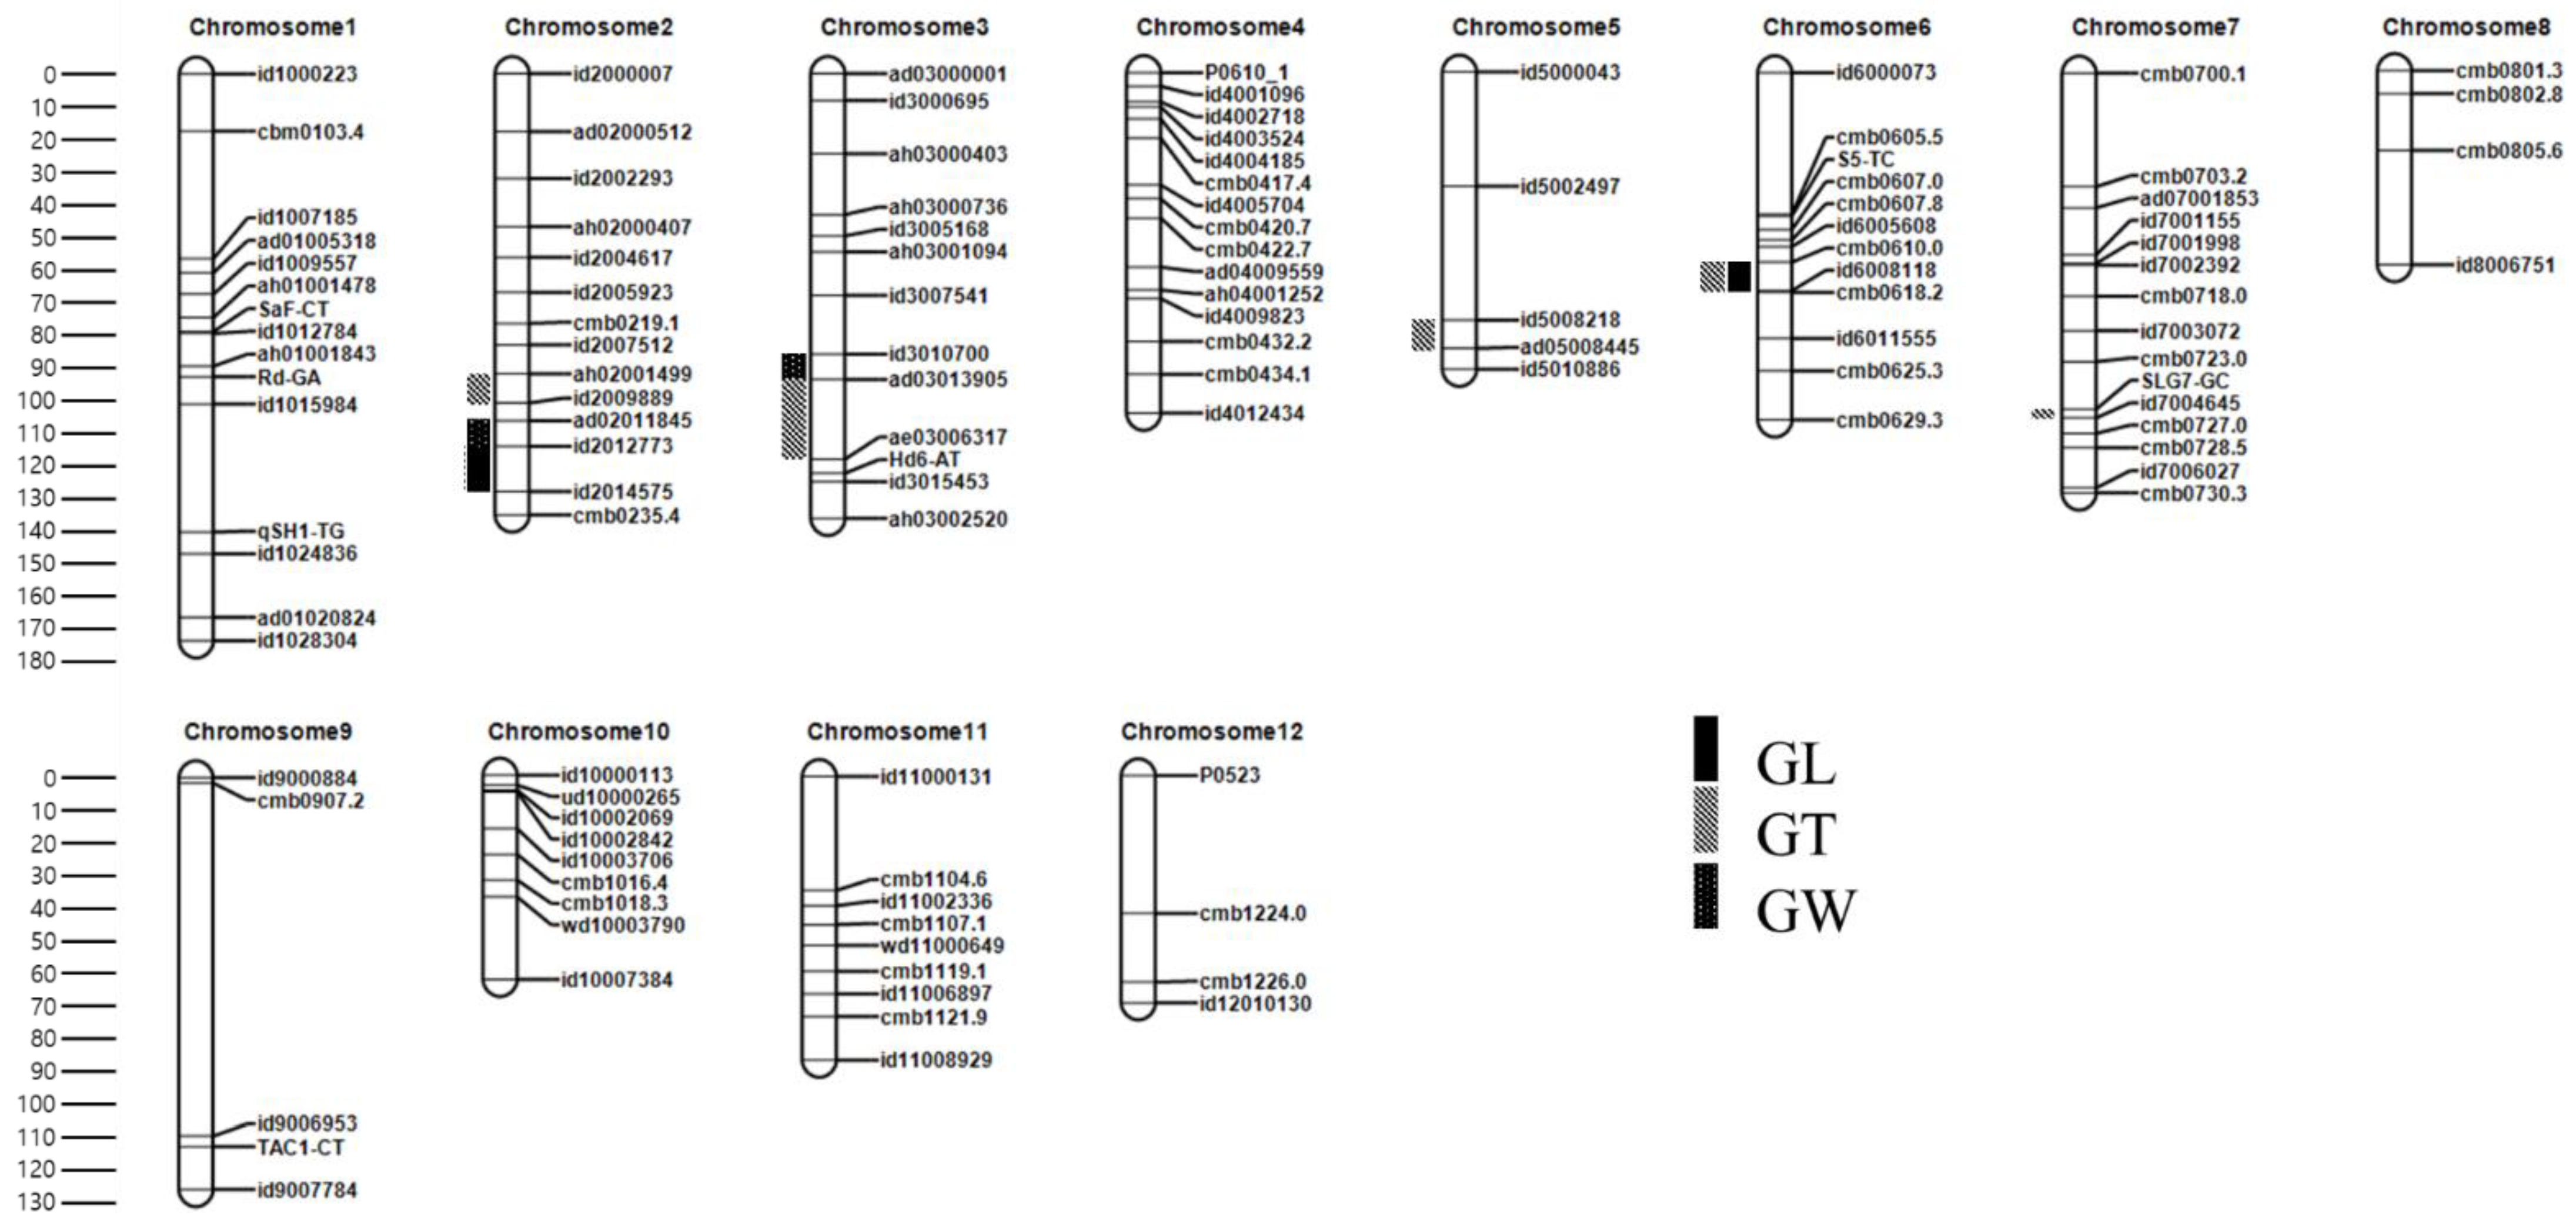
3.3. Linkage Map Construction in the F2 Population
3.4. QTL Analysis in the F2 Population
3.4.1. QTLs for GL
3.4.2. QTLs for GW
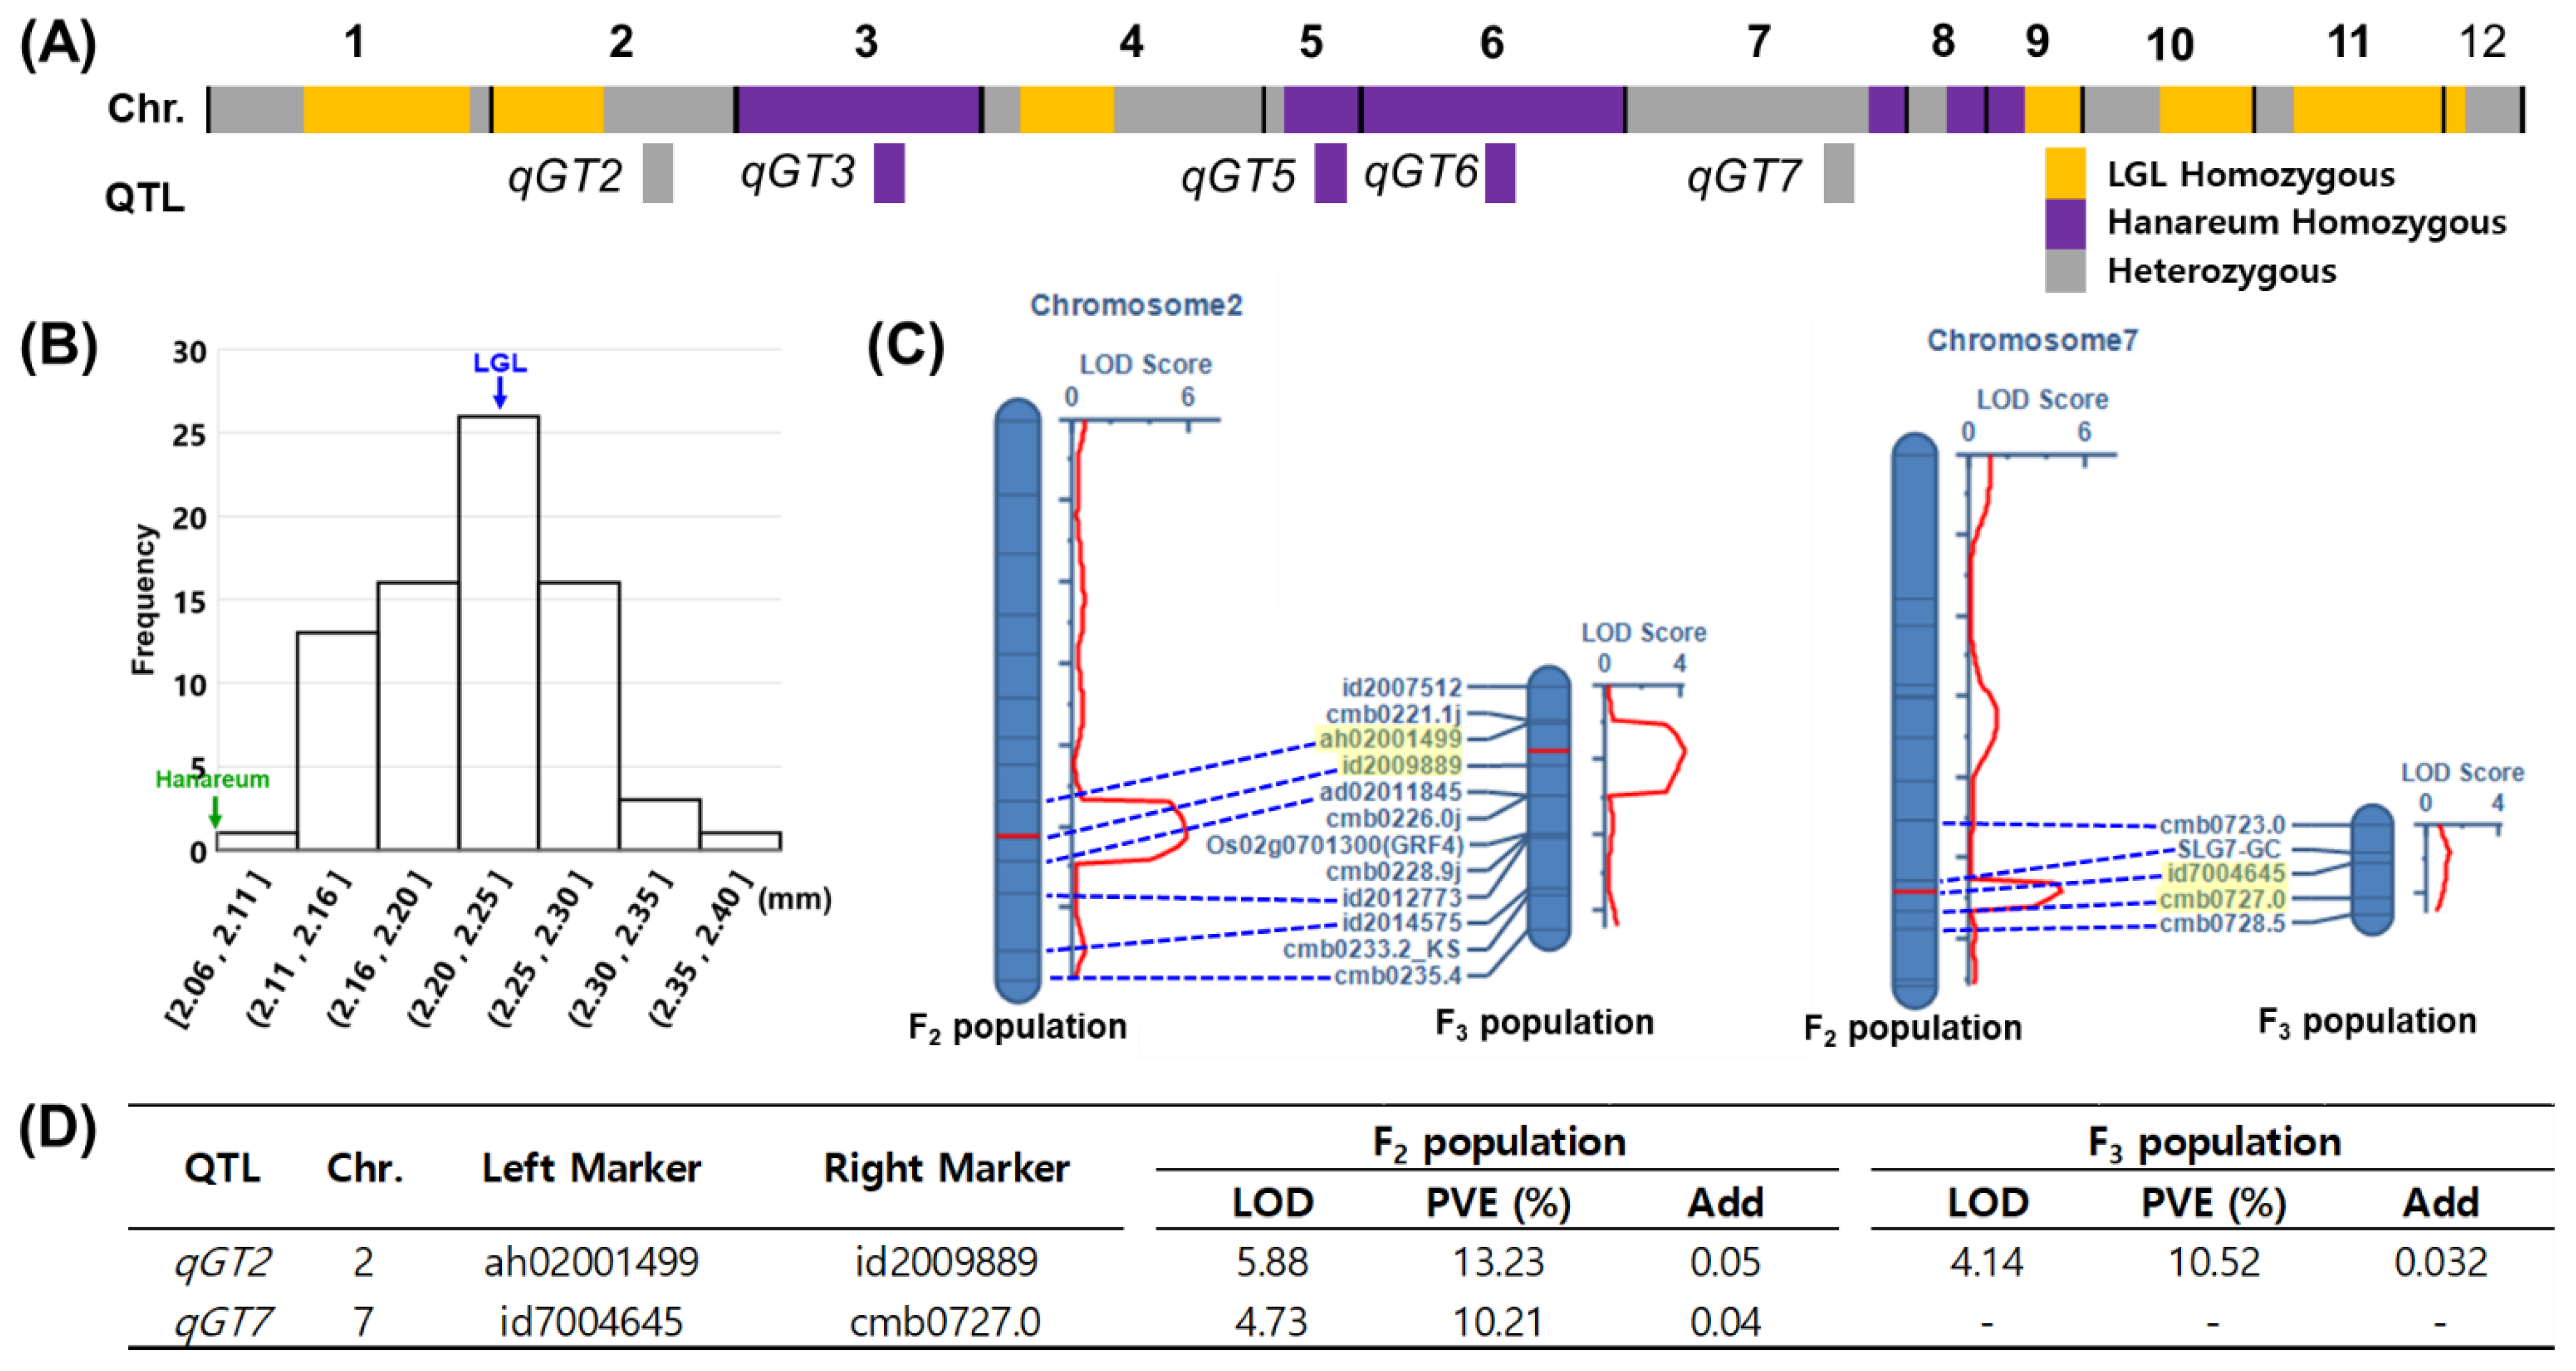
3.4.3. QTLs for GT
3.5. qGT2 Validation Using Selected F3 Population
4. Discussion
5. Conclusions
Supplementary Materials
Author Contributions
Funding
Institutional Review Board Statement
Informed Consent Statement
Data Availability Statement
Conflicts of Interest
References
- Zeng, D.; Tian, Z.; Rao, Y.; Dong, G.; Yang, Y.; Huang, L.; Leng, Y.; Xu, J.; Sun, C.; Zhang, G.; et al. Rational design of high-yield and superior-quality rice. Nat. Plants 2017, 3, 17031. [Google Scholar] [CrossRef]
- Godfray, H.C.J.; Beddington, J.R.; Crute, I.R.; Haddad, L.; Lawrence, D.; Muir, J.F.; Pretty, J.; Robinson, S.; Thomas, S.M.; Toulmin, C. Food Security: The Challenge of Feeding 9 Billion People. Science 2010, 327, 812–818. [Google Scholar] [CrossRef] [Green Version]
- Harberd, N.P. Shaping Taste: The Molecular Discovery of Rice Genes Improving Grain Size, Shape and Quality. J. Genet. Genom. 2015, 42, 597–599. [Google Scholar] [CrossRef]
- Song, X.J.; Huang, W.; Shi, M.; Zhu, M.Z.; Lin, H.X. A QTL for rice grain width and weight encodes a previously unknown RING-type E3 ubiquitin ligase. Nat. Genet. 2007, 39, 623–630. [Google Scholar] [CrossRef] [PubMed]
- Fan, C.; Xing, Y.; Mao, H.; Lu, T.; Han, B.; Xu, C.; Li, X.; Zhang, Q. GS3, a major QTL for grain length and weight and minor QTL for grain width and thickness in rice, encodes a putative transmembrane protein. Theor. Appl. Genet. 2006, 112, 1164–1171. [Google Scholar] [CrossRef] [PubMed]
- Shomura, A.; Izawa, T.; Ebana, K.; Ebitani, T.; Kanegae, H.; Konishi, S.; Yano, M. Deletion in a gene associated with grain size increased yields during rice domestication. Nat. Genet. 2008, 40, 1023–1028. [Google Scholar] [CrossRef] [PubMed]
- Weng, J.; Gu, S.; Wan, X.; Gao, H.; Guo, T.; Su, N.; Lei, C.; Zhang, X.; Cheng, Z.; Guo, X.; et al. Isolation and initial characterization of GW5, a major QTL associated with rice grain width and weight. Cell Res. 2008, 18, 1199–1209. [Google Scholar] [CrossRef]
- Li, Y.; Fan, C.; Xing, Y.; Jiang, Y.; Luo, L.; Sun, L.; Shao, D.; Xu, C.; Li, X.; Xiao, J.; et al. Natural variation in GS5 plays an important role in regulating grain size and yield in rice. Nat. Genet. 2011, 43, 1266–1269. [Google Scholar] [CrossRef]
- Hu, J.; Wang, Y.; Fang, Y.; Zeng, L.; Xu, J.; Yu, H.; Shi, Z.; Pan, J.; Zhang, D.; Kang, S.; et al. A Rare Allele of GS2 Enhances Grain Size and Grain Yield in Rice. Mol. Plant 2015, 8, 1455–1465. [Google Scholar] [CrossRef] [PubMed] [Green Version]
- Qi, P.; Lin, Y.-S.; Song, X.-J.; Shen, J.-B.; Huang, W.; Shan, J.-X.; Zhu, M.-Z.; Jiang, L.; Gao, J.-P.; Lin, H.-X. The novel quantitative trait locus GL3.1 controls rice grain size and yield by regulating Cyclin-T1;3. Cell Res. 2012, 22, 1666–1680. [Google Scholar] [CrossRef] [Green Version]
- Zhang, X.; Wang, J.; Huang, J.; Lan, H.; Wang, C.; Yin, C.; Wu, Y.; Tang, H.; Qian, Q.; Li, J.; et al. Rare allele of OsPPKL1 associated with grain length causes extra-large grain and a significant yield increase in rice. Proc. Natl. Acad. Sci. USA 2012, 109, 21534–21539. [Google Scholar] [CrossRef] [PubMed] [Green Version]
- Wang, Y.; Xiong, G.; Hu, J.; Jiang, L.; Yu, H.; Xu, J.; Fang, Y.; Zeng, L.; Xu, E.; Xu, J.; et al. Copy number variation at the GL7 locus contributes to grain size diversity in rice. Nat. Genet. 2015, 47, 944–948. [Google Scholar] [CrossRef] [PubMed]
- Wang, S.; Wu, K.; Yuan, Q.; Liu, X.; Liu, Z.; Lin, X.; Zeng, R.; Zhu, H.; Dong, G.; Qian, Q.; et al. Control of grain size, shape and quality by OsSPL16 in rice. Nat. Genet. 2012, 44, 950–954. [Google Scholar] [CrossRef]
- Ishimaru, K.; Hirotsu, N.; Madoka, Y.; Murakami, N.; Hara, N.; Onodera, H.; Kashiwagi, T.; Ujiie, K.; Shimizu, B.I.; Onishi, A.; et al. Loss of function of the IAA-glucose hydrolase gene TGW6 enhances rice grain weight and increases yield. Nat. Genet. 2013, 45, 707–711. [Google Scholar] [CrossRef]
- Ruan, B.; Shang, L.; Zhang, B.; Hu, J.; Wang, Y.; Lin, H.; Zhang, A.; Liu, C.; Peng, Y.; Zhu, L.; et al. Natural variation in the promoter of TGW2 determines grain width and weight in rice. New Phytol. 2020. [Google Scholar] [CrossRef]
- Seo, J.; Lee, G.; Jin, Z.; Kim, B.; Chin, J.H.; Koh, H.-J. Development and application of indica-japonica SNP assays using the Fluidigm platform for rice genetic analysis and molecular breeding. Mol. Breed. 2020, 40, 39. [Google Scholar] [CrossRef] [Green Version]
- Lee, G.; Lee, K.-I.; Lee, Y.; Kim, B.; Lee, D.; Seo, J.; Jang, S.; Chin, J.H.; Koh, H.-J. Identification of a novel SPLIT-HULL (SPH) gene associated with hull splitting in rice (Oryza sativa L.). Theor. Appl. Genet. 2018, 131, 1469–1480. [Google Scholar] [CrossRef]
- Megersa, A.; Seo, J.; Chin, J.H.; Kim, B.; Koh, H.-J. Characterization of Selected Rice Varieties Adapted in Africa. Plant Breed. Biotechnol. 2016, 4, 297–305. [Google Scholar] [CrossRef] [Green Version]
- Kishor, D.S.; Seo, J.; Chin, J.H.; Koh, H.-J. Evaluation of Whole-Genome Sequence, Genetic Diversity, and Agronomic Traits of Basmati Rice (Oryza sativa L.). Front. Genet. 2020, 11. [Google Scholar] [CrossRef] [PubMed] [Green Version]
- Seo, J.; Lee, S.-M.; Han, J.-H.; Shin, N.-H.; Koh, H.-J.; Chin, J.H. Identification of Yield and Yield-Related Quantitative Trait Loci for the Field High Temperature Condition in Backcross Populations of Rice (Oryza sativa L.). Plant Breed. Biotechnol. 2019, 7, 415–426. [Google Scholar] [CrossRef]
- Lee, S.-M.; Kang, J.-W.; Lee, J.-Y.; Seo, J.; Shin, D.; Cho, J.-H.; Jo, S.; Song, Y.-C.; Park, D.-S.; Ko, J.-M.; et al. QTL Analysis for Fe and Zn Concentrations in Rice Grains Using a Doubled Haploid Population Derived from a Cross Between Rice (Oryza sativa) Cultivar 93-11 and Milyang 352. Plant Breed. Biotechnol. 2020, 8, 69–76. [Google Scholar] [CrossRef]
- Kwon, Y.; Kabange, N.R.; Lee, J.-Y.; Lee, S.-M.; Cha, J.-K.; Shin, D.; Cho, J.-H.; Kang, J.-W.; Ko, J.-M.; Lee, J.-H. Novel QTL Associated with Shoot Branching Identified in Doubled Haploid Rice (Oryza sativa L.) under Low Nitrogen Cultivation. Genes 2021, 12, 745. [Google Scholar] [CrossRef]
- Kang, J.-W.; Kabange, N.R.; Phyo, Z.; Park, S.-Y.; Lee, S.-M.; Lee, J.-Y.; Shin, D.; Cho, J.H.; Park, D.-S.; Ko, J.-M.; et al. Combined Linkage Mapping and Genome-Wide Association Study Identified QTLs Associated with Grain Shape and Weight in Rice (Oryza sativa L.). Agronomy 2020, 10, 1532. [Google Scholar] [CrossRef]
- Jang, S.; Shim, S.; Lee, Y.K.; Lee, D.; Koh, H.-J. Major QTLs, qARO1 and qARO9, Additively Regulate Adaxial Leaf Rolling in Rice. Front. Plant Sci. 2021, 12. [Google Scholar] [CrossRef]
- Jang, S.; Han, J.-H.; Lee, Y.K.; Shin, N.-H.; Kang, Y.J.; Kim, C.-K.; Chin, J.H. Mapping and Validation of QTLs for the Amino Acid and Total Protein Content in Brown Rice. Front. Genet. 2020, 11. [Google Scholar] [CrossRef]
- Han, J.-H.; Shin, N.-H.; Moon, J.-H.; Yi, C.; Yoo, S.-C.; Chin, J.H. Genetic and Phenotypic Characterization of Rice Backcrossed Inbred Sister Lines of Saltol in Temperate Saline Reclaimed Area. Plant Breed. Biotechnol. 2020, 8, 58–68. [Google Scholar] [CrossRef]
- Im, D.-E.; San, M.L.; Jang, S.-G.; Park, S.-Y.; Jin, S.-H.; Kim, Y.C.; Ham, T.-H.; Kwon, S.-W. ‘Hyowon6’, a Mid-Late Maturing Rice Variety with High Quality. Korean J. Breed. Sci. 2018, 50, 529–533. [Google Scholar] [CrossRef]
- Seo, J.; Lee, S.-M.; Han, J.-H.; Shin, N.-H.; Lee, Y.K.; Kim, B.; Chin, J.H.; Koh, H.-J. Characterization of the Common Japonica-Originated Genomic Regions in the High-Yielding Varieties Developed from Inter-Subspecific Crosses in Temperate Rice (Oryza sativa L.). Genes 2020, 11, 562. [Google Scholar] [CrossRef]
- Murray, M.G.; Thompson, W.F. Rapid isolation of high molecular weight plant DNA. Nucleic Acids Res. 1980, 8, 4321–4326. [Google Scholar] [CrossRef] [Green Version]
- Liu, K.; Muse, S.V. PowerMarker: An integrated analysis environment for genetic marker analysis. Bioinformatics 2005, 21, 2128–2129. [Google Scholar] [CrossRef] [PubMed] [Green Version]
- Cavalli-Sforza, L.L.; Edwards, A.W.F. Phylogenetic analysis. Models and estimation procedures. Am. J. Hum. Genet. 1967, 19, 233–257. [Google Scholar] [PubMed]
- Kumar, S.; Stecher, G.; Tamura, K. MEGA7: Molecular Evolutionary Genetics Analysis Version 7.0 for Bigger Datasets. Mol. Biol. Evol. 2016, 33, 1870–1874. [Google Scholar] [CrossRef] [PubMed] [Green Version]
- Meng, L.; Li, H.; Zhang, L.; Wang, J. QTL IciMapping: Integrated software for genetic linkage map construction and quantitative trait locus mapping in biparental populations. Crop J. 2015, 3, 269–283. [Google Scholar] [CrossRef] [Green Version]
- Kosambi, D.D. The estimate of map distances from recombination values. Ann. Eugen. 1944, 12, 172–175. [Google Scholar] [CrossRef]
- Heang, D.; Sassa, H. An atypical bHLH protein encoded by POSITIVE REGULATOR OF GRAIN LENGTH 2 is involved in controlling grain length and weight of rice through interaction with a typical bHLH protein APG. Breed Sci. 2012, 62, 133–141. [Google Scholar] [CrossRef] [Green Version]
- Lu, C.; Shen, L.; Tan, Z.; Xu, Y.; He, P.; Chen, Y.; Zhu, L. Comparative mapping of QTLs for agronomic traits of rice across environments using a doubled haploid population. Theor. Appl. Genet. 1996, 93, 1211–1217. [Google Scholar] [CrossRef]
- Thomson, M.; Tai, T.; McClung, A.; Lai, X.; Hinga, M.; Lobos, K.; Xu, Y.; Martinez, C.; McCouch, S. Mapping quantitative trait loci for yield, yield components and morphological traits in an advanced backcross population between Oryza rufipogon and the Oryza sativa cultivar Jefferson. Theor. Appl. Genet. 2003, 107, 479–493. [Google Scholar] [CrossRef] [PubMed]
- Yoshida, S.; Ikegami, M.; Kuze, J.; Sawada, K.; Hashimoto, Z.; Ishii, T.; Nakamura, C.; Kamijima, O. QTL Analysis for Plant and Grain Characters of Sake-brewing Rice Using a Doubled Haploid Population. Breed. Sci. 2002, 52, 309–317. [Google Scholar] [CrossRef] [Green Version]
- Abe, Y.; Mieda, K.; Ando, T.; Kono, I.; Yano, M.; Kitano, H.; Iwasaki, Y. The SMALL AND ROUND SEED1 (SRS1/DEP2) gene is involved in the regulation of seed size in rice. Genes Genet. Syst. 2010, 85, 327–339. [Google Scholar] [CrossRef] [Green Version]
- Seo, J.; Bordiya, Y.; Lee, C.; Koh, H.-J. Fine Mapping and Candidate Gene Analysis of Small Round Grain Mutant in Rice. Plant Breed. Biotech. 2017, 5, 354–362. [Google Scholar] [CrossRef] [Green Version]
- Okada, S.; Iijima, K.; Hori, K.; Yamasaki, M. Genetic and epistatic effects for grain quality and yield of three grain-size QTLs identified in brewing rice (Oryza sativa L.). Mol. Breed. 2020, 40. [Google Scholar] [CrossRef]
- Navea, I.P.; Dwiyanti, M.S.; Park, J.; Kim, B.; Lee, S.; Huang, X.; Koh, H.-J.; Chin, J.H. Identification of quantitative trait loci for panicle length and yield related traits under different water and P application conditions in tropical region in rice (Oryza sativa L.). Euphytica 2017, 213, 37. [Google Scholar] [CrossRef]


| Trait | LGL | Hanareum | F2 Population | |||||||
|---|---|---|---|---|---|---|---|---|---|---|
| Average | SD | Average | SD | Average | SD | CV (%) | Range | Skewness | Kurtosis | |
| GL (mm) | 8.15 | 0.14 | 8.02 | 0.12 | 8.04 | 0.34 | 4.26 | 6.89–8.92 | −0.25 | 1.01 |
| GW (mm) | 3.78 | 0.08 | 2.95 | 0.07 | 3.21 | 0.18 | 5.46 | 2.79–3.62 | −0.04 | −0.44 |
| GT (ww) | 2.23 | 0.05 | 2.00 | 0.04 | 2.11 | 0.1 | 4.75 | 1.85–2.37 | 0.1 | 0.24 |
| GL | GW | |
|---|---|---|
| GW | 0.208 * | |
| GT | 0.162 | 0.586 ** |
| Trait | QTL | Chr. | Position (cM) | Left Marker | Right Marker | LOD | PVE (%) | Add | Reported Gene/QTL | Reference |
|---|---|---|---|---|---|---|---|---|---|---|
| GL | qGL2 | 2 | 130 | id2012773 | id2014575 | 4.5 | 17.26 | 0.2 | PGL2 | [35] |
| qGL6 | 6 | 66 | cmb0610.0 | id6008118 | 4.2 | 16.15 | 0.28 | gw-6 | [36] | |
| GW | qGW2 | 2 | 111 | ad02011845 | id2012773 | 6.22 | 24.27 | 0.12 | GS2 | [9] |
| qGW3 | 3 | 94 | id3010700 | ad03013905 | 5.97 | 23.53 | 0.11 | gw3.1 | [37] | |
| GT | qGT2 | 2 | 102 | ah02001499 | id2009889 | 5.88 | 13.24 | 0.05 | - | This study |
| qGT3 | 3 | 98 | ad03013905 | ae03006317 | 5.89 | 14.5 | 0.05 | GL3.1/qGL3 | [10,11] | |
| qGT5 | 5 | 79 | id5008218 | ad05008445 | 7.4 | 16.63 | −0.06 | N/A | [38] | |
| qGT6 | 6 | 60 | cmb0610.0 | id6008118 | 5.01 | 10.86 | 0.07 | gw-6 | [36] | |
| qGT7 | 7 | 108 | id7004645 | cmb0727.0 | 4.73 | 10.21 | 0.04 | SRS1/DEP2 | [39,40] |
Publisher’s Note: MDPI stays neutral with regard to jurisdictional claims in published maps and institutional affiliations. |
© 2021 by the authors. Licensee MDPI, Basel, Switzerland. This article is an open access article distributed under the terms and conditions of the Creative Commons Attribution (CC BY) license (https://creativecommons.org/licenses/by/4.0/).
Share and Cite
Lee, J.-H.; Seo, J.; Lar, S.M.; Jang, S.-G.; Zhang, H.; Lee, A.-R.; Cao, F.-Y.; Kim, N.-E.; Lee, J.; Kwon, S.-W. QTL Analysis of Rice Grain Size Using Segregating Populations Derived from the Large Grain Line. Agriculture 2021, 11, 565. https://doi.org/10.3390/agriculture11060565
Lee J-H, Seo J, Lar SM, Jang S-G, Zhang H, Lee A-R, Cao F-Y, Kim N-E, Lee J, Kwon S-W. QTL Analysis of Rice Grain Size Using Segregating Populations Derived from the Large Grain Line. Agriculture. 2021; 11(6):565. https://doi.org/10.3390/agriculture11060565
Chicago/Turabian StyleLee, Ja-Hong, Jeonghwan Seo, San Mar Lar, Seong-Gyu Jang, Hongjia Zhang, Ah-Rim Lee, Fang-Yuan Cao, Na-Eun Kim, Joohyun Lee, and Soon-Wook Kwon. 2021. "QTL Analysis of Rice Grain Size Using Segregating Populations Derived from the Large Grain Line" Agriculture 11, no. 6: 565. https://doi.org/10.3390/agriculture11060565
APA StyleLee, J.-H., Seo, J., Lar, S. M., Jang, S.-G., Zhang, H., Lee, A.-R., Cao, F.-Y., Kim, N.-E., Lee, J., & Kwon, S.-W. (2021). QTL Analysis of Rice Grain Size Using Segregating Populations Derived from the Large Grain Line. Agriculture, 11(6), 565. https://doi.org/10.3390/agriculture11060565