Abstract
Salinity is one of the major constraints causing soil problems and is considered a limitation to increased rice production in rice-growing countries. This genome-wide association study (GWAS) experiment was conducted to understand the genetic basis of salt tolerance at the seedling stage in Korean rice. After 10 days of salt stress treatment, salt tolerance was evaluated with a standard evaluation system using a visual salt injury score. With 191 Korean landrace accessions and their genotypes, including 266,040 single-nucleotide polymorphisms (SNPs), using a KNU Axiom Oryza 580K Genotyping Array, GWAS was conducted to detect three QTLs with significant SNPs with a −log10(P) threshold of ≥3.66. The QTL of qSIS2, showed −log10(P) = 3.80 and the lead SNP explained 7.87% of total phenotypic variation. The QTL of qSIS4, showed −log10(P) = 4.05 and the lead SNP explained 10.53% of total phenotypic variation. The QTL of qSIS8 showed −log10(P) = 3.78 and the lead SNP explained 7.83% of total phenotypic variation. Among the annotated genes located in these three QTL regions, five genes were selected as candidates (Os04g0481600, Os04g0485300, Os04g0493000, Os04g0493300, and Os08g0390200) for salt tolerance in rice seedlings based on the gene expression database and their previously known functions.
1. Introduction
Rice is grown in more than 100 countries over approximately 158 million hectares, with production of more than 700 million tons annually. Yields range from less than 1 t/ha under very poor rainfed conditions to more than 10 t/ha in intensively irrigated systems in temperate conditions (http://ricepedia.org/rice-as-a-crop/rice-productivity, accessed on 11 September 2021). Salinity is one of the major constraints causing soil problems and is considered as a limitation to increased rice production in rice-growing countries.
Salinity includes all soil problems due to excessive salt; these soils are categorized as sodic (or alkaline) and saline soils. Sodic soils can occur widely in arid and semi-arid regions, and excessive Na+ occurs at the exchangeable sites of clay particles. These soils have higher than pH 8.5 and a high exchangeable sodium percentage (ESP > 15). Saline soils are generally distributed in arid regions, estuaries, and coastal fringes and are dominated by Na+ cations with electrical conductivity (EC) > 4 dSm−1. In saline soils, ESP values are <15 and pH values are much lower than those of sodic soils (http://www.knowledgebank.irri.org/ricebreedingcourse/Breeding_for_salt_tolerance.htm, accessed on 11 September 2021). Generally, rice is relatively tolerant to stress during germination, active tillering, and maturity, but is particularly sensitive at the both the seedling and reproductive stages [1]. Rice is included among the most sensitive cereal crops, with a threshold level of 3 dSm−1. Moderate salinity can be defined as electrical conductivity of the soil or solution culture of 4 dSm−1, and high salinity as 4–8 and 8–12 dSm−1 [2].
Symptoms of salinity stress at the seedling stage include whitened tops of affected leaves, chlorotic patches on some leaves, plant stunting, reduced tillering, and patch field growth, which can lead to death [3]. Major symptoms of salinity at the reproductive stages are white leaf tip followed by tip burning, stunted plant growth, low tillering, spikelet sterility, low harvest index, fewer florets per panicle, less 1000 grain weight, low grain yield, change in flowering duration, leaf rolling, white leaf blotches, poor root growth, and patchy growth in the field [4]. A 12% reduction in yield will occur with every unit (dSm−1) increase in electrical conductivity above the threshold level [5,6,7,8]. Salt concentrations of 4, 8, and 12 dSm−1 were reported to lead to significant grain yield reduction of 31, 56, and 71%, respectively [9]. Hasamuzzaman et al. [10] reported 36.17–50% grain loss due 150 mM salinity. Another study showed that when rice seedlings were inhibited by salt, the shoot length and dry root weight were significantly decreased, but chlorophyll content, fresh shoot weight, and dry shoot weight were increased [11].
Identifying QTLs related to salt-tolerance traits has become a major effort for breeding programs. By using targeted marker-assisted backcrossing and selection, several salt-tolerant rice lines have been developed by introgression of Saltol QTL (major QTL of seedling stage tolerance) in salt-sensitive, high-yielding varieties [12,13]. Many scientists have carried out experiments and detected QTLs related to salt tolerance. In BC3F4 introgression lines of Pokkali developed in IR29, 6 QTLs for salt injury score (SIS) were associated with chromosomes 1, 3, 4, 10, and 11 [14]. Seven QTLs were identified for SIS on chromosomes 2, 5, 6, 7, 8, 9, and 11 in a Bengal/Pokkali RIL population [15], and one major QTL on chromosome 5 in Nona Bokra IL lines [16]. Two major QTLs for shoot Na+ and K+ concentration were found on chromosomes 7 and 1 [17]. Rahman et al. [18] identified three QTLs related to salt tolerance at the seedling stage on chromosome 1 and four QTLs on chromosome 3 that were located at 162.9 cM and 111 cM, respectively.
Genome-wide association study (GWAS) has great potential for identifying valuable natural variations in trait-associated loci, as well as allelic variations in candidate genes underlying quantitative and complex traits, including those related to growth, development, stress tolerance, and nutritional quality [19]. Naveed et al. [20] identified 6 and 14 QTLs for salt-tolerance traits at the germination and seedling stages in 208 rice accessions. Another study demonstrated a significant association of 10 genes with salt tolerance related traits at seedling and yield stages and related traits in rice plants grown under saline conditions [21]. A total of 11 QTLs were identified at the germination and early seeding stages in japonica rice [22]. Yu et al. [23] obtained 93 candidate genes significantly associated with salt tolerance in rice at the seedling stage.
Hoang et al. [24] generated transgenic rice expressing the anti-apoptotic genes AtBAG4, Hsp70, and p35 for enhanced salinity tolerance with many characteristics (maintenance of shoot growth, dry weight, number of panicles, number of spikelets; suppression of programmed cell death (PCD) pathway; detoxification of reactive oxygen species (ROS); minimization of cellular membrane electrolyte leakage; high photosynthetic efficiency; low Na+ accumulation). Transgenic rice harboring HsCBL8 gene was isolated from XZ166, a wild-type barley line. HsCBL8 gene encodes a calcium-sensor calcineurine B-like (CBL) protein in rice, and its overexpression leads to significant improvement in water protection and plasma membrane in vivo, more proline accumulation, and reduced overall Na+ uptake, but little change in K+ concentration in the plant tissues [25]. Tang et al. [26] studied the overexpression of OsMYB6 gene in transgenic rice lines at the seedling stage for salinity stress. After 6 days in salt solution, OsMYB6 transgenic rice plants resulted in more green leaves and less leaf wilting and rolling than the wild-type plant. When the seedlings were moved to Yoshida solution, all wild-type seedlings were dead and 43.9% transgenic seedlings survived.
Sensing and signaling (stress and ROS scavenging and signaling) and functional adaptation, including stomatal regulation, osmotic adjustment, and ion homeostasis, are the main factors of salt-tolerant molecular mechanisms [27]. Overexpression of OsMYB91 gene enhanced salt tolerance, increased ROS scavenging ability, and increased proline levels [28]. The salt- and drought-inducible ring-finger 1 (OsSDIR1) gene was upregulated under drought and high salinity, and its overexpression resulted in enhanced tolerance to water deficit in plants by decreasing water loss, mediated by stomatal closure [29]. Functional analysis of SKC1 gene shows that it encodes an HKT-type transporter (OsHKTS1;5), which is preferentially expressed in parenchyma cells surrounding the xylem vessels in rice and regulates K+/Na+ homeostasis under salt stress [30].
2. Materials and Methods
2.1. Plant Materials
In this study, 191 Korean landrace accessions were used to evaluate salt tolerance at the seedling stage (Table S1). Seeds of all accessions were acquired from the Rural Development Administration (RDA) Genebank, Jeonju, Republic of Korea (http://genebank.rda.go.kr, accessed on 5 July 2020).
2.2. Evaluation of Salt Tolerance
The seeds were heat treated at 50 °C for 3 days to break dormancy. To control microbial contamination and promote germination, the seeds were surface sterilized by soaking in sodium hypochlorite (NaClO) for 20 min and then washed with distilled water 3 times. Sterilized seeds were placed in Petri dishes lined with moistened filter paper and incubated at 30 °C for 3 days to germinate. The germinated seeds were sown in 96-well PCR plates, the bottoms of which had been cut. The PCR plates were suspended on distilled water, and after 2 days were transferred to nutrient solution (Yoshida solution) [31]. The salt screening was done in a controlled growth chamber (Hanbaek Sci. Bucheon, South Korea) at 29 °C/ 21 °C day/night temperature and 70% relative humidity. After 2 weeks in nutrient solution, the seedlings for salt treatment were introduced to salt stress by adding sodium chloride (NaCl) to the nutrient solution up to 150 mM. Before adding NaCl, 5 uniform plants per line were selected for salt screening and the others were removed. The pH of the nutrient solution was adjusted to 5.0–5.5 with hydrochloric acid (HCL) or sodium hydroxide (NaOH), and the solution was renewed every week. After 10 days in salt stress, the seedlings were evaluated for salt injury score by phenotype according to the standard evaluation system (Figure 1, Table 1) [32].
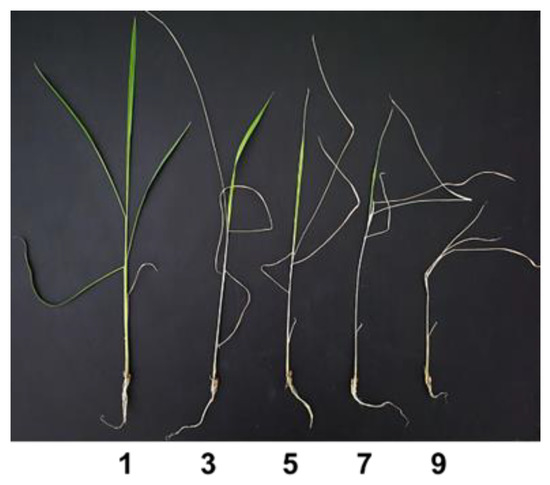
Figure 1.
Salt injury score at seedling stage.

Table 1.
Standard evaluation system of visual salt injury at seedling stage [32].
2.3. DNA Extraction and High-Throughput SNP Genotyping
The genomic DNA of 191 landraces was extracted from fresh leaves of 14-day-old seedlings using the CTAB method [33]. The quality of DNA was checked by agarose gel electrophoresis and quantified using a Nanodrop ND-1000 spectrophotometer (Thermo Fisher Scientific, Wilmington, DE, USA). High-throughput SNP genotyping and genotype calling of 191 landraces were carried out using KNU Axiom Oryza 580K Genotyping Array and Affymetrix Power Tools according to the description in a previous study [34].
2.4. Population Structure Analysis
For population structure analysis in present populations, we first filtered the genotype data by PLINK software [35], then high-quality, low-LD SNP sets were collected and underwent subsequent analysis; PCA analysis and plot visualization were performed using R package (version 4.03, http://r-project.org, accessed on 7 June 2021) [36], and for structural analysis we used ADMIXTURE software with bed format file. Finally, the result was visualized by Pophelper web tools [37], and the delta k values were shown for identifying the population groupings.
2.5. Genome-Wide Association Study (GWAS) Analysis
The Trait Analysis by Association, Evolution, and Linkage (TASSEL) package [38] was used to conduct association analysis of the salt tolerance of 191 landrace accessions. The mixed linear model (MLM) was performed, in which a kinship (K) matrix as the variance–covariance matrix between individuals was combined with population structure from PCA. Due to the fact that many SNPs have strong LD in genotype data, the thresholds decided by the total number of SNPs were too rigorous for detecting association loci [39], thus the genotype was filtered by PLINK software [35]. Non-independent SNPs were removed, and a total of 4556 effective and independent SNPs remained, and the association threshold was calculated by the formula: −log10(1/number of independent SNPs) [40]. Finally, the threshold was set as −log10(P) = 3.66 for identification of association loci, and SNP markers located at locus peaks were designated as lead SNPs for the detected loci. The areas 300 kb upstream and downstream of the lead SNPs were considered as candidate genomic regions for gene identification.
2.6. Identifying Candidate Genes for Salt Tolerance
GWAS analysis was used to identify promising candidate genes for salt tolerance in rice. We identified candidate genes associated from 300 kb upstream and downstream of significant SNP regions. For the expression patterns of the genes located in QTL regions, the RNA-seq data of GSE119720 GEO accessions was obtained from the NCBI GEO database (https://www.ncbi.nlm.nih.gov/geo/, accessed on 11 September 2021) [41]. A heatmap was plotted by http://www.bioinformatics.com.cn, 13 September 2021, an online platform for data analysis and visualization.
2.7. Haplotype Analysis
The previously reported phenotype dataset for the salt stress study by Yu et al. [23] was used in the haplotype analysis. In the study of Yu et al., the phenotypes of the leaf width (LW) and the length of plant shoots (SL) and roots (RL) were measured immediately after salt treatment. The total dry weight (TDW) was measured after 80 °C for 24 h incubation. Relative TDW (R-TDW), relative shoot length (R-SL), and relative leaf width (R-LW) were measured as the ratio of TDW, SL, and LW under salt stress to those under control conditions. Haplotype variation analysis was performed using PopART software [42]. LD blocks within 300 kb upstream and downstream of significant SNP regions were constructed using HaploView 4.2 [43]. Visualization of gene structures and SNP positions of candidate genes was illustrated by the Gene Structure Display Server 2.0 online tool [44]. One-way analysis of variance followed by Duncan’s test was used to compare phenotypic differences among haplotypes by SPSS version 26.0 (IBM Corp., Armonk, NY, USA).
3. Results
3.1. Salt Stress Tolerance at Seedling Stage
After 10 days in salt stress, salt tolerance in the seedlings was evaluated by phenotype according to the standard evaluation system. The distribution of salt injury scores was normal, with a score of 7 showing the highest frequency among 45 accessions (Figure 2). The average salt injury score of 191 accessions was 5.7. Accession ja110-Jwiiparibyeo (japonica) was the most salt-susceptible, with a score of 9.0, and the most tolerant accession was ja046-Jangsamdo (japonica), with a score of 1.67, followed by ja036-Noinjo (japonica), ja338-Duchungjong (japonica), and ja 281-Gangreungdo (japonica), with a score of 2.0.
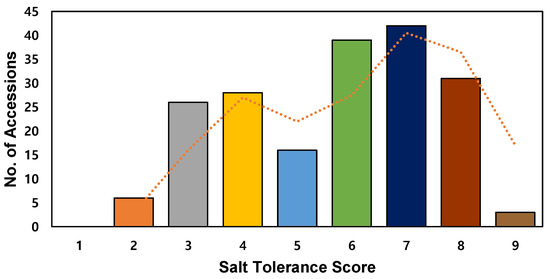
Figure 2.
Frequency distribution of salt tolerance in 191 rice accessions. Histogram of salt tolerance score. Dotted line shows moving average (2 intervals). Colors indicate average salt tolerance score: orange, 2; gray, 3; yellow, 4; light blue, 5; green, 6; dark blue, 7; brown, 8; gold, 9.
3.2. Genetic Structure of 191 Rice Accessions
According to the PCA results (Figure 3A), 191 accessions were clearly separated into three clusters following the X- and Y-axis. PC1 matrix explained about 57% and PC2 matrix explained about 25% of phenotype variation in this study, indicating that PCA = 3 is a suitable grouping to reduce the population error in the present population. In structural analysis, large error was observed in K = 1 and K = 2, but it rapidly decreased when K = 3 (Figure 3B), indicating that the 3 is the most suitable group for this population, and in the detailed grouping results shown in Figure 3C, clusters 1, 2, and 3 represent the different groupings.
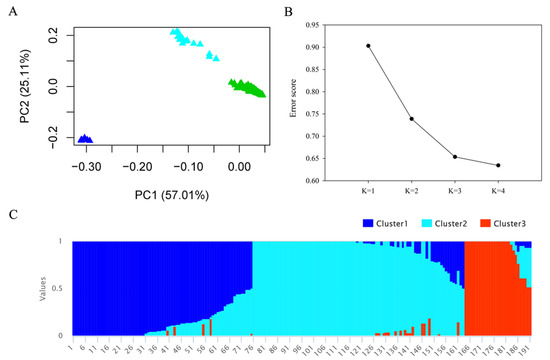
Figure 3.
Population structure analysis of 191 rice accessions: (A) principal component analysis (PCA) (PC1 and PC2); (B) cross-validation (CV) error of diverse groups (K); (C) structural analysis outcome (K = 3).
3.3. GWAS Analysis
Genotyping was done with 266,040 single-nucleotide polymorphisms (SNPs) using KNU Axiom Oryza 580K Genotyping Array. The SNP dataset was filtered by using TASSEL version 5.2.33 [38] and PLINK software [35]. Minor allele frequencies (<0.03) and missing values (0.01) were removed. After filtering the genotype with minor allele frequency 0.03, 124,347 SNPs were left to analyze. The Manhattan plot for the markers significantly associated with salt tolerance at seedling stage is represented in Figure 4. Associations higher than the threshold of −log10(P) ≥ 3.66 were detected as significant SNPs (refer to Materials and Method). Significant SNPs within the 600 kb surrounding the lead SNPs were considered as one association locus, and, in total, three QTLs were mapped (Table 2).
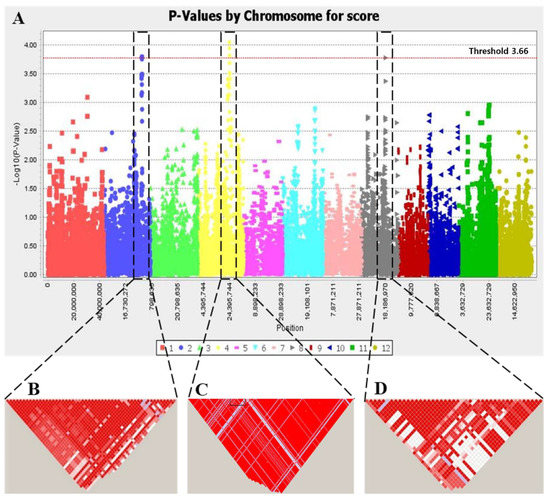
Figure 4.
Genome-wide association mapping and LD block of salt injury score (SIS) under salt stress (150 mM). (A) Manhattan plot of genome-wide association mapping using MLM. Colors indicate rice chromosome: red, chr1; blue, chr2; yellow green, chr3; yellow, chr4; pink, chr5; light blue, chr6; crimson, chr7; gray, chr8; dark brown, chr9; dark blue, chr10; green, chr11; gold, chr12. Red-dotted line indicate threshold 3.66 (B–D) LD blocks for region of qSIS2 on chromosome 2, region of qSIS4 on chromosome 4, and region of qSIS8 on chromosome 8, respectively.
Table 2.
Locations of QTLs detected in GWAS and previously reported QTLs.
One associated QTL was detected on chromosome 2, designated as qSIS2, showing −log10(P) = 3.80, and the lead SNP explained 7.87% of total phenotypic variation. One associated QTL was detected on chromosome 4, designated as qSIS4, showing −log10(P) = 4.05, and the lead SNP explained 10.53% of total phenotypic variation. The other associated QTL was detected on chromosome 8, designated as qSIS8, showing −log10(P) = 3.78, and the lead SNP explained 7.83% of total phenotypic variation. For the regions of the three QTLs, previously reported QTLs were used for comparison (Table 2). There were no salt-tolerance-associated QTLs reported based on Gramene (http://archive.gramene.org, accessed on 21 September 2021). We detected only two reported QTLs associated with root response to soil environment. For the region of qSIS4, phosphorus-sensitivity-associated QTL was reported, and for the region of qSIS8, iron-sensitivity-associated QTL was reported.
3.4. Identifying Candidate Genes
To identify candidate genes responsible for salt tolerance, all annotated genes located within 600 kb of the QTL regions were extracted based on the RAP-DB (IRGSP 1.0). A total of 212 genes were located in the three QTL regions (Table S2): 83 genes in chromosome 2, 93 genes in chromosome 4, and 36 genes in chromosome 8. The expression patterns of 212 genes were searched with previously reported RNA-seq in the database [41]. The results revealed that 44 genes were significantly differentially expressed under salt-stressed conditions (Figure 5, Table S3).
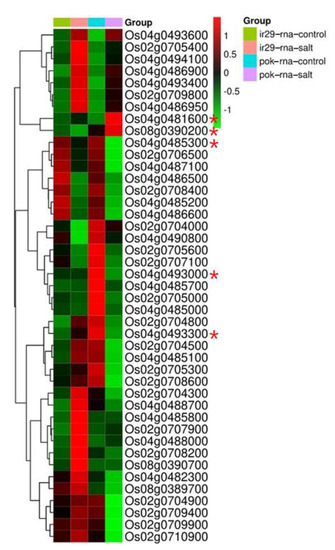
Figure 5.
Gene expression analysis of 44 candidate genes related to salt stress between IR 29 and Pokkali. Red and green represent high and low expression level, respectively. Red asterisk mark (*) represents the candidate genes used in the haplotype analysis.
Among the 44 differentially expressed genes, 19 genes were increased under salt stress conditions. In the susceptible IR29 variety under salt-treated conditions, 12 genes were increased; these genes were not increased in the tolerant Pokkali variety. Five genes were increased in both susceptible and tolerant varieties, and two genes were increased only in the tolerant variety. Based on the expression patterns in the database, we selected Os04g0481600 encoding WD domain, G-beta repeat domain containing protein, and Os08g0390200 encoding B-box zinc finger family protein as the candidate genes associated with salt tolerance, because they were significantly increased in the salt-tolerant Pokkali variety under salt-treated conditions, but were not increased in the susceptible IR29 variety. In addition, three candidate genes were selected based on their association with salt tolerance previously reported in other plants such as soybean and Arabidopsis. Os04g0485300 encodes glucose-6-phosphate 1-dehydrogenase, which was previously reported to have a possible role in salt tolerance in soybean [45] and reed [46]. Os04g0493000 encodes B-box zinc finger family protein and Os04g0493300 encodes glycine-rich protein. A possible role for these genes against salt tolerance in Arabidopsis was suggested [47,48].
3.5. Haplotype Analysis of Candidate Genes
For the five candidate genes selected based on the previously reported gene expression pattern and their reported function, we conducted haplotype analysis. Since our experiments were conducted with gene-chip based technology, we used a previously reported database constructed with a resequencing method to capture as many possible haplotypes as we could. For the phenotype and genotype data, the reported data by Yu et al. [23] for salt stress were used. In the previous study, 295 rice germplasms and genomic sequencing data were used for GWAS analysis for root and shoot growth traits under the 200 mM NaCl salt condition. Haplotype analysis of these five candidate genes is presented in Figure 6, Figure 7, Figure 8, Figure 9 and Figure 10. Heterozygous SNPs and missing data were excluded, and SNPs from exons were used for haplotype and haplotype variation analysis. We detected significant differences among haplotypes varying in the five candidate genes for at least three out of the seven phenotypic traits (root length, shoot length, leaf width, total dry weight, relative shoot length, relative leaf width, and relative total dry weight). Based on the evaluated traits by Yu et al., the traits of relative shoot length, relative leaf width, and relative total dry weight can explain the salt tolerance by eliminating the intrinsic differences among accessions. Except Os04g0493000, we detected significant differences among haplotypes varying in the other four candidate genes for the trait of relative leaf width. There were seven non-synonymous SNP regions in Os04g0481600 (WD domain, G-beta repeat domain containing protein) (Figure 6A). Among them, five SNPs showed amino acid substitution when alleles changed (C→T, Chr4_24087653, R→C substitution; T→C, Chr_24087785, C→R substitution; C→G, Chr4_2408783, H→D substitution; A→G, Chr4_24087804, H→R substitution; A→G, Chr4_24087809, T→A substitution). Os04g0481600 consists of four haplotype groups (Figure 6B). Significant differences among haplotypes varying in Os04g0481600 for root length, shoot length, leaf width, and relative leaf width were detected. For example, the relative leaf width of Hap1 and Hap2 of Os04g0481600 differed significantly from Hap3. Indica varieties were assigned into Hap1, Hap3, or Hap4, while japonica varieties were assigned into Hap2 (Figure 6C).
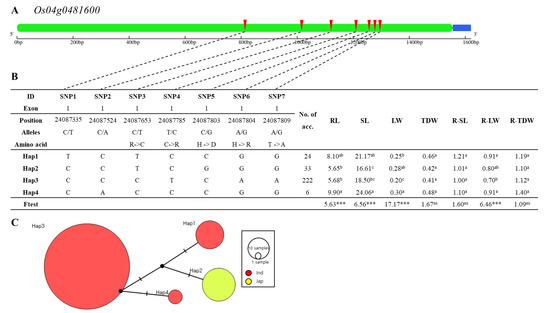
Figure 6.
Haplotype analysis of Os04g0481600. (A) Gene structure and SNP positions on Os04g0481600. Green, blue, and red represent exon, untranslated region (UTR), and SNPs, respectively. (B) Significant haplotypes by ANOVA at *** p < 0.001. a, b and c indicate different levels, and ab indicates same level of Duncan’s test. RL, SL, LW, TDW, R-SL, R-LW, and R-TDW refer to average value of root length, shoot length, leaf width, total dry weight, relative shoot length, relative leaf width, and relative total dry weight, respectively. (C) Haplotype variation analysis. Colors indicate rice subspecies, as indicated in legend. Circle size represents number of varieties in each Hap. Transverse lines show extent of variation between two Haps.
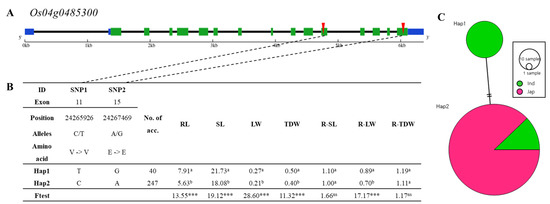
Figure 7.
Haplotype analysis of Os04g0485300. (A) Gene structure and SNP positions on Os04g0485300. Green, blue, black, and red indicate exon, untranslated region (UTR), intron, and SNPs, respectively. (B) Significant haplotypes by ANOVA at *** p < 0.001. a, and b indicate different levels of Duncan’s test. RL, SL, LW, TDW, R-SL, R-LW, and R-TDW refer to average value of root length, shoot length, leaf width, total dry weight, relative shoot length, relative leaf width, and relative total dry weight, respectively. (C) Haplotype variation analysis. Colors indicate rice subspecies, as indicated in legend. Circle size represents number of varieties in each Hap. Transverse lines show extent of variation between two Haps.
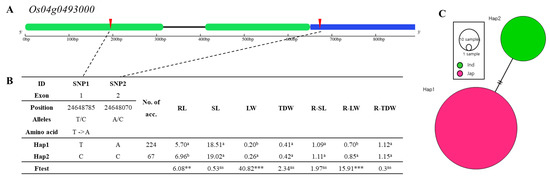
Figure 8.
Haplotype analysis of Os04g0493000. (A) Gene structure and SNP positions on Os04g0493000. Green, blue, black, and red represent exon, untranslated region (UTR), intron, and SNPs, respectively. (B) Significant haplotypes by ANOVA at *** p < 0.001 and ** p < 0.01. a and b indicate different levels of Duncan’s test. RL, SL, LW, TDW, R-SL, R-LW, and R-TDW refer to average value of root length, shoot length, leaf width, total dry weight, relative shoot length, relative leaf width, and relative total dry weight, respectively. (C) Haplotype variation analysis. Colors indicate rice subspecies, as indicated in legend. Circle size represents number of varieties in each Hap. Transverse lines show extent of variation between two Haps.
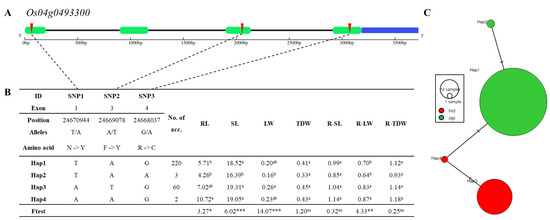
Figure 9.
Haplotype analysis of Os04g0493300. (A) Gene structure and SNP positions on Os04g0493300. Green, blue, black, and red represent exon, untranslated region (UTR), intron, and SNPs, respectively. (B) Significant haplotypes by ANOVA at *** p < 0.001, ** p < 0.01, and * p < 0.05. a and b indicate different levels, and ab means same level of Duncan’s test. RL, SL, LW, TDW, R-SL, R-LW, and R-TDW refer to average value of root length, shoot length, leaf width, total dry weight, relative shoot length, relative leaf width, and relative total dry weight, respectively. (C) Haplotype variation analysis. Colors indicate rice subspecies, as indicated in legend. Circle size represents number of varieties in each Hap. Transverse lines show extent of variation between two Haps.
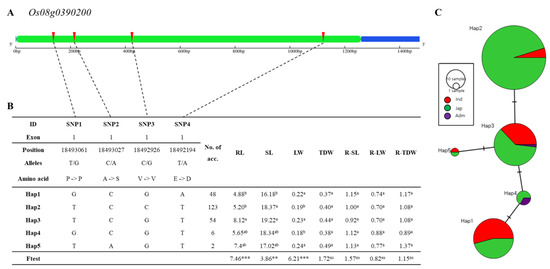
Figure 10.
Haplotype analysis of Os08g0390200. (A) Gene structure and SNP positions on Os08g0390200. Green, blue, black, and red represent exon, untranslated region (UTR), intron, and SNPs, respectively. (B) Significant haplotypes by ANOVA at *** p < 0.001 and ** p < 0.01. a and b indicate different levels, and ab means same level of Duncan’s test. RL, SL, LW, TDW, R-SL, R-LW, and R-TDW refer to average value of root length, shoot length, leaf width, total dry weight, relative shoot length, relative leaf width, and relative total dry weight respectively. (C) Haplotype variation analysis. Colors indicate rice subspecies, as indicated in legend. Circle size represents number of varieties in each Hap. Transverse lines show extent of variation between two Haps.
The gene structure of Os04g0485300 encoding glucose-6-phosphate 1-dehydrogenase is represented in Figure 7A. There are 15 exons and one SNP in exon 11 (C→T, Chr4_24265926, V→V), and one SNP in exon 15 (A→G, Chr4_24267469, E→E) showed changed allele without amino acid substitution. Os04g0485300 consists of two haplotype groups (Figure 7B). Significant differences among haplotypes varying in Os04g0481600 for root length, shoot length, leaf width, total dry weight and relative leaf width were detected. For example, the relative leaf width of Hap1 of Os04g0485300 differed significantly from Hap2. Hap 1 includes only indica varieties, and Hap 2 consists of indica and japonica varieties (Figure 7C).
Os04g0493000 encodes B-box zinc finger family protein. (Figure 8A). It has two exons, and one SNP in exon 1 (T→C, Chr4_24648785, T→A substitution), and allele A changed to C in exon 2 on position Chr4_24648070. Os04g0485300 consists of two haplotype groups, and Os04g0481600 consists of four haplotype groups (Figure 8B). Significant differences among haplotypes varying in Os04g0493000 for root length, leaf width and relative leaf width were detected. The relative leaf width of Hap2 of Os04g0493000 differed significantly from Hap1. The haplotype of Hap1 consists of japonica varieties, and the haplotype of Hap2 consists of indica (Figure 8C).
Os04g0493300 encodes glycine-rich protein and three SNPs in exon regions (Figure 9A). This gene contains three significant SNPs (T→A, Chr4_24670944, N→Y substitution; A→T, Chr4_24669078, F→Y substitution; G→A, Chr4_24668037, R→C substitution) that contain four haplotypes (Figure 9B). Significant differences among haplotypes varying in Os04g049330 for root length, shoot length, leaf width, and relative leaf width were detected. The relative leaf width of Hap1 of Os04g0493300 differed significantly from Hap2 and Hap4, and maximum root length variation was 6.46. The haplotype of Hap1 and Hap2 consist of japonica varieties, and the haplotype of Hap3 and Hap4 consist of indica varieties (Figure 9C).
The gene Os08g0390200 encodes 1-aminocyclopropane-1-carboxylate oxidase homolog 4 protein (Figure 10A). This gene includes only one exon, but four non-synonymous SNPs. Two of the four SNPs have changed alleles, with amino acid substitutions (C→A, Chr8_18493027, A→S substitution; T→A, Chr8_18492194, E→D substitution). The other two SNPs have changed alleles but not changed amino acids (T→G, Chr8_18493061, P→P; C→G, Chr8_18492926, V→V). Os08g0390200 is composed of five haplotype groups (Figure 10B). Significant differences among haplotypes varying in Os08g0390200 for root length, shoot length, and leaf width were detected. For example, the root length of Hap1 of Os08g0390200 differed significantly from Hap3 and Hap5, and maximum root length variation was 3.24. The haplotype of Hap1, Hap2 and Hap5 consist of japonica and indica varieties. The haplotype of Hap4 consist of japonica and admixture varieties and the haplotype of Hap3 consists of indica, japonica and admixture (Figure 9C). The number of individuals assigned to Hap 2 is the largest, with 123 accessions (6 indica, 117 japonica). The smallest number of individuals is Hap 5, which consists of one indica and one japonica accession (Figure 10C).
4. Discussion
The world’s population continues to increase, requiring more rice production. However, global salinization is also increasing and we face many limitations, including limited parental resources for conventional breeding and the complexity of salinity tolerance in rice [49]. To develop salt-tolerant varieties, molecular marker techniques and biotechnology are being used in combination with conventional breeding methods [50,51,52].
We compared the physical/genetic regions of the QTLs identified in this study with previously reported QTLs. The results revealed that the region of qSIS4 QTL was overlapped with that of AQCI0118 QTL which is associated with phosphorus sensitivity. The region of qSIS8 QTL was overlapped with that of AQDP005 QTL which is associated with iron sensitivity. Unexpectedly, there was no previously reported QTLs for salt tolerance in the regions of currently detected QTLs. The result of the overlapped regions among the two previously QTLs for performance of root and currently detected QTLs for salt tolerance suggests that there may be some overlapped pathway between salt tolerance and root performance. To further narrow down the candidate genes in the QTL regions, we utilized a database of gene expression studies [41] and GWAS for salt tolerance [23]. From the gene expression database, we detected two candidate genes (Os04g0481600 and Os08g0390200) which were specifically upregulated in salt tolerant varieties under the salt treatment. The haplotype analysis for these two genes, performed with the database of a previously reported GWAS for salt tolerance, showed significant differences for the phenotypic performance under salt conditions of rice cultivars carrying different haplotypes of Os04g0481600 and Os08g0390200, therefore providing additional indirect evidence for their possible role in salt tolerance. The candidate Os04g0481600 gene encodes WD domain, G-beta repeat domain containing protein. Five salt responsive WD40 proteins (SRWDs) were reported, which were specifically expressed in leaf or root under salt treatment. For example, expression of SRWD1 is regulated with different responsive patterns in leaves and roots of tolerant cultivar Jiucaiqing and sensitive cultivar IR26 under salt stress [53]. In wheat, a number of TaWD40 genes respond to abiotic stress such as cold, heat, or drought. In addition, specific expression of TaWD40 genes against abiotic stress such as powdery mildew or rust pathogen infection was reported [54]. O8g0390200 gene encodes ACO, which is involved in the final step of ethylene production in plant tissues [55]. Ethylene is a gaseous plant hormone that regulates all physiological processes during the plant’s life cycle. Many ACO genes have been isolated from different plant species, and the expression of those genes have been found to vary depending on the tissue, developmental stage, and environmental conditions [56]. A wheat TaACO1 negatively regulated salinity stress in Arabidopsis thaliana [57]. Additionally, we selected three more candidate genes (Os04g0485300, Os04g0493300, and Os04g0493000) among the 44 specifically expressed genes against the salt treatment, Os04g0485300 encodes a glucose-6-phosphate 1-dehydrogenase (G6PDH), Os04g0493300 encodes glycine-rich proteins (GRPs), and Os08g0390200 encodes 1-aminocyclopropane-1-carboxylate oxidase homolog 4 protein (ACO). Even though the expressions were downregulated in the tolerant variety under the salt treatment, we selected these three genes as candidate genes based on the relation between encoded proteins and salt tolerance previously reported in other plants. Interestingly, the haplotype analysis for these three genes with the database of previously reported GWAS for salt tolerance also showed significant difference among the phenotypic performance of haplotypes of Os04g0485300, Os04g0493300, and O8g0390200. Even though, no direct evidence that the down regulation of Os04g0485300, Os04g0493300, and Os08g0390200 is associated with salt tolerance has not been reported in rice, in other plant, the encoded protein from these genes were reported to be related in various stress including salt stress. Moreover, the negative effect of GRPs on salt stress conditions in Camelina sativa [58] and negative regulation of TaACO1 on salt stress in Arabidopsis thaliana were reported, suggesting the possible role of downregulation of Os04g0493300 and Os08g0390200 in salt tolerance in rice. Os04g0485300 encodes G6PDH, which was previously reported for its possible role in salt tolerance in soybean [45,46]. Zhao et al. [45] examined the physiological and transcriptional responses of GmG6PDH to different stresses in soybean, including salt, alkali, and osmotic stress. Significant induction was observed in all treatments, especially under salt stress. Transgenic soybean, including GmG6PDH2 overexpressing hairy roots (GmG6PDh2-OHR), showed significantly improved resistance to salinity stress at the seedling stage by increasing root fresh weight and root length. The roles of plant G6PDHs in the response to various abiotic stresses were reported, such as salinity tolerance in reed [46], cold tolerance in tobacco [59] and strawberry [60], drought tolerance in tomato [61], and heat tolerance in Przewalskia tangutica and tobacco [62]. Moreover, it was reported that G6PDH is involved as a regulator in maintaining cell redox balance in rice suspension cultures under salt stress [63]. Os04g0493300 encodes GRPs. The protein encoded by GRP-1 consists of 384 amino acids, of which 67% are glycine [64]. Based on the arrangement of glycine repeats and the presence of conserved motifs, GRPs are divided into five classes [65]. In Arabidopsis, GRP2, GRP4, and GRP7 genes are upregulated to enhance freezing tolerance compared with wild-type and grp-2 knockout mutants [66]. Kim et al. [67] reported that GRP2 enhanced seed germination under cold stress (11 °C) and influenced Arabidopsis growth in an ABA-dependent manner. Overexpression of AtGRP1 improved stress response under high salt conditions [68]. Overexpression of Medicago sativa GRPs in transgenic Arabidopsis showed retarded seed germination and seedling growth [69]. The candidate Os04g0493000 encodes B-box (BBX) zinc finger family protein. The specific responses of BBX under abiotic stress in various crops were reported [70,71,72,73,74]. Genome-wide identification analysis of BBX genes in maize, rice, sorghum, millet, and stiff brome was conducted, and expression under abiotic (cold, drought, salt), hormonal (GA, ABA, SA, MeJA), and metal (Cr, Cd, Ni, Fe) stress in rice was significantly affected. The transcript level of most rice BBX genes was high at the heading stage, followed by the booting and seedling stages [72]. Overexpression of MdBBX10 in Arabidopsis induced enhanced tolerance to salt and drought stress, with a high germination ratio and long root, and improved the plant’s ability to scavenge reactive oxygen species and conduct ABA signaling [48]. Moreover, the BBX family protein in chrysanthemum, CmBBX19, suppresses the expression of a set of stress and ABA responsive genes, such as CmRAB18 and CmRD29B, in normal conditions, but its expression is downregulated to release those genes to increase tolerance in drought stress conditions [74].
5. Conclusions
Through a genome-wide association study, we detected three QTLs for salt tolerance in rice seedlings. With the aid of bioinformatics analysis with a gene expression database and a previously reported salt stress experiment, we determined five candidate genes (Os04g0481600, Os04g0485300, Os04g0493000, Os04g0493300 and Os08g0390200). Further studies evaluating the molecular role of these candidate genes will be carried out in near the future.
Supplementary Materials
The following are available online at https://www.mdpi.com/article/10.3390/agriculture11111174/s1, Table S1: Korean landrace accessions used in this study. Table S2: Candidate genes within 600 kb of significant SNP regions. Table S3: RNA-seq data of genes in candidate region.
Author Contributions
Conceptualization, S.-W.K. and J.L.; methodology, Y.L. and J.L.; resources, Y.L., Y.-J.P. and J.L.; data collection, F.-Y.C., N.-E.K. and J.-H.L.; validation, S.M.L., S.-G.J. and A.-R.L.; data analysis, S.M.L., J.S. and H.Z.; writing—original draft preparation, S.M.L.; writing—reviewing and editing, S.-W.K. and J.L.; supervision, project administration, and funding acquisition, S.-W.K. and J.L. All authors have read and agreed to the published version of the manuscript.
Funding
This research was funded by Rural Development Administration, Republic of Korea (Grant number PJ01480501 & PJ01579403).
Institutional Review Board Statement
Not applicable.
Informed Consent Statement
Not applicable.
Data Availability Statement
Not applicable.
Conflicts of Interest
The authors declare no conflict of interest.
References
- Singh, R.K.; Gregorio, G.; Ismail, A.M. Breeding rice varieties with tolerance to salt stress. J. Indian Soc. Coast. Agric. Res. 2008, 26, 16–21. [Google Scholar]
- Singh, R.K.; Redoña, E.; Refuerzo, L. Varietal Improvement for Abiotic Stress Tolerance in Crop Plants: Special Reference to Salinity in Rice. In Abiotic Stress Adaptation in Plants: Physiological, Molecular and Genomic Foundation; Pareek, A., Sopory, S.K., Bohnert, H.J., Eds.; Springer: Dordrecht, The Netherlands, 2010; pp. 387–415. [Google Scholar]
- Mohammadi, R.; Mendioro, M.S.; Diaz, G.Q.; Gregorio, G.B.; Singh, R.K.; Saranga, Y. Genetic analysis of salt tolerance at seedling and reproductive stages in rice (Oryza sativa). Plant Breed 2014, 133, 548–559. [Google Scholar] [CrossRef]
- Reddy, M.; Francies, R.; Rasool, S.; Prakash Reddy, V. Breeding for tolerance to stress triggered by salinity in rice. Int. J. Appl. Biol. Pharm. Technol. 2014, 5, 167–176. [Google Scholar]
- Vinod, K.K.; Krishnan, S.G.; Babu, N.N.; Nagarajan, M.; Singh, A.K. Improving Salt Tolerance in Rice: Looking Beyond the Conventional. In Salt Stress in Plants: Signalling, Omics and Adaptations; Ahmad, P., Azooz, M.M., Prasad, M.N.V., Eds.; Springer: New York, NY, USA, 2013; pp. 219–260. [Google Scholar]
- Maas, E.V.; Grattan, S. Crop yields as affected by salinity. Agric. Drain. 1999, 38, 55–108. [Google Scholar]
- Grattan, S.; Hanson, B.R. Agricultural Salinity and Drainage; University of California, Division of Agriculture and Natural Resources: Davis, VA, USA, 2006. [Google Scholar]
- Wallender, W.W.; Tanji, K.K. Agricultural Salinity Assessment and Management, 2nd ed.; American society of Civil Engineers (ASCE): Reston, VA, USA, 2011; pp. 1–1094. [Google Scholar]
- Girma, B.; Mohammed Ali, H.; Gebeyaneh, A. Effect of Salinity on Final Growth Stage of Different Rice (Oryza sativa L.) Genotypes. Asian J. Agric. Res. 2016, 11, 1–9. [Google Scholar] [CrossRef] [Green Version]
- Hasanuzzaman, M.; Masayuki, F.; Islam, M.; Ahamed, K.; Nahar, K. Performance of four irrigated rice varieties under different levels of salinity stress. Int. J. Integr. Bio. 2009, 6, 85–90. [Google Scholar]
- Liu, Y.; Wang, B.; Li, J.; Song, Z.; Lu, B.; Chi, M.; Yang, B.; Qin, D.; Lam, Y.-W.; Li, J.; et al. Salt Response Analysis in Two Rice Cultivars at Seedling Stage. Acta Physiol. Plant. 2017, 39, 215. [Google Scholar] [CrossRef] [PubMed]
- Ali, S.; Gautam, R.K.; Mahajan, R.; Krishnamurthy, S.L.; Sharma, S.K.; Singh, R.K.; Ismail, A.M. Stress indices and selectable traits in SALTOL QTL introgressed rice genotypes for reproductive stage tolerance to sodicity and salinity stresses. Field Crops Res. 2013, 154, 65–73. [Google Scholar] [CrossRef]
- Thomson, M.J.; de Ocampo, M.; Egdane, J.; Rahman, M.A.; Sajise, A.G.; Adorada, D.L.; Tumimbang-Raiz, E.; Blumwald, E.; Seraj, Z.I.; Singh, R.K.; et al. Characterizing the Saltol Quantitative Trait Locus for Salinity Tolerance in Rice. Rice 2010, 3, 148–160. [Google Scholar] [CrossRef] [Green Version]
- Alam, R.; Rahman, M.; Seraj, Z.; Thomson, M.; Ismail, A.; Tumimbang, E.; Gregorio, G. Investigation of seedling-stage salinity tolerance QTLs using backcross lines derived from Oryza sativa L. Pokkali. Plant Breed. 2011, 130, 430–437. [Google Scholar] [CrossRef]
- De Leon, T.B.; Linscombe, S.; Subudhi, P.K. Molecular Dissection of Seedling Salinity Tolerance in Rice (Oryza sativa L.) Using a High-Density GBS-Based SNP Linkage Map. Rice 2016, 9, 52. [Google Scholar] [CrossRef] [Green Version]
- Puram, V.; Ontoy, J.; Linscombe, S.; Subudhi, P. Genetic Dissection of Seedling Stage Salinity Tolerance in Rice Using Introgression Lines of a Salt Tolerant Landrace Nona Bokra. J. Hered. 2017, 108, 658–670. [Google Scholar] [CrossRef]
- Lin, H.; Zhu, M.; Mj, Y.; Gao, J.-P.; Liang, Z.; Su, W.A.; Hu, X.; Ren, Z.; Chao, D.-Y. QTLs for Na+ and K+ uptake of the shoots and roots controlling rice salt tolerance. TAG Theor. Appl. Genet. Theor. Angew. Genet. 2004, 108, 253–260. [Google Scholar] [CrossRef]
- Rahman, M.A.; Thomson, M.J.; De Ocampo, M.; Egdane, J.A.; Salam, M.A.; Shah-E-Alam, M.; Ismail, A.M. Assessing trait contribution and mapping novel QTL for salinity tolerance using the Bangladeshi rice landrace Capsule. Rice 2019, 12, 63. [Google Scholar] [CrossRef] [PubMed] [Green Version]
- Kumar, V.; Singh, A.; Mithra, S.V.A.; Krishnamurthy, S.L.; Parida, S.K.; Jain, S.; Tiwari, K.K.; Kumar, P.; Rao, A.R.; Sharma, S.K.; et al. Genome-wide association mapping of salinity tolerance in rice (Oryza sativa). DNA Res. 2015, 22, 133–145. [Google Scholar] [CrossRef] [Green Version]
- Naveed, S.A.; Zhang, F.; Zhang, J.; Zheng, T.-Q.; Meng, L.-J.; Pang, Y.-L.; Xu, J.-L.; Li, Z.-K. Identification of QTN and candidate genes for Salinity Tolerance at the Germination and Seedling Stages in Rice by Genome-Wide Association Analyses. Sci. Rep. 2018, 8, 6505. [Google Scholar] [CrossRef] [Green Version]
- Liu, C.; Chen, K.; Zhao, X.; Wang, X.; Shen, C.; Zhu, Y.; Dai, M.; Qiu, X.; Yang, R.; Xing, D.; et al. Identification of genes for salt tolerance and yield-related traits in rice plants grown hydroponically and under saline field conditions by genome-wide association study. Rice 2019, 12, 88. [Google Scholar] [CrossRef]
- Zheng, H.; Liu, B.; Zhao, H.; Wang, J.; Liu, H.; Sun, J.; Xing, J.; Zou, D. Identification of QTLs for salt tolerance at the germination and early seedling stage using linkage and association analysis in japonica rice. Chin. J. Rice Sci. 2014, 28, 358–366. [Google Scholar]
- Yu, J.; Zao, W.; He, Q.; Kim, T.S.; Park, Y.J. Genome-wide association study and gene set analysis for understanding candidate genes involved in salt tolerance at the rice seedling stage. Mol. Genet. Genom. MGG 2017, 292, 1391–1403. [Google Scholar] [CrossRef]
- Hoang, T.M.L.; Moghaddam, L.; Williams, B.; Khanna, H.; Dale, J.; Mundree, S.G. Development of salinity tolerance in rice by constitutive-overexpression of genes involved in the regulation of programmed cell death. Front. Plant Sci. 2015, 6, 175. [Google Scholar] [CrossRef] [PubMed]
- Guo, W.; Chen, T.; Hussain, N.; Zhang, G.; Jiang, L. Characterization of Salinity Tolerance of Transgenic Rice Lines Harboring HsCBL8 of Wild Barley (Hordeum spontanum) Line from Qinghai-Tibet Plateau. Front. Plant Sci. 2016, 7, 1678. [Google Scholar] [CrossRef] [PubMed] [Green Version]
- Tang, Y.; Bao, X.; Zhi, Y.; Wu, Q.; Guo, Y.; Yin, X.; Zeng, L.; Li, J.; Zhang, J.; He, W.; et al. Overexpression of a MYB Family Gene, OsMYB6, Increases Drought and Salinity Stress Tolerance in Transgenic Rice. Front. Plant Sci. 2019, 10, 168. [Google Scholar] [CrossRef] [PubMed] [Green Version]
- Chen, T.; Shabala, S.; Niu, Y.; Chen, Z.-H.; Shabala, L.; Meinke, H.; Venkataraman, G.; Pareek, A.; Xu, J.; Zhou, M. Molecular mechanisms of salinity tolerance in rice. Crop J. 2021, 9, 506–520. [Google Scholar] [CrossRef]
- Zhu, N.; Cheng, S.; Liu, X.; Du, H.; Dai, M.; Zhou, D.X.; Yang, W.; Zhao, Y. The R2R3-type MYB gene OsMYB91 has a function in coordinating plant growth and salt stress tolerance in rice. Plant Sci. Int. J. Exp. Plant Biol. 2015, 236, 146–156. [Google Scholar] [CrossRef] [PubMed]
- Gao, T.; Wu, Y.; Zhang, Y.; Liu, L.; Ning, Y.; Wang, D.; Tong, H.; Chen, S.; Chu, C.; Xie, Q. OsSDIR1 overexpression greatly improves drought tolerance in transgenic rice. Plant Mol. Biol. 2011, 76, 145–156. [Google Scholar] [CrossRef]
- Ren, Z.-H.; Gao, J.-P.; Li, L.-G.; Cai, X.-L.; Huang, W.; Chao, D.-Y.; Zhu, M.-Z.; Wang, Z.-Y.; Luan, S.; Lin, H.-X. A rice quantitative trait locus for salt tolerance encodes a sodium transporter. Nat. Genet. 2005, 37, 1141–1146. Available online: http://www.nature.com/ng/journal/v37/n10/suppinfo/ng1643_S1.html (accessed on 11 September 2005). [CrossRef]
- Cock, J.; Yoshida, S.; Forno, D.A. Laboratory Manual for Physiological Studies of Rice, 3rd ed.; The International Rice Research Institute: Los Baños, Philippines, 1976. [Google Scholar]
- IRRI. Standard Evaluation System (SES) for Rice, 5th ed.; IRRI: Los Baños, Philippines, 2013. [Google Scholar]
- Murray, M.G.; Thompson, W.F. Rapid isolation of high molecular weight plant DNA. Nucleic Acids Res. 1980, 8, 4321–4326. [Google Scholar] [CrossRef] [Green Version]
- Chung, I.-M.; Ham, T.-H.; Cho, G.-W.; Kwon, S.-W.; Lee, Y.; Seo, J.; An, Y.-J.; Kim, S.-Y.; Kim, S.-H.; Lee, J. Study of Quantitative Trait Loci (QTLs) Associated with Allelopathic Trait in Rice. Genes 2020, 11, 470. [Google Scholar] [CrossRef]
- Purcell, S.; Neale, B.; Todd-Brown, K.; Thomas, L.; Ferreira, M.A.R.; Bender, D.; Maller, J.; Sklar, P.; de Bakker, P.I.W.; Daly, M.J.; et al. PLINK: A Tool Set for Whole-Genome Association and Population-Based Linkage Analyses. Am. J. Human Genet. 2007, 81, 559–575. [Google Scholar] [CrossRef] [Green Version]
- Francis, R.M. Pophelper: An R package and web app to analyse and visualize population structure. Mol. Ecol. Resour. 2017, 17, 27–32. [Google Scholar] [CrossRef] [Green Version]
- Kumar, S.; Stecher, G.; Li, M.; Knyaz, C.; Tamura, K. MEGA X: Molecular Evolutionary Genetics Analysis across Computing Platforms. Mol. Biol. Evol. 2018, 35, 1547–1549. [Google Scholar] [CrossRef]
- Bradbury, P.J.; Zhang, Z.; Kroon, D.E.; Casstevens, T.M.; Ramdoss, Y.; Buckler, E.S. TASSEL: Software for association mapping of complex traits in diverse samples. Bioinformatics 2007, 23, 2633–2635. [Google Scholar] [CrossRef] [PubMed]
- Zhao, Y.; Zhang, H.; Xu, J.; Jiang, C.; Yin, Z.; Xiong, H.; Xie, J.; Wang, X.; Zhu, X.; Li, Y.; et al. Loci and natural alleles underlying robust roots and adaptive domestication of upland ecotype rice in aerobic conditions. PLoS Genet. 2018, 14, e1007521. [Google Scholar] [CrossRef]
- Yang, W.; Guo, Z.; Huang, C.; Duan, L.; Chen, G.; Jiang, N.; Fang, W.; Feng, H.; Xie, W.; Lian, X.; et al. Combining high-throughput phenotyping and genome-wide association studies to reveal natural genetic variation in rice. Nat. Commun. 2014, 5, 5087. [Google Scholar] [CrossRef] [PubMed]
- Li, Y.-F.; Zheng, Y.; Vemireddy, L.R.; Panda, S.K.; Jose, S.; Ranjan, A.; Panda, P.; Govindan, G.; Cui, J.; Wei, K.; et al. Comparative transcriptome and translatome analysis in contrasting rice genotypes reveals differential mRNA translation in salt-tolerant Pokkali under salt stress. BMC Genom. 2018, 19, 935. [Google Scholar] [CrossRef] [PubMed] [Green Version]
- Clement, M.; Snell, Q.; Walker, P.; Posada, D.; Crandall, K. TCS: Estimating gene genealogies. In Proceedings of the 16th International Parallel and Distributed Processing Symposium (IPDPS 2002), Fort Lauderdale, FL, USA, 15–19 April 2002; p. 0184. [Google Scholar]
- Barrett, J.C.; Fry, B.; Maller, J.; Daly, M.J. Haploview: Analysis and visualization of LD and haplotype maps. Bioinformatics 2004, 21, 263–265. [Google Scholar] [CrossRef] [PubMed] [Green Version]
- Guo, A.Y.; Zhu, Q.H.; Chen, X.; Luo, J.C. GSDS: A gene structure display server. Yi Chuan Hered. 2007, 29, 1023–1026. [Google Scholar] [CrossRef]
- Zhao, Y.; Cui, Y.; Huang, S.; Yu, J.; Wang, X.; Xin, D.; Li, X.; Liu, Y.; Dai, Y.; Qi, Z.; et al. Genome-Wide Analysis of the Glucose-6-Phosphate Dehydrogenase Family in Soybean and Functional Identification of GmG6PDH2 Involvement in Salt Stress. Front. Plant Sci. 2020, 11, 214. [Google Scholar] [CrossRef] [Green Version]
- Wang, X.; Ma, Y.; Huang, C.; Li, J.; Wan, Q.; Bi, Y. Involvement of glucose-6-phosphate dehydrogenase in reduced glutathione maintenance and hydrogen peroxide signal under salt stress. Plant Signal. Behav. 2008, 3, 394–395. [Google Scholar] [CrossRef] [Green Version]
- Czolpinska, M.; Rurek, M. Plant Glycine-Rich Proteins in Stress Response: An Emerging, Still Prospective Story. Front. Plant Sci. 2018, 9, 302. [Google Scholar] [CrossRef]
- Liu, X.; Li, R.; Dai, Y.; Yuan, L.; Sun, Q.; Zhang, S.; Wang, X. A B-box zinc finger protein, MdBBX10, enhanced salt and drought stresses tolerance in Arabidopsis. Plant Mol. Biol. 2019, 99, 437–447. [Google Scholar] [CrossRef] [PubMed]
- Hoang, T.M.L.; Tran, T.N.; Nguyen, T.K.T.; Williams, B.; Wurm, P.; Bellairs, S.; Mundree, S. Improvement of Salinity Stress Tolerance in Rice: Challenges and Opportunities. Agronomy 2016, 6, 54. [Google Scholar] [CrossRef]
- Miller, G.; Suzuki, N.; Ciftci-Yilmaz, S.; Mittler, R. Reactive oxygen species homeostasis and signalling during drought and salinity stresses. Plant Cell Environ. 2010, 33, 453–467. [Google Scholar] [CrossRef]
- Greenberg, J.T. Programmed cell death: A way of life for plants. Proc. Natl. Acad. Sci. USA 1996, 93, 12094. [Google Scholar] [CrossRef] [PubMed] [Green Version]
- Williams, B.; Dickman, M. Plant programmed cell death: Can’t live with it; can’t live without it. Mol. Plant Pathol. 2008, 9, 531–544. [Google Scholar] [CrossRef]
- Huang, J.; Wang, M.M.; Bao, Y.M.; Sun, S.J.; Pan, L.J.; Zhang, H.S. SRWD: A novel WD40 protein subfamily regulated by salt stress in rice (Oryzasativa L.). Gene 2008, 424, 71–79. [Google Scholar] [CrossRef] [PubMed]
- Hu, R.; Xiao, J.; Gu, T.; Yu, X.; Zhang, Y.; Chang, J.; Yang, G.; He, G. Genome-wide identification and analysis of WD40 proteins in wheat (Triticum aestivum L.). BMC Genom. 2018, 19, 803. [Google Scholar] [CrossRef] [Green Version]
- Ruduś, I.; Sasiak, M.; Kępczyński, J. Regulation of ethylene biosynthesis at the level of 1-aminocyclopropane-1-carboxylate oxidase (ACO) gene. Acta Physiol. Plant 2013, 35, 295–307. [Google Scholar] [CrossRef] [Green Version]
- Barry, C.S.; Blume, B.; Bouzayen, M.; Cooper, W.; Hamilton, A.J.; Grierson, D. Differential expression of the 1-aminocyclopropane-1-carboxylate oxidase gene family of tomato. Plant J. Cell Mol. Biol. 1996, 9, 525–535. [Google Scholar] [CrossRef]
- Chen, D.; Ma, X.; Li, C.; Zhang, W.; Xia, G.; Wang, M. A wheat aminocyclopropane-1-carboxylate oxidase gene, TaACO1, negatively regulates salinity stress in Arabidopsis thaliana. Plant Cell Rep. 2014, 33, 1815–1827. [Google Scholar] [CrossRef]
- Kwak, K.J.; Kim, H.-S.; Jang, H.Y.; Kang, H.; Ahn, S.-J. Diverse roles of glycine-rich RNA-binding protein 7 in the response of camelina (Camelina sativa) to abiotic stress. Acta Physiol. Plant 2016, 38, 129. [Google Scholar] [CrossRef]
- Lin, Y.; Lin, S.; Guo, H.; Zhang, Z.; Chen, X. Functional analysis of PsG6PDH, a cytosolic glucose-6-phosphate dehydrogenase gene from Populus suaveolens, and its contribution to cold tolerance improvement in tobacco plants. Biotechnol. Lett. 2013, 35, 1509–1518. [Google Scholar] [CrossRef]
- Zhang, Y.; Luo, M.; Cheng, L.; Lin, Y.; Chen, Q.; Sun, B.; Gu, X.; Wang, Y.; Li, M.; Luo, Y.; et al. Identification of the Cytosolic Glucose-6-Phosphate Dehydrogenase Gene from Strawberry Involved in Cold Stress Response. Int. J. Mol. Sci. 2020, 21, 7322. [Google Scholar] [CrossRef]
- Landi, S.; Nurcato, R.; De Lillo, A.; Lentini, M.; Grillo, S.; Esposito, S. Glucose-6-phosphate dehydrogenase plays a central role in the response of tomato (Solanum lycopersicum) plants to short and long-term drought. Plant Physiol. Biochem. PPB 2016, 105, 79–89. [Google Scholar] [CrossRef] [PubMed] [Green Version]
- Gong, H.; Chen, G.; Li, F.; Wang, X.; Hu, Y.; Bi, Y. Involvement of G6PDH in heat stress tolerance in the calli from Przewalskia tangutica and Nicotiana tabacum. Biol. Plant. 2012, 56, 422–430. [Google Scholar] [CrossRef]
- Zhang, L.; Liu, J.; Wang, X.; Bi, Y. Glucose-6-phosphate dehydrogenase acts as a regulator of cell redox balance in rice suspension cells under salt stress. Plant Growth Regul. 2013, 69, 139–148. [Google Scholar] [CrossRef]
- Condit, C.M.; Meagher, R.B. A gene encoding a novel glycine-rich structural protein of petunia. Nature 1986, 323, 178. [Google Scholar] [CrossRef]
- Mangeon, A.; Junqueira, R.M.; Sachetto-Martins, G. Functional diversity of the plant glycine-rich proteins superfamily. Plant Signal. Behav. 2010, 5, 99–104. [Google Scholar] [CrossRef] [Green Version]
- Kim, J.S.; Park, S.J.; Kwak, K.J.; Kim, Y.O.; Kim, J.Y.; Song, J.; Jang, B.; Jung, C.H.; Kang, H. Cold shock domain proteins and glycine-rich RNA-binding proteins from Arabidopsis thaliana can promote the cold adaptation process in Escherichia coli. Nucleic Acids Res. 2007, 35, 506–516. [Google Scholar] [CrossRef] [Green Version]
- Kim, J.Y.; Park, S.J.; Jang, B.; Jung, C.H.; Ahn, S.J.; Goh, C.H.; Cho, K.; Han, O.; Kang, H. Functional characterization of a glycine-rich RNA-binding protein 2 in Arabidopsis thaliana under abiotic stress conditions. Plant J. Cell Mol. Biol. 2007, 50, 439–451. [Google Scholar] [CrossRef]
- Wang, C.; Zhang, D.-W.; Wang, Y.-C.; Zheng, L.; Yang, C.-P. A glycine-rich RNA-binding protein can mediate physiological responses in transgenic plants under salt stress. Mol. Biol. Rep. 2012, 39, 1047–1053. [Google Scholar] [CrossRef] [PubMed]
- Long, R.; Yang, Q.; Kang, J.; Zhang, T.; Wang, H.; Li, M.; Zhang, Z. Overexpression of a novel salt stress-induced glycine-rich protein gene from alfalfa causes salt and ABA sensitivity in Arabidopsis. Plant Cell Rep. 2013, 32, 1289–1298. [Google Scholar] [CrossRef] [PubMed]
- Chu, Z.; Wang, X.; Li, Y.; Yu, H.; Li, J.; Lu, Y.; Li, H.; Ouyang, B. Genomic Organization, Phylogenetic and Expression Analysis of the B-BOX Gene Family in Tomato. Front. Plant Sci. 2016, 7, 1552. [Google Scholar] [CrossRef] [PubMed] [Green Version]
- Wang, Q.; Tu, X.; Zhang, J.; Chen, X.; Rao, L. Heat stress-induced BBX18 negatively regulates the thermotolerance in Arabidopsis. Mol. Biol. Rep. 2013, 40, 2679–2688. [Google Scholar] [CrossRef]
- Shalmani, A.; Jing, X.-Q.; Shi, Y.; Muhammad, I.; Zhou, M.-R.; Wei, X.-Y.; Chen, Q.-Q.; Li, W.-Q.; Liu, W.-T.; Chen, K.-M. Characterization of B-BOX gene family and their expression profiles under hormonal, abiotic and metal stresses in Poaceae plants. BMC Genom. 2019, 20, 27. [Google Scholar] [CrossRef]
- Kiełbowicz-Matuk, A.; Rey, P.; Rorat, T. Interplay between circadian rhythm, time of the day and osmotic stress constraints in the regulation of the expression of a Solanum Double B-box gene. Ann. Bot. 2014, 113, 831–842. [Google Scholar] [CrossRef] [PubMed] [Green Version]
- Xu, Y.; Zhao, X.; Aiwaili, P.; Mu, X.; Zhao, M.; Zhao, J.; Cheng, L.; Ma, C.; Gao, J.; Hong, B. A zinc finger protein BBX19 interacts with ABF3 to affect drought tolerance negatively in chrysanthemum. Plant J. 2020, 103, 1783–1795. [Google Scholar] [CrossRef]
Publisher’s Note: MDPI stays neutral with regard to jurisdictional claims in published maps and institutional affiliations. |
© 2021 by the authors. Licensee MDPI, Basel, Switzerland. This article is an open access article distributed under the terms and conditions of the Creative Commons Attribution (CC BY) license (https://creativecommons.org/licenses/by/4.0/).