Article

Evaluating Genotype × Environment Interactions of Yield Traits and Adaptability in Rice Cultivars Grown under Temperate, Subtropical and Tropical Environments

1
Department of Agriculture, Forestry and Bioresources, Plant Genomics and Breeding Institute, Research Institute for Agriculture and Life Sciences, Seoul National University, Seoul 08826, Korea
2
Crop Research Institute, Shanghai Academy of Agricultural Sciences, Shanghai 201403, China
3
Delta Research and Extension Center, Mississippi State University, Stoneville, MS 38776, USA
*
Author to whom correspondence should be addressed.
Xing Huang and Su Jang contributed equally to this work.
Agriculture 2021, 11(6), 558; https://doi.org/10.3390/agriculture11060558
Submission received: 27 May 2021 / Revised: 14 June 2021 / Accepted: 17 June 2021 / Published: 18 June 2021
(This article belongs to the Section Genotype Evaluation and Breeding)

Abstract

:
Rice yield is a complex trait that is strongly affected by environment and genotype × environment interaction (GEI) effects. Consideration of GEI in diverse environments facilitates the accurate identification of optimal genotypes with high yield performance, which are adaptable to specific or diverse environments. In this study, multiple environment trials were conducted to evaluate grain yield (GY) and four yield-component traits: panicle length, panicle number, spikelet number per panicle, and thousand-grain weight. Eighty-nine rice varieties were cultivated in temperate, subtropical, and tropical regions for two years. The effects of both GEI (12.4–19.6%) and environment (23.6–69.6%) significantly contributed to the variation of all yield-component traits. In addition, 37.1% of GY variation was explained by GEI, indicating that GY performance was strongly affected by the different environmental conditions. GY performance and genotype stability were evaluated using simultaneous selection indexing, and 19 desirable genotypes were identified with high productivity and broad adaptability across temperate, subtropical, and tropical conditions. These optimal genotypes could be recommended for cultivation and as elite parents for rice breeding programs to improve yield potential and general adaptability to climates.

1. Introduction

Rice (Oryza sativa L.) is a staple crop for more than half of the world’s population, providing about 20% of the world’s dietary energy needs. More than 700 million tons of rice is produced annually from approximately 116 million hectares worldwide [1]. To meet the challenges of population growth, climate change, and limited arable land, rice production must be expanded through increases in yield potential [2]. Rice is cultivated under different climates, including temperate, sub-tropical, and tropical regions. Temperature is a particularly important factor, significantly affecting both plant growth and grain ripening. Higher minimum temperatures were found to decrease yield, whereas higher maximum temperatures increased yield [3]. Conversely, very high maximum temperatures during flowering drastically reduced rice yield due to lower spikelet fertility [4]. These observations indicate that the effect of temperature on yield largely depends on growth stage.
Rice yield is determined by several yield-related factors, including panicle number, spikelet number per panicle, and grain weight. Previous studies showed that rice yield was strongly influenced by environment effects and genotype × environment interaction (GEI) in addition to genotypic effect [5,6,7,8]. GEI represents the response of different genotypes to each environment, termed adaptation [9]. Thus, identifying GEI in specific or broad environments is essential to accurately evaluate the yield performance of different rice genotypes [10]. Wide adaptation is defined as the ability to produce stable high yields across diverse environments [11,12], and a major goal in rice breeding programs is to achieve stability of yield performance in different agricultural environments [13].
Genotypic main effect plus GEI (GGE) biplot analysis is a statistical method that has been widely employed to detect the GEI of target traits in multiple environments. GGE biplots graphically indicate the GEI of multiple environmental trials in a way that facilitates the evaluation of varieties. GGE biplots are constructed using first and second symmetrically scaled principal components derived from singular value decomposition of environment-centered multiple environment trial data, facilitating genotype evaluation and mega-environment delineation [14]. More recently, a method was proposed to measure quantitative genotypic stability using WAASB, the weighted average of absolute scores from the singular value decomposition of the matrix of best linear unbiased predictions (BLUP), for GEI effects obtained in a linear mixed model (LMM) [15]. WAASB has the advantage of avoiding biased interpretations of traditional additive main effects and multiplicative interaction (AMMI) models, which occur when the proportion of the variance explained in the first two interaction principal component axes (IPCA) is low [15].
The objectives of this study are (1) to evaluate rice yield and its component traits from the grain yield performance of 89 rice accessions cultivated in temperate, subtropical, and tropical environments, (2) to investigate GEI for the yield traits using multi-environment trial data, and (3) to identify ideal genotypes with high yield performance and wide adaptation for yield stability in diverse environments.

2. Materials and Methods

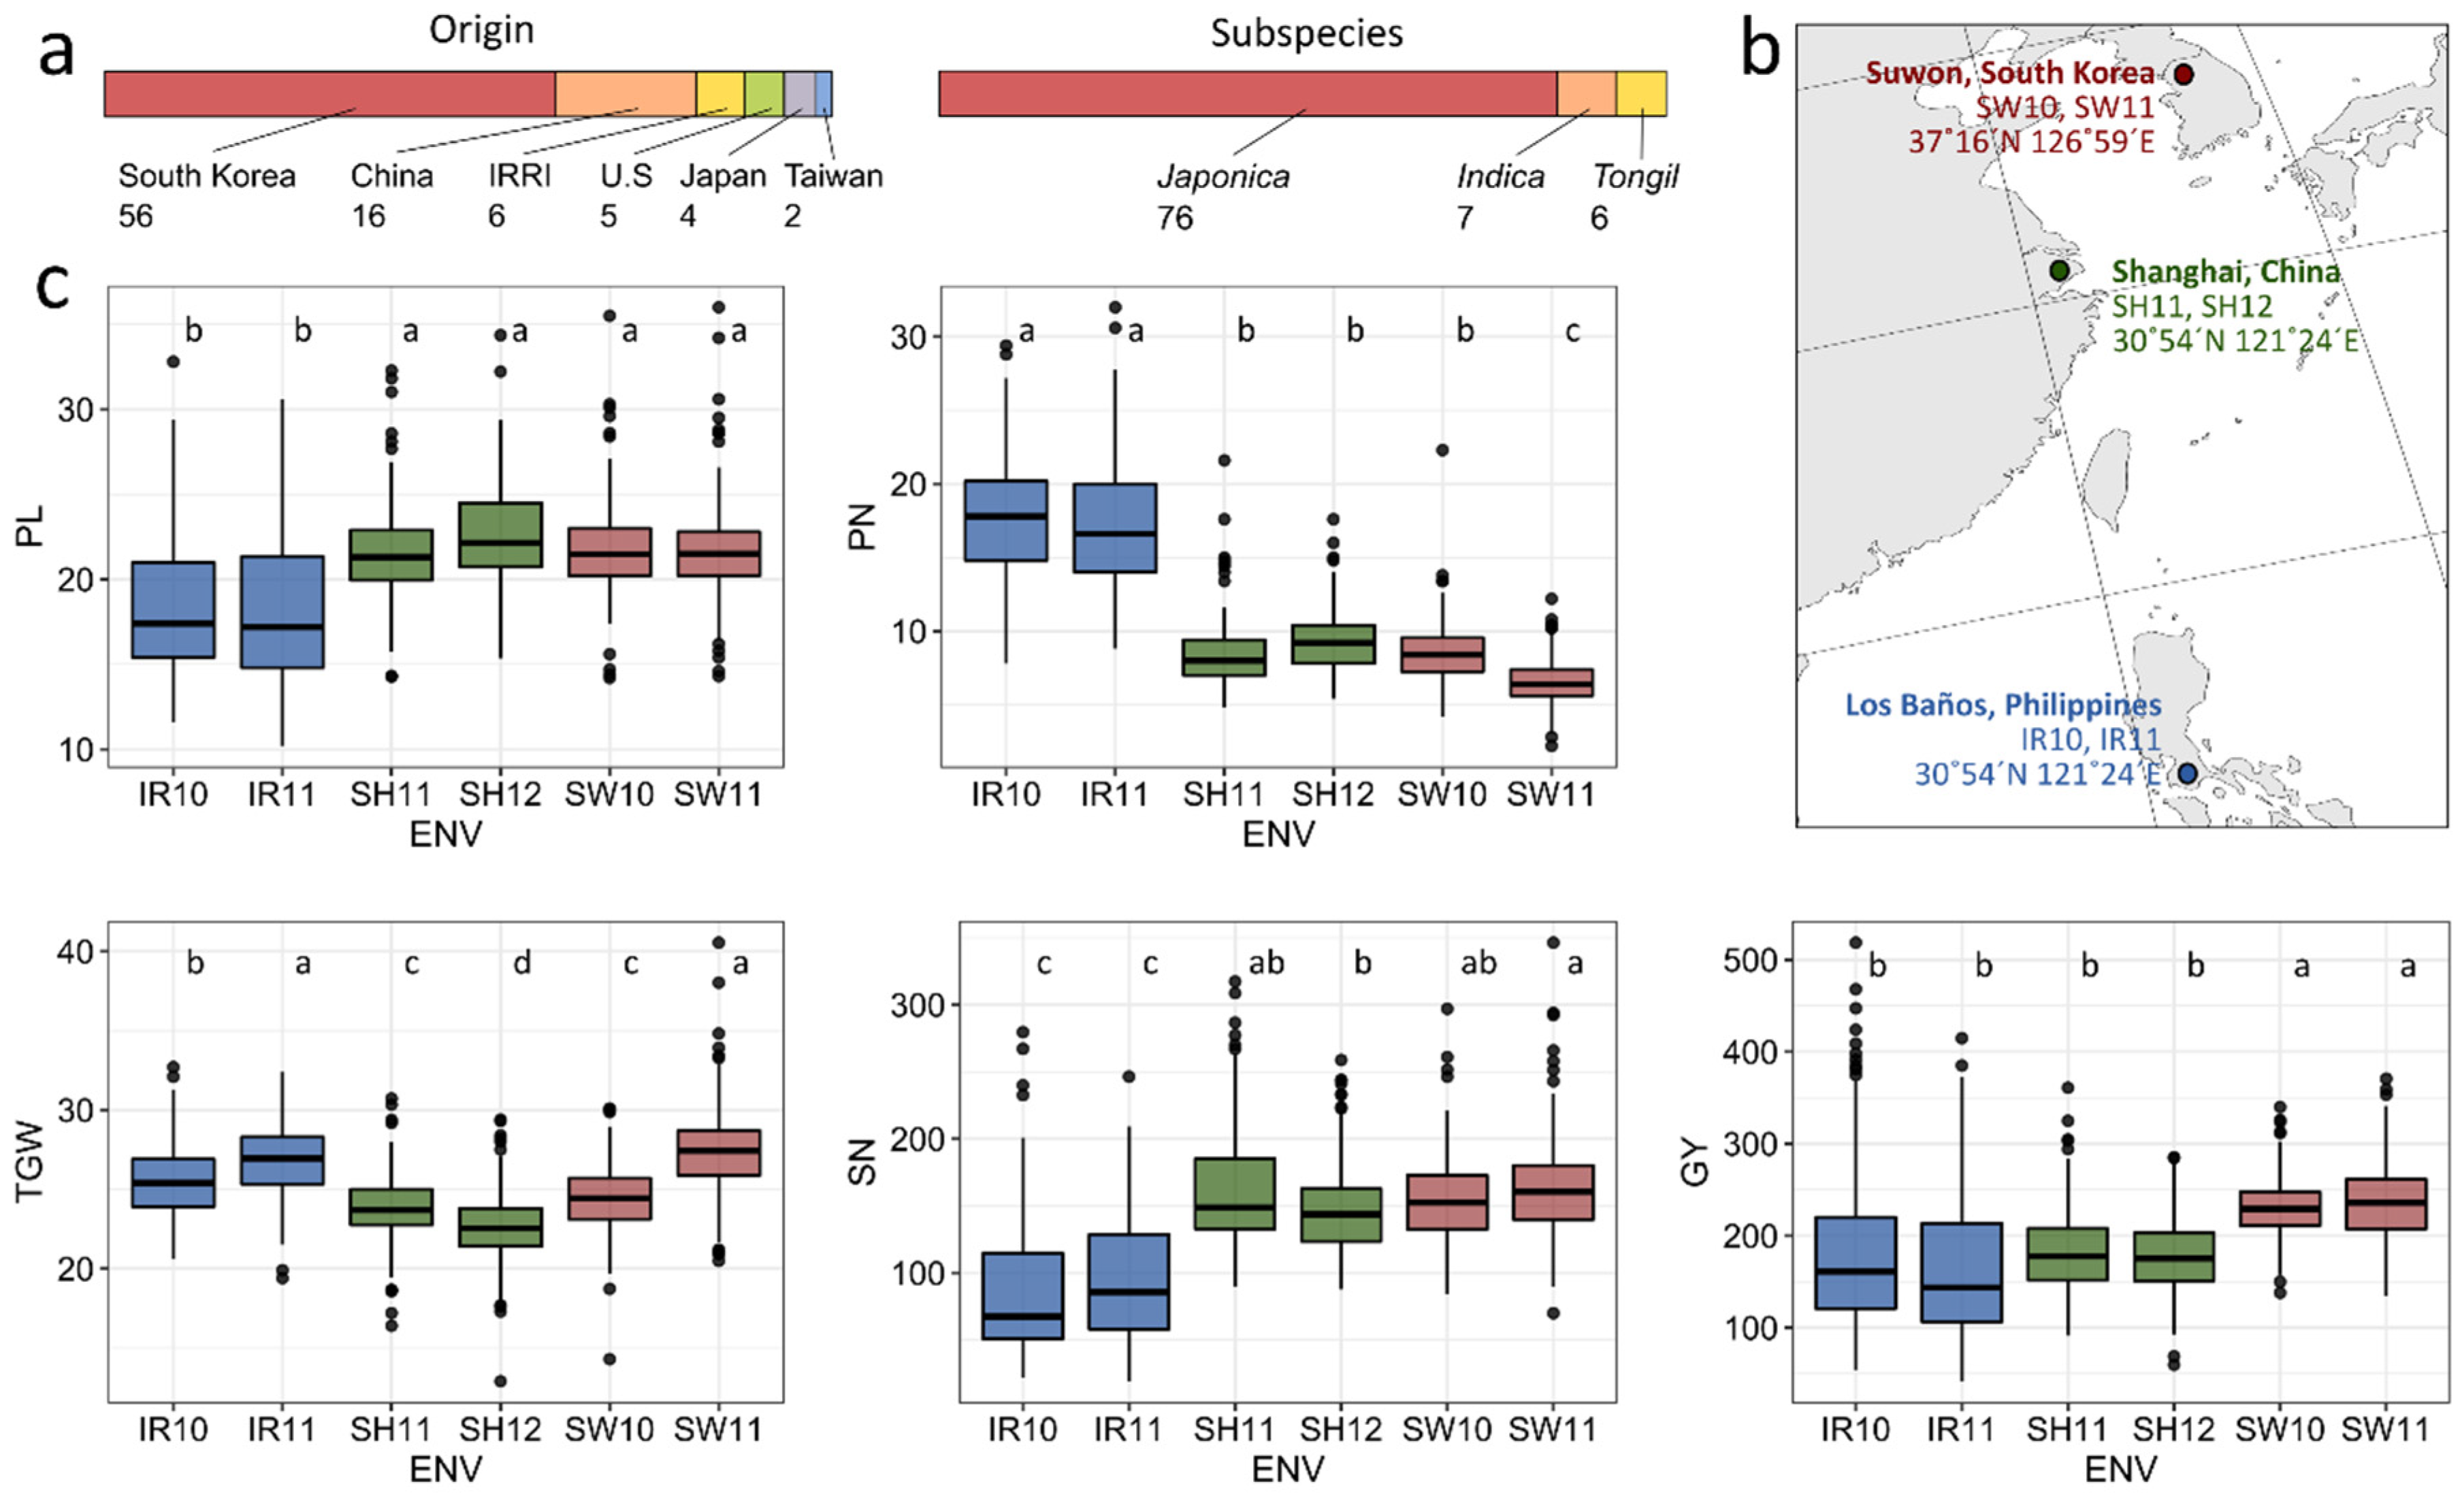
2.1. Plant Materials

A total of 89 rice varieties, comprising 76 japonica, 7 indica, and 6 tongil-type varieties, were used for field experiments. Japonica rice accessions were from five countries: South Korea, China, U.S., Japan, and Taiwan. Tongil-type varieties, which are Korean high-yielding rice varieties, were developed by inter-subspecies crosses between indica and japonica cultivars. Six of the indica rice accessions, named ‘IR varieties’, were developed by the International Rice Research Institute (IRRI), and the remaining indica accession, Gumei 4, was of Chinese origin (Figure 1a). All rice accessions were conserved at the Agricultural Genetic Resource Center, Seoul National University (SNU), Suwon, South Korea, and are listed in Supplementary data Table S1.

2.2. Location and Field Experimental Design

Field experiments were conducted in three different locations for two years (Figure 1b). To evaluate the adaptability of varieties to temperate conditions, plant materials were cultivated in the experimental field at SNU, Suwon, South Korea (37°16′ N 126°59′ E and 28.5 m above sea level) during May–October 2010 and 2011 (SW10 and SW11). To evaluate subtropical adaptability, field trials were conducted at the Shanghai Academy of Agricultural Science, Shanghai, China (30°54′ N 121°24′ E and 5.6 m above sea level) during May–October, 2011 and 2012 (SH11 and SH12). To evaluate tropical region adaptability, plants were grown at the IRRI, Los Baños, Philippines (14°10′N 121°15′E and 16.3 m above sea level) during June–September 2010 and 2011 (IR10 and IR11). In Suwon, plant materials were seeded on 5 May 2010 and 29 April 2011 and transplanted on 5 June 2010 and 4 June 2011. In Shanghai, seeds were sown on 20 May 2011 and 22 May 2012, and seedlings were transplanted on 15 June 2011 and 17 June 2012. In Los Baños, seeds were sown on 28 June 2010 and 9 June 2011, and seedlings were transplanted on 20 July 2010 and 30 June 2011. Detailed environmental conditions are shown in Table S2. Seedlings were transplanted into irrigated paddy fields as follows: one plant per hill, 15 cm between plants in a row, 30 cm between rows, and two rows per variety. Fertilizers were applied at 100 kg N ha −1, 80 kg P ha −1, and 80 kg K ha −1 (100-80-80 kg/ha N-P-K). Experimental plots were arranged in a randomized complete block design with two replications, each containing 89 rice varieties.

2.3. Measurement of Traits

Four yield-component traits, namely panicle length (PL; cm), panicle number (PN), spikelet number per panicle (SN), and thousand-grain weight (TGW; g), as well as grain yield (GY; g), were measured across all environments. Five replicate measurements were taken in each duplicate block for each of the yield-component traits, according to the Standard Evaluation System (SES) [16]. GY was determined from 10 plants in each block.

2.4. Statistical Analyses

All statistical analyses were performed using R version 3.3.1 [17]. Multiple comparisons of yield-related traits and GY among environments were conducted by one-way analysis of variance (ANOVA) with Scheffe’s post hoc test (p ≤ 0.05) using the ‘Agricolae’ package [18]. Combined ANOVA was performed to test the presence of GEI using a complete data set of experiments across six environments (three regions and two years). To evaluate the contribution of each factor to the yield-component traits and GY, percentages of explained sum of squares of genotype, environment, and GEI were calculated as the sum of squares of each source divided by total sum of squares. Adaptability of genotypes and mega-environments (MEs), a group of environments that share the same winning genotypes, in the six environment trials were evaluated using genotypic main effect plus GEI (GGE) biplot analysis [19], using the ‘metan’ package [20]. Environments were evaluated using the ‘discriminativeness vs. representativeness’ view of the GGE biplot. MEs and winner genotypes in a given set of environments were identified using a ‘which-won-where’ GGE biplot. Adaptability of genotypes to multi-environments was evaluated using a ‘ranking genotypes’ GGE biplot, comparing the ideal genotypes for the four yield-component traits, which were defined as showing the highest performance in all environments. To evaluate the GY stability of genotypes across environments, WAASB (Weighted Average of Absolute Scores from the singular value decomposition of the matrix of BLUP for GEI effects generated by a linear mixed-effect model) [15] was estimated, assuming genotype and GEI as random effects and environment and blocks within environments as fixed factors. The WAASBY index [15], a superiority index that allows weighting between performance (i.e., GY) and stability (WAASB), was calculated to identify genotypes that combined high GY with stability. Path coefficient analyses were performed using the ‘lavaan’ package [21] to estimate the contributions of each yield-component variable to GY across all environments. The direct effects of yield-component traits on GY were represented by standardized path coefficients.

3. Results

3.1. Variation of Grain Yield and Its Components in Rice Cultivars in Multiple Environments

A panel of 89 rice accessions was cultivated in temperate, subtropical, and tropical conditions over two years. Environmental conditions, including temperature, relative humidity, and precipitation, varied substantially among the three locations. In Suwon (temperate environment, SW10 and SW11) and Shanghai (subtropical environment, SH11 and SH12), higher mean temperatures were observed from July to August in both years, whereas consistent temperatures were observed throughout the growing season in Los Baños (tropical environment, IR10 and IR11) (Table S2). Shanghai showed relatively higher mean temperatures in July compared with other locations. In Suwon, relative humidity was higher in July–August, after rice heading. In Shanghai, humidity was higher after transplanting (June) and heading (August) than at other periods in the growth season. In Los Baños, high humidities of >80% were observed throughout the growing season. High variability was observed in yield-component traits and GY among the genotypes and across the different environments (Figure 1c, Table S3). Averages of PL and SN were significantly lower in the tropical IR10 and IR11 conditions than in temperate or subtropical environments. By contrast, average PN in IR10 and IR11 conditions was significantly higher than in other environments. TGW was significantly different between years, even in similar environmental conditions. Average TGW was highest in SW11 and IR11 and lowest in SH12 conditions. Average GY was significantly higher in temperate conditions (SW10 and SW11) than in subtropical or tropical conditions. The combined analysis of variance of the six trials (three environments × two years) showed significant main effects of genotype, environment, and GEI for all traits (Table 1). The percentage of explained sum of squares values showed that the highest proportion of PL variation was due to genotype (52.9%) and the highest proportion of PN variation was due to environment (69.6%). Large proportions of SN and TGW variation were explained by both genotype (33.9–40.6%) and environment (34.8–35.8%) effects. Genotype and GEI had larger effects on GY, accounting for 35.6% and 37.1% of total variation, respectively.

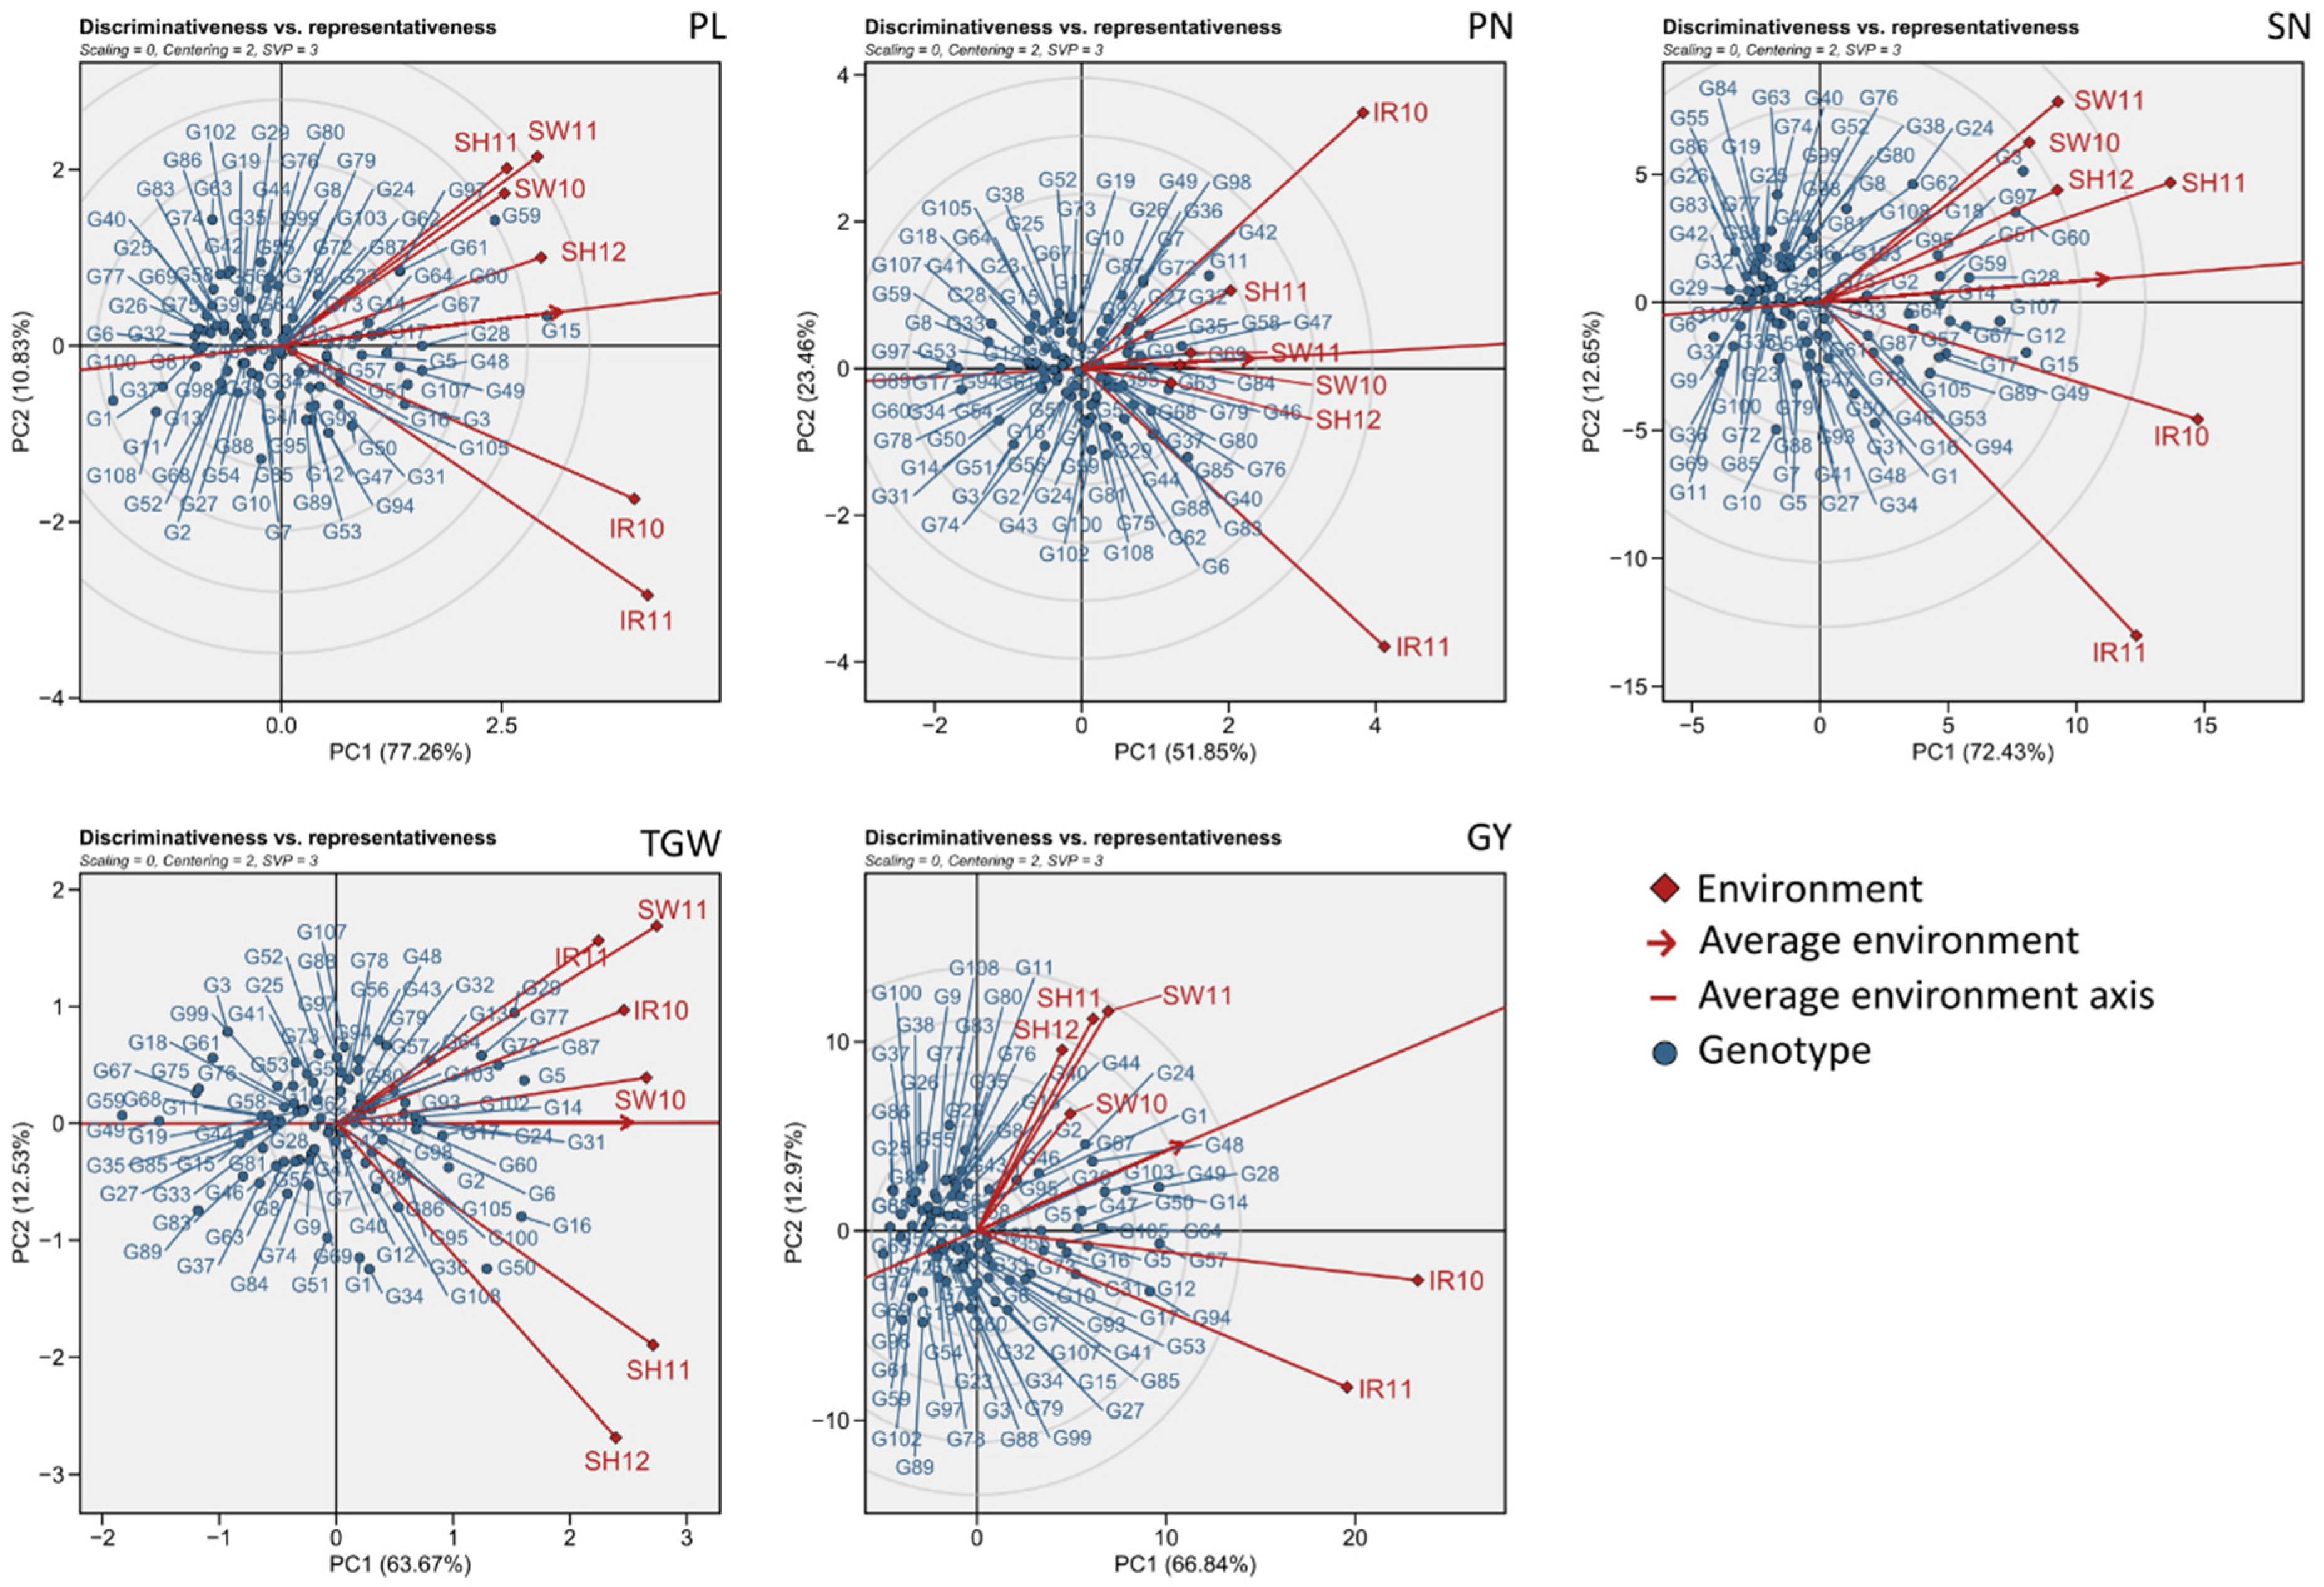
3.2. Environmental Evaluation and Adaptability in Specific Environments

Evaluation of discriminativeness vs. representativeness was performed using GGE biplots (Figure 2). The lengths of environment vectors from the biplot origin are proportional to the standard deviation within each environment and thus represent the discriminating ability of the environments [22]. Tropical conditions (IR10 and IR11) showed the highest discriminating ability for PL, PN, SN, and GY among the six environments (Figure 2). For the term of TGW, discriminating ability was ranked as follows: SH12 > SH11 > SW11 > IR11 > SW10 > IR10. The angle between the environment line and the average-environment axis (AEA), which passes through the average environments and biplot origin, indicates the representativeness of each environment. For PL, SH12 was more representative than the other environments, exhibiting a smaller angle with the AEA line. For PN, temperate conditions (SW10 and SW11) were the most representative, and tropical conditions (IR10 and IR11) were the least representative. For SN, subtropical conditions (SH11 and SH12) were more representative than other conditions. SW10 and IR10 were the most representative for TGW and GY, respectively.
Environments were divided into potential MEs based on ‘which-won-where’ patterns in GGE biplots (Figure 3). A polygon is constructed by connecting the genotypes furthest from the biplot origin by straight lines, and thus all other tested genotypes are contained in the polygon. Perpendicular lines starting from the biplot origin to each side of the polygon divide the biplot into environment sectors [22]. Genotypes were assigned genotype codes to facilitate their visualization in the plot (Table S1). For PL, the six environments were segregated into two MEs, the first containing SW10, SW11, and SH11, and the second containing SH12, IR10, and IR11. G59 was the vertex genotype for the first sector and G3, G15, and G50 were vertex genotypes in the second sector. These results indicated that G59 (Kunmingxiaobaigu) was the winning genotype, exhibiting the longest panicle, for the ME that included SW10, SW11, and SH11. Genotypes G3 (Bluebonnet), G15 (Della), and G50 (IR 8) were the best performing genotypes in the second ME. For PN, the six environments were divided into two MEs. The first ME contained SW10, SW11, SH11, and IR10, and G7 (Cheongan) and G11 (Chucheong) were the best performing genotypes. The second ME included SH12 and IR11, and G83 (Sandeuljinmi) and G108 (Zhendao 88) were the winning genotypes. For SN, G3 (Bluebonnet) and G15 (Della) were the best performing genotypes in the first ME (SW10, SW11, SH11, and SH12) and the second ME (IR10 and IR11), respectively. For TGW, the first ME contained SW10, SW11, IR10, and IR11, and genotypes G5 (Chengcheong) and G29 (Hanmaeum) showed the highest performance. SH11 and SH12 were included in the other ME, and G34 (Hopum) and G50 (IR 8) were the winning genotypes. In multiple environment trials for GY, the six environments were divided into four ME sectors. Two of these MEs represented locations: Shanghai and Suwon. G24 (Gumei 4) and G28 (Hangangchal 1) were the best performing genotypes in the ME containing SW10 and SW11. Genotypes G57 (Keunseom) and G94 (Taichung 178) were the winning genotypes in IR10 and IR11, respectively.

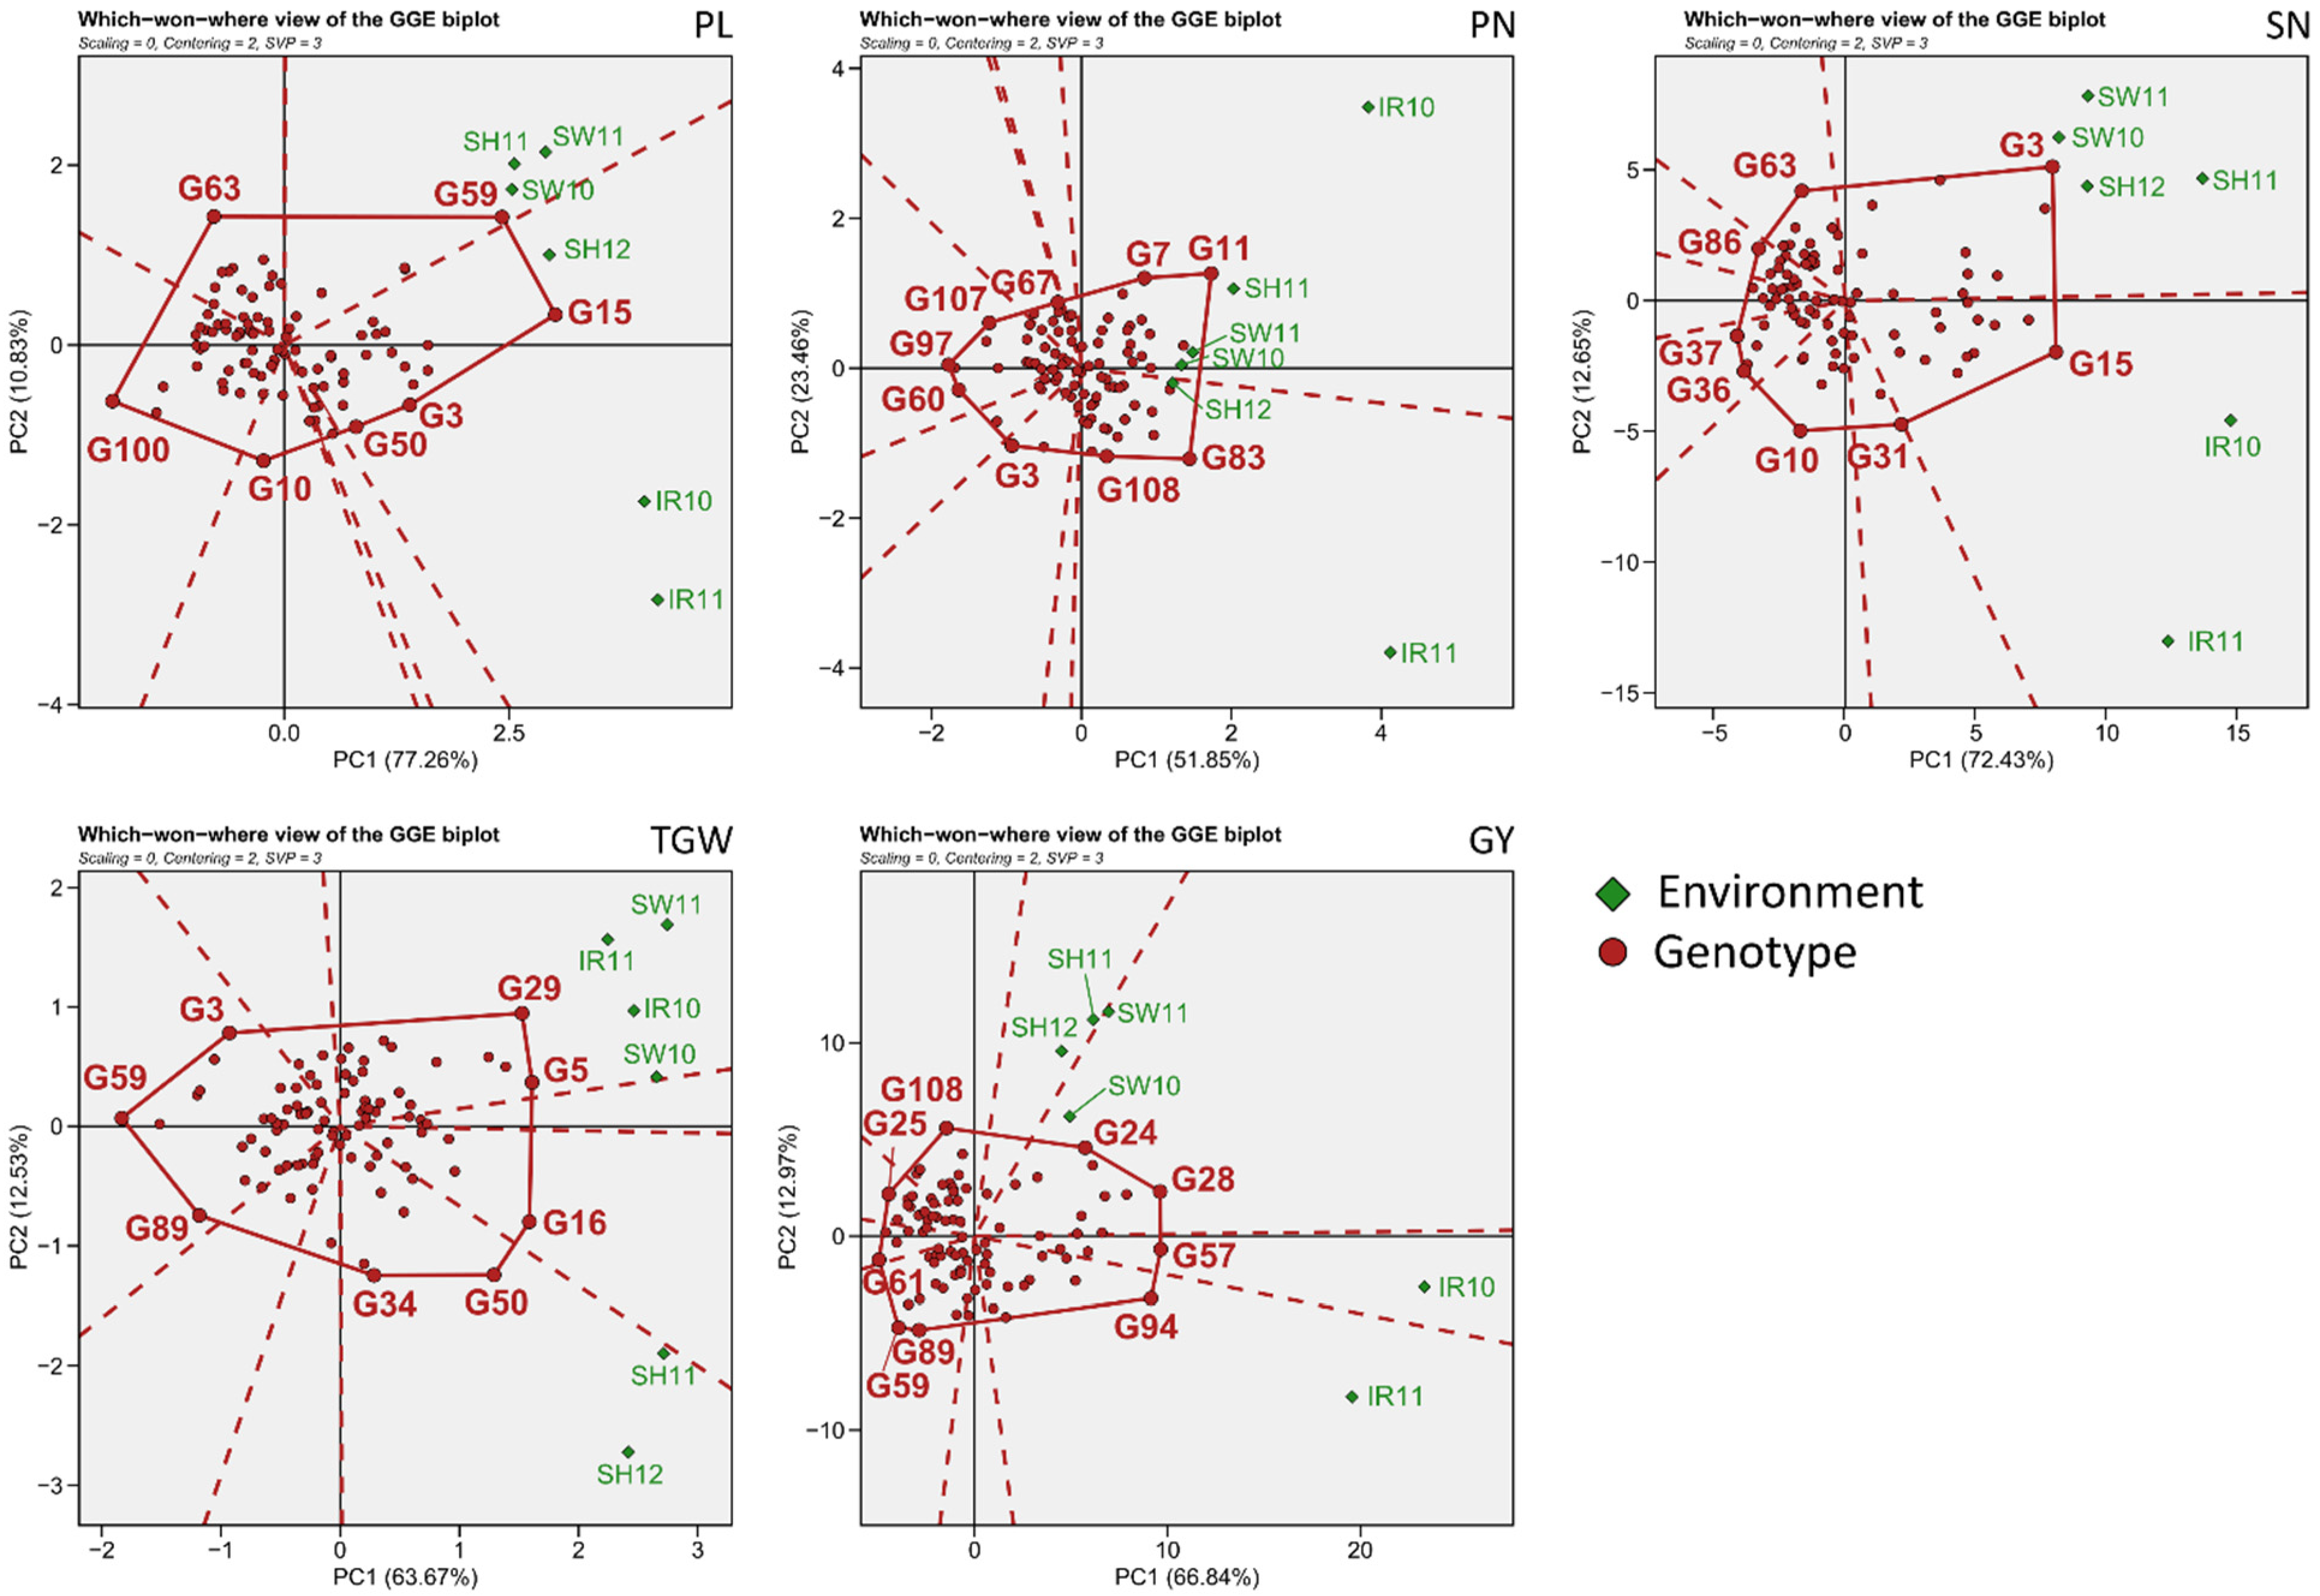
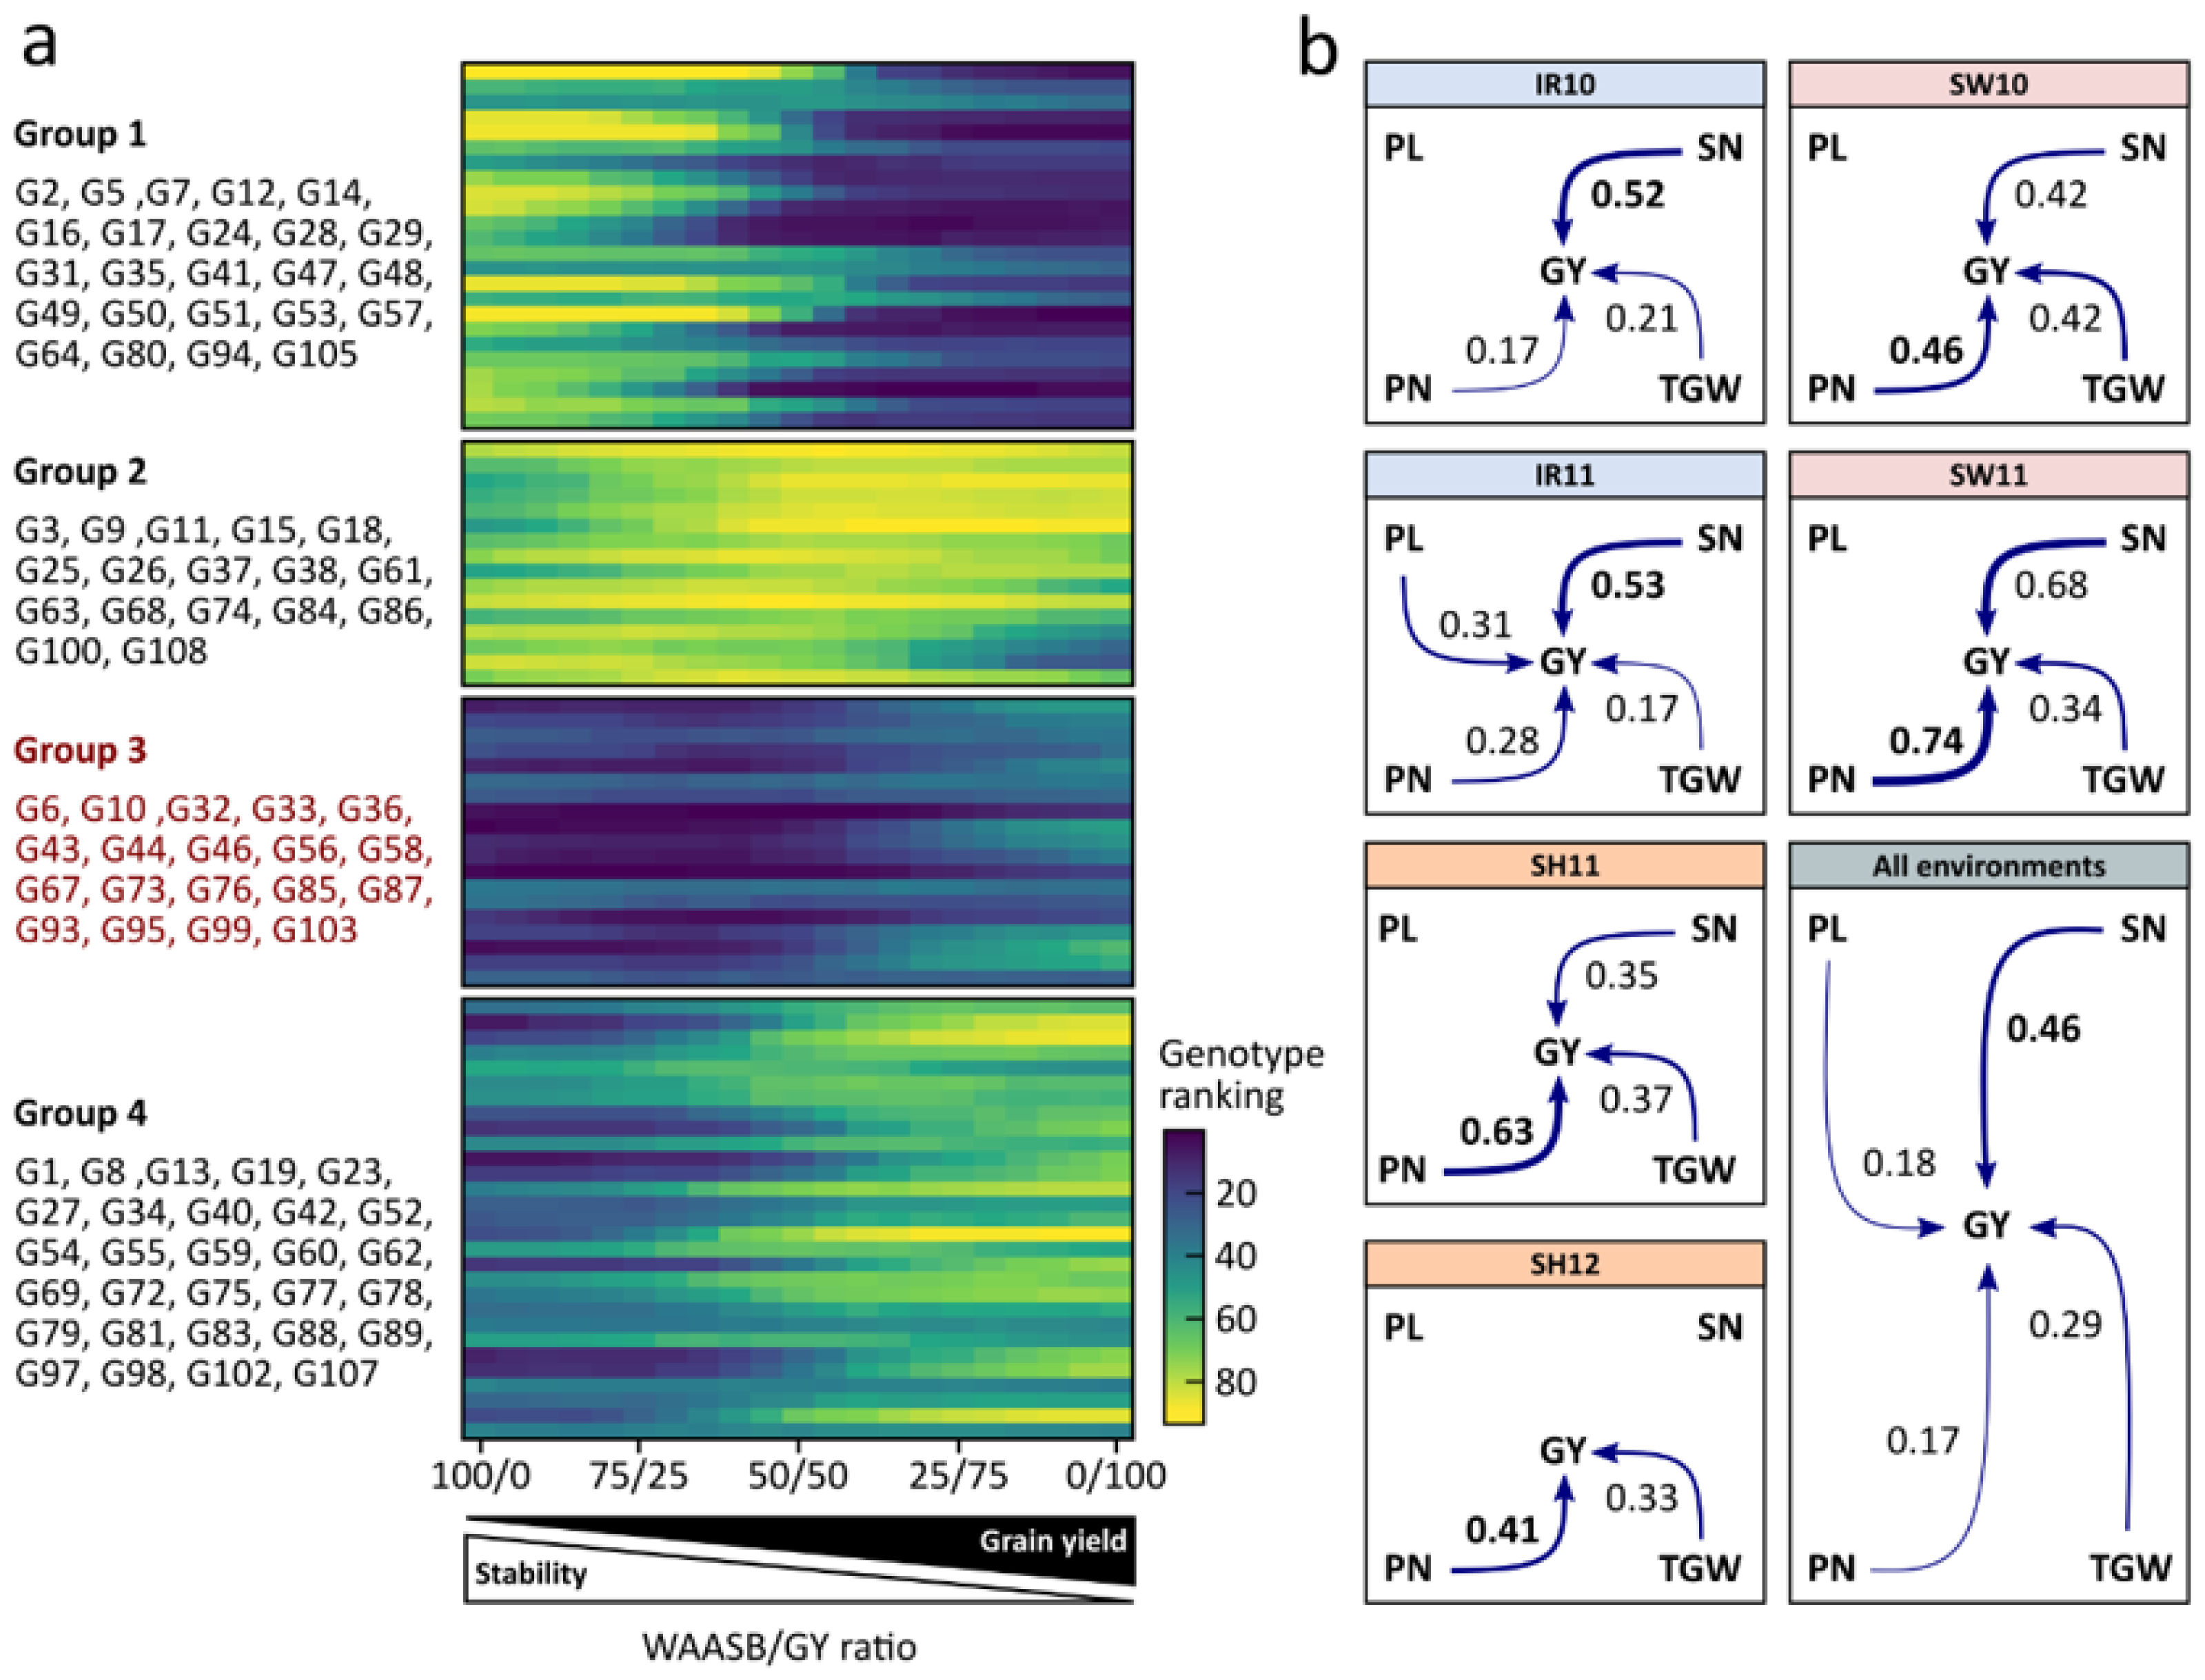
3.3. General Adaptability of Yield Traits

Genotype evaluation was conducted by comparing genotypes to the ideal genotype using an average environment coordinate (AEC) view of GGE plots (Figure 4). Ideal genotype is located at a point on the AEA in a positive direction and has a vector length the same as the longest genotype vector on the positive side of the AEA. Thus, the ideal genotype is indicative of the highest performance and the highest stability across environments. For PL, genotypes G15 (Della) and G59 (Kunmingxiaobaigu) were located closest to the ideal genotype: these genotypes had the longest PLs and exhibited moderate stability across environments. For PN, genotypes G46 (IR 36) and G47 (IR 56) were closest to the ideal genotype and exhibited relatively higher numbers of panicles along with higher stability. G60 (LaCrosse) and G107 (Zenith) were closest to the ideal genotype for SN, exhibiting high numbers of spikelets per panicle alongside higher stability. For TGW, genotypes G5 (Chengcheong) and G16 (Dianjingyou 1) exhibited elevated performance compared with other genotypes, but G5 was more environmentally stable than G16.

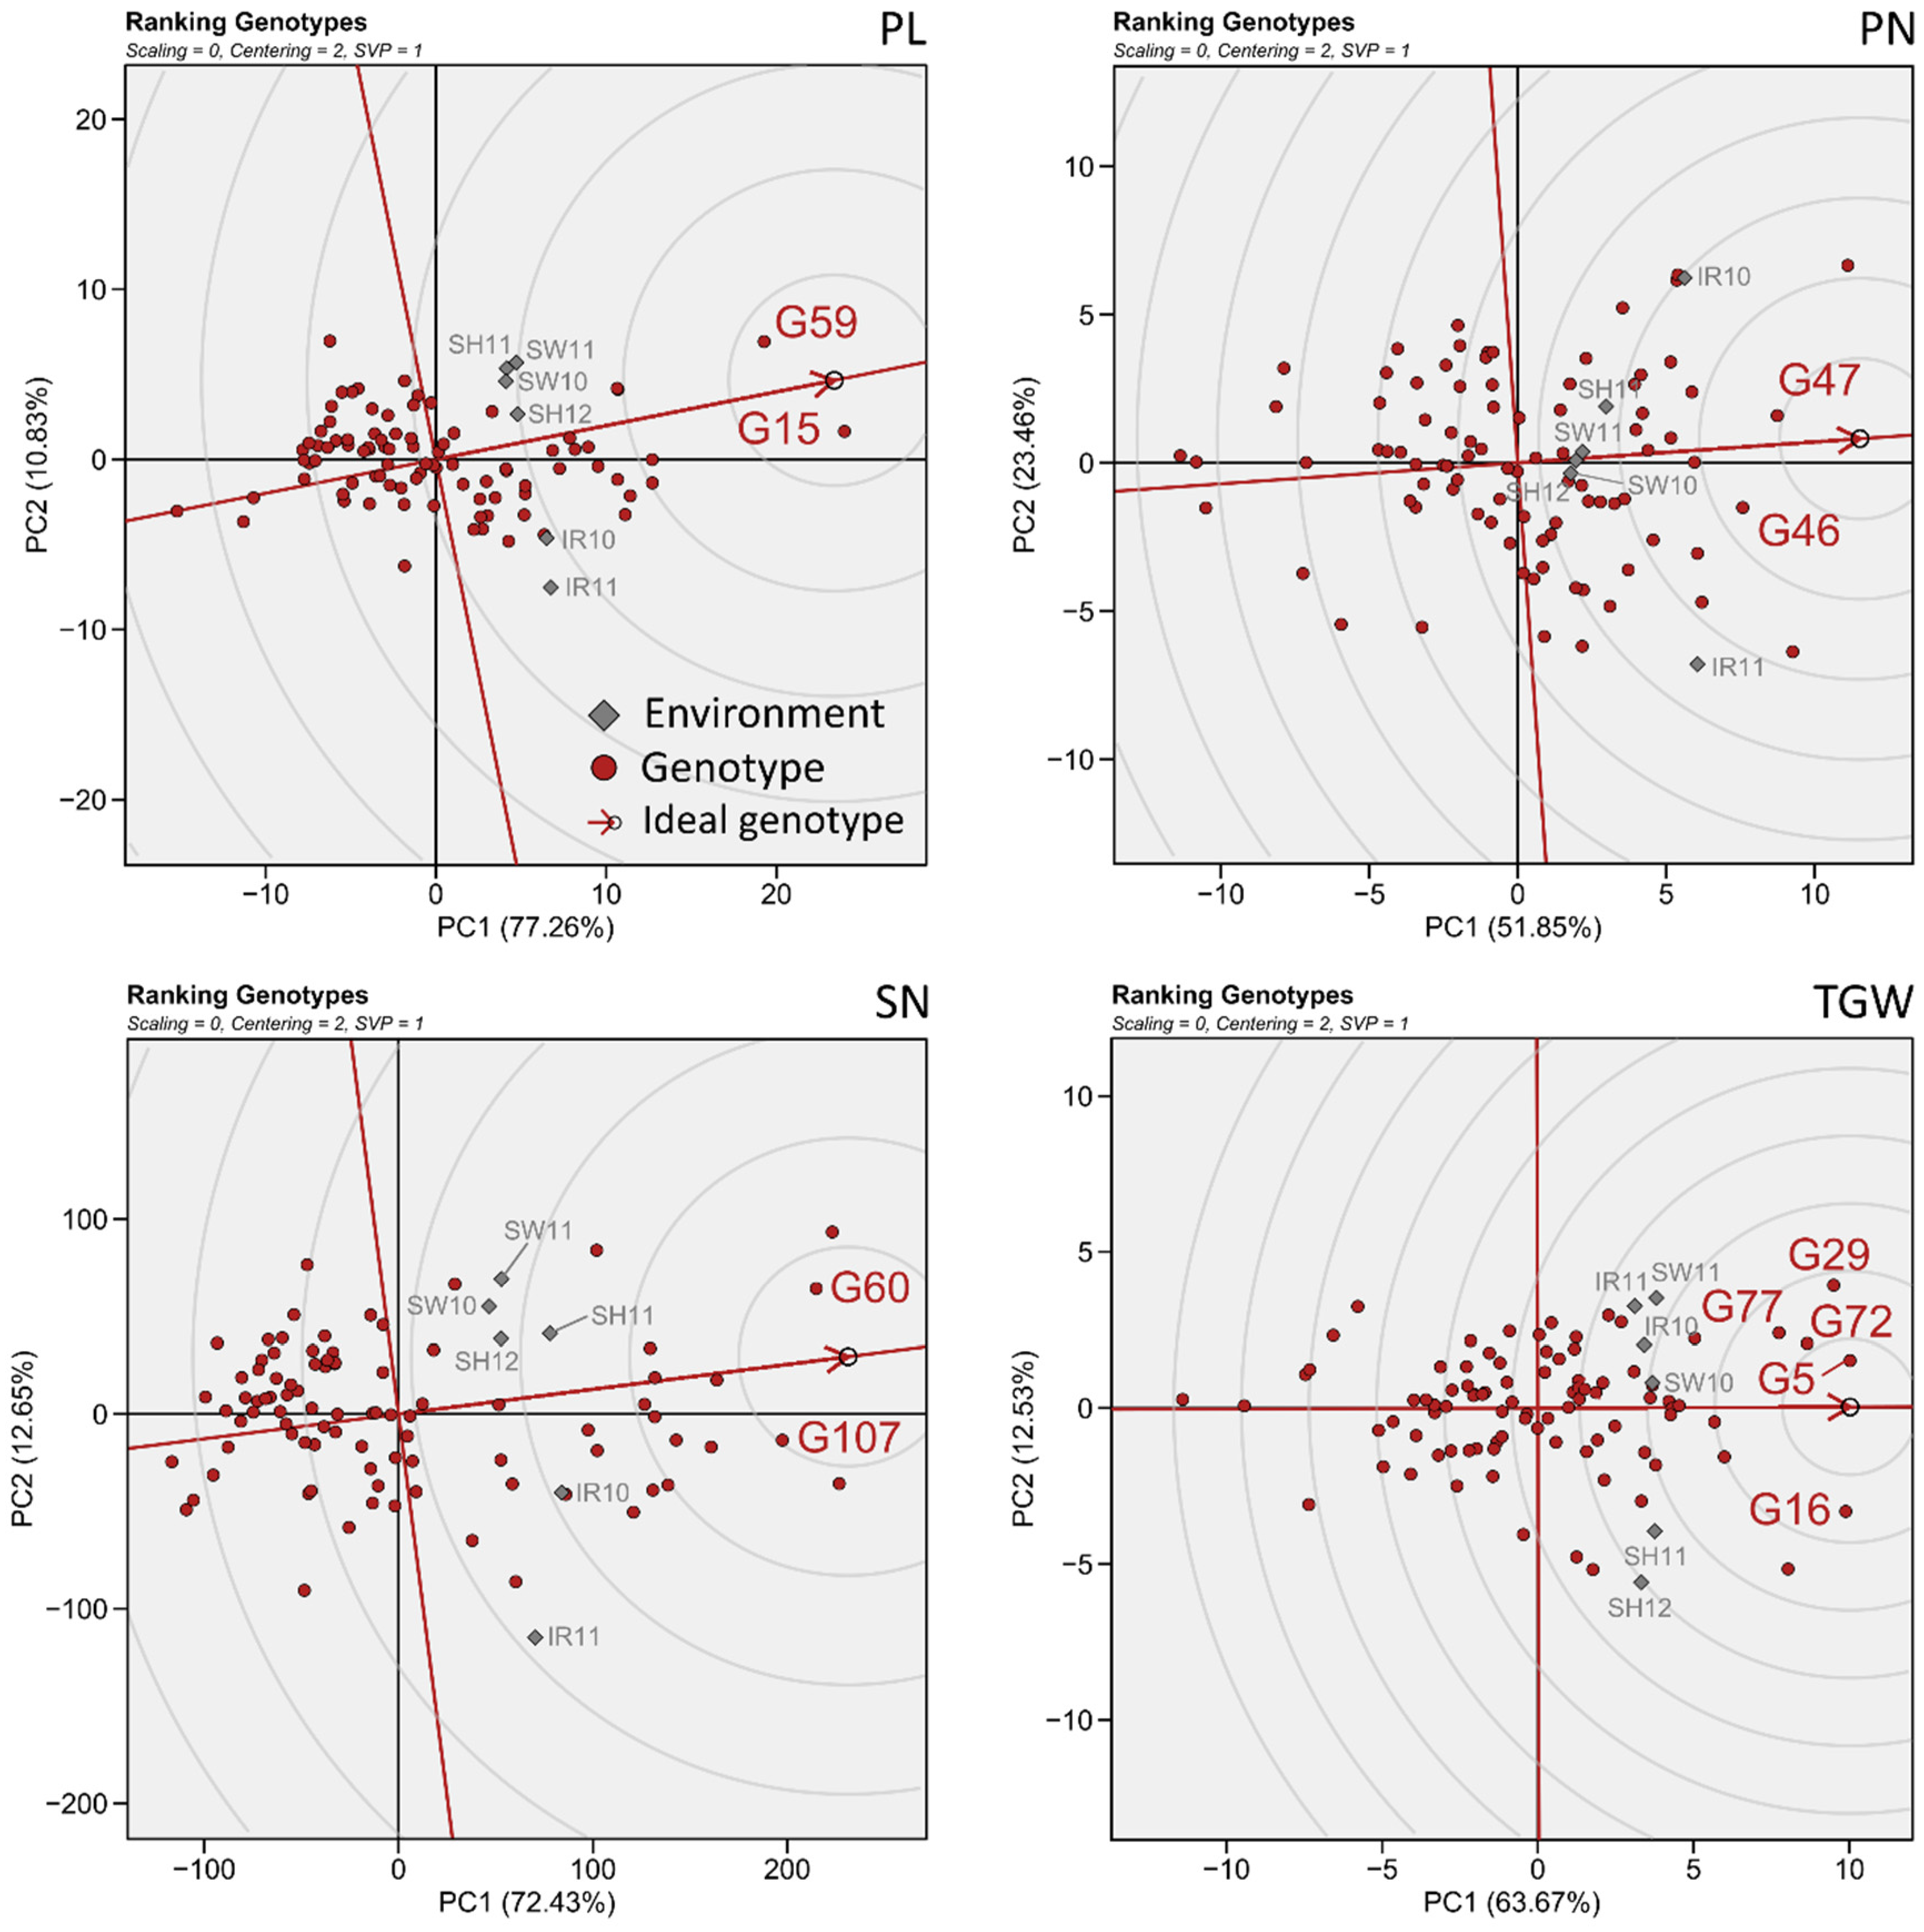
3.4. Simultaneous Selection of High Grain Performance and High Environmental Stability

To precisely evaluate GY performance and stability, genotypes were ranked using WAASBY (WAASB/GY ratio) scores (Table S4). In the WAASB/GY ratio, the first component relates to environmental stability and the second to GY productivity. Thus, a ratio of 100/0 relates only to stability and a ratio of 0/100 relates only to productivity in genotype ranking [15]. The genotypes were classified into four groups (Figure 5a). Group 1 included genotypes with high GY (high productivity) but low stability, being highly ranked when the WAASB/GY ratio was low (greater weight for productivity). Most of the indica (six out of seven varieties) and tongil-type (five out of six varieties) cultivars that exhibited high GY were found in Group 1. The genotypes in Group 2 had low productivity (i.e., low GY) and were also unstable, with lower rankings with both low and high WAASB/GY ratios. Conversely, Group 3, which contained 17 japonica, one indica, and one tongil-type cultivar, contained highly productive (high GY) genotypes that were also stable across different environments. Group 4 included genotypes with high stability performance but low GY.
Path analyses were conducted using single- and multi-environment trial data to investigate the contributions of the different yield-component traits to GY performance in specific environments and across environments (Figure 5b). In tropical conditions, SN had the highest direct positive effect on GY, with path coefficients of 0.52 (IR10) and 0.53 (IR11). In subtropical conditions, PN had the highest positive direct effect on GY, with path coefficients of 0.63 (SH11) and 0.41 (SH12). PN also had the highest impact on GY in temperate conditions, with path coefficients of 0.46 (SW10) and 0.74 (SW11). No significance was found between PL and GY in either of the two years of cultivation in subtropical or temperate conditions. When means of variables were considered across all environments, SN was the major contributor to GY, with a direct effect coefficient of 0.46.

4. Discussion

The identification of genotypes with high yield, production stability, and adaptability to a range of environments is one of the main targets of rice breeding programs. Investigating the effects of genotype and the interactions between genotype and environment is important for selection and evaluation of superior genotypes in multi-environment trials [23].
Plant phenotypic plasticity resulting from GEI was apparent, with plant morphology and phenology adjusting to environmental conditions [24,25]. In this study, field trials were conducted over two years to evaluate genotypes and GY in temperate, subtropical, and tropical environments. Yield-component traits and GY of genotypes varied according to environments. PL, PN, and SN were significantly different between the tropical and subtropical/temperate regions (Figure 1c and Table S1). In tropical conditions (IR10 and IR11), PN averages were higher, and SN and PL averages were lower, than in other environments. In addition, yield-component traits exhibited varying patterns of direct effects on GY (Figure 5b). These results indicate that yield-component traits are affected by environment and GEI and are differentially expressed in specific environments, and plant adaptive plasticity modulates the contribution of each of the yield-component traits to GY in different environments.
Combined ANOVA revealed that the effects of both GEI (12.4–19.6%) and environment (23.6–69.6%) significantly contributed to the variation of all yield-component traits (Table 1). The highest proportion of PN variation was explained by environment (69.6%), and the smallest proportion of variation was explained by genotype (9.7%). However, larger proportions of variation were explained by genotype effects for PL (52.9%), SN (40.6%), and TGW (33.9%). These results suggest that genotype evaluation based on the performance of PL, SN, and TGW, which were more strongly impacted by genotype effects, was an efficient approach for identifying adaptable genotypes with high GY stability.
For GY, 37.1% of variation was explained significantly by GEI, indicating that the GY performance of genotypes was strongly affected by different climate conditions (Table 1). A ‘which-won-where’ GGE biplot showed that superior genotypes for GY could be found in temperate (SW10 and SW11) and tropical conditions (IR10 and IR11), but that winning genotypes were not found in the subtropical region (Figure 3). The winning genotypes were G57 (Keunseom) and G94 (Taichung 178) in tropical conditions and G24 (Gumei 4) and G28 (Hangangchal 1) in temperate conditions. Indica varieties usually adapt to tropical conditions better than japonica varieties, but japonica varieties exhibit higher performance than indica cultivars under cooler conditions, as determined by their morphological and physiological characteristics [26,27,28]. In this study, two tongil-type varieties, Keunseom and Hangangchal 1, had higher GY performance than indica and japonica varieties in both tropical and temperate environments. This result suggests that inter-subspecific cross breeding between indica and japonica might lead to improved performance in diverse environments.
Simultaneous selection indexing based on ranking additive main effects, multiplicative interaction stability values (ASV), and mean performance has been widely used to identify genotypes that combine high performance with stability [29,30,31,32]. However, if the explanation of the GEI pattern in the first two-interaction principal component axis is low, then the ASV ranking can be misleading [15]. Therefore, this study employed WAASBY indexing to identify genotype groups that combined high GY with environmental stability (Figure 5a). When the mean productivity of a genotype was prioritized over stability, the varieties in Group 1, including high-yielding indica IR varieties and tongil-type varieties, were defined as favorable genotypes across multiple environments. However, identifying desired genotypes based on high performance or stability alone could lead to misinterpretation. High performance is favorable only when combined with high stability, and high stability is least desirable if combined with low performance [23]. Therefore, we focused on varieties in Group 3, though the genotype ranking was lower than in Group 1 when the WAASBY index was weighted towards GY. The varieties in Group 3 showed higher rankings with high or low WAASB/GY ratios in multi-environment trials (Figure 5a). These results suggest that the 19 genotypes in Group 3 are favorable genotypes, with relatively high yield and stable performance in temperate, subtropical, and tropical conditions. Thus, these ideal genotypes could be recommended for widespread cultivation and as elite parents in rice breeding programs to improve yield potential and general adaptability in various climates.

5. Conclusions

Some yield-component traits (PL, PN, and SN) differed according to environmental conditions, indicating that the contributions of yield components to GY were mutable between temperate/subtropical and tropical conditions. All yield-component traits and GY were significantly influenced by GEI effects. In particular, genotype and GEI had large effects on GY, accounting for 35.6% and 37.1% of total GY variation, respectively. Simultaneous selection indexing using WAASBY identified 19 optimal varieties, with high productivity and stability in temperate, subtropical, and tropical regions.

Supplementary Materials

The following are available online at https://www.mdpi.com/article/10.3390/agriculture11060558/s1, Table S1: Information of rice varieties used in this study, Table S2: Information of the trial environments, Table S3: Statistics description of yield-related traits and GY across environments, Table S4: The ranks of genotype depending on WAASBY index with different WAASB/GY ratio.

Author Contributions

S.J. and X.H. designed the experiments and prepared the manuscript. X.H., B.K., Z.P. and E.R. conducted field experiments and collected phenotype data. S.J. performed the computational analysis. H.-J.K. participated in the supervision of the overall work and contributed to the finalization of the manuscript. All authors have read and agreed to the published version of the manuscript.

Funding

This study was supported by a grant from the Next-Generation BioGreen 21 Program (no. PJ013165) of the Rural Development Administration (RDA), Republic of Korea. The funding agency had no role in the experimental design, data collection and analysis, and preparation of the manuscript.

Conflicts of Interest

The authors declare that they have no competing interest.

References

  1. FAOSTAT. FAOSTAT Database; Food and Agriculture Organization (FAO): Rome, Italy, 2015. [Google Scholar]
  2. Cordero-Lara, K.I. Temperate japonica rice (Oryza sativa L.) breeding: History, present and future challenges. Chil. J. Agric. Res. 2020, 80, 303–314. [Google Scholar] [CrossRef]
  3. Welch, J.R.; Vincent, J.R.; Auffhammer, M.; Moya, P.F.; Dobermann, A.; Dawe, D. Rice yields in tropical/subtropical Asia exhibit large but opposing sensitivities to minimum and maximum temperatures. Proc. Natl. Acad. Sci. USA 2010, 107, 14562–14567. [Google Scholar] [CrossRef] [Green Version]
  4. Peng, S.; Huang, J.; Sheehy, J.E.; Laza, R.C.; Visperas, R.M.; Zhong, X.; Centeno, G.S.; Khush, G.S.; Cassman, K.G. Rice yields decline with higher night temperature from global warming. Proc. Natl. Acad. Sci. USA 2004, 101, 9971–9975. [Google Scholar] [CrossRef] [PubMed] [Green Version]
  5. Wade, L.J.; McLaren, C.G.; Quintana, L.; Harnpichitvitaya, D.; Rajatasereekul, S.; Sarawgi, A.K.; Kumar, A.; Ahmed, H.U.; Sarwoto; Singh, A.K.; et al. Genotype by environment interactions across diverse rainfed lowland rice environments. Field Crops Res. 1999, 64, 35–50. [Google Scholar] [CrossRef]
  6. Balakrishnan, D.; Subrahmanyam, D.; Badri, J.; Raju, A.K.; Rao, Y.V.; Beerelli, K.; Mesapogu, S.; Surapaneni, M.; Ponnuswamy, R.; Padmavathi, G.; et al. Genotype × Environment Interactions of Yield Traits in Backcross Introgression Lines Derived from Oryza sativa cv. Swarna/Oryza nivara. Front. Plant Sci. 2016, 7, 1530. [Google Scholar] [CrossRef] [Green Version]
  7. Acuña, T.L.B.; Lafitte, H.R.; Wade, L.J. Genotype×environment interactions for grain yield of upland rice backcross lines in diverse hydrological environments. Field Crops Res. 2008, 108, 117–125. [Google Scholar] [CrossRef]
  8. Samonte, S.O.P.; Wilson, L.T.; McClung, A.M.; Medley, J.C. Targeting Cultivars onto Rice Growing Environments Using AMMI and SREG GGE Biplot Analyses. Crop Sci. 2005, 45, 2414–2424. [Google Scholar] [CrossRef] [Green Version]
  9. Olivoto, T.; Lúcio, A.D.C.; da Silva, J.A.G.; Sari, B.G.; Diel, M.I. Mean Performance and Stability in Multi-Environment Trials II: Selection Based on Multiple Traits. Agron. J. 2019, 111, 2961–2969. [Google Scholar] [CrossRef]
  10. Kempton, R.A.; Fox, P.N.; Cerezo, M. Statistical Methods for Plant Variety Evaluation; Springer Science & Business Media: Berlin, Germany, 2012; ISBN 978-94-009-1503-9. [Google Scholar]
  11. Gauch, H.G.; Piepho, H.-P.; Annicchiarico, P. Statistical Analysis of Yield Trials by AMMI and GGE: Further Considerations. Crop Sci. 2008, 48, 866–889. [Google Scholar] [CrossRef]
  12. Yan, W. Analysis and Handling of G × E in a Practical Breeding Program. Crop Sci. 2016, 56, 2106–2118. [Google Scholar] [CrossRef]
  13. Xu, L.; Yuan, S.; Man, J. Changes in rice yield and yield stability in China during the past six decades. J. Sci. Food Agric. 2020, 100, 3560–3569. [Google Scholar] [CrossRef]
  14. Yan, W.; Hunt, L.A.; Sheng, Q.; Szlavnics, Z. Cultivar Evaluation and Mega-Environment Investigation Based on the GGE Biplot. Crop Sci. 2000, 40, 597–605. [Google Scholar] [CrossRef]
  15. Olivoto, T.; Lúcio, A.D.C.; da Silva, J.A.G.; Marchioro, V.S.; de Souza, V.Q.; Jost, E. Mean Performance and Stability in Multi-Environment Trials I: Combining Features of AMMI and BLUP Techniques. Agron. J. 2019, 111, 2949–2960. [Google Scholar] [CrossRef]
  16. International Rice Research Institute. Standard Evaluation System for Rice; International Rice Research Institute: Manila, Philippines, 1996. [Google Scholar]
  17. R Core Team. R: A Language and Environment for Statistical Computing; R Foundation for Statistical Computing: Vienna, Austria, 2013. [Google Scholar]
  18. Mendiburu, F.D. Agricolae: Statistical Procedures for Agricultural Research. R Package Version 1.3-3. 2020. Available online: https://www.cran.r-project.org/web/packages/agricolae/index.html (accessed on 7 January 2021).
  19. Yan, W.; Kang, M.S.; Kang, M.S. GGE Biplot Analysis: A Graphical Tool for Breeders, Geneticists, and Agronomists; CRC Press: Boca Raton, FL, USA, 2002; ISBN 978-0-429-12272-9. [Google Scholar]
  20. Olivoto, T.; Lúcio, A.D. Metan: An R package for multi-environment trial analysis. Methods Ecol. Evol. 2020, 11, 783–789. [Google Scholar] [CrossRef]
  21. Rosseel, Y. Lavaan: An R Package for Structural Equation Modeling. J. Stat. Softw. 2012, 48, 1–36. [Google Scholar] [CrossRef] [Green Version]
  22. Yan, W.; Tinker, N.A. Biplot analysis of multi-environment trial data: Principles and applications. Can. J. Plant Sci. 2006, 86, 623–645. [Google Scholar] [CrossRef] [Green Version]
  23. Yan, W.; Kang, M.S.; Ma, B.; Woods, S.; Cornelius, P.L. GGE Biplot vs. AMMI Analysis of Genotype-by-Environment Data. Crop Sci. 2007, 47, 643–653. [Google Scholar] [CrossRef]
  24. Sultan, S.E. Phenotypic plasticity for plant development, function and life history. Trends Plant Sci. 2000, 5, 537–542. [Google Scholar] [CrossRef]
  25. Dingkuhn, M.; Luquet, D.; Quilot, B.; de Reffye, P. Environmental and genetic control of morphogenesis in crops: Towards models simulating phenotypic plasticity. Aust. J. Agric. Res. 2005, 56, 1289–1302. [Google Scholar] [CrossRef]
  26. Morishima, H.; Oka, H.-I. Phylogenetic Differentiation of Cultivated Rice, XXII. Numerical Evaluation of the Indica-Japonica Differentiation. Jpn. J. Breed. 1981, 31, 402–413. [Google Scholar] [CrossRef] [Green Version]
  27. Glaszmann, J.C. Isozymes and classification of Asian rice varieties. Theor. Appl. Genet. 1987, 74, 21–30. [Google Scholar] [CrossRef] [PubMed]
  28. Jing, Q.; Spiertz, J.H.J.; Hengsdijk, H.; van Keulen, H.; Cao, W.; Dai, T. Adaptation and performance of rice genotypes in tropical and subtropical environments. NJAS-Wagening. J. Life Sci. 2010, 57, 149–157. [Google Scholar] [CrossRef] [Green Version]
  29. Bocianowski, J.; Niemann, J.; Nowosad, K. Genotype-by-environment interaction for seed quality traits in interspecific cross-derived Brassica lines using additive main effects and multiplicative interaction model. Euphytica 2018, 215, 7. [Google Scholar] [CrossRef] [Green Version]
  30. Ajay, B.C.; Bera, S.K.; Singh, A.L.; Kumar, N.; Gangadhar, K.; Kona, P. Evaluation of Genotype × Environment Interaction and Yield Stability Analysis in Peanut Under Phosphorus Stress Condition Using Stability Parameters of AMMI Model. Agric. Res. 2020, 9, 477–486. [Google Scholar] [CrossRef]
  31. Lozada, D.; Carter, A. Insights into the Genetic Architecture of Phenotypic Stability Traits in Winter Wheat. Agronomy 2020, 10, 368. [Google Scholar] [CrossRef] [Green Version]
  32. Quddus, M.R.; Rahman, M.A.; Jahan, N.; Debsharma, S.K.; Disha, R.F.; Hasan, M.M.; Aditya, T.L.; Iftekharuddaula, K.M.; Collard, B.C.Y. Estimating Pedigree-Based Breeding Values and Stability Parameters of Elite Rice Breeding Lines for Yield under Salt Stress during the Boro Season in Bangladesh. Plant Breed. Biotechnol. 2019, 7, 257–271. [Google Scholar] [CrossRef]
Figure 1. Variation of yield-component traits and grain yield (GY) in different environments. (a) Plant materials used in multiple environment trials. The length of bars indicate the percent of origin or subspecies of plant materials. (b) Locations of experimental cultivation fields: Suwon, temperate; Shanghai, subtropical; and Los Baños, tropical. (c) Comparisons of yield-component traits and grain yield (GY) performance among six environments (three locations over two years). Box plots with different lowercase letters indicate statistically significant differences (one-way analysis of variance (ANOVA) followed by Scheffe’s post hoc test; p < 0.05).
Agriculture 11 00558 g001
Figure 2. Discrimination and representativeness view of the genotypic main effects plus genotype by environment interaction (GGE) biplots based on yield-component traits and grain yield data of 89 genotypes in six environments. Red diamonds represent individual trials as location-year combinations. IR, IRRI, Los Baños; SH, Shanghai; SW, Suwon. Suffixes 10, 11, and 12 indicate trials in 2010, 2011, and 2012, respectively. The average environment for each plot is indicated with a red arrow. The average-environment axis (AEA) is indicated with a thick red line passing through the biplot origin and the average environment arrow. Blue circles show individual genotypes. PL, panicle length; PN, panicle number; SN, spikelet number per panicle; TGW, thousand-grain weight; GY, grain yield.
Agriculture 11 00558 g002
Figure 3. Polygon view of GGE biplot for ‘which-won-where’ analysis based on the yield-component traits and grain yield data of 89 genotypes in six environments. Green diamonds represent individual trials as location-year combinations. IR, IRRI, Los Baños; SH, Shanghai; SW, Suwon. Suffixes 10, 11, and 12 indicate trials in 2010, 2011, and 2012, respectively. Small and large red circles show individual genotypes and the genotype with highest performance, respectively. PL, panicle length; PN, panicle number; SN, spikelet number per panicle; TGW, thousand-grain weight; GY, grain yield.
Agriculture 11 00558 g003
Figure 4. Genotype comparison to an ideal genotype using an average environment coordinate (AEC) view of GGE plot. The ideal genotype is indicated by a red arrow surrounded by concentric circles. Red circles represent individual genotypes. Gray diamonds represent individual trials as location-year combinations. IR, IRRI, Los Baños; SH, Shanghai; SW, Suwon. Suffixes 10, 11, and 12 indicate trials in 2010, 2011, and 2012, respectively. PL, panicle length; PN, panicle number; SN, spikelet number per panicle; TGW, thousand-grain weight.
Agriculture 11 00558 g004
Figure 5. Grain yield performance and stability across all environments. (a) Rank of 89 genotypes according to different weightings of stability and grain yield performance. The order of the genotype codes in each group corresponds to the order of the heatmap (top-to-bottom). (b) Path analyses between yield-related traits and grain yield. Numerical values show standardized path coefficients, and line thickness represents the strength of the direct effect. Individual trials are shown as location-year combinations. IR, IRRI, Los Baños; SH, Shanghai; SW, Suwon. Suffixes 10, 11, and 12 indicate trials in 2010, 2011, and 2012, respectively. PL, panicle length; PN, panicle number; SN, spikelet number per panicle; TGW, thousand-grain weight; GY, grain yield.
Agriculture 11 00558 g005
Table 1. Combined analysis of variance (ANOVA) of yield-component traits and grain yield.
SourceDfPLPNSNTGWGY
MSESS (%)MSESS (%)MSESS (%)MSESS (%)MSESS (%)
E5 692.9
***
23.6 4114.3
***
69.6 212,686.3
***
35.8 613.1
***
34.8 151,970.4
***
16.5
Rep (E)6 5.4
**
0.2 9.9
*
0.2 1459
***
0.3 8.5
***
0.6 955.7
ns
0.1
G88 88.1
***
52.9 32.7
***
9.7 13,729.7
***
40.6 34.0
***
33.9 18,606.4
***
35.6
GEI440 6.0
***
18.1 8.4
***
12.4 1210.5
***
17.9 3.9
***
19.6 3881.8
***
37.1
Residuals528 1.4 5.2 4.5 8.0 302.3 5.4 1.9 11.1 925.8 10.6
PL, panicle length; PN, panicle number; SN, spikelet number per panicle; TGW, thousand-grain weight; GY, grain yield; E, environment; Rep, replication; G, genotype; GEI, Genotype × environment interaction; Df, degrees of freedom; MS, mean square; ESS (%), proportion of explained sum of squares. *, p  < 0.05; **, p  <  0.01; ***, p  <  0.001; ns, not significant.
Publisher’s Note: MDPI stays neutral with regard to jurisdictional claims in published maps and institutional affiliations.

