Article

Genetic Variability, Correlation among Agronomic Traits, and Genetic Progress in a Sugarcane Diversity Panel

by
Fernanda Zatti Barreto
1,
Thiago Willian Almeida Balsalobre
1,
Roberto Giacomini Chapola
1,
Antonio Augusto Franco Garcia
2,
Anete Pereira Souza
3,4,
Hermann Paulo Hoffmann
1,
Rodrigo Gazaffi
1 and
Monalisa Sampaio Carneiro
1,*
1
Centro de Ciências Agrárias, Departamento de Biotecnologia e Produção Vegetal e Animal, Universidade Federal de São Carlos, Araras CEP 13604-900, São Paulo, Brazil
2
Departamento de Genética, Escola Superior de Agricultura Luiz de Queiroz, Universidade de São Paulo, Piracicaba CEP 13418-260, São Paulo, Brazil
3
Departamento de Biologia Vegetal, Instituto de Biologia, Universidade Estadual de Campinas, Campinas CEP 13083-862, São Paulo, Brazil
4
Centro de Biologia Molecular e Engenharia Genética, Universidade Estadual de Campinas, Campinas CEP 13083-862, São Paulo, Brazil
*
Author to whom correspondence should be addressed.
Agriculture 2021, 11(6), 533; https://doi.org/10.3390/agriculture11060533
Submission received: 12 May 2021 / Revised: 2 June 2021 / Accepted: 2 June 2021 / Published: 9 June 2021
(This article belongs to the Special Issue Crop Breeding and Genetics)

Abstract

:
Sugarcane breeding programs require 15 years of experimentation to create more productive cultivars, and estimates of genetic progress can indicate the efficiency of breeding programs. In this study, we used a diversity panel, the Brazilian Panel of Sugarcane Genotypes (BPSG), with the following objectives: (i) to estimate, through a mixed model, the adjusted means and genetic parameters of ten traits evaluated over three harvest years; (ii) to estimate genotypic correlation among those traits; and (iii) to estimate genetic progress over six decades of breeding. The heritabilities ranged from 0.43 to 0.88, and we detected 42 significant correlations, 9 negative and 33 positive. Over six decades, the sucrose-related traits BRIX, POL%C, and POL%J showed an average increase per decade of 0.27 °Brix, 0.26% and 0.31%, respectively. Stalk number, height, and weight of the plot, and cane and sucrose yields revealed average increases per decade of 3.27 stalks, 0.06 m, 9.42 kg, 11.22 t/ha, and 2.08 t/ha, respectively. The genetic progress of the main agronomic traits is discussed through a historical series of sugarcane genotypes present in the BPSG. The findings of this study could contribute to the management of new breeding strategies and allow for future studies of associative mapping.

1. Introduction

Brazil is the world’s largest producer of sugarcane, with 720 million tons, which corresponds to 40% of the total cultivation worldwide. It is a versatile raw material used for sugar, ethanol, and bioenergy production [1,2]. Sugarcane is cultivated predominantly in the central-south region, hundreds of kilometers away from the Amazon rainforest edges [3,4]. In 2019, sugarcane accounted for 18% of the country’s energy matrix [5].
Modern sugarcane cultivars are polyploids with variable levels of ploidy, frequent aneuploidy, large genome size of approximately 10 Gb, and gene duplication events [6,7,8,9]. Presently, modern sugarcane cultivars originate from the Saccharum complex, which consists of six Saccharum species (S. spontaneum, S. robustusm, S. officinarum, S. sinense, S. barberi, and S. edule) and four related interbreeding genera (Erianthus, Miscanthus, Narenga, and Sclerostachya) [10]. S. officinarum (2n = 80) and S. spontaneum (2n = 40–128) were used for the first hybridizations, searching for high sucrose content from the first species, hardiness, ratooning ability, and disease resistance from the second species. Subsequently, successive backcrosses with S. officinarum were performed to recover sucrose content [11,12]. Studies of sequences of hom(oe)ologous haplotypes (BAC clones) from typical modern cultivars suggested the existence of three founding genomes (A, B, C) in modern cultivars. Two genomes (A and B) were contributions from S. officinarum, and one genome (C) was contributed by S. spontaneum [13].
Faced with an immense genetic challenge, sugarcane breeding programs worldwide have been able to increase cane yield in the last decades [14,15]. In Brazil, breeding programs have developed more productive cultivars, with greater adaptability to different production environments, resistance to the main diseases, and varied maturation profiles. This effort resulted in the expansion of harvesting throughout the year (from March to November in the central-south), the use of marginal agricultural areas, and adaptation of sugarcane to mechanized harvesting [3,4,16]. However, sugar yield has increased more slowly in recent years [15,17]. In addition, the viability of ethanol production from lignocellulosic waste has been demonstrated [18,19], opening new frontiers for research on genetic profiles that increase productivity in the field and facilitate microorganism access to sugars in the cell wall [20,21].
The performance of any breeding program must be periodically critically analyzed to develop better methods for increased effectiveness [22,23]. An assessment of genetic progress due to plant breeding within a specific period not only shows the benefit of breeding efforts but also provides a means to understand the phenotypic changes associated with this improvement [24]. In sugarcane breeding, this overview of genetic progress achieved between varieties over the decades is crucial because the process of obtaining a new variety is time-consuming (10–15 years) and expensive. Moreover, the maintenance and characterization of germplasm banks are fundamental for breeding strategies and, consequently, yield maximization for traits of commercial interest [25]. Core collections of any crop require accurate phenotypic characterization, for future general and specific combining ability estimates [26] to identify heterotic pools, as well as associative mapping studies to identify favorable alleles and assist breeders in better managing crosses [27,28,29,30]. Genetic components, the environment, and the relationship between the traits of interest are essential for developing breeding strategies [31]. Genetic variance in crop traits is most commonly studied, as reflected in the high rate of scientific and technological progress in plant breeding [32,33]. The mixed models approach is suitable for evaluating the heterogeneity of genetic variances and correlations [34] and is becoming increasingly popular in plant breeding, particularly in research involving the prediction of breeding values combined with genomic data [28,35,36,37].
Hence, to aid breeders in enhancing genetic gain in sugarcane, this study was conducted to (i) estimate, through a mixed model, the adjusted means and genetic parameters of ten traits evaluated over three harvest years in a diversity panel composed of ancestor and modern sugarcane accessions; (ii) estimate genotypic correlation among traits, and (iii) estimate genetic progress over six decades with Brazilian breeding. We discussed these results in the context of genetic progress in relation to improving Brazilian sugarcane. In addition, we argued that phenotypic characterization is primary for advances in breeding strategies for this crop.

2. Materials and Methods

2.1. Plant Material

In this study, 242 accessions (Table S1) of the Brazilian Panel of Sugarcane Genotypes (BPSG) were used. BPSG is the core collection from the germplasm bank of the Interuniversity Network for the Development of Sugarcane Industry (RIDESA) and consists of 86 ancestors accessions (A) (80 accessions from Saccharum spp. and six from Erianthus spp.), 129 hybrids from Brazilian breeding programs (BB), and 27 hybrids from foreign breeding programs, foreign hybrids (FH) [29]. Breeding hybrids (BB and FH) originated from 11 countries that grow sugarcane (Brazil, Australia, United States, India, Argentina, Bolivia, Reunion, Java, Taiwan, South Africa, and the Dominican Republic) (Table S1). The BPSG accessions chosen were according to the following criteria: (i) relevant Brazilian cultivars, (ii) the main parents for Brazilian breeding programs, (iii) cultivars from countries that grow sugarcane, (iv) parents used in mapping programs [38,39], and (v) representatives of the species from which the Saccharum complex originated. The genetic variability present in BPSG, for the most part, was the genetic basis for Brazilian sugarcane breeding programs.

2.2. Experimental Design and Phenotypic Data

The accessions of BPSG were planted in a field experiment performed in 2013 at the Agricultural Science Center of the Federal University of São Carlos (UFSCar) in Araras City, São Paulo State, Brazil. Araras is located at 22°21′25″ S, 47°23′3″ W, at an altitude of 611 m. The soil in the experimental area is Typic Eutroferric Red Latosol. Planting was performed using pre-sprouted seedlings. The experimental design consisted of a randomized complete block, replicated four times. The plots consisted of two rows 3 m long spaced 1.5 m apart. The distance between the rows was 0.5 m. The BPSG was evaluated for ten yield components: stalk height (SH, in m), stalk diameter (SD, in mm), stalk number (SN), stalk weight of the plot (SW, in kg), soluble solid content (BRIX, in °Brix), sucrose content of cane (POL%C, in %), sucrose content of juice (POL%J, in %), fiber content (FIB, in %), cane yield (TCH, in t/ha), and sucrose yield (TPH, in t/ha). Phenotypic yield data were collected according to Consecana [40] and Balsalobre et al. [31] over three harvest years: plant cane (2014), first ratoon (2015), and second ratoon (2016). Briefly, a 10-stalk sample per plot was taken for the analysis of the SH, SD, BRIX, POL%C, and POL%J. The weight of the 10 stalks was added to the total weight of the plot (SW) to estimate the TCH, which was calculated as the product of the SW of a linear meter and the amount of linear meters in one hectare (6667 linear meters compose one hectare with a spacing of 1.5 m). The SN was estimated by directly counting the stalks in each plot. The TPH was estimated from the product of TCH and POL%C divided by 100.

2.3. Statistical Analysis of Phenotypic Data

The statistical model for data analysis was based on Piepho et al. [41] and Barreto et al. [28]. Briefly, the analysis was conducted for each trait using the GenStat 19th edition [42] based on restricted maximum likelihood (REML) and the following linear mixed model:
y i m k u v = μ + h m + b k m + g i m k + r u m k + c v m k + e i m k u v
where y i m k u v is the phenotype of the i t h accession, evaluated at the m t h harvest, located in the u t h row and the v t h column inside the k t h replication; μ is the overall mean; h m is the fixed effect of the m t h harvest ( M = 1 ,   ,   M ; M = 3 ); b k m is the fixed effect of the k th replication ( k = 1 ,   ,   K ; K = 4 ) at the m t h harvest; g i m k is the random effect of the i th accession ( i = 1 ,   ,   I ,   I = 242 ) at the m t h harvest evaluated in the k t h replication; r u m k and c v m k are the random effects of the u t h row and v t h column, both evaluated at the m t h harvest and k t h replication; and e i m k u v is the random residual error. In addition, for the SN, SW, and TCH traits, the number of clumps per plot was included in the mixed model as a fixed covariate. To model the accession effects, the genetic variance–covariance (VCOV) matrix G =   G M   I I g , i.e., g   ~   N ( 0 ,   G ) was considered, where M is the number of harvests, and ⊗ represents the Kronecker product of both the genetic G M and identity I I g matrices with the respective dimensions of 2 × 2 and 1 × 242 . For the G M matrix, four structures (identity, ID; diagonal, DIAG; first-order autoregressive homogenous, AR1; and first-order autoregressive heterogeneous, AR1(het)) were examined and compared using Akaike (AIC; [43]) and Bayesian (BIC; [44]) information criteria [45]. For the residual, a structure of variance heterogeneity was assumed for the different harvests. For each trait, the fixed effects were tested using the Wald statistics test and were retained in the model if statistically significant ( p < 0.05 ). After the G M matrix structure selection, the adjusted means for accessions and genetic parameters for each evaluated trait were obtained. The phenotypic ( σ ^ P 2 ) and genotypic ( σ ^ g 2 ) variances were used to calculate heritability in the broad sense on an individual-plant basis ( H ^ 2 = σ ^ g 2 /   σ ^ P 2 ). The σ ^ P 2 value is determined from σ ^ P 2 = σ ^ g 2 + σ ^ e 2 + σ ^ r 2 + σ ^ c 2 , where σ ^ e 2 is the residual variance, σ ^ r 2 is the variance for row effects and σ ^ c 2 is the variance for column effects [46].
Using genotypic adjusted means and the ggplot2 package [47] in software R [48], the following analyses were performed: (i) testing of genotypic correlations between traits using Pearson’s correlation coefficient assuming a global significance level α = 0.05 , using the GGally extension and ggpairs function; (ii) biplot analysis using the ggbiplot function; and (iii) boxplots using the ggplot function to verify data variation within the ancestor germplasm (set A), foreign breeding germplasm (set F), and Brazilian breeding germplasm (set B). This last set of accessions was divided into subsets B1, B2, B3, B4, B5, and B6, which were composed of accessions originating from crossings made from 1940–1951, 1952–1961, 1962–1971, 1972–1981, 1982–1991, and 1992–2001, respectively. In addition, linear regression was performed for each trait, using the lm function to estimate possible genetic gain rates per decade of breeding. The multiple R-squared was the coefficient of determination. Genetic progress (GP (%)) over time was estimated for each trait using linear coefficients (b1—slope and b0—intercept) by the formula G P = [ ( b 1 / b 0 ) × 100 ] / 2, as performed by [22].

3. Results

3.1. VCOV Models, Variance Components, and Heritabilities

The VCOV AR1(het) model showed the lowest AIC and BIC values for all evaluated traits, except for POL%C and POL%J, which had an adjusted AR1 structure (Table S2). This result suggests a correlation between successive harvests for all evaluated traits and heterogeneous genetic variances between harvests for traits that had AR1(het) selected for the G M matrix. The results regarding the ranges, averages, estimates of the components of variance, residual and genetic coefficients of variation, and broad-sense heritability of the 10 traits evaluated in the BPSG on an individual-plant basis are summarized in Table 1. In general, the H ^ 2 of the traits was high for the first two harvests (above 0.60) and from medium to high for the third harvest (greater than 0.43). The H ^ 2 ranged from 0.64 (SH) to 0.88 (SN), from 0.72 (SW, TCH, and TPH) to 0.86 (POL%C), and from 0.43 (TPH) to 0.87 (BRIX) on the first, second, and third harvests, respectively. The coefficients of residual variation ( CV R ) between the three harvests were similar, except for certain traits in the third harvest: an increase of CV R for FIB and SN, and a decrease of CV R for SW, TCH, and TPH. Furthermore, the coefficients of genetic variation ( CV G ) were similar among the three harvests, except for the SW, TCH, and TPH traits, which showed a decrease in CV G in the third harvest. The CV G values indicated that there was high genetic variability in BPSG, since it showed values ranging from 11% (BRIX) to 53% (SN), 10% (BRIX) to 77% (SN), and 11% (BRIX) to 72% (SN), for the first, second, and third harvest years, respectively. Genetic variances ( σ ^ G 2 ) were higher than residual variances ( σ ^ R 2 ) for all traits, except in the third harvest for FIB, SW, TCH, and TPH. The ranges for the evaluated traits showed that the BPSG was composed of contrasting accessions. The values revealed that SN had the largest range of variation, and the superior extremity accession, SES205A, was approximately 45 times greater in the number of stalks per plot than the inferior extremity accession, FORMOSA. In contrast, BRIX had the least variation, and TUC71-7 was approximately twice as high as the value found for the IN84-73 accession, the inferior limit of the variation. The inferior and superior accessions of the range of variation for the other two sucrose content-related traits were IN84-77 and RB835486, and IN84-77 and SP80-1836 for POL%C and POL%J, respectively. The inferior and superior accessions for FIB, SH, and SD traits were CANA MANTEIGA and IJ76-318, IN84-106 and IN84-77, and SES205A and CANA MANTEIGA, respectively. The accessions NG21-17 and RB925268 were the inferior and superior accessions of the range of variation for SW, TCH, and TPH traits.

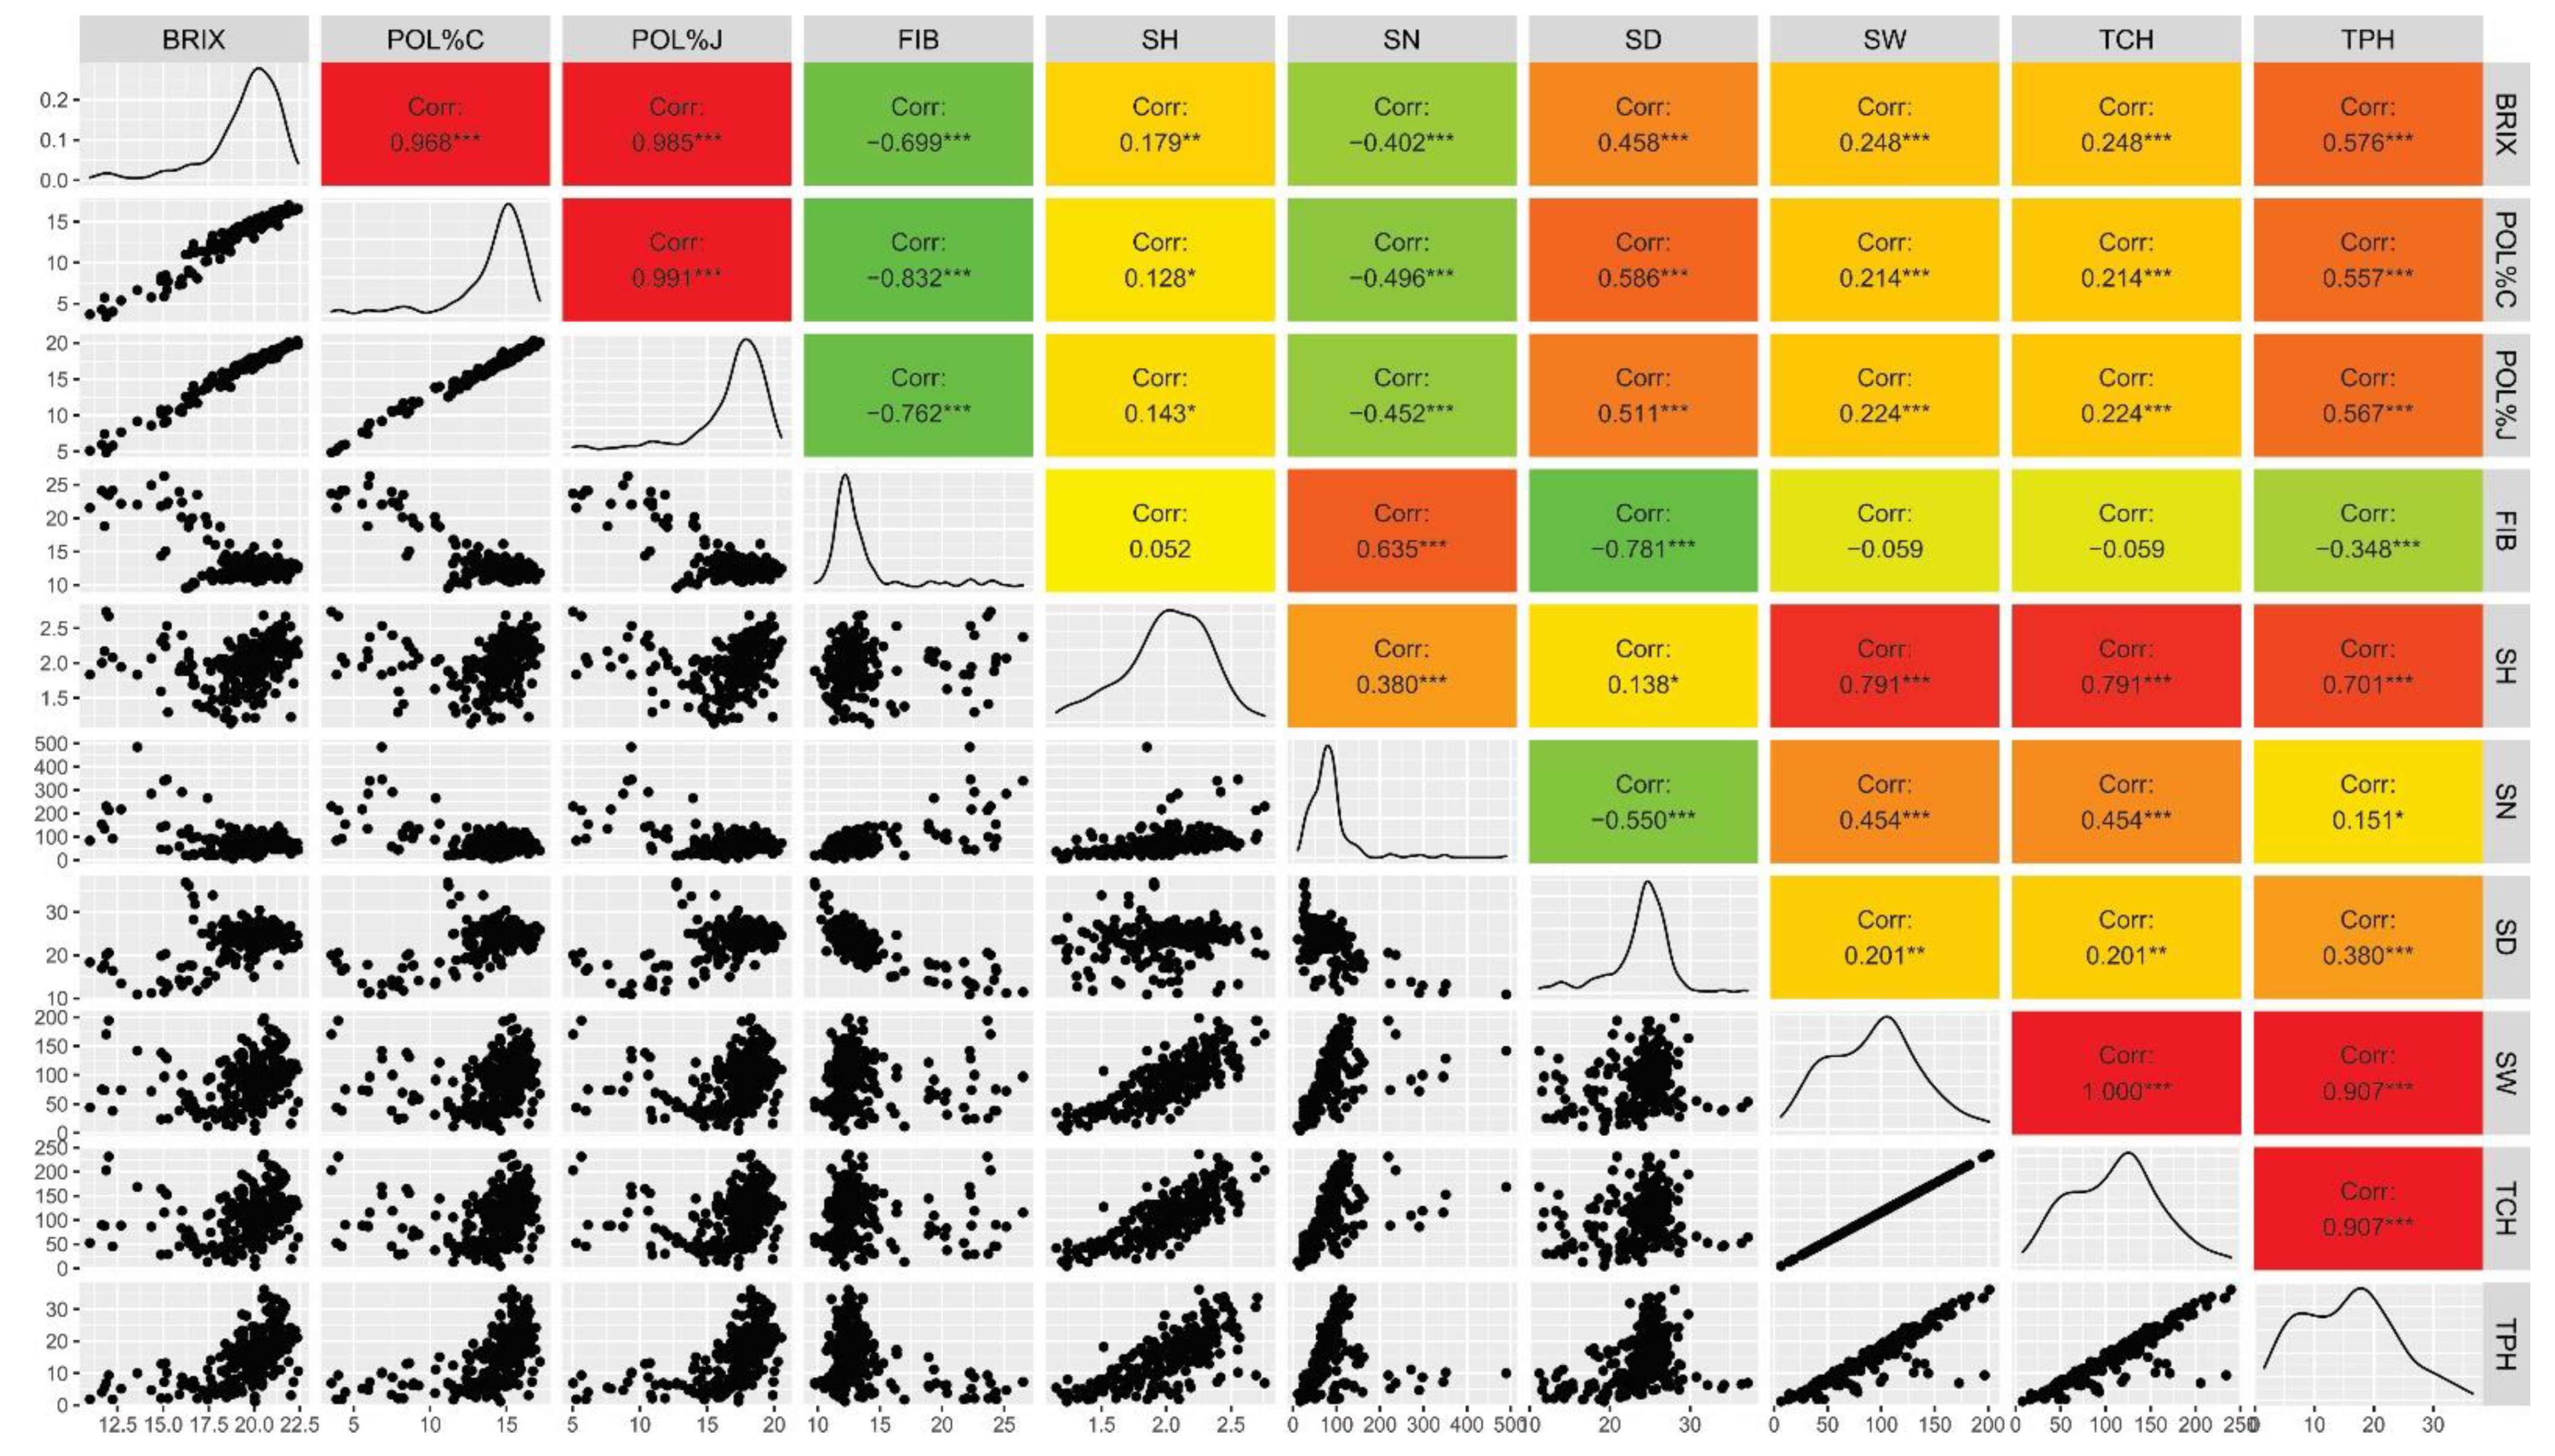
3.2. Genotypic Correlations

The correlations among the 10 traits evaluated in this study, considering three harvest years, are shown in Figure 1. A total of 42 significant correlations were found (p < 0.05), of which nine were negative and 33 were positive. They were grouped according to the value of correlation among traits: low (≤0.35), moderate (0.36–0.70), and strong (≥0.71) with 14, 17, and 11 correlations classified as low, moderate, and strong, respectively. The SN and FIB traits showed negative correlations with BRIX, POL%C, and POL%J, which are indirectly or directly related to sucrose content. In addition, SN showed a significant negative correlation with SD, while FIB was negatively correlated with SD and TPH. The highest correlations were between BRIX, POL%C, and POL%J traits, and between SW, TCH, and TPH.

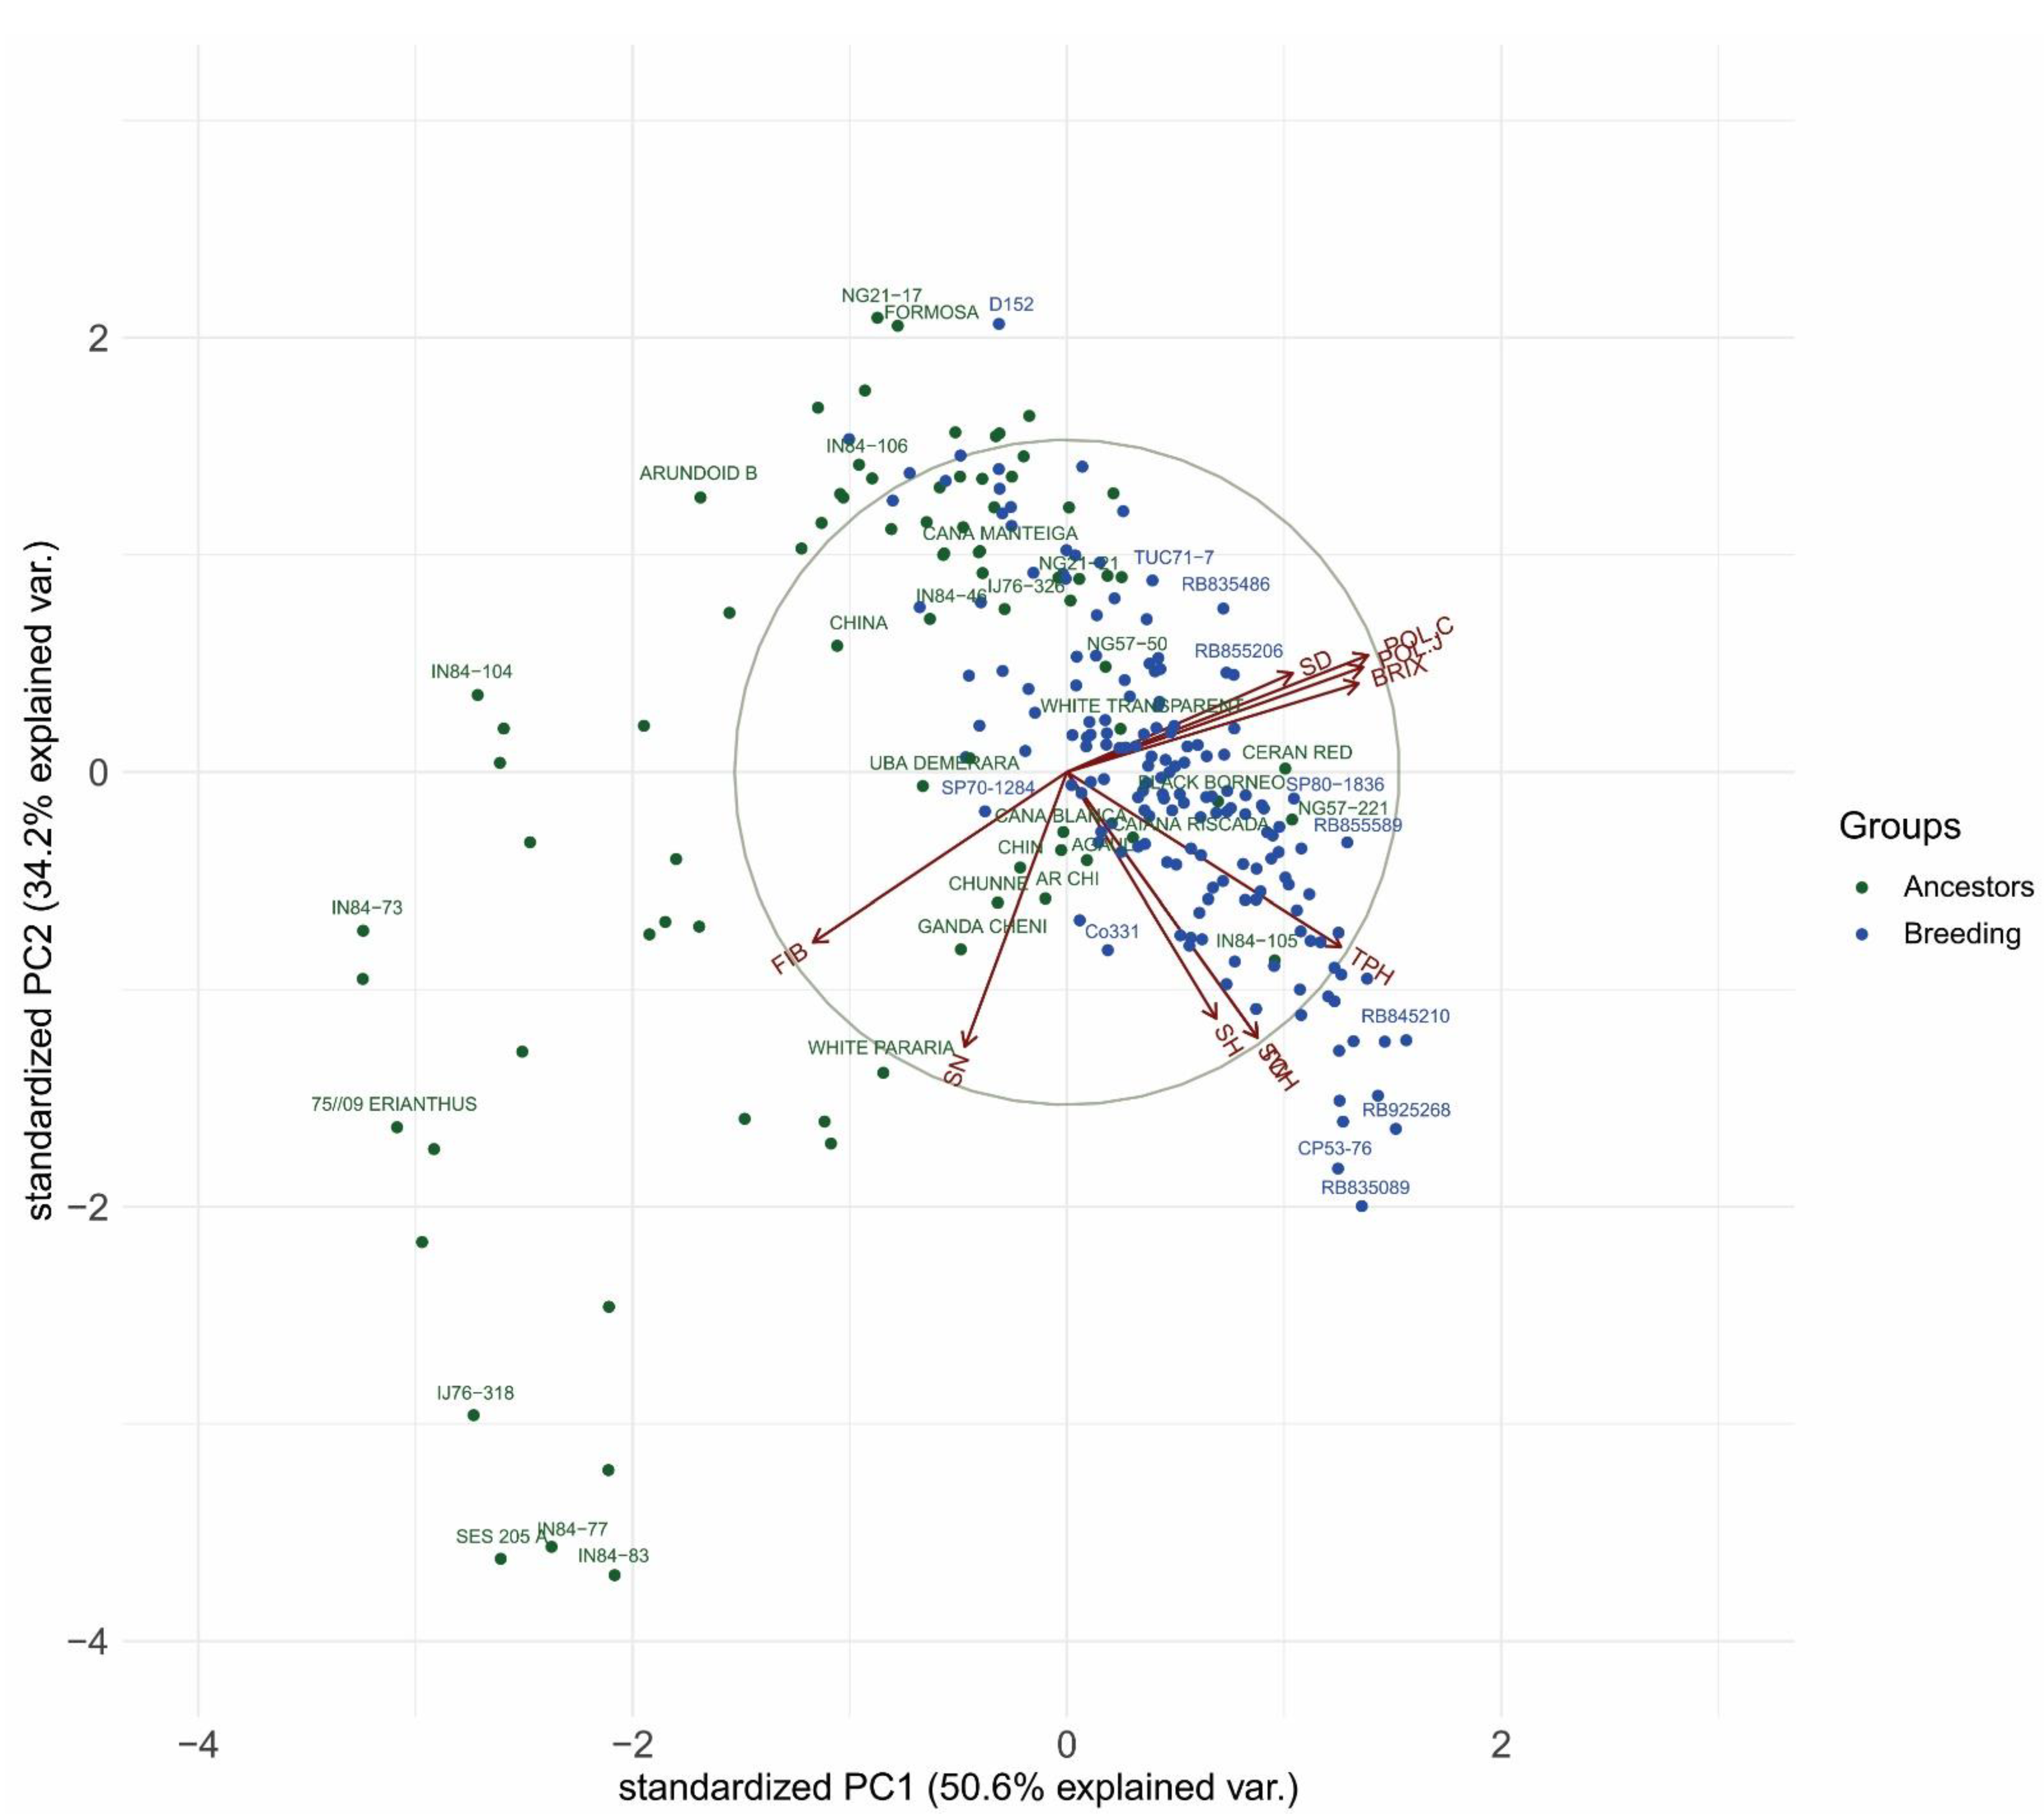
3.3. Biplot Analysis

The biplot analysis showed the distribution of accessions according to the adjusted means of the 10 evaluated traits. The first two principal components (PC1 and PC2) explained 84.80% of the total variability between accessions (Figure 2). Briefly, the first PC indicated a comparison between BRIX, POL%C, POL%J, SH, SD, SW, TCH, and TPH (positive PCA loadings) and FIB and SN (negative PCA loadings). The second PC indicated a comparison between BRIX, POL%C, POL%J, SD and FIB, SH, SN, SW, TCH, and TPH. This analysis revealed a feasible division of BPSG into two groups: (i) those composed of accessions from breeding programs, identified in the graph by blue color; and (ii) those composed of accession species, which gave rise to the Saccharum complex, identified in the graph as green. The most distant ancestors of the improved accessions showed low sucrose content and high fiber content. For example, the SES 205A (S. spontaneum), IN84-83 (Erianthus spp.), and IN84-77 (Erianthus spp.) accessions had adjusted averages for POL%C of 6.83, 3.98, and 3.54, respectively, and adjusted averages for FIB of 22.22, 23.64 and 23.89, respectively. Some ancestors that were located near the center of the graph and improved accessions were representatives of S. officinarum (BLACK BORNEO, CAIANA RISCADA, CANA BLANCA, CERAM RED, IJ76-326, IN84-46, IN84-105, NG21-21, NG57-221, and WHITE TRANSPARENT), S. sinense (AR CHI, AGAUL, CHINA, and UBA DEMERARA), S. barberi (CHIN, CHUNNEE, and GANDA CHENI), and a hybrid between S. officinarum and S. spontaneum (NG57-50). Furthermore, most of the improved accessions were positioned in the fourth quadrant of the graph to increase TPH, a trait that combines sucrose content and biomass production. This organization of accessions in the graph reflects the evolutionary and improvement history of sugarcane, i.e., the improved accessions have inherited and fixed favorable alleles from the ancestors for the traits of economic importance during the breeding process.

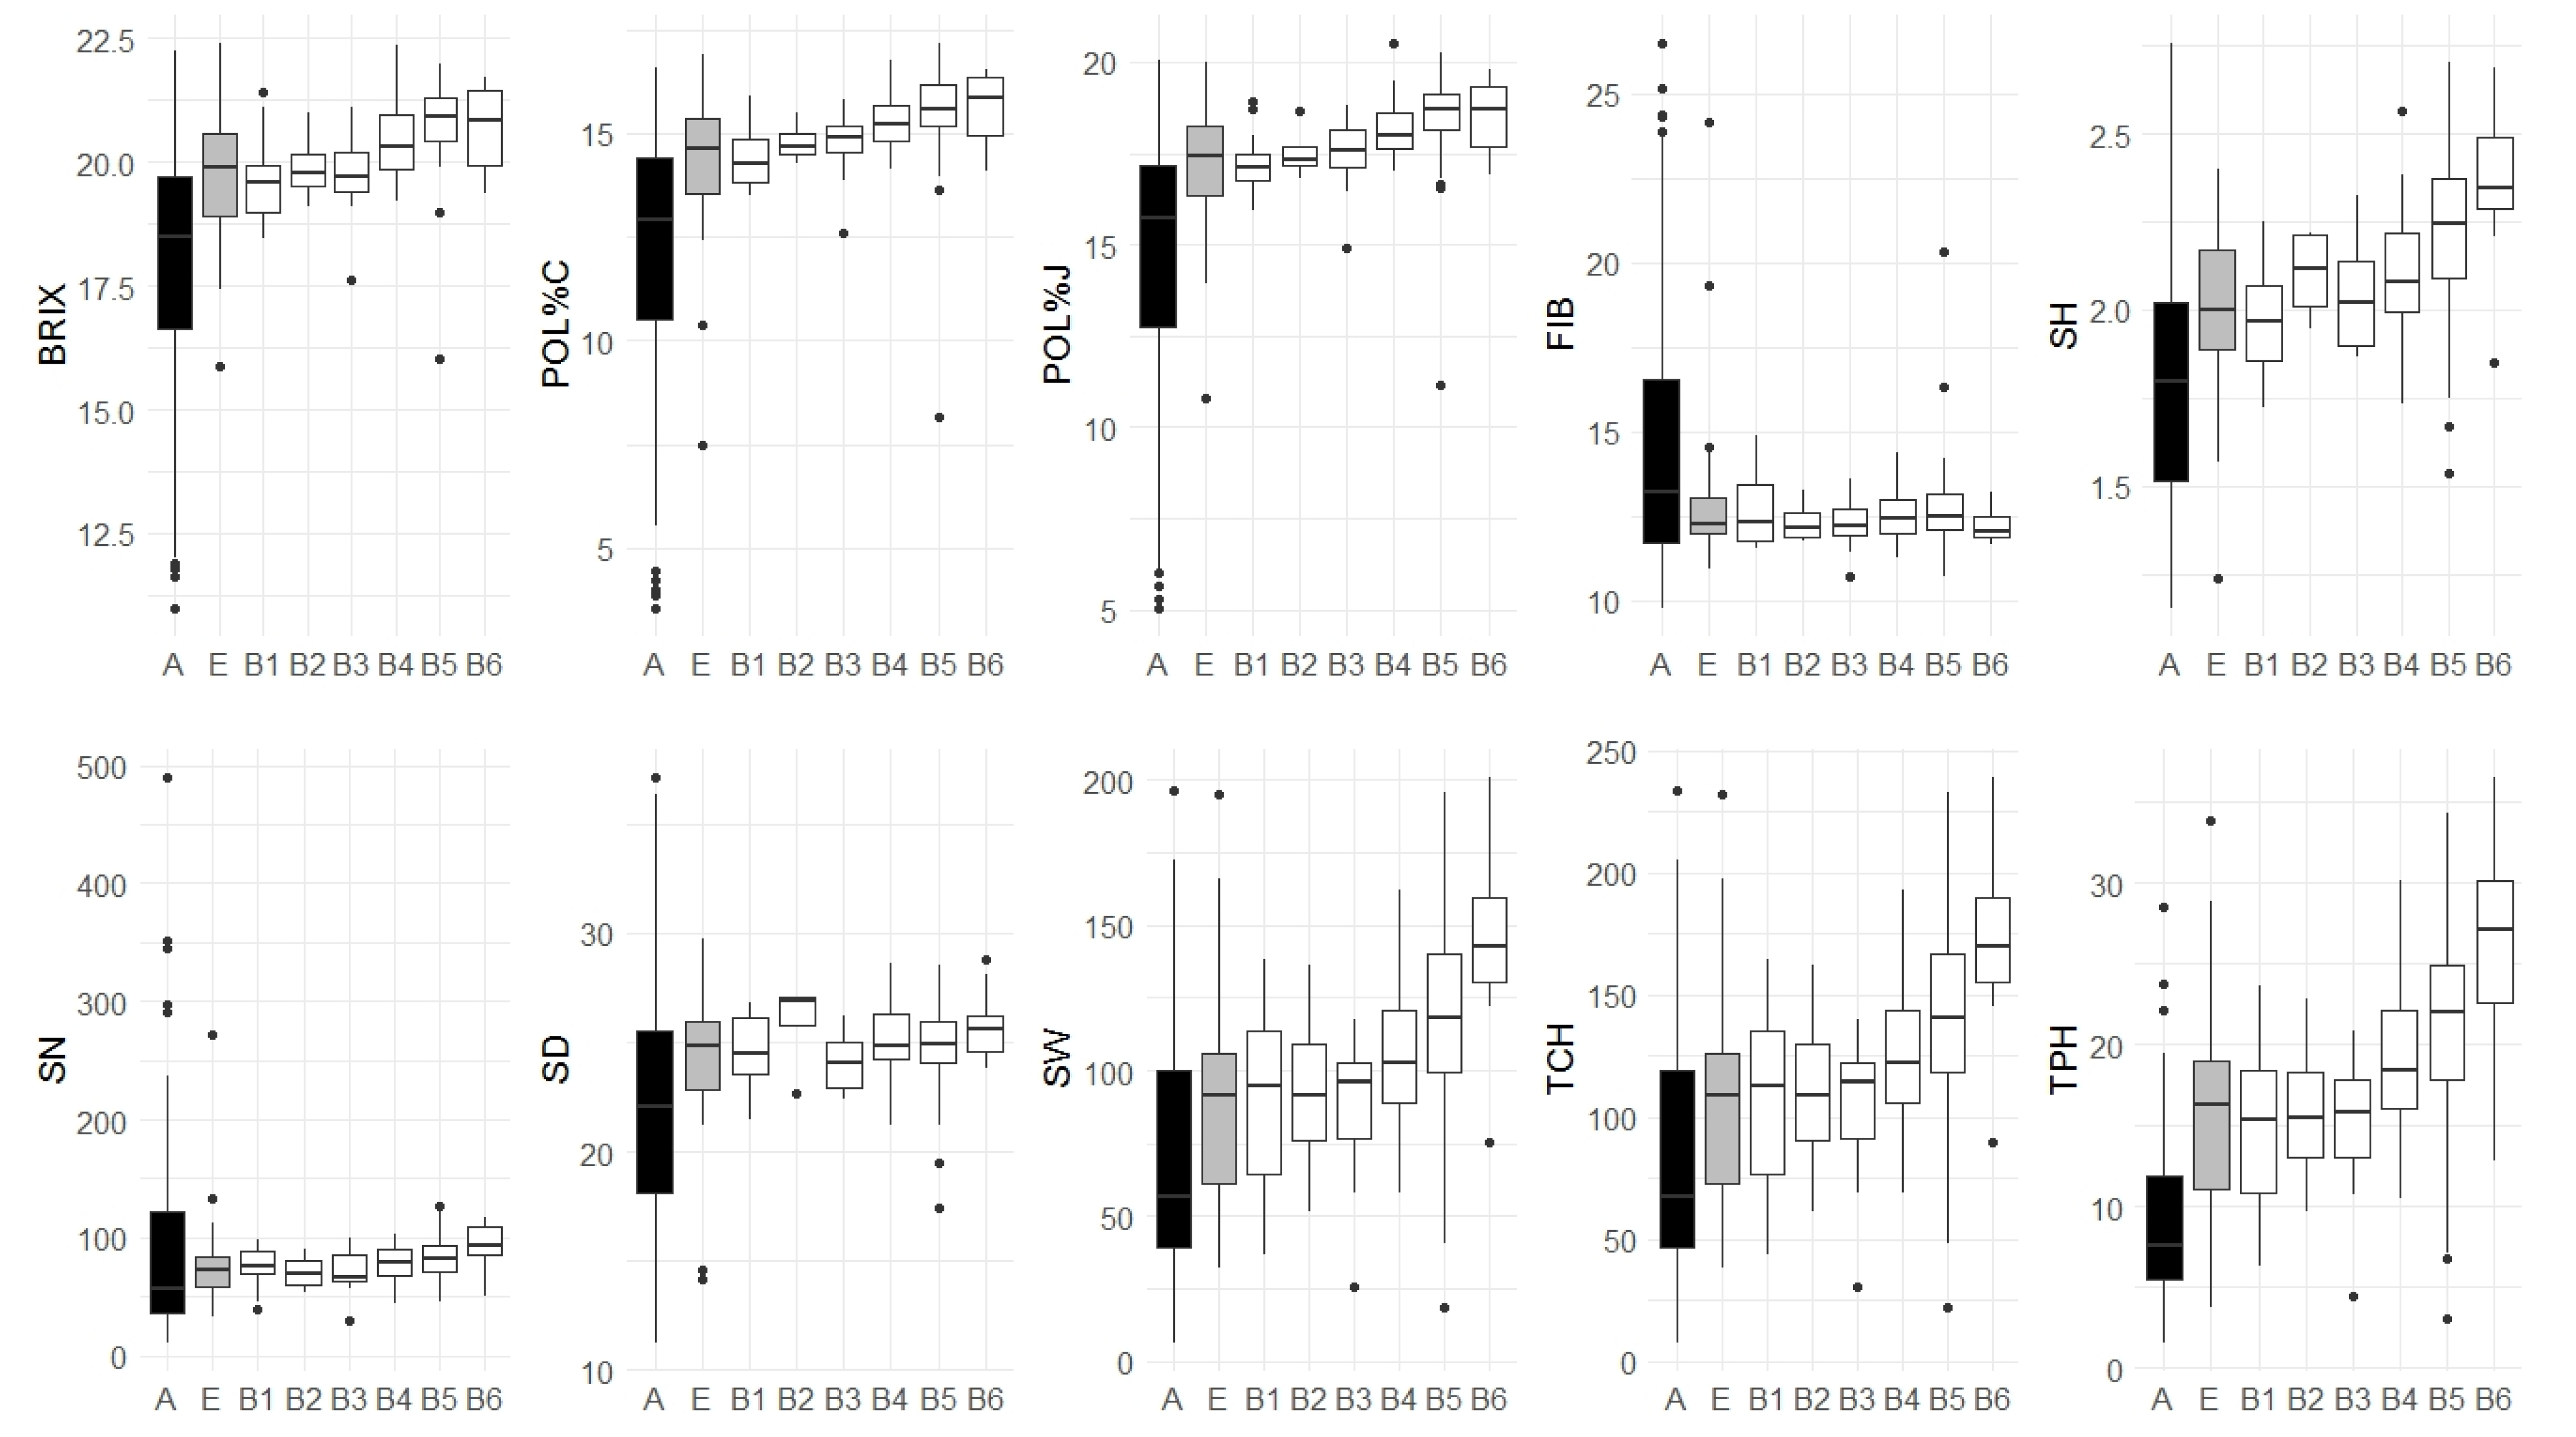
3.4. Association Panel Subsets

Figure 3 indicates the distribution of genotypic means considering the subset structures for all evaluated traits. Considering the boxplot ranges and medians, it is possible to compare the ancestor group (A) with the Brazilian breeding germplasm (from B1 to B6). In general, the boxplot range indicated a large variability from ancestors when compared with Brazilian subsets, except for TPH. This variability can be detailed, i.e., for FIB and SN the larger variation was an increase in the trait values; SD and SH indicated variability for both sides of selection; and sucrose-related traits (BRIX, POL%C, and POL%J) showed variability related to accessions with reduced sugar yield. The only ancestor group median that was greater than the B subsets was FIB, whereas for SN the values were approximately similar, and for the others, the median values were smaller than the B subsets.
The comparison of A and B subsets indicates the following: (i) the ancestor group has large genetic variability, which can be considered for some traits, such as biomass; (ii) the shrinkage found from subsets A to B is an indication of Brazilian breeding success due to the fixing of favorable alleles, e.g., sucrose-related traits have eliminated genotypes with low sucrose content over time; (iii) shrinkage found for FIB, SN, and SD indicated that these were not the primary target, but the average accession resulted in relevant behavior for both industry and agriculture; and (iv) SW indicated a lower shrinkage, but it was the trait with a high increase of median over B subsets, indicating the efficiency of breeding programs in pyramiding favorable alleles, which is also verified for TCH and TPH.
The foreign group (E subset) showed an intermediate pattern when compared with the ancestor and Brazilian accessions. Besides TPH, the range of the foreign group was less than that of the ancestor. For FIB, SN, and SD, the E subset rage was similar to the B subsets. The remaining traits showed the E subset as similar in B1, B2, and B3, but lower than the more recent groups (especially B5 and B6). This was evidenced for BRIX, POL%C, and POL%J, and most notably for SH, SW, TCH, and TPH.
Furthermore, from the medians and considering the entire period from B1 to B6, we can infer that the sucrose-related traits, BRIX, POL%C, and POL%J, revealed the largest increase in genetic gain from B3 (1962–1971) to B5 (1982–1991). The SN, SW, TCH, and TPH traits had the largest rise in genetic gain from B5 (1982–1991) to B6 (1992–2001), while for SH it was from B4 (1972–1981) to B5 (1982–1991).
By studying the composition of the Brazilian germplasm, a temporal structure could be recognized, allowing us to study the genetic progress during this period. For simplicity, we modeled a linear regression, the results of which are shown in Table 2. Besides FIB and SD, the linear models were significant (p-value < 0.05). The significant R2 varied from 6.80% (SD) to 21.15% (TPH). Sucrose-related traits (BRIX, POL%C, and POL%J) showed similar patterns. However, assuming the traits were evaluated at different measurement scales, the variances and slopes were not directly comparable. This can be illustrated by, for example, SD (millimeters) not being significant (p-value = 0.27) with a slope of 0.11, whereas SH (m) was significant (p-value = 1.24 × 10⁻⁷) with a lower slope (0.06). To adjust for this, we calculated the genetic progress (GP (%)), which is a non-dimensional value. The highest significant GP (%) was observed for TCH (9.12%), followed by TPH (6.54%), SW (6.53%), SN (2.54%), SH (1.60%), POL%C, POL%J (0.92% for both), and BRIX (0.69%). The lowest GP% was found for FIB (0.04%) and SD (0.23%).
Moreover, according to the linear regression, the slope of BRIX, POL%C, and POL%J traits showed an average increasing trend per decade of 0.27 °Brix, 0.26%, and 0.31%, respectively. The slopes of the SN, SH, SW, TCH, and TPH traits showed an average increasing trend per decade of 3.27 stalks, 0.06 m, 9.42 kg, 11.22 t/ha of sugarcane, and 2.08 t/ha of sugarcane, respectively.

4. Discussion

The maintenance of germplasm banks is important for the conservation of genetic resources and ensuring the continuity of the entire genetic breeding process [49]. In sugarcane, the choice of parents for crossings marks the beginning of a long breeding process of approximately 15 years [14,50]. Therefore, these parents should carry favorable alleles for traits of commercial interest, such as sucrose content, tillering, resistance to disease, and fiber content. After the cross-step, progenies are evaluated for various traits over many crop years in multi-environment trials [31,45,51,52,53]. Therefore, the characterization of cultivated germplasm and less-adapted or wild germplasm are fundamental to introgress greater diversity into the crop, introduce better cross management, and set breeding strategies that may increase the yields of the target traits [54,55].
Heritability is a population parameter that measures the degree of variation in a phenotypic trait that is related to genetic variation [56]. It is a key parameter because it determines the potential for selection gain and/or correlated response based on the range of environmental variation relevant to crop production [33,46,57]. In the present study, the heritabilities were above 0.64, 0.72, and 0.43 at the plant cane, first ratoon, and second ratoon (Table 1), respectively, suggesting a strong genetic component for the evaluated traits. Furthermore, the heritability values are in accordance with those recorded by previous studies. Chaudhary [58], using 32 sugarcane accessions found similar values for SD (0.85) and SH (0.72); Kimbeng et al. [59], using 17 sugarcane accessions, found similar values for POL%C (0.81); Gouy et al. [60] using two diversity panels, REU and GUA, found similar values for SN (0.80 and 0.90, respectively), SD (0.89 and 0.96, respectively), BRIX (0.83 and 0.88, respectively) and FIB (0.89 and 0.71, respectively); and Gouy et al. [14], using 180 sugarcane accessions at two altitude conditions, low and high, found similar values for POL%C (0.60 and 0.67, respectively), SN (0.48 and 0.50, respectively), and SH (0.73 and 0.79, respectively). Thus, despite the genetic complexity and mode of inheritance that may occur in polyploids such as sugarcane [7,61], the genetic effects are pronounced for most quantitative traits and can be explored in different ways depending on the goals of breeding, whether for sugarcane or energy cane purposes.
In breeding programs, genotypic correlations can be used to predict the effectiveness of an indirect selection of a trait with the primary goal of improving another trait [62,63]. This is relevant for traits that are difficult to measure or expensive to quantify, or those with low heritability as their covariances with higher heritability traits can be explored [63]. The strong positive (BRIX–POL%C, BRIX–POL%J, POL%C–POL%J, SW–TCH, SW–TPH, and TCH–TPH) and negative (FIB–POL%C, FIB–POL%J, FIB–SD) genotypic correlations (Figure 1) are comparable to previous reports [31,64,65,66] and suggest that BPSG congregate contrasting accessions for sucrose and fiber content. This is also evidence that BPSG has accessions with a genetic base to obtain sugarcane and accessions with favorable alleles for a high biomass energy cane [67,68]. The biplot analysis (Figure 2) showed that ancestors and breeding accessions were grouped based on the breeding and evolutionary history of sugarcane, that is, the ancestor representatives of S. spontaneum, which is known as an allelic reservoir for biomass production and less used in the sugarcane breeding crosses [69,70], were positioned farther from the breeding accessions than representatives of S. officinarum. In addition, the phenotypic averages were in accordance with those reported for sugarcane [14,27,60,65,66,71,72].
Through the boxplot analysis, it was possible to observe the productivity scenario of Brazilian breeding programs over six decades (sets B1 to B6), the phenotypic ranges of ancestor germplasm (set A), and those of foreign breeding germplasm (set E). Overall, sets B1 to B6 had smaller ranges of variation when compared with sets A and E, suggesting a strong concentration of favorable alleles for the evaluated traits related to the breeding process. In addition, only FIB had the highest median in set A, indicating that Brazilian breeding programs focused on the alleles for increased BRIX, POL%C, POL%J, SN, SD, SH, SW, TCH, and TPH rather than FIB. During this period, the sucrose content-related traits (BRIX, POL%C, and POL%J) had smaller increases when compared with the biomass production-related traits (SN, SH, SW, and TCH). These results suggest (i) stagnation or lower genetic gain for sucrose-related traits; (ii) crossing management for increase biomass, since a higher sucrose yield is limited, and (iii) improvements in agricultural practices that benefit plant development and, consequently, higher biomass productivity. Therefore, regarding breeding programs, the alerts of some previous studies on timid annual genetic gain rates and lower yield increases for traits of commercial interest [15,17,73] were also verified here. Despite the previous success of Brazilian breeding programs, the need to incorporate new tools to overcome the current productivity level is evident, especially for sucrose-related traits.
In this study, the selection of the best foreign accessions showed similar results to the superior newest accessions for sucrose-related traits. In this case, integrating foreign germplasm in a breeding program can contribute to broadening the genetic basis, causing the increase in sucrose content due to transgressive segregation resulting from the germplasm exchange efforts. For example, SW and TCH are complex traits in which heritability may vary from low to intermediate values [28,31], resulting in a pronounced non-genetic influence on the phenotype. Considering that foreign accession was selected for another type of environmental condition, the lower values of the boxplots, especially when compared with B4, B5, and B6 subsets, indicate that the local breeding programs were able to exploit the benefits of G×E interaction properly.
These results suggest that: (i) the highest genetic progress was verified for the primary trait for sugarcane breeding process, which is sugar-yield expressed by TPH; (ii) SW, SH, and SN are the main components for TCH, but the improvement of SW was the greatest contributor; (iii) sugar content (BRIX, POL%C, and POL%J) had been increased, but the lower rates compared with the other traits may indicate that a plateau is being reached; (iv) the Brazilian varieties have increased the TPH, especially due to TCH; (v) Brazilian programs intended to obtain new varieties based on sugar yield, and fiber was not the main purpose, although with the current interest in biomass breeding [4,19,74], this tendency may change in the near future, and (vi) considering the boxplots and GP, breeding programs can still succeed in improving the sugar yield, thereby increasing the biomass as opposed to the sucrose-related traits.
Finally, some previous studies have highlighted the timid annual genetic gain rates and lower yield increases for traits of commercial interest [15,17,73]. This was verified in this study, particularly for sucrose-related traits. Despite the previous success of Brazilian breeding programs, it is evident that there is a need to incorporate new tools to overcome current productivity levels. The phenotypic characterization of BPSG presented in this study offers new options since it represents the entire allelic pool explored by Brazilian breeding programs and allows future studies of genome-wide association to detect alleles that may integrate assisted selection platforms. In practice, the combination of appropriate phenotypic characterization of germplasm banks with molecular variation genotyping may be very useful for detecting effective alleles, designing new cross strategies, or selecting potentially superior cultivars in the early stages of the breeding process. Furthermore, the introgression of foreign hybrids or less-adapted germplasm may introduce new favorable alleles for quantitative traits of interest [56,75]. The fixation of these alleles may be possible through conventional breeding and could be the subject of further studies since the linkage disequilibrium in sugarcane has been previously described to a large extent [28,30,76,77]. Therefore, efforts to develop high-quality phenotyping of germplasm banks and early selection stages, along with the development of molecular data analysis for polyploids could lead to major advances for sugarcane crops.

Supplementary Materials

The following are available online at https://www.mdpi.com/article/10.3390/agriculture11060533/s1, Table S1. Brazilian Panel of Sugarcane Genotypes (BPSG): Accessions, pedigree information, origin, and predefined groups of the 242 accessions. Table S2. Selected models for the G M matrix and number of estimated parameters ( n p a r ) considering each trait separately. The Akaike (AIC) and Bayesian (BIC) information criteria were used to compare the structures of the variance-covariance matrix. The models for the G M matrix were selected according to the lowest value of the BIC criterion for BRIX (in °Brix), sucrose content of the cane (POL%C, in %), sucrose content of the juice (POL%J, in %), fiber content (FIB, in %), stalk height (SH, in m), stalk number (SN), stalk diameter (SD, in mm), stalk weight of the plot (SW, in kg), cane yield (TCH, in t/ha) and sucrose yield (TPH, in t/ha) for BPSG over three harvest years (2014, 2015, and 2016). Bold numbers represent the smallest AIC and BIC values. Table S3. Spreadsheet with raw data for the 10 traits evaluated in the present study.

Author Contributions

Conceptualization, M.S.C. and A.A.F.G.; methodology, M.S.C., R.G., F.Z.B., R.G.C. and T.W.A.B.; formal analysis, F.Z.B., T.W.A.B. and R.G.; investigation, F.Z.B. and T.W.A.B.; data curation, M.S.C. and T.W.A.B.; writing—original draft preparation, F.Z.B. and T.W.A.B.; writing—review and editing, A.P.S., A.A.F.G., R.G.C., R.G., H.P.H. and M.S.C.; supervision, M.S.C.; project administration, M.S.C.; funding acquisition, M.S.C. All authors have read and agreed to the published version of the manuscript.

Funding

This research was supported by the following institutions and/or grant programs: FINEP (Finaciadora de Estudos e Projetos) and INCT-Bioetanol (Instituto Nacional de Ciência e Tecnologia do Bioetanol (Fundação de Amparo à Pesquisa de São Paulo—FAPESP 08/57908-6) and Conselho Nacional de Desenvolvimento Científico e Tecnológico (CNPq—574002/2008-1)). F.Z.B. received a master’s fellowship from CAPES (Coordenação de Aperfeiçoamento de Pessoal de Nível Superior—Finance Code 001). T.W.A.B. received doctoral fellowship from Fundação de Amparo à Pesquisa de São Paulo (FAPESP 10/50091-4).

Institutional Review Board Statement

Not applicable.

Informed Consent Statement

Not applicable.

Data Availability Statement

All relevant data are within the paper and its Supplementary Materials.

Acknowledgments

We gratefully acknowledge Sandro Augusto Ferrarez for providing support in the field experiment.

Conflicts of Interest

The authors declare no conflict of interest.

References

  1. De Souza, A.P.; Grandis, A.; Leite, D.C.C.; Buckeridge, M.S. Sugarcane as a bioenergy source: History, performance, and perspectives for second-generation bioethanol. Bioenergy Res. 2014, 7, 24–35. [Google Scholar] [CrossRef]
  2. Sampaio, I.L.M.; Cardoso, T.F.; Souza, N.R.D.; Watanabe, M.D.B.; Carvalho, D.J.; Bonomi, A.; Junqueira, T.L. Electricity production from sugarcane straw recovered through bale system: Assessment of retrofit projects. Bioenergy Res. 2019. [Google Scholar] [CrossRef] [Green Version]
  3. de Oliveira Bordonal, R.; Carvalho, J.L.N.; Lal, R.; de Figueiredo, E.B.; de Oliveira, B.G.; La Scala, N. Sustainability of sugarcane production in brazil. A review. Agron. Sustain. Dev. 2018, 38. [Google Scholar] [CrossRef] [Green Version]
  4. Cursi, D.E.; Hoffmann, H.P.; Barbosa, G.V.S.; Bressiani, J.A.; Gazaffi, R.; Chapola, R.G.; Fernandes Junior, A.R.; Balsalobre, T.W.A.; Diniz, C.A.; Santos, J.M.; et al. History and current status of sugarcane breeding, germplasm development and molecular genetics in brazil. Sugar Tech 2021. [Google Scholar] [CrossRef]
  5. MME: Ministry of Mines and Energy. Resenha Energética Brasileira. Available online: http://antigo.mme.gov.br/documents/36208/948169/Resenha+Energ%C3%A9tica+Brasileira+-+edi%C3%A7%C3%A3o+2020/ab9143cc-b702-3700-d83a-65e76dc87a9e (accessed on 27 April 2021).
  6. D’Hont, A.; Glaszmann, J.C. Sugarcane genome analysis with molecular markers: A first decade research. Proc. Int. Soc. Sugar-Cane Technol. 2001, 24, 556–559. [Google Scholar]
  7. Vieira, M.L.C.; Almeida, C.B.; Oliveira, C.A.; Tacuatiá, L.O.; Munhoz, C.F.; Cauz-Santos, L.A.; Pinto, L.R.; Monteiro-Vitorello, C.B.; Xavier, M.A.; Forni-Martins, E.R. Revisiting meiosis in sugarcane: Chromosomal irregularities and the prevalence of bivalent configurations. Front. Genet. 2018, 9, 213. [Google Scholar] [CrossRef]
  8. Sforça, D.A.; Vautrin, S.; Cardoso-Silva, C.B.; Mancini, M.C.; Romero-da Cruz, M.V.; da Silva Pereira, G.; Conte, M.; Bellec, A.; Dahmer, N.; Fourment, J.; et al. Gene duplication in the sugarcane genome: A case study of allele interactions and evolutionary patterns in two genic regions. Front. Plant Sci. 2019, 10, 553. [Google Scholar] [CrossRef] [PubMed] [Green Version]
  9. Souza, G.M.; Van Sluys, M.-A.; Lembke, C.G.; Lee, H.; Margarido, G.R.A.; Hotta, C.T.; Gaiarsa, J.W.; Diniz, A.L.; de Medeiros Oliveira, M.; de Siqueira Ferreira, S.; et al. Assembly of the 373k Gene space of the polyploid sugarcane genome reveals reservoirs of functional diversity in the world’s leading biomass crop. Gigascience 2019, 8. [Google Scholar] [CrossRef]
  10. Daniels, J.; Roach, B.T. Taxonomy and evolution. In Sugarcane Improvement through Breeding; Heinz, D.J., Ed.; Elsevier: Amsterdan, The Netherlands, 1987; pp. 7–84. [Google Scholar]
  11. Cheavegatti-Gianotto, A.; de Abreu, H.M.C.; Arruda, P.; Bespalhok Filho, J.C.; Burnquist, W.L.; Creste, S.; di Ciero, L.; Ferro, J.A.; de Oliveira Figueira, A.V.; de Sousa Filgueiras, T.; et al. Sugarcane (Saccharum X officinarum): A reference study for the regulation of genetically modified cultivars in brazil. Trop. Plant Biol. 2011, 4, 62–89. [Google Scholar] [CrossRef] [Green Version]
  12. Morais, L.K.; Aguiar, M.S.; Silva, P.A.; Câmara, T.M.M.; Cursi, D.E.; Júnior, A.R.F.; Chapola, R.G.; Carneiro, M.S.; Filho, J.C.B. Breeding of sugarcane. In Industrial Crops: Breeding for Bioenergy and Bioproducts; Cruz, V.M.V., Dierig, D.A., Eds.; Springer: New York, NY, USA, 2015. [Google Scholar]
  13. Pompidor, N.; Charron, C.; Hervouet, C.; Bocs, S.; Droc, G.; Rivallan, R.; Manez, A.; Mitros, T.; Swaminathan, K.; Glaszmann, J.-C.; et al. Three founding ancestral genomes involved in the origin of sugarcane. Ann. Bot. 2021. [Google Scholar] [CrossRef]
  14. Gouy, M.; Rousselle, Y.; Thong Chane, A.; Anglade, A.; Royaert, S.; Nibouche, S.; Costet, L. Genome wide association mapping of agro-morphological and disease resistance traits in sugarcane. Euphytica 2015, 202, 269–284. [Google Scholar] [CrossRef]
  15. Xu, Y.; Li, P.; Zou, C.; Lu, Y.; Xie, C.; Zhang, X.; Prasanna, B.M.; Olsen, M.S. Enhancing genetic gain in the era of molecular breeding. J. Exp. Bot. 2017, 68, 2641–2666. [Google Scholar] [CrossRef]
  16. Costa Coutinho, H.; Dias Turetta, A.; Guimarães Monteiro, J.; Simões de Castro, S.; Pietrafesa, J. Participatory sustainability assessment for sugarcane expansion in Goiás, Brazil. Sustainability 2017, 9, 1573. [Google Scholar] [CrossRef] [Green Version]
  17. Dal-Bianco, M.; Carneiro, M.S.; Hotta, C.T.; Chapola, R.G.; Hoffmann, H.P.; Garcia, A.A.F.; Souza, G.M. Sugarcane improvement: How far can we go? Curr. Opin. Biotechnol. 2012, 23, 265–270. [Google Scholar] [CrossRef]
  18. Bechara, R.; Gomez, A.; Saint-Antonin, V.; Schweitzer, J.-M.; Maréchal, F.; Ensinas, A. Review of design works for the conversion of sugarcane to first and second-generation ethanol and electricity. Renew. Sustain. Energy Rev. 2018, 91, 152–164. [Google Scholar] [CrossRef]
  19. Diniz, A.L.; Ferreira, S.S.; Ten-Caten, F.; Margarido, G.R.; Dos Santos, J.M.; Barbosa, G.V.D.S.; Carneiro, M.S.; Souza, G.M. Genomic resources for energy cane breeding in the post genomics era. Comput. Struct. Biotechnol. J. 2019, 17, 1404–1414. [Google Scholar] [CrossRef] [PubMed]
  20. Schneider, W.D.H.; Gonçalves, T.A.; Uchima, C.A.; dos Reis, L.; Fontana, R.C.; Squina, F.M.; Dillon, A.J.P.; Camassola, M. Comparison of the production of enzymes to cell wall hydrolysis using different carbon sources by Penicillium echinulatum strains and its hydrolysis potential for lignocelullosic biomass. Process Biochem. 2018, 66, 162–170. [Google Scholar] [CrossRef]
  21. da Silva, D.S.; Dantzger, M.; Assis, M.A.; Gallardo, J.C.M.; Teixeira, G.S.; Missawa, S.K.; Domingues, R.R.; Carazzolle, M.F.; Lunardi, I.; Leme, A.F.P.; et al. Lignocellulolytic Characterization and Comparative Secretome Analysis of a Trichoderma erinaceum strain isolated from decaying sugarcane straw. Fungal Biol. 2019, 123, 330–340. [Google Scholar] [CrossRef] [PubMed]
  22. de Faria, L.C.; Melo, P.G.S.; Pereira, H.S.; Peloso, M.J.D.; Brás, A.J.B.P.; Moreira, J.A.A.; de Carvalho, H.W.L.; Melo, L.C. Genetic progress during 22 years of improvement of carioca-type common bean in brazil. Field Crops Res. 2013, 142, 68–74. [Google Scholar] [CrossRef]
  23. Dumont, T.; Thong-Chane, A.; Barau, L.; Siegmund, B.; Hoarau, J.-Y. Genetic variabilities and genetic gains for yield components in regional sugarcane breeding programmes on Réunion Island. Sugar Tech 2019, 21, 868–878. [Google Scholar] [CrossRef] [Green Version]
  24. Oury, F.-X.; Godin, C.; Mailliard, A.; Chassin, A.; Gardet, O.; Giraud, A.; Heumez, E.; Morlais, J.-Y.; Rolland, B.; Rousset, M.; et al. A Study of genetic progress due to selection reveals a negative effect of climate change on bread wheat yield in france. Eur. J. Agron. 2012, 40, 28–38. [Google Scholar] [CrossRef]
  25. Cobb, J.N.; Juma, R.U.; Biswas, P.S.; Arbelaez, J.D.; Rutkoski, J.; Atlin, G.; Hagen, T.; Quinn, M.; Ng, E.H. Enhancing the rate of genetic gain in public-sector plant breeding programs: Lessons from the breeder’s equation. Züchter Genet. Breed. Res. 2019, 132, 627–645. [Google Scholar] [CrossRef] [Green Version]
  26. Santana, P.N.D.; Reis, A.J.D.S.; Chaves, L.J. Combining ability of sugarcane genotypes based on the selection rates of single cross families. Crop Breed. Appl. Biotechnol. 2017, 17, 47–53. [Google Scholar] [CrossRef] [Green Version]
  27. Todd, J.R.; Sandhu, H.; Binder, J.; Arundale, R.; Gordon, V.; Song, J.; Glaz, B.; Wang, J. Fiber composition of a diversity panel of the world collection of sugarcane (Saccharum spp.) and related grasses. Bragantia 2017, 77, 48–61. [Google Scholar] [CrossRef] [Green Version]
  28. Barreto, F.Z.; Rosa, J.R.B.F.; Balsalobre, T.W.A.; Pastina, M.M.; Silva, R.R.; Hoffmann, H.P.; de Souza, A.P.; Garcia, A.A.F.; Carneiro, M.S. A Genome-wide association study identified loci for yield component traits in sugarcane (Saccharum spp.). PLoS ONE 2019, 14, e0219843. [Google Scholar] [CrossRef] [PubMed] [Green Version]
  29. Medeiros, C.; Balsalobre, T.W.A.; Carneiro, M.S. Molecular diversity and genetic structure of Saccharum complex accessions. PLoS ONE 2020, 15, e0233211. [Google Scholar] [CrossRef] [PubMed]
  30. Yang, X.; Song, J.; Todd, J.; Peng, Z.; Paudel, D.; Luo, Z.; Ma, X.; You, Q.; Hanson, E.; Zhao, Z.; et al. Target Enrichment sequencing of 307 germplasm accessions identified ancestry of ancient and modern hybrids and signatures of adaptation and selection in sugarcane (Saccharum spp.), a “sweet” crop with “bitter” genomes. Plant Biotechnol. J. 2019, 17, 488–498. [Google Scholar] [CrossRef] [PubMed] [Green Version]
  31. Balsalobre, T.W.; Mancini, M.C.; Pereira, G.D.S.; Anoni, C.O.; Barreto, F.Z.; Hoffmann, H.P.; de Souza, A.P.; Garcia, A.A.; Carneiro, M.S. Mixed modeling of yield components and brown rust resistance in sugarcane families. Agron. J. 2016, 108, 1824–1837. [Google Scholar] [CrossRef] [Green Version]
  32. Edwards, D.; Batley, J.; Snowdon, R.J. Accessing complex crop genomes with next-generation sequencing. Züchter Genet. Breed. Res. 2013, 126, 1–11. [Google Scholar] [CrossRef]
  33. Sadras, V.O.; Rebetzke, G.J.; Edmeades, G.O. The phenotype and the components of phenotypic variance of crop traits. Field Crops Res. 2013, 154, 255–259. [Google Scholar] [CrossRef]
  34. Malosetti, M.; Ribaut, J.-M.; van Eeuwijk, F.A. The statistical analysis of multi-environment data: Modeling genotype-by-environment interaction and its genetic basis. Front. Physiol. 2013, 4, 44. [Google Scholar] [CrossRef] [PubMed] [Green Version]
  35. Crossa, J.; Beyene, Y.; Kassa, S.; Pérez, P.; Hickey, J.M.; Chen, C.; de los Campos, G.; Burgueño, J.; Windhausen, V.S.; Buckler, E.; et al. Genomic prediction in maize breeding populations with genotyping-by-sequencing. G3 (Bethesda) 2013, 3, 1903–1926. [Google Scholar] [CrossRef] [Green Version]
  36. Beaulieu, J.; Doerksen, T.; Clément, S.; MacKay, J.; Bousquet, J. Accuracy of genomic selection models in a large population of open-pollinated families in white spruce. Heredity (Edinburgh) 2014, 113, 343–352. [Google Scholar] [CrossRef] [PubMed] [Green Version]
  37. Fickett, N.; Gutierrez, A.; Verma, M.; Pontif, M.; Hale, A.; Kimbeng, C.; Baisakh, N. Genome-wide association mapping identifies markers associated with cane yield components and sucrose traits in the Louisiana sugarcane core collection. Genomics 2019, 111, 1794–1801. [Google Scholar] [CrossRef]
  38. Cardoso-Silva, C.B.; Costa, E.A.; Mancini, M.C.; Balsalobre, T.W.A.; Canesin, L.E.C.; Pinto, L.R.; Carneiro, M.S.; Garcia, A.A.F.; de Souza, A.P.; Vicentini, R. De novo assembly and transcriptome analysis of contrasting sugarcane varieties. PLoS ONE 2014, 9, e88462. [Google Scholar] [CrossRef] [Green Version]
  39. Balsalobre, T.W.A.; da Silva Pereira, G.; Margarido, G.R.A.; Gazaffi, R.; Barreto, F.Z.; Anoni, C.O.; Cardoso-Silva, C.B.; Costa, E.A.; Mancini, M.C.; Hoffmann, H.P.; et al. GBS-based single dosage markers for linkage and qtl mapping allow gene mining for yield-related traits in sugarcane. BMC Genom. 2017, 18, 72. [Google Scholar] [CrossRef] [Green Version]
  40. Manual de instruções CONSECANA. State of Sao Paulo Sugarcane, Sugar and Alcohol Growers Council. 2006. Available online: http://www.oricana.com.br/novosite/manual_consecana.pdf (accessed on 27 April 2021).
  41. Piepho, H.P.; Büchse, A.; Richter, C. A Mixed Modelling Approach for Randomized Experiments with Repeated Measures. J Agron. Crop Sci. 2004, 190, 230–247. [Google Scholar] [CrossRef]
  42. VSN International. Genstat for Windows 21st Edition. VSN International: Hemel Hempstead, UK, 2020. Available online: https://www.vsni.co.uk/software/genstat (accessed on 27 April 2021).
  43. Akaike, H. A new look at the statistical model identification. IEEE Trans. Automat. Contr. 1974, 19, 716–723. [Google Scholar] [CrossRef]
  44. Schwarz, G. Estimating the dimension of a model. Ann. Stat. 1978, 6, 461–464. [Google Scholar] [CrossRef]
  45. Pastina, M.M.; Malosetti, M.; Gazaffi, R.; Mollinari, M.; Margarido, G.R.A.; Oliveira, K.M.; Pinto, L.R.; Souza, A.P.; van Eeuwijk, F.A.; Garcia, A.A.F. A mixed model QTL analysis for sugarcane multiple-harvest-location trial data. Züchter Genet. Breed. Res. 2012, 124, 835–849. [Google Scholar] [CrossRef] [PubMed] [Green Version]
  46. Holland, J.B.; Nyquist, W.E.; Cervantes-Martínez, C.T. Estimating and interpreting heritability for plant breeding: An update. In Plant Breeding Reviews; John Wiley & Sons, Inc.: Oxford, UK, 2010; pp. 9–112. [Google Scholar]
  47. Wickham, H. Ggplot2: Elegant Graphics for Data Analysis, 2nd ed.; Springer: Cham, Switzerland, 2016; ISBN 978-3-319-24275-0. [Google Scholar]
  48. R Core Team. R: A Language and Environment for Statistical Computing; R Foundation for Statistical Computing: Vienna, Austria, 2020; Available online: https://www.R-project.org/ (accessed on 27 April 2021).
  49. Govindaraj, M.; Vetriventhan, M.; Srinivasan, M. Importance of genetic diversity assessment in crop plants and its recent advances: An overview of its analytical perspectives. Genet. Res. Int. 2015, 2015, 431487. [Google Scholar] [CrossRef] [PubMed] [Green Version]
  50. Matsuoka, S.; Ferro, J.; Arruda, P. The Brazilian Experience of Sugarcane Ethanol Industry. Vitro Cell. Dev. Biol. Plant 2009, 45, 372–381. [Google Scholar] [CrossRef]
  51. Margarido, G.R.A.; Pastina, M.M.; Souza, A.P.; Garcia, A.A.F. Multi-trait multi-environment quantitative trait loci mapping for a sugarcane commercial cross provides insights on the inheritance of important traits. Mol. Breed. 2015, 35, 175. [Google Scholar] [CrossRef] [Green Version]
  52. Breseghello, F.; Coelho, A.S.G. Traditional and Modern Plant Breeding Methods with Examples in Rice (Oryza Sativa L.). J. Agric. Food Chem. 2013, 61, 8277–8286. [Google Scholar] [CrossRef]
  53. Welham, S.J.; Gogel, B.J.; Smith, A.B.; Thompson, R.; Cullis, B.R. A comparison of analysis methods for late-stage variety evaluation trials: Comparison of methods for variety trials. Aust. N. Z. J. Stat. 2010, 52, 125–149. [Google Scholar] [CrossRef]
  54. Nayak, S.N.; Song, J.; Villa, A.; Pathak, B.; Ayala-Silva, T.; Yang, X.; Todd, J.; Glynn, N.C.; Kuhn, D.N.; Glaz, B.; et al. Promoting utilization of Saccharum spp. Genetic resources through genetic diversity analysis and core collection construction. PLoS ONE 2014, 9, e110856. [Google Scholar] [CrossRef] [Green Version]
  55. Byrne, P.F.; Volk, G.M.; Gardner, C.; Gore, M.A.; Simon, P.W.; Smith, S. Sustaining the future of plant breeding: The critical role of the USDA-ARS National Plant Germplasm System. Crop Sci. 2018, 58, 451–468. [Google Scholar] [CrossRef] [Green Version]
  56. Falconer, D.S.; Mackay, T.F.C. Introduction to Quantitative Genetics, 4th ed.; Longman: Harlow, UK, 1996. [Google Scholar]
  57. Piepho, H.-P.; Möhring, J. Computing heritability and selection response from unbalanced plant breeding trials. Genetics 2007, 177, 1881–1888. [Google Scholar] [CrossRef] [Green Version]
  58. Chaudhary, R.R. Genetic variability and heritability in sugarcane. Nepal Agric. Res. J. 2001, 4, 56–59. [Google Scholar] [CrossRef]
  59. Kimbeng, C.A.; Zhou, M.M.; da Silva, J.A. Genotype × environment interactions and resource allocation in sugarcane yield trials in the Rio Grande valley region of Texas. J. Am. Soc. Sugar Cane Technol. 2009, 29, 11–24. [Google Scholar]
  60. Gouy, M.; Rousselle, Y.; Bastianelli, D.; Lecomte, P.; Bonnal, L.; Roques, D.; Efile, J.-C.; Rocher, S.; Daugrois, J.; Toubi, L.; et al. Experimental assessment of the accuracy of genomic selection in sugarcane. Züchter Genet. Breed. Res. 2013, 126, 2575–2586. [Google Scholar] [CrossRef]
  61. Bourke, P.M.; Voorrips, R.E.; Visser, R.G.F.; Maliepaard, C. Tools for genetic studies in experimental populations of polyploids. Front. Plant Sci. 2018, 9. [Google Scholar] [CrossRef] [Green Version]
  62. Ram, B.; Chaudhary, B.S.; Yadav, D.K. General and specific selection indices for single stool stages of selection in sugarcane. Euphytica 1997, 95, 39–44. [Google Scholar] [CrossRef]
  63. Cellon, C.; Amadeu, R.R.; Olmstead, J.W.; Mattia, M.R.; Ferrao, L.F.V.; Munoz, P.R. Estimation of genetic parameters and prediction of breeding values in an autotetraploid blueberry breeding population with extensive pedigree data. Euphytica 2018, 214. [Google Scholar] [CrossRef]
  64. Ming, R.; Liu, S.C.; Moore, P.H.; Irvine, J.E.; Paterson, A.H. QTL analysis in a complex autopolyploid: Genetic control of sugar content in sugarcane. Genome Res. 2001, 11, 2075–2084. [Google Scholar] [CrossRef] [Green Version]
  65. Hoarau, J.-Y.; Grivet, L.; Offmann, B.; Raboin, L.-M.; Diorflar, J.-P.; Payet, J.; Hellmann, M.; D’Hont, A.; Glaszmann, J.-C. Genetic dissection of a modern sugarcane cultivar (Saccharum spp.): II. Detection of QTLs for yield components. Züchter Genet. Breed. Res. 2002, 105, 1027–1037. [Google Scholar] [CrossRef]
  66. Aitken, K.S.; Hermann, S.; Karno, K.; Bonnett, G.D.; McIntyre, L.C.; Jackson, P.A. Genetic control of yield related stalk traits in sugarcane. Züchter Genet. Breed. Res. 2008, 117, 1191–1203. [Google Scholar] [CrossRef]
  67. Tew, T.L.; Cobill, R.M. Genetic improvement of sugarcane (Saccharum spp.) as an energy crop. In Genetic Improvement of Bioenergy Crops; Springer: New York, NY, USA, 2008; pp. 273–294. [Google Scholar]
  68. Matsuoka, S.; Kennedy, A.J.; Santos, E.G.D.D.; Tomazela, A.L.; Rubio, L.C.S. Energy Cane: Its concept, development, characteristics, and prospects. Adv. Bot. 2014, 2014, 1–13. [Google Scholar] [CrossRef] [Green Version]
  69. Aitken, K.; Li, J.; Piperidis, G.; Qing, C.; Yuanhong, F.; Jackson, P. Worldwide genetic diversity of the wild species Saccharum spontaneum and level of diversity captured within sugarcane breeding programs. Crop. Sci. 2018, 58, 218–229. [Google Scholar] [CrossRef]
  70. Silva, J.A.G.D.; Costa, P.M.D.A.; Marconi, T.G.; Barreto, E.J.D.S.; Solís-Gracia, N.; Park, J.W.; Glynn, N.C. Agronomic and molecular characterization of wild germplasm Saccharum Spontaneum for sugarcane and energycane breeding purposes. Sci. Agric. 2018, 75, 329–338. [Google Scholar] [CrossRef] [Green Version]
  71. Aitken, K.S.; Jackson, P.A.; McIntyre, C.L. Quantitative Trait Loci identified for sugar related traits in a sugarcane (Saccharum spp.) cultivar x Saccharum officinarum population. Züchter Genet. Breed. Res. 2006, 112, 1306–1317. [Google Scholar] [CrossRef]
  72. Todd, J.; Wang, J.; Glaz, B.; Sood, S.; Ayala-Silva, T.; Nayak, S.N.; Glynn, N.C.; Gutierrez, O.A.; Kuhn, D.N.; Tahir, M.; et al. Phenotypic Characterization of the Miami World Collection of Sugarcane (Saccharum spp.) and Related Grasses for selecting a representative core. Genet. Resour. Crop. Evol. 2014, 61, 1581–1596. [Google Scholar] [CrossRef]
  73. Pardey, P.G.; Beddow, J.M.; Hurley, T.M.; Beatty, T.K.M.; Eidman, V.R. A Bounds analysis of world food futures: Global agriculture through to 2050. Aust. J. Agric. Resour. Econ. 2014, 58, 571–589. [Google Scholar] [CrossRef] [Green Version]
  74. de Souza Barbosa, G.V.; dos Santos, J.M.; Diniz, C.A.; Cursi, D.E.; Hoffmann, H.P. Energy Cane Breeding. In Sugarcane Biorefinery, Technology and Perspectives; Elsevier: Amsterdam, The Netherlands, 2020; pp. 103–116. [Google Scholar]
  75. Cowling, W.A.; Li, L.; Siddique, K.H.M.; Henryon, M.; Berg, P.; Banks, R.G.; Kinghorn, B.P. Evolving Gene Banks: Improving diverse populations of crop and exotic germplasm with optimal contribution selection. J. Exp. Bot. 2016, 68, 1927–1939. [Google Scholar] [CrossRef] [PubMed] [Green Version]
  76. Raboin, L.-M.; Pauquet, J.; Butterfield, M.; D’Hont, A.; Glaszmann, J.-C. Analysis of genome-wide linkage disequilibrium in the highly polyploid sugarcane. Züchter Genet. Breed. Res. 2008, 116, 701–714. [Google Scholar] [CrossRef] [PubMed]
  77. Wei, X.; Jackson, P.A.; Hermann, S.; Kilian, A.; Heller-Uszynska, K.; Deomano, E. Simultaneously accounting for population structure, genotype by environment interaction, and spatial variation in marker–trait associations in sugarcane. Genome 2010, 53, 973–981. [Google Scholar] [CrossRef] [PubMed] [Green Version]
Figure 1. Genotypic correlation between yield traits [BRIX (in °Brix), sucrose content of the cane (POL%C, in %), sucrose content of the juice (POL%J, in %), fiber content (FIB, in %), stalk height (SH, in m), stalk number (SN), stalk diameter (SD, in mm), stalk weight of the plot (SW, in kg), cane yield (TCH, in t/ha) and sucrose yield (TPH, in t/ha)] evaluated in the Brazilian Panel of Sugarcane Genotypes (BPSG). For each trait, the density plots of the adjusted means (diagonal), scatterplots (below diagonal), and values of the genotypic correlation (above diagonal) between pairs of traits are shown. * Significant at the 5% global level ( p < 0.05 ). ** Significant at the 1% global level ( p < 0.01 ). *** Significant at the 0.1% global level ( p < 0.001 ).
Agriculture 11 00533 g001
Figure 2. Biplot analysis of the accessions of Brazilian Panel of Sugarcane Genotypes (BPSG) considering adjusted means of three harvest years (2014, 2015, and 2016) for BRIX (in °Brix), sucrose content of the cane (POL%C, in %), sucrose content of the juice (POL%J, in %), fiber content (FIB, in %), stalk height (SH, in m), stalk number (SN), stalk diameter (SD, in mm), stalk weight of the plot (SW, in kg), cane yield (TCH, in t/ha) and sucrose yield (TPH, in t/ha). Ancestors and breeding accessions are in green and blue, respectively.
Agriculture 11 00533 g002
Figure 3. Boxplot analysis of yield traits (BRIX (in °Brix), sucrose content of the cane (POL%C, in %), sucrose content of the juice (POL%J, in %), fiber content (FIB, in %), stalk height (SH, in m), stalk number (SN), stalk diameter (SD, in mm), stalk weight of the plot (SW, in kg), cane yield (TCH, in t/ha), and sucrose yield (TPH, in t/ha)) evaluated in the Brazilian Panel of Sugarcane Genotypes (BPSG). The accessions of BPSG were grouped into A (ancestors), E (foreign breeding accessions), and B (Brazilian breeding accessions). Group B was subdivided according to the decade in which the accession parents were crossed: B1 (1940–1951), B2 (1952–1961), B3 (1962–1971), B4 (1972–1981), B5 (1982–1991), and B6 (1992–2001). The boxplots of A, E, and B (B1, B2, B3, B4, B5, and B6) sets were black, gray, and white, respectively.
Agriculture 11 00533 g003
Table 1. Ranges, averages, estimates of components of genetic ( σ ^ G 2 ) and residual ( σ ^ R 2 ) variances, coefficient of genotypic (CVG) and residual (CVR) variation, and broad-sense heritability on an individual-plant basis ( H 2 ) for BRIX (in °Brix), sucrose content of the cane (POL%C, in %), sucrose content of the juice (POL%J, in %), fiber content (FIB, in %), stalk height (SH, in m), stalk number (SN), stalk diameter (SD, in mm), stalk weight of the plot (SW, in kg), cane yield (TCH, in t/ha), and sucrose yield (TPH, in t/ha) for BPSG over three harvest years (2014(1), 2015(2), and 2016(3)).
BRIX (°Brix)POL%CPOL%JFIB (%)SH (m)SNSD (mm)SW (Kg)TCH (t/ha)TPH (t/ha)
Ranges
(min/max)
10.98/22.413.54/17.185.04/20.529.76/26.501.15/2.7510.83/490.0111.22/37.166.36/201.027.60/239.301.56/36.55
Average19.4813.9816.7913.452.0082.6723.79131.30156.2019.83
Phi_10.960.960.960.950.930.940.970.920.920.95
σ ^ G ( 1 ) 2 4.797.628.8413.900.111987.0019.983103.004397.00109.40
σ ^ G ( 2 ) 2 3.907.628.846.110.154060.0016.152754.003902.00108.90
σ ^ G ( 3 ) 2 5.127.628.8411.480.073570.0013.55557.00789.2015.08
σ ^ R ( 1 ) 2 1.142.022.323.140.06267.503.481180.001673.0035.99
σ ^ R ( 2 ) 2 0.851.161.571.290.05707.604.711036.001468.0041.01
σ ^ R ( 3 ) 2 0.772.993.0212.450.031943.002.85591.30837.8019.64
CVG(1)0.110.190.170.270.160.530.180.420.420.52
CVG(2)0.100.190.170.180.190.770.160.400.400.52
CVG(3)0.110.190.170.250.130.720.150.180.180.19
CVR(1)0.050.100.090.130.120.190.070.260.260.30
CVR(2)0.040.070.070.080.110.320.090.240.240.32
CVR(3)0.040.120.100.260.080.530.070.180.180.22
H ^ ( 1 ) 2 0.800.790.790.810.640.880.850.720.720.75
H ^ ( 2 ) 2 0.820.860.850.820.750.850.770.720.720.72
H ^ ( 3 ) 2 0.870.710.740.480.700.640.820.480.480.43
Table 2. Linear regression, coefficient of determination (R²), and p -value for the angular coefficient significance and genetic progress (GP (%)) for BRIX (in °Brix), sucrose content of the cane (POL%C, in %), sucrose content of the juice (POL%J, in %), fiber content (FIB, in %), stalk height (SH, in m), stalk number (SN), stalk diameter (SD, in mm), stalk weight of the plot (SW, in kg), cane yield (TCH, in t/ha), and sucrose yield (TPH, in t/ha) for accessions from Brazilian breeding programs considering six decades of breeding.
TraitLinear RegressionR² (%)p-valueGP (%)
BRIX (°Brix)y = 19.30 + 0.27x17.666.41 × 10−70.69
POL%Cy = 14.13 + 0.26x13.441.79 × 10−50.92
POL%Jy = 16.82 + 0.31x15.513.55 × 20−60.92
FIB (%)y = 12.50 + 0.01x0.030.84 ns0.04
SH (m)y = 1.87 + 0.06x19.691.24 × 10−71.60
SNy = 67.00 + 3.27x6.802.71 × 10−32.44
SD (mm)y = 24.39 + 0.11x0.940.27 ns0.23
SW (Kg)y = 72.06 + 9.42x15.962.48 × 10−66.53
TCH (t/ha)y = 85.77 + 11.22x15.972.48 × 10−66.54
TPH (t/ha)y = 11.40 + 2.08x21.153.70 × 10−89.12
Publisher’s Note: MDPI stays neutral with regard to jurisdictional claims in published maps and institutional affiliations.

