Article

Evaluation of Agricultural Land Suitability Based on RS, AHP, and MEA: A Case Study in Jilin Province, China

College of Geo-Exploration Science and Technology, Jilin University, Changchun 130026, China
*
Author to whom correspondence should be addressed.
Agriculture 2021, 11(4), 370; https://doi.org/10.3390/agriculture11040370
Submission received: 19 March 2021 / Revised: 14 April 2021 / Accepted: 16 April 2021 / Published: 19 April 2021
(This article belongs to the Section Digital Agriculture)

Abstract

:
The suitability evaluation of agricultural land at the regional scale is of great significance for protecting land and water resources and building sustainable agricultural systems. Based on climate, soil, topographical, and surface water resources, land suitability index (LSI) data for maize, rice, and soybeans are established using an analytical hierarchy process and matter element analysis (AHP–MEA) model in Jilin Province, China. The results show that there is a significant positive linear correlation between the LSI and the measured yield, which indicates that the model has an ideal effect and certain reference and extension significance. The main limiting factors for maize and soybean planting are pH, total nitrogen (TN), available phosphorus (AP), and soil texture, while water shortage limits rice planting. Different spatial structure optimization schemes for planting are established using the LSI and measured yield, along with economic indices. This study shows that the scheme that integrates policy and cost can make full use of land and water resources and promote the economic growth of agriculture. After optimization, the planting areas of maize, rice, and soybeans were 7.22, 2.44, and 0.71 million ha, respectively, representing an increase of 15.71 billion yuan over the agricultural GDP for the existing planting structure. It is expected that this study will provide a basis for follow-up studies on crop cultivation suitability.

1. Introduction

Land suitability evaluation refers to the degree of appropriateness of land characteristics to support a specific land use [1]. It is widely used in the suitability evaluation of agricultural land, which is of great significance to agricultural production and development; its research is mainly carried out at the land patch and regional scale [2,3]. At the land patch scale, the potential locations for the most suitable crops can be identified through evaluation [4]. From the view of the regional scale, agricultural land suitability evaluation plays an important role in protecting agricultural land and water resources, along with managing and creating a sustainable agriculture system [5].
Agricultural land suitability evaluation is a complicated process that requires comprehensive consideration of the influences of several factors [6,7]. Accordingly, the factors taken into account are also different in terms of the land patch and regional scales. For example, in a study of a micro-sized watershed (632 ha) in the central dry zone of Karnataka [8] and a part (5182 ha) of the Fathali plains area in Ardabil Province, Iran [9], according to the conditions of land use, soil properties, and topography, the study area was divided into land patches with basically identical properties. The suitability of each land patch was evaluated via soil characteristics and topographic factors, and reasonable evaluation results were obtained.
In contrast, more factors need to be considered at the regional scale. Besides soil characteristics and topographical factors, climatic factors should also be taken into account. Climatic factors have large variability at a regional scale, and different climatic conditions determine land use to a large extent, which is a prerequisite for agricultural production [10,11]. These have been demonstrated in evaluation studies of tobacco areas in Shandong Province (1.57 million ha), China [12], and maize areas in Kenya (58.44 million ha) [13]. These study areas include many provinces and cities, as well as a number of different climatic conditions. In these studies, climatic factors have larger weights than soil and topographical factors, and the studies have shown that abnormal temperature and precipitation have a greater impact on the length of crop growing seasons, thus reducing crop yields. Therefore, it is more reasonable to evaluate land suitability by taking climate factors into account. Nevertheless, these studies are also limited to a certain degree because their evaluations have been implemented to identify whether the land is suitable for a specific type of crop growth. It is common to consider a variety of crops at a regional scale [14,15], so it is practical to evaluate land suitability while considering multiple crops. Within a large area, topographical information is difficult to obtain by field measurement, and, at the same time, it is impossible to obtain land use/cover types in a timely and effective manner [16,17]. In a study of land suitability in Central Mexico, remote sensing technology provided topographical and agricultural land information for evaluation in a timely and accurate manner [18]. It is necessary to obtain topographical and land use information via remote sensing technology for land suitability evaluation at a regional scale.
Regarding the selection of appropriate evaluation indicators, it is of great significance to select appropriate evaluation models and methods to realize reasonable results [19]. Recently, many mathematical models have been applied to evaluate land suitability, such as multivariate statistical analysis (MSA) [20] and artificial neural networks (ANNs) [21]; however, these mathematical models have limitations. They lack accurate analysis methods for qualitative factors such as soil texture and drainage, which will omit some differentiation information [22,23]. Moreover, several evaluation methods have been widely used and developed, including analytic hierarchy process (AHP) methods [24], fuzzy comprehensive evaluation methods (FCEMs) [25], and others. These methods artificially divide land suitability into several grades, according to a comprehensive value, in order to identify degrees of membership between single factors and evaluation ranks [26]. Matter element analysis (MEA) could greatly expand the range of research to ensure the integrity of information [27]. In the study of risk assessment for engagement in sharing economic data of manufacturing enterprises, each factor is a qualitative indicator. Reasonable evaluation results have been obtained by MEA [28]. At the same time, MEA obtains degrees of membership between evaluation factors and evaluation levels through the form of a function, which will effectively avoid the influence of subjective factors [29]. In the assessment of ecosystem health by matter element analysis, ecosystem health is not artificially divided into several grades, and this leads to higher objectivity and accuracy [30]. Accordingly, MEA has been used in ecological health evaluation [31], urban network risk assessment planning [32], and energy sustainability evaluation [33]. Consequently, MEA should be a good choice for land suitability assessment; however, different evaluation factors may have different effects on the comprehensive evaluation value [34], so the weights of factors are particularly important for evaluation. AHP models have been applied to determine the weights of factors in several studies and have produced good results in areas such as ecological sensitivity evaluation [35], energy site selection evaluation [36], and safety evaluation [37]. Thus, AHP models could be used in determining the weights of factors in the process of land suitability evaluation. An integrated MEA and AHP process should be a reliable method for regional land suitability assessment.
Jilin Province is located in the middle of northeastern China and is known as “the hometown of black soil”, which is an important commodity for grain production. In China, Jilin Province represents one-tenth of national grain production and is rich in high-quality agricultural products such as maize, rice, and soybeans. Taking Jilin Province as an example, the suitability of maize, rice, and soybean production in Jilin Province is evaluated here by combining AHP and MEA methods. The resulting model is used together with the comprehensive consideration of climatic and soil characteristics and surface water resources in order to provide a theoretical basis for the sustainable development of agriculture.

2. Materials and Methods

Jilin Province is located between 121°38′–131°19′ E and 40°52′–46°18′ N (Figure 1). Its total area is 187,400 km 2 , accounting for 2% of the total land area of China. There are obvious differences in landforms, with the western foothills of Dahei Mountain as the boundary in the central part; the Changbai Mountain, with a high altitude and low hills below 500 m above sea level in the east; and the vast hinterland of Songliao Plain in the west. There are over 2000 rivers in Jilin Province, and they belong to five major river systems, namely, Songhua River, Liaohe River, Tumen River, Yalu River, and Suifen River. The average density of the river network is 0.19 km / km 2 , and the river network density is higher in the eastern mountainous area and lower in the western plains region. The average amounts of water per hectare of cultivated land in the province are lower than the national average. The soil types are complex and diverse, and the distributions have obvious meridional differentiation in Jilin Province. The natural fertility of the soil is high and is dominated by loam, sand, silty clay, silt loam, and clay. From west to east, the soil is regularly distributed in the eastern mountains and shows obvious vertical zonality. There are obvious seasonal changes and regional differences in temperature, precipitation, and temperature in Jilin Province. The average temperature is below −11 °C in winter and is above 23 °C in summer. The average perennial sunshine length ranges between 2259 and 3016 h. The average annual precipitation is 400–600 mm, 80% of which is concentrated in summer, with the most abundant rainfall in the east of the province. Jilin Province is rich in natural resources and fertile soil and is especially conducive to the growth of maize, rice, and soybeans. Among them, under the influence of water resources, rice is mainly planted in five river basins, soybeans are mainly grown in the central and eastern parts of Jilin Province, and maize is planted throughout the whole province.

2.1. Identification of Evaluation Factors

There are many factors that affect the planting and growth of crops, but it is impossible to consider all of them [16]. According to the crop growth conditions and the actual situation in the study area, the following factors were selected to evaluate the suitability of land dedicated to maize, rice, and soybean production. Based on Food and Agriculture Organization of the United Nations (FAO) Suitability Level 1 and other research [38,39,40,41,42,43,44,45], land suitability for different crops was divided into four levels: high suitability (S1), moderate suitability (S2), marginal suitability (S3), and unsuitability (N) (Table 1).

2.1.1. Topography

Topography is closely related to the normal development of soil. The thickness of the soil layer decreases with the increase of the slope angle and increases with the decrease of the slope angle [46]. At the same time, soil erosion tends to occur in areas with steep slopes, which aggravates the loss of soil nutrients. On the other hand, slopes also have a direct impact on agricultural production and management, and larger slopes limit mechanized production [12]. Therefore, slopes have a direct impact on soil thickness, soil nutrients, and agricultural productivity and further affect land suitability of crop growth. The eastern part of Jilin Province is mountainous, and the western part is made up of plains. The landforms undulate, and the planting conditions of crops are greatly affected by the given slope.

2.1.2. Physical Soil Characteristics

The soil texture affects the growth of crops to a great extent and plays an important role in the transport and regulation of water and air in soil, thus fundamentally affecting the suitability of soil for plant root growth [47]. There is a great relationship between soil drainage capacity and soil texture. The soil with a better drainage capacity will lead to a rapid loss of water and nutrients in the soil, resulting in insufficient water and nutrient supply. The retention of excess water in the soil will block the flow of air, resulting in insufficient oxygen supply in roots and the retention of carbon dioxide, thus affecting the growth of crops [48]. The soil types are diverse in Jilin Province, and there are large gaps in soil texture and drainage capacity between different regions; however, the influences of some factors on the suitability of cropland are within the range of high suitability. The depth of soil is more than 100 cm, and the CaCO3 proportion is less than 10% in the study area, which is within the high suitability ranges for different crops, and, as such, these factors are not considered here.

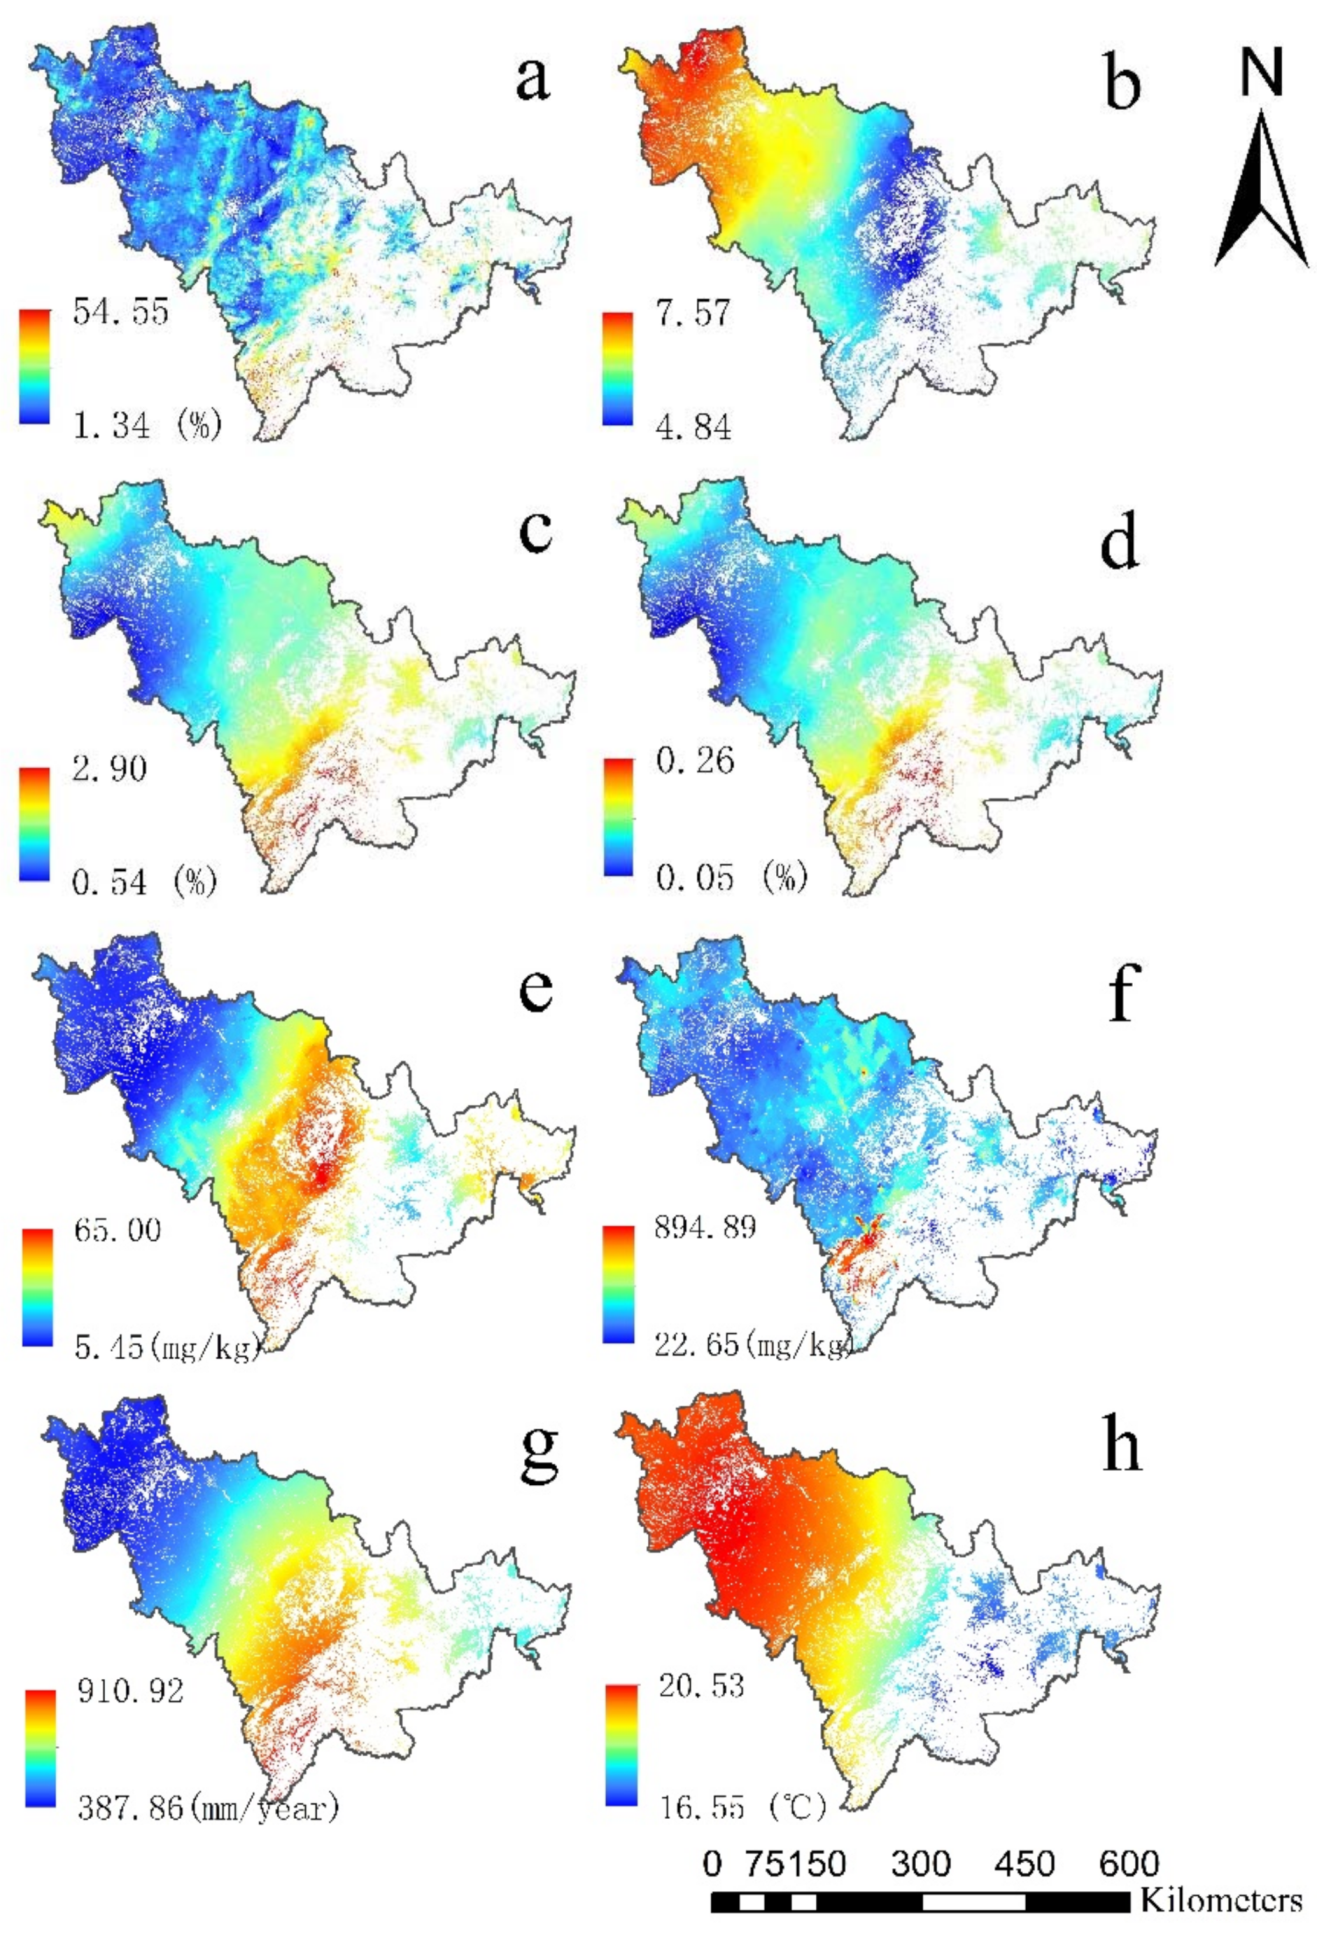
2.1.3. Soil Fertility Characteristics

pH plays a major role in soil nutrient availability, crop growth, and productivity [49]. Besides this, pH affects many physical, chemical, and biological reactions, either directly or indirectly, in the soil, and the optimal pH ranges for different crops have significant differences [16]. In the study area, the pH ranges from 4.84 to 7.57, with a mean pH of 6.0.
Organic carbon (OC) represents the amount of organic matter in the soil. OC is an ideal source of nutrients for crops, as well as providing essential nutrients and energy for microorganisms [50]. Its content in the soil varies according to altitude, slope, and rainfall [16]. With high altitude locations, steep slopes, and high rainfall, the content of OC is relatively low. The average OC content is 1.61% in the study area, which belongs to the highly suitable category.
Nitrogen (N), phosphorus (P), and potassium (K) are essential elements in the process of crop growth [51]. Nitrogen is necessary for plant growth and plays an important role in the development and growth of leaves and stems [51]. Phosphorus plays an important role in root growth, flowering, and fruiting. In addition, crop growth will require more phosphorus in acidic or alkaline soils [16]. Potassium plays an important role in crop photosynthesis, disease resistance, and fruit growth [16]. Therefore, it is necessary to take NPK as an influencing factor of cropland suitability. In this study, total nitrogen, available phosphorus, and available potassium are used as indices of the soil NPK content.

2.1.4. Climate Characteristics

The climate plays a very important role in agricultural production, and its influence is mainly reflected in terms of heat, moisture, and sunshine. In terms of heat, the average temperature in the crop growth season determines the growing period and ripening of crops [13]. The amount of precipitation affects crop growth and yields [10]. Sunshine has an important effect on crop yields and quality [52]. The study area is located near 43° N, and the illumination condition is within the highly suitable category for crop growth, while the ranges of temperature and rainfall are relatively large. Temperature and rainfall are taken as influencing factors in the climate characteristics in this study.

2.1.5. Location Condition

Water sources prominently affect agricultural cultivation, and the distance from a water source is also a factor that affects the quality of agricultural land, especially for rice cultivation, which requires more water [46]. The closer to the water source, the higher the degree of suitability of agricultural land. In the eastern part of the study area, there are many rivers and abundant water sources, while in the western part, there are few rivers and the large planting areas are distant from water sources. As such, the influence of a water source on the suitability of crop planting cannot be ignored.

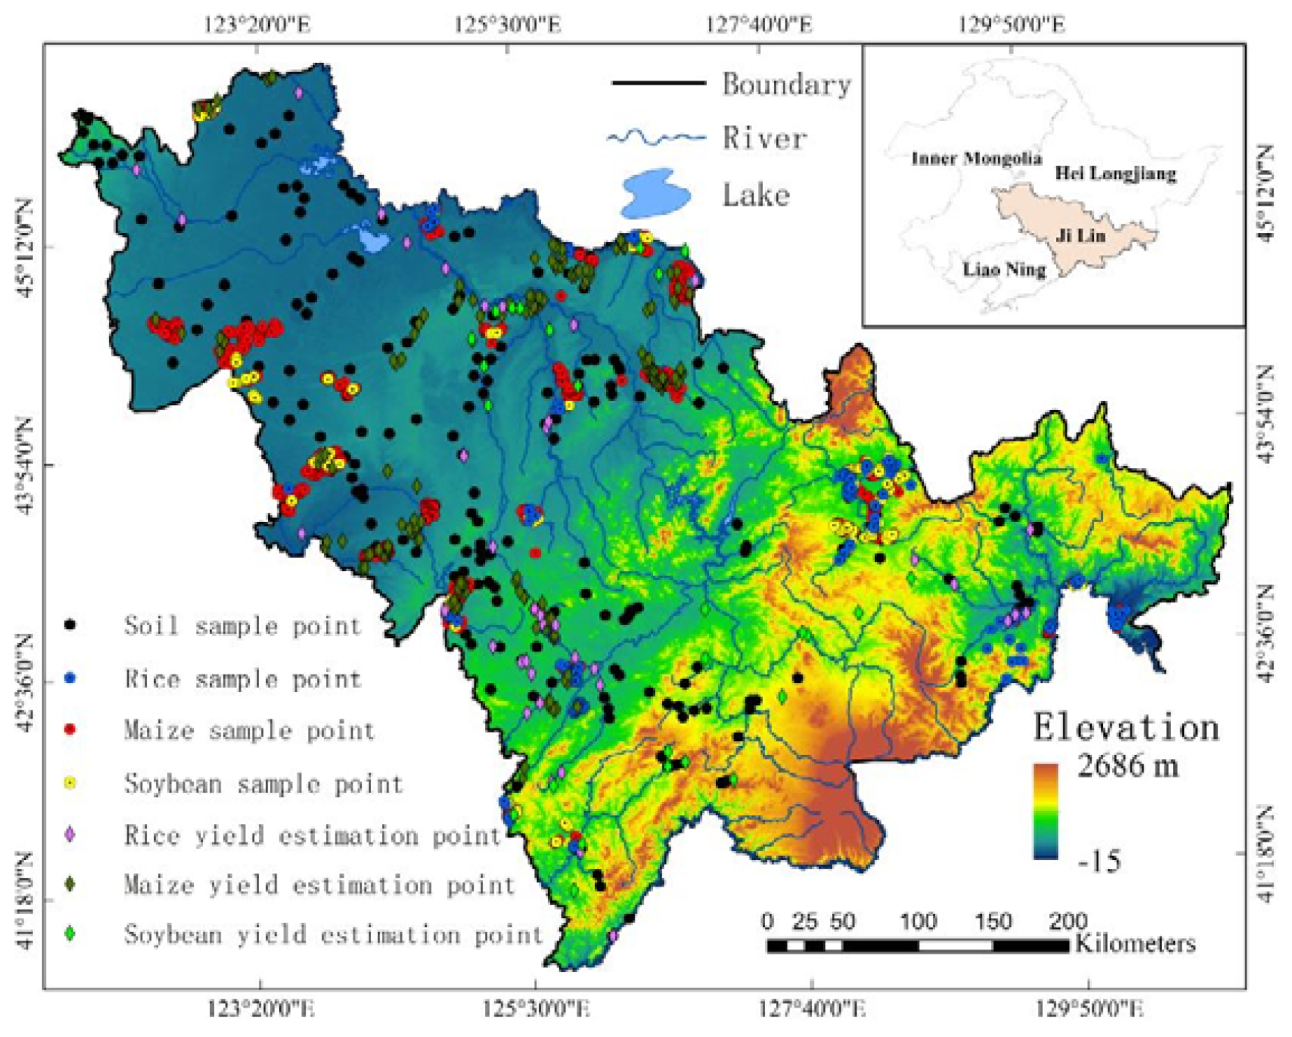
2.2. Samples and Preparation of Data
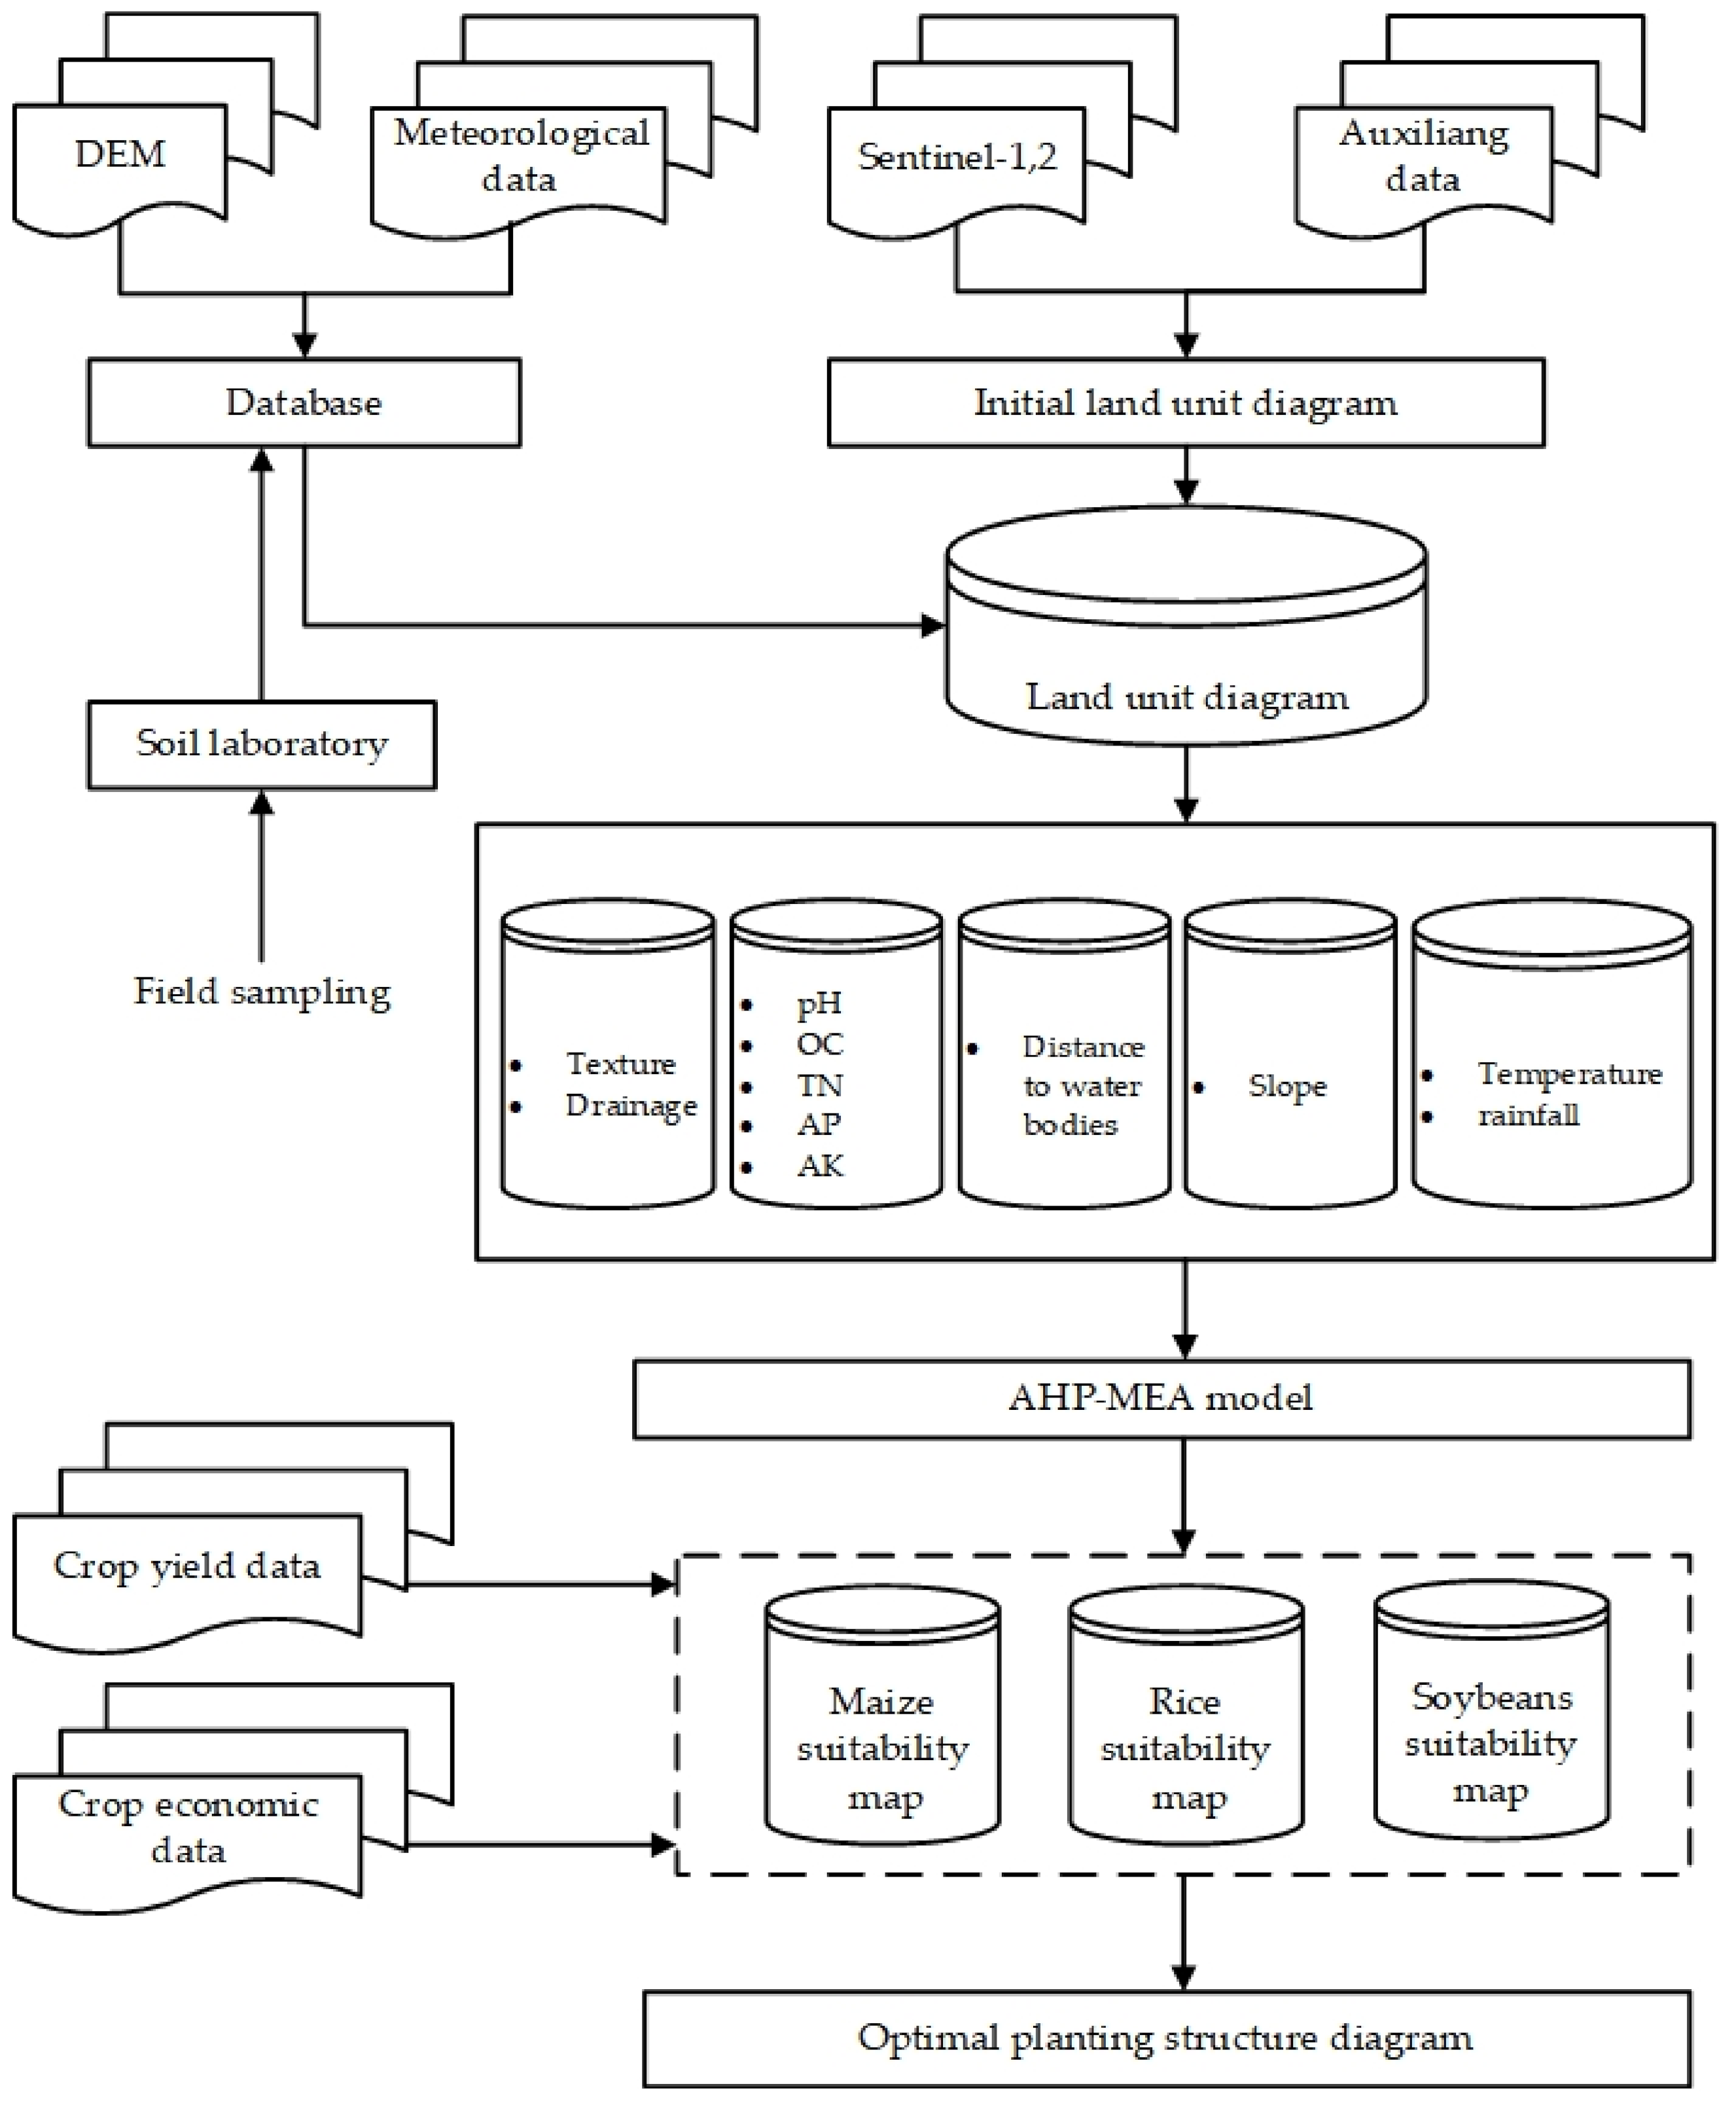
The land use information was obtained from remote sensing image data for the study area in 2018, and GPS was used to conduct uniform sampling and record basic information about various crops. There were 1066 sampling points for maize, 248 sampling points for rice, and 183 sampling points for soybeans (Figure 1). Based on the Google Earth Engine (GEE) [53] cloud platform, a random forest classifier was used to classify the Sentinel-1 and Sentinel-2 fused images in the research area.
The topographic data in this study were generated via ASTER GDEM digital elevation model (DEM) data generation, with 30 × 30 m resolution (http://www.gscloud.cn/, accessed on 17 June 2020), and the physical soil attribute data were gathered from the World Soil Database. The ArcGIS 10.2 software package was used to resample the two sets of data into grid data of a 10 × 10 m size. Soil fertility is recognized on the basis of samples collected from the fields before planting crops in 2018, and there were 207 soil samples with a surface layer of 20 cm (Figure 1 and Table 2). Laboratory tests were conducted by the Northeast Institute of Geography and Agroecology, Chinese Academy of Sciences. Climate data were obtained from 27 weather stations in the research field (China Meteorological Data Network (http://data.cma.cn, accessed on 14 July 2020)), along with average annual precipitation and average annual temperature data for the 2009–2018 growing season (May–September). Then, the soil fertility and climate data were converted into grid data with a resolution of 10 × 10 m via Kriging interpolation with the geostatistical analyst module in ArcGIS 10.2. Finally, the existing cultivated land was used to cover up the resampling and interpolation results, and the land suitability evaluation data set in the study area was then obtained (Figure 2). The economic data were gathered from the National Agricultural Product Cost and Benefit Data Collection 2019 by the Price Department of the National Development and Reform Commission.

2.3. Methods

Land suitability assessment is a method of land evaluation. In this paper, AHP, MEA, and RS technology are used to measure the suitability degree of land for maize, rice, and soybeans. The specific process is shown in Figure 3 and described as follows:

2.3.1. Matter Element Analysis (MEA)

The basic procedure of MEA for a land suitability index (LSI) can be summarized via the following steps:
Step 1: Determination of the matter element to be evaluated.
In matter element theory, each matter element combination is composed of objects (N), characteristics (c), and values (v) to form a research system. Objects (N), characteristics (c), and values (v) are the three elements of a matter element. In this study, the assessment of land suitability (N) has several characteristics and can be depicted by n indicators ( c 1 , c 2 , , c n ) and corresponding values ( v 1 , v 2 , , v n ). The MEA of land suitability evaluation can then be expressed as follows:
R = N , c , v = N     c 1 v 1 c 2 v 2 c n v n ,
where R is the n-dimensional matter element of land suitability for agriculture (simplified as R = N , C , X ), N is the minimum spatial unit of land suitability, c is the indicator to evaluate land suitability for different crops, and v is the value of each indicator.
Step 2: Determine the classical domain and the joint domain.
In the suitability analysis of different crop areas, different factors use different grade indices to describe their suitability to crops. The classical domain ( R j ) refers to the range of values for indicator i at grade j. Then, the classical domain matrix can be given as follows:
R j = N j , c i , v j i = N j     c 1 v j 1 c 2 v j 2 c n v j n = N     c 1 a j 1 , b j 1 c 2 a j 2 , b j 2 c n a j n , b j n ,
where N j is the land suitability of different crops belonging to grade j; c 1 , c 2 , , c n are n different indicators of N j ; and v j 1 , v j 2 , , v j n are the value ranges for each c i of N j , of which a i j and b i j are the upper and lower limits for each c i of N j , respectively.
The segment domain ( R p ) is an aggregation of classical domains ( R j ), and it can be defined as the range of values of indicator i at all grades. This means that the influence degree of different cropland suitability factors is included in this range and the end value at both ends. Hence, the segment domain matrix can be given as follows:
R p = p , c i , v p i = p     c 1 v p 1 c 2 v p 2 c n v p n = p     c 1 a p 1 , b p 1 c 2 a p 2 , b p 2 c n a p n , b p n ,
where p is the land suitability of different crops at all grades; v p 1 , v p 2 , , v p n are the value ranges for c 1 , c 2 , , c n ; and b p i represents the minimum and maximum values for the range of each c i , respectively.
Step 3: Normalization of measured criteria.
There are many ways to standardize data. In this study, the scope of the segment domain is approximately between 1 and 100. Therefore, the efficiency coefficient method may be used to normalize the defined standard values, the equations for which are given as follows:
where when x i j is a positive effective criterion:
S x i j = S m i n + x i j m i n x i j m a x x i j m i n x i j × S m a x S m i n ,
where when x i j is a negative effective criterion:
S x i j = S m i n + m a x x i j x i j m a x x i j m i n x i j × S m a x S m i n ,
where S m a x and S m i n are the maximum and minimum standardized values of a specific grade, where x i j denotes the characteristic value of index i for evaluation unit j, and m a x x i j and m i n x i j are the measured values of the maximum and minimum of all the matter elements for the same grade, respectively.
Step 4: Calculation of correlation functions between each criterion and suitability class.
Based on the classical and segmented domains, correlation functions are established to quantify the land suitability degree of each index i to each grade j. The correlation degrees for all matter elements were calculated with the following functions:
K j v i = ρ v i , v j i v j i , v i v j i ρ v i , v j i ρ v i , v p i ρ v i , v j i , v i v j i ,
where K j v i indicates the correlation degree between criterion j and class I; v i ,   v j i and v p i represent the value of the matter element measured, range of the classical domain, and range of the segment domain, respectively; ρ v i , v j i and ρ v i , v p i represent the distance of the evaluated matter element of indicator i to the classical domain and the segment domain. The distance can be calculated by the following equation:
ρ v i , v p i = v i 1 2 a j i + b j i 1 2 b j i a j i ,
ρ v i , v p i = v i 1 2 a p i + b p i 1 2 b p i a p i ,
where a j i and b j i represent the values of the minimum and maximum in the classical domain, respectively, and a p i and b p i represent the values of the minimum and maximum in the segment domain, respectively, for criterion i.
Step 5: Calculate the synthetic correlation degree and determine the matter level.
The calculation of the synthetic correlation degree K j N k between each matter element and suitability class needs to be carried out according to the correlation degree ( K j v i ) and weight ( w i ) of each factor. The calculation method generally follows the weighted sum method, which can be expressed as follows:
K j N k = i = 1 n w i k j x i ,
where K j N k is the synthetic relational degree;   k j x i is the single correlation degree; and k j x i is the weight of each indicator. If K j k = m a x K j N k , j = 1 , 2 , , n , then matter element N k belongs to land suitability grade j.
Step 6: Land suitability index (LSI) calculation.
LSI data were computed in a manner similar to that of linear combination models [54,55]. The data can be gained after normalization using Equations (10) and (11):
x ¯ j k = x j k m i n x j k m a x x j k m i n x j k ,
L S I x j k = S m i n + S i n t · x ¯ x j k ,
where L S I x j k is a land suitability index with a result between 0–100, where larger values indicate a higher suitability; m a x x j k and m i n x j k are the maximum and minimum values of the synthetic relation degree for the same grade, respectively; S m i n is the minimum standardized values of a specific grade; and S i n t is the average of the minimum and maximum indices of the land suitability classes (see Table 1).
Step 7: Accuracy assessment.
To estimate the accuracy of the model, in this study, LSI was divided into four grades according to the FAO’s suitability assessment criteria. By comparing LSI values for different crop areas with the measured yields, the accuracy of the results can be determined by the determination coefficient ( R 2 ) between the LSI and the measured yield to determine the rationality of the current allocation for different crop areas.

2.3.2. Analytical Hierarchy Process (AHP)

An AHP method is used to determine suitability index weights and categories of suitability index values, which can thus transform qualitative data judged by experts into quantitative data [56,57]. The specific steps of the AHP are given as follows:
Step 1: Establish the judgment matrices.
In the criterion layer and the factor layer, respectively, the comparison discriminant matrix is constructed by a pairwise comparison method:
A = a i j n × n ,
where A is the discriminant matrix and a i j the quantized value of the importance of factor i relative to factor j, a j i = 1 / a i j , i j = 1 , 2 , , n . This quantized value requires consultation with several experts and value assignment according to an importance scale, from 1 to 9. Refer to Saaty’s work [56] for the selection of the scale and significance of the judgment matrix (Table 3).
Step 2: Calculate the eigenvectors and eigenvalue of the judgment matrix.
Calculation of the maximum eigenvalue root and eigenvalue vector is compared after the creation of matrix A. The eigenvectors w i (i.e., weights of the factors) and eigenvalue λ m a x can be calculated based on Equations (13) and (14), respectively:
w i = j = 1 n a i j n i = 1 n i = 1 n a i j n ,
λ m a x = 1 n · i = 1 n A W i w i ,
where i and j denote the number of rank and column of A, respectively.
Step 3: Consistency test.
Two consistency indicators (CI and CR) were used to test the consistency of the judgment matrix (see Equations (15) and (16)). If the number of index is <3, then w i is accepted when C I < 0.1 , and if the number of index is ≥3, then both CI and CR should pass the test.
C I = λ m a x n n 1 ,
C R = C I R I ,
where the value of RI can be referred to in Table 4, which is adapted from the study conducted by Lamya Neissi [57].

2.3.3. Classification Method of the Remote Sensing Data

At present, the emergence of different sensors provides a variety of data sources, and many methods of land use classification based on optical images have been proposed, including traditional supervised classification and unsupervised classification methods, as well as some new classification methods that have appeared in recent years, such as artificial neural network methods, fuzzy mathematics methods, decision tree methods, and random forest methods. These classification methods have greatly improved the accuracy of remote sensing classification results. Random forest methods feature strong antinoise, antiabnormal value, and high classification accuracy characteristics [54]. At the same time, these methods can process a large amount of data and do not easily support transition fitting [55]. Based on the above advantages, a random forest classifier was adopted to classify the cultivated land in this study.
In this study, the Sentinel-2 images selected four 10-m resolution bands of B2 (Blue), B3 (Green), B4 (Red), and B8 (NIR) as spectral features for the random forest classifier. We chose the interferometric wide swath (IW) imaging mode for Sentinel-1 images so as to ensure the same resolution. In order to classify crops more accurately, this research adopted two steps to classify crops.
Step 1: Divide cultivated land and noncultivated land. A random selection of 70% samples from 5 types of land objects, including woodland, water body, town, grassland, and arable land, was used as the training sample of random forest classifier; the number of classification features was set as the square root of the total number of variables. The total number of trees generated by random forest was continuously tested to find out the total number of trees with the best classification results; the remaining 30% samples were used to evaluate the accuracy of the generated classification results.
Step 2: The cultivated land area was extracted from the classification results of the first step, and the classification method of maize, rice, and soybeans was the same as that of the first step.

2.3.4. Method of Planting Structure Optimization

According to the actual average yields of different crops in different suitability grades, the planting structures of crops were analyzed in the study area such that the production in the study area could be maximized and, thus, the optimal data for the planting structure in the study area could be obtained. The final unit yield value is given based on the statistical data of Jilin Province from the Price Department of National Development and Reform Commission. The final unit yield values of different crops were obtained by subtracting production costs and labor costs from the total output value and production subsidies, and then the net profit per unit yields for different crops were obtained. The specific formula for the process is given as follows:
Y e n d = Z y i e l d · X p r i c e + X s u b s i d y X c o p + X c o h ,
Y n p = Y e n d Z y i e l d ,
where Y e n d (yuan/ha) is the final production value per hectare; Y n p (yuan/kg) is the net profit per unit of output; Z y i e l d (kg/ha) is the average yield per hectare; X p r i c e (yuan/kg) is the unit price of different crops in Jilin Province in 2018; X s u b s i d y (yuan/ha) is the price of a producer subsidy, which is the provincial average; and X c o p and X c o h (yuan/ha) represent the production and labor costs, respectively.

3. Results

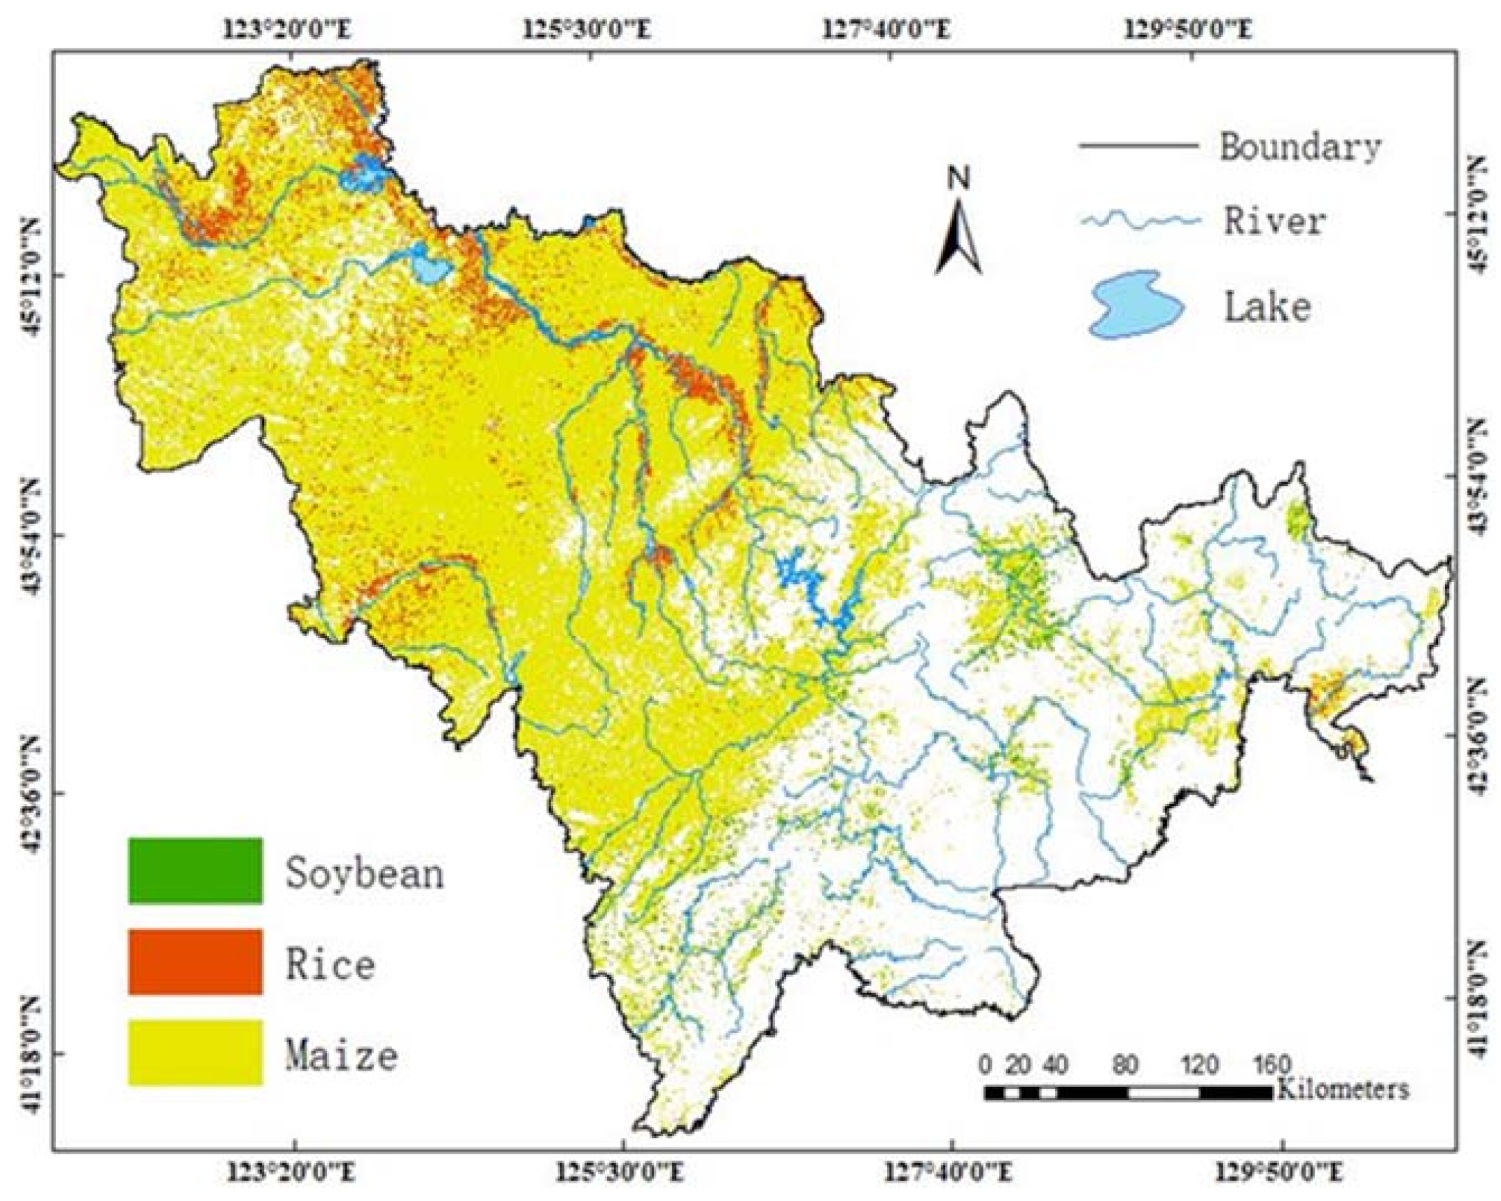
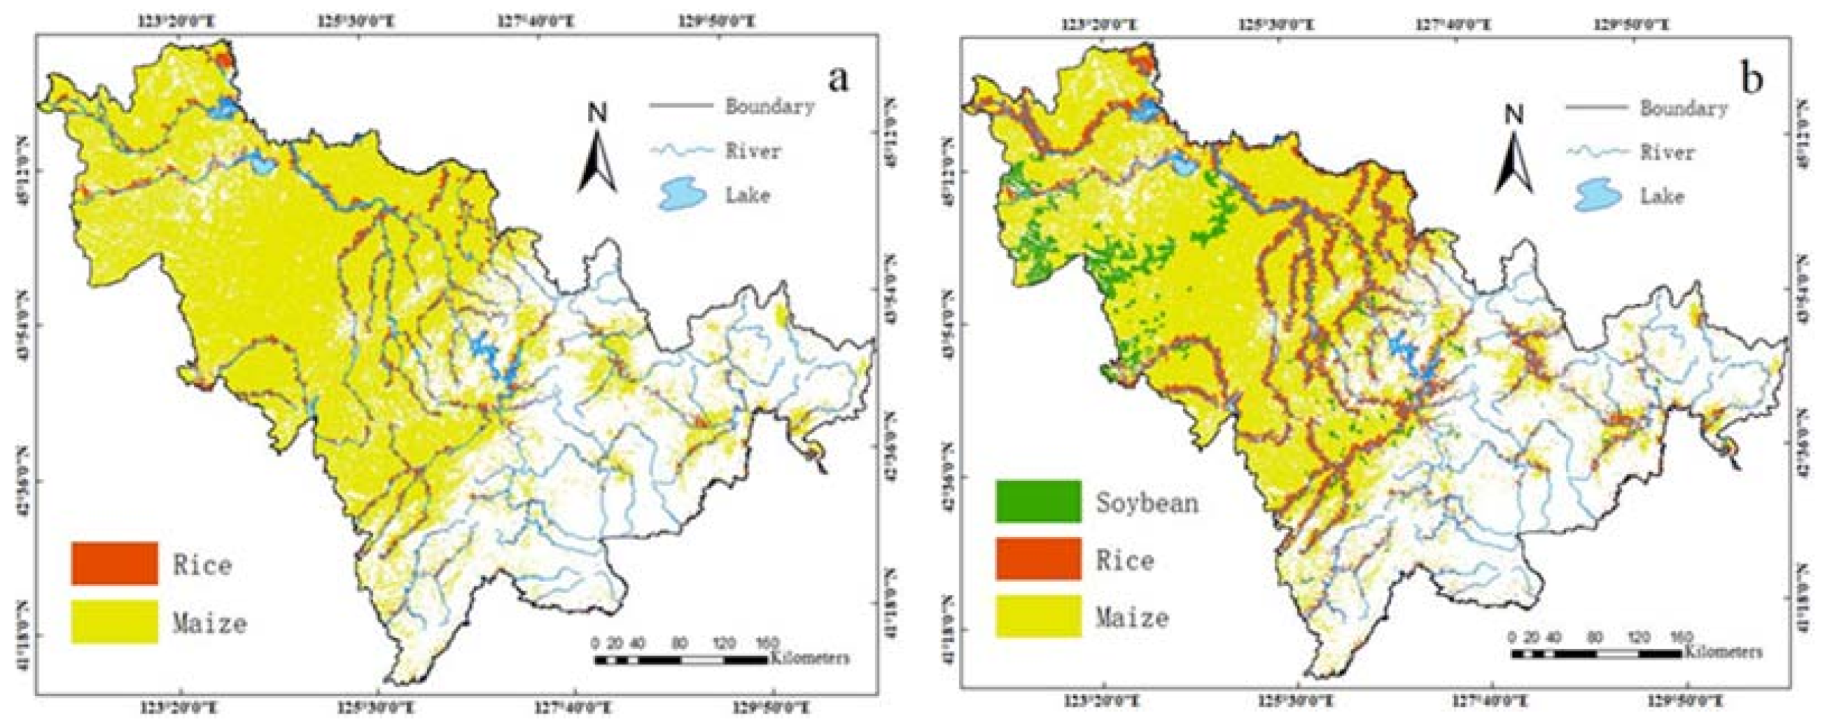
3.1. The Mapping of Different Crops

Traditional methods are limited in agricultural monitoring due to their poor accuracy and low efficiency, while remote sensing data have been widely used in agricultural pro-duction because of their characteristic wide ranges, high time resolution, and large amounts of information. In this study, with the support of the GEE cloud platform, different ground objects were classified first, and then different cultivated land were classified, which greatly improved classification accuracy. The classification was satisfactory (Table 5 and Figure 4), and the overall classification accuracy for different cropland areas was 95.33%. The research shows that the combination of optical and radar images can not only support full use of the spectral information in an optical image but also make full use of the characteristics of the change of the backscattering coefficient for a radar image, and the classification result is consequently better than that generated by a single data source. The random forest classifier can obtain land use classification results with high precision and effectively identify distributions of different crops, which provides technical support for agricultural mapping via remote sensing.

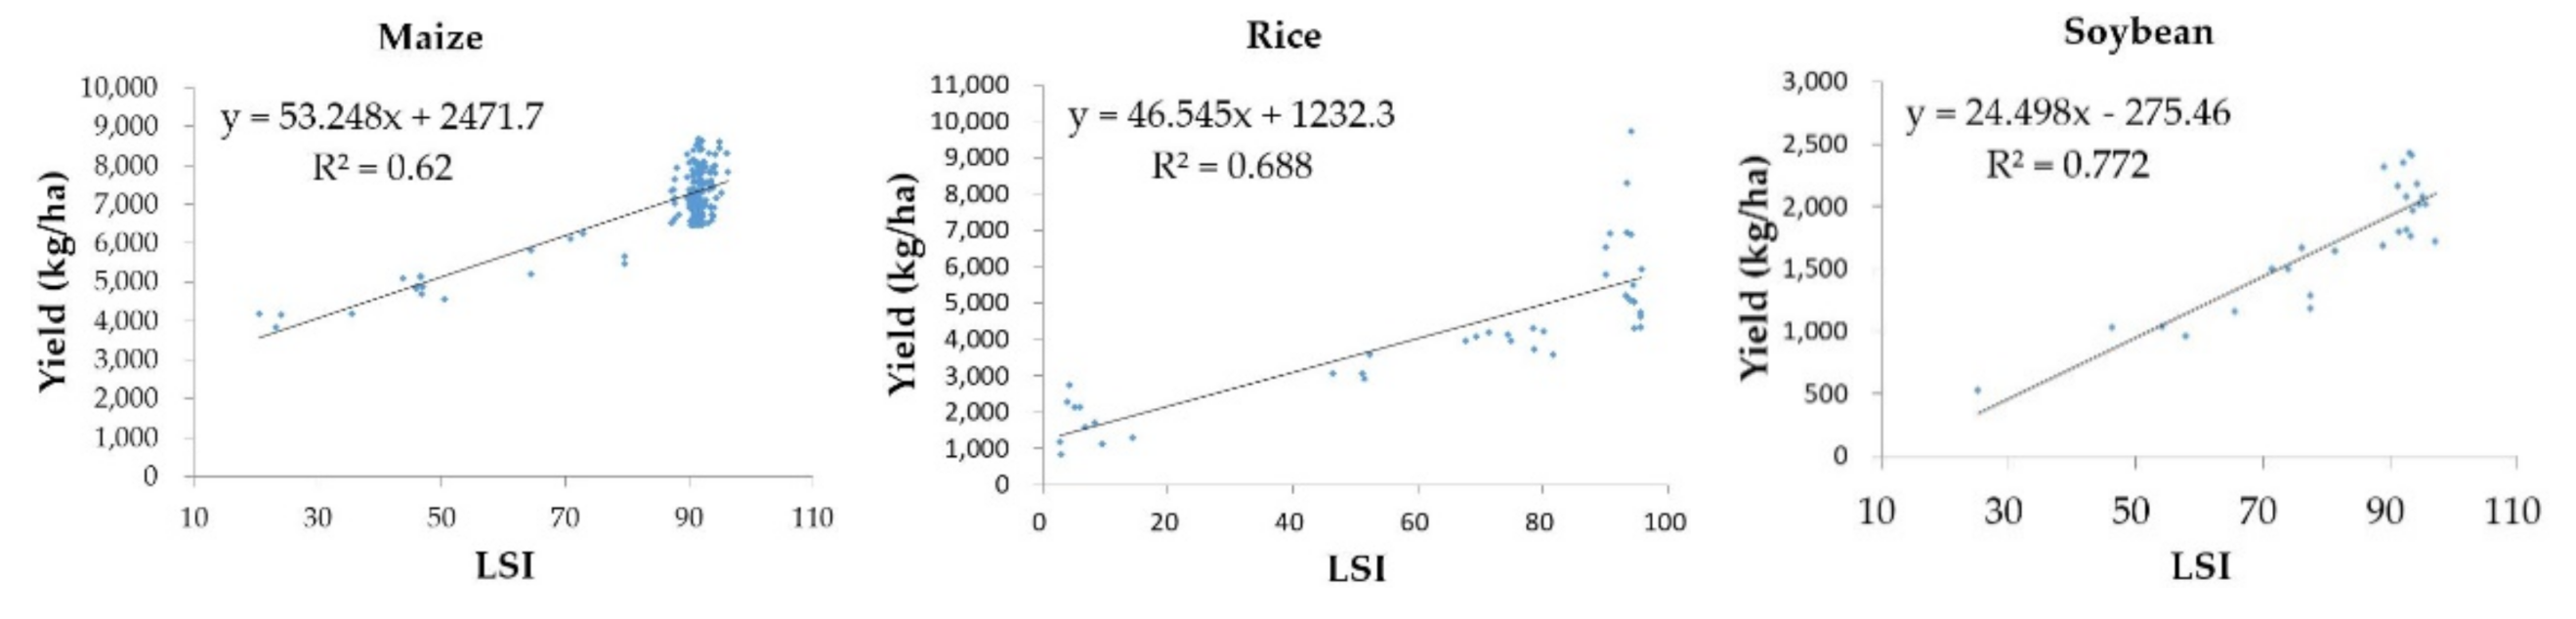
3.2. Implementation of Land Suitability Assessment

Since the selected indicators were not equally important for the growth of maize, rice, and soybeans, with the help of experts, calculated conformance ratios can be a good way to assign weights to criteria with an AHP model. This method systematically integrates heterogeneous data and measures any inconsistencies in the evaluation [58], which effectively solves the problem of reasonable weight distribution for the influencing factors. Our results show consistency ratio values for maize, rice, and soybeans of 0.0326, 0.0483, and 0.0487, respectively, which fall below the threshold value of 0.1 [58], indicating a high level of consistency. Hence, the obtained weights of the criteria were acceptable.
The land suitability evaluation of maize, rice, and soybeans has been realized in Jilin Province via MEA (Figure 5), namely, in terms of high suitability (S1), moderate suitability (S2), marginal suitability (S3), and unsuitability (N). MEA is based on extension mathematics and fuzzy mathematics and quantifies qualitative and quantitative factors through membership degrees to ensure the integrity of information. MEA effectively avoids the influence of subjectivity in the membership function calculation [59]. From the perspective of space, the highly, moderately, and marginally suitable areas of rice are mainly distributed near rivers. In these areas, water sources are sufficient, which is beneficial to rice cultivation. Highly suitable areas of maize and soybean cultivation are mainly distributed in the central plains and the eastern mountainous area of Jilin Province. Moderately suitable areas of maize cultivation are scattered throughout Jilin Province, while moderately suitable areas of soybean cultivation are mainly distributed in the western part of Jilin Province. As for the areas with marginal suitability and unsuitability, maize areas are mainly distributed in the western region of Jilin Province, while soybean areas are distributed in the central and eastern regions. In order to evaluate the accuracy of the model, the LSI data were analyzed with the measured yields of the three crops via linear regression analysis (Figure 6). The results show that the result of the AHP–MEA has high precision. For the evaluation of the data, it was determined that for the yield of maize,   R 2 = 0.626 , for the yield of soybean,   R 2 = 0.772 , and for the yield of rice, R 2 = 0.688 . The areas of the three crops, with different suitability grades, varied greatly, as shown in Figure 7.

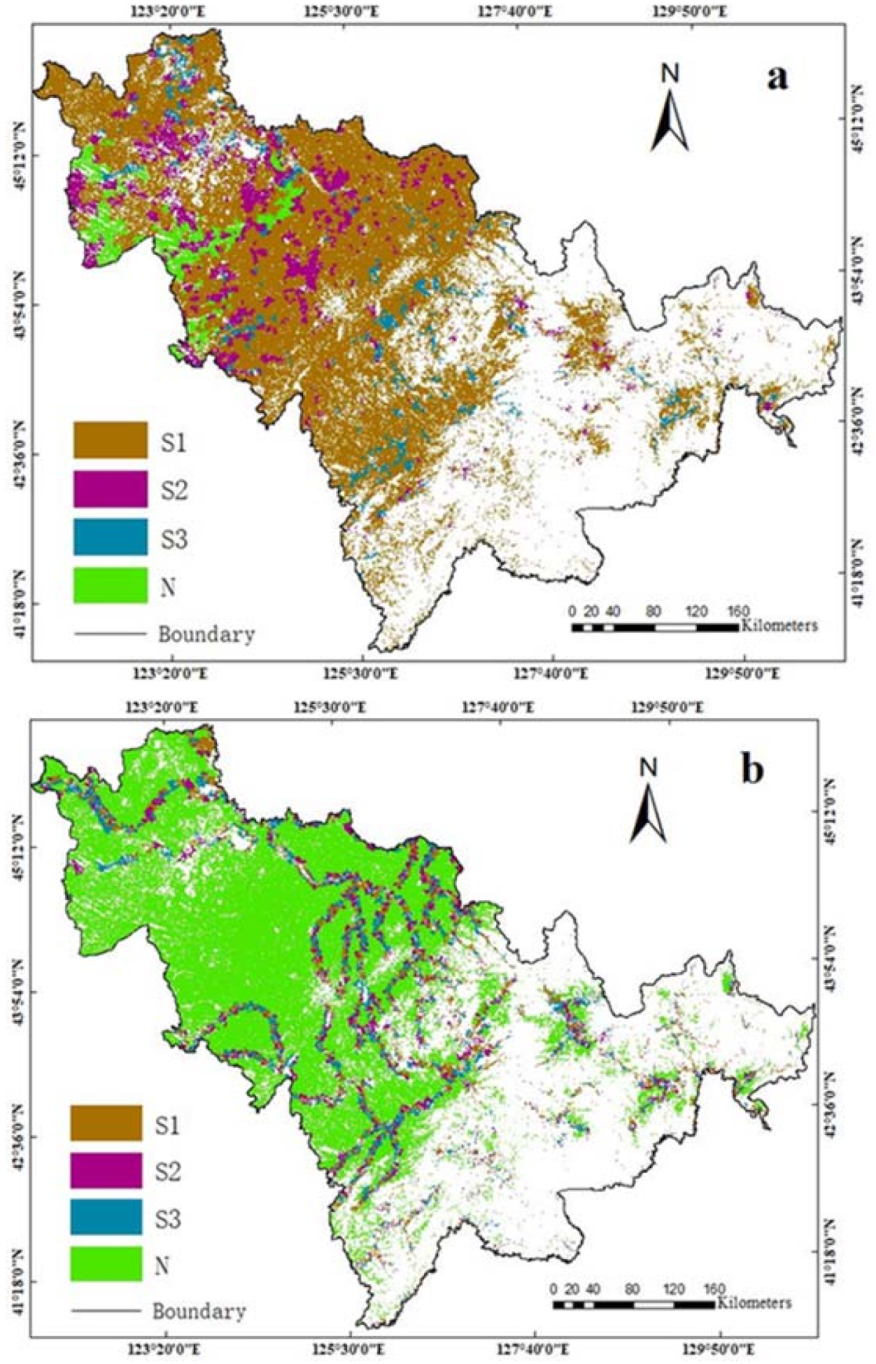
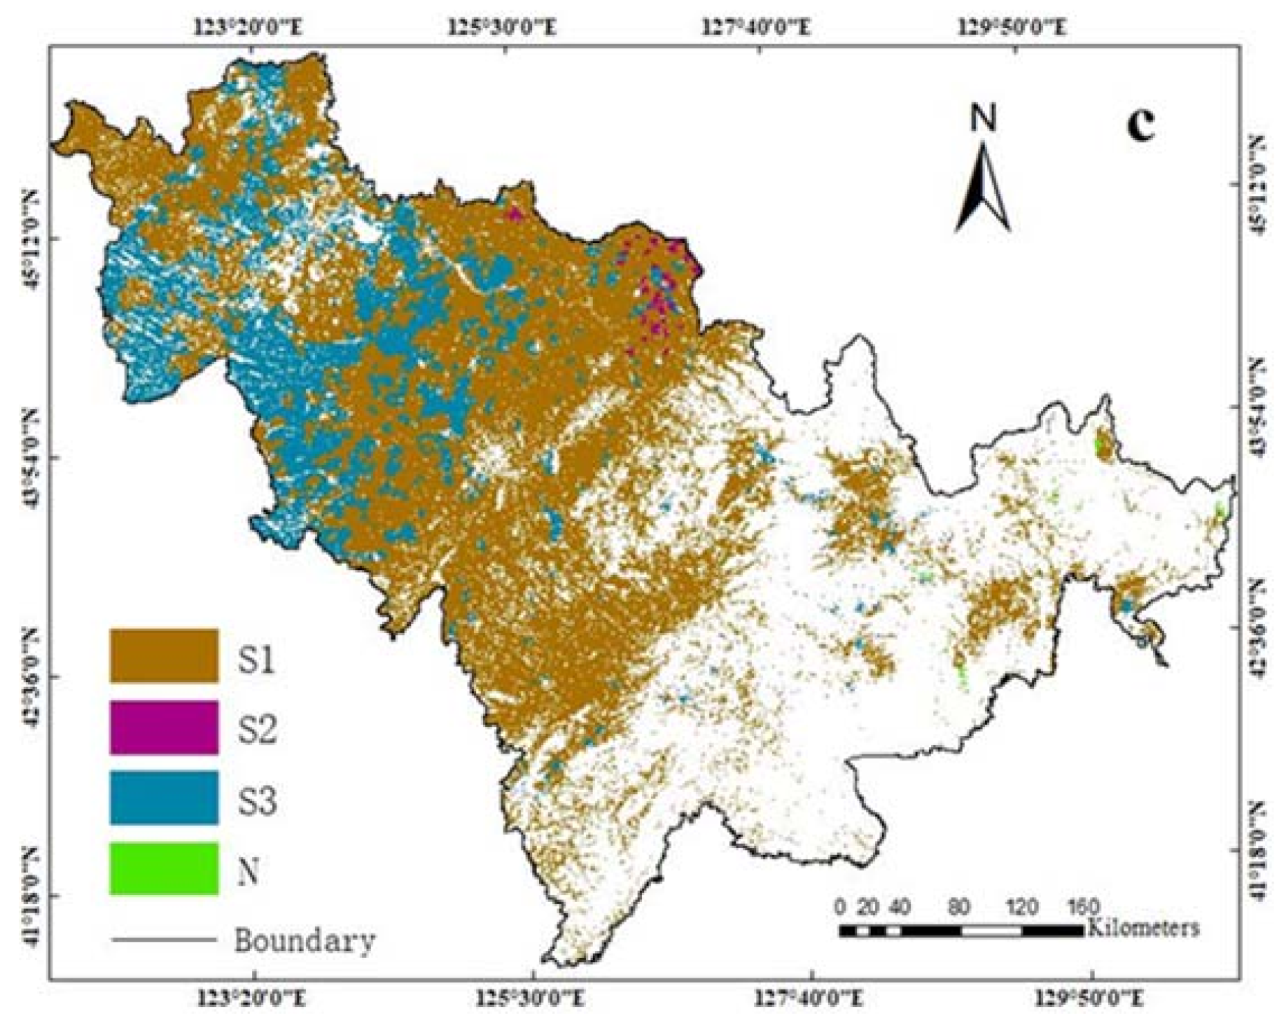
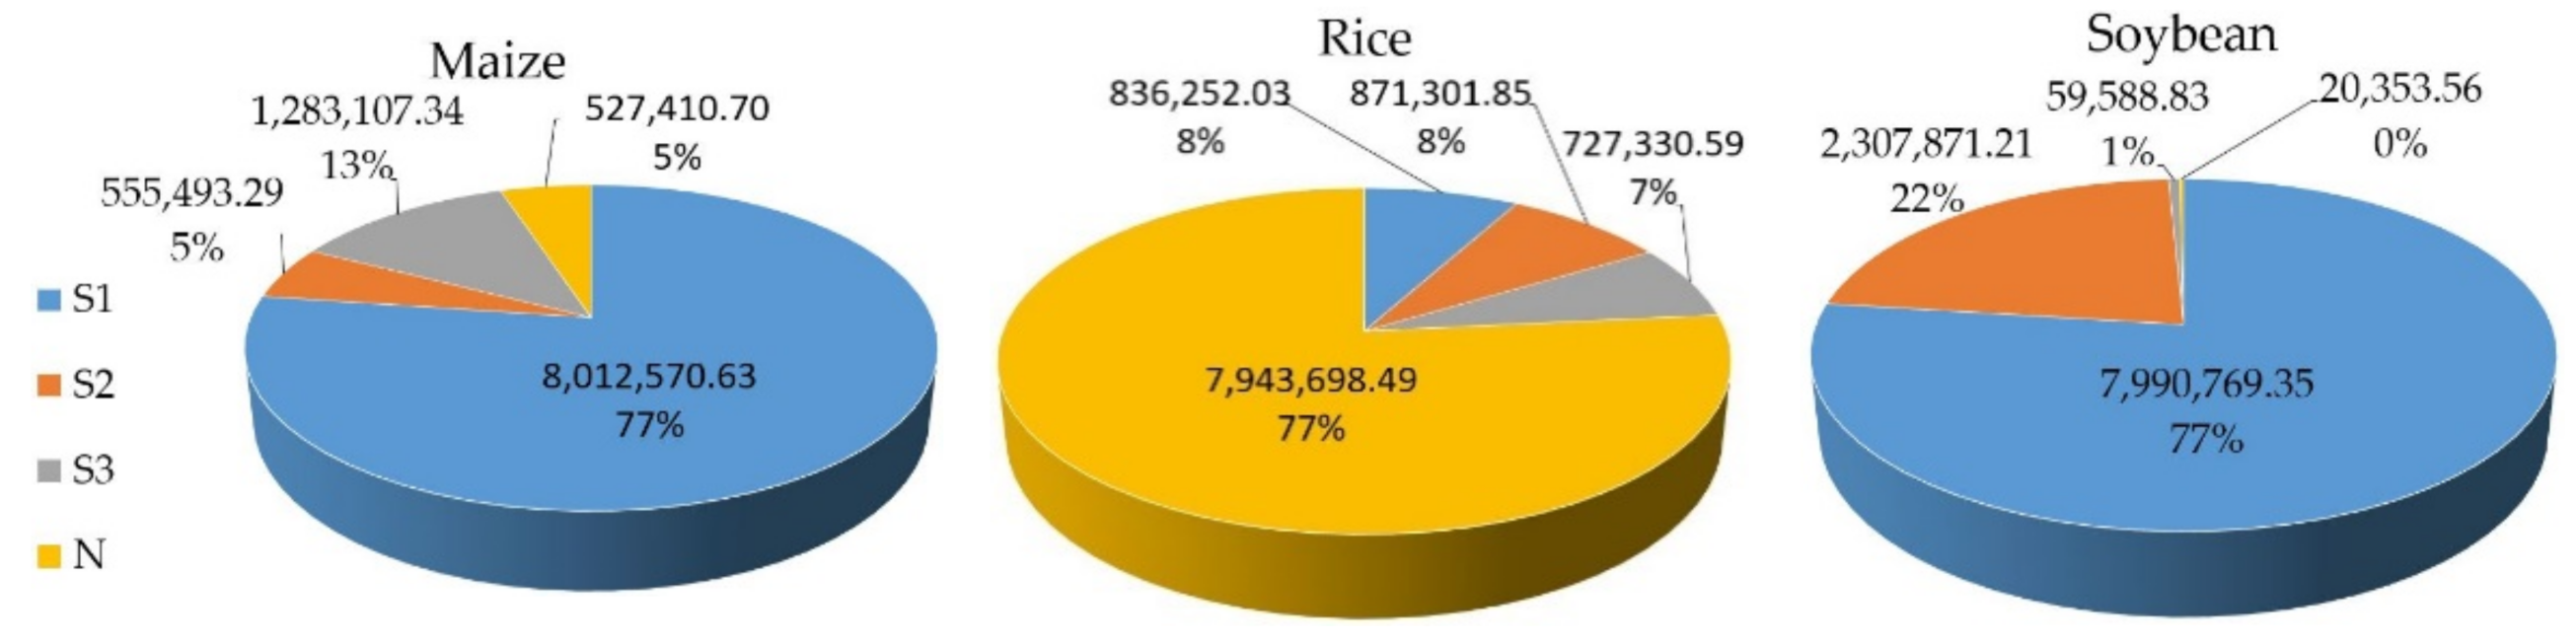
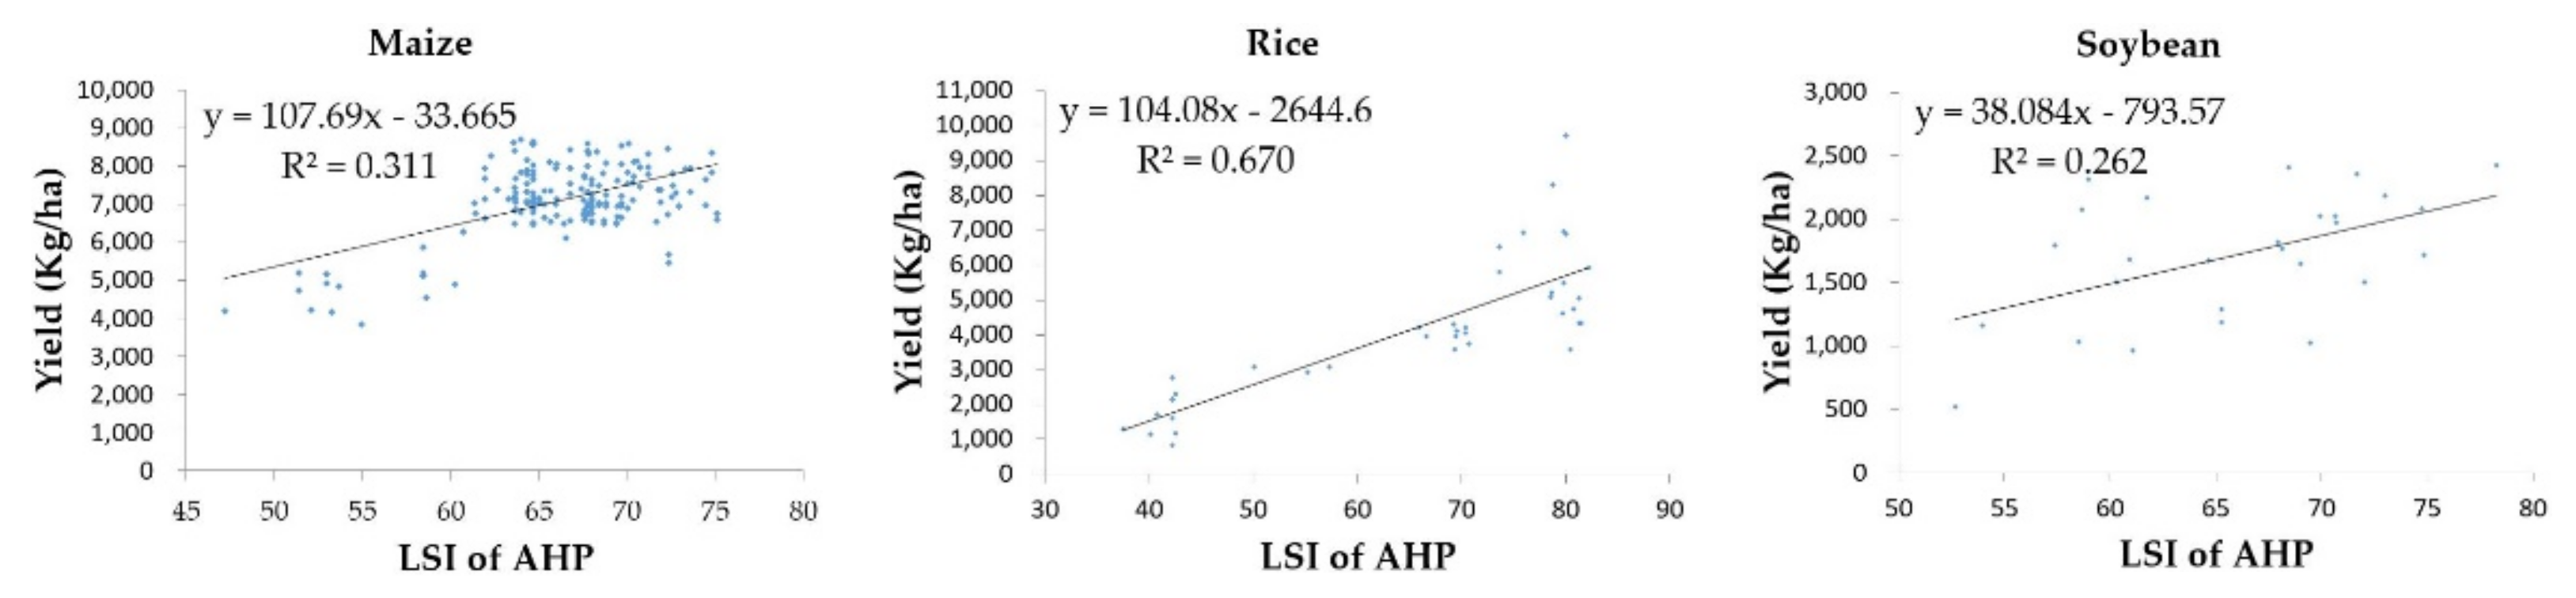
3.3. Suitability Analysis Results

Through the analysis of each influencing factor (Figure 2) and the suitability results for different croplands (Figure 4), it was found that topographic and soil fertility factors have relatively small degrees of influence, while climatic conditions, water resources, and soil texture are the main factors affecting the planting structure in this region. The influence of each factor is relatively accurate in terms of the result for agricultural planting suitability.

3.3.1. Climatic Suitability

In terms of climatic conditions, the temperature is suitable for the growth of crops in Jilin Province, although not to a high degree of suitability for crop growth but close to it. The average temperature in the midwestern area of the region is significantly higher than in the east, and there is no land that is unsuitable for growing crops. Regarding this criterion, precipitation becomes the main factor limiting the growth of crops, and insufficient and uneven precipitation is typical in this region. From the southeast to the northwest, the precipitation gradually decreases, and the precipitation is also obviously insufficient in the northeast, where 55.68% of areas feature less than 600 mm/year of precipitation; inhospitable areas for maize and rice cultivation are mainly distributed in this range, although the low precipitation has little effect on soybean growth [39]. As a result, either soybean or agriculture with water-saving irrigation is suitable for the area.

3.3.2. Topographic Suitability

Topographic suitability is mainly determined by the effect of the ground slope in terms of crop planting; however, this study is based on the analysis of existing cultivated land, and the terrain is relatively flat, so there are few areas unsuitable for growing crops. Only 3.90% of the area in the province is unsuitable for planting maize and soybeans, and 5.19% of the area is unsuitable for planting rice, located at the Dahei Mountains in the center of Jilin Province and the Changbai Mountains in the southeast. Combined with the influences of other factors, maize and soybeans are also highly or moderately suitable for cultivation, but rice has greater suitability in the region. Water resources are a major constraint on rice cultivation, and 23.55% of the area is within 3 km of a water system. In order to save water resources, rice can be planted in flat areas close to water resources [39]. Thus, an ecological balance can be maintained, and sustainable agricultural development can be realized.

3.3.3. Soil Nutrient Suitability

Soil fertility factors include pH, OC, TN, and AP; AK, pH, and OC have great effects on crop planting within the optimized farmland. Most of the maize, rice, and soybean areas are in a pH suitability zone, where they take up 70.15%, 82.71%, and 81.82% of the total cultivated land, respectively. These areas are mainly distributed in the central and western regions of Jilin Province, where the cultivated soil is weakly alkaline, along with sparse areas in the east. The OC content is especially suitable for planting crops in cultivated soil, and the content in the region is above 0.5%. The highly suitable areas are distributed in the central plains and the mountainous areas in the east, and the climate and pH conditions are suitable for the development of diverse soil microorganisms in this region [60,61], with proportions of 69.18%, 69.18%, and 83.35%, respectively. Moderate and marginal suitability areas are mainly distributed in the southwestern plains region of the province. The contents of TN, AP, and AK are all higher there, where only 9.18% and 22.60% of areas are not suitable for maize and soybean planting due to the TN level; all areas are suitable for rice. Only 4.61% and 1.97% of the AP areas are unsuitable for maize and soybean cultivation; however, 35.33% of the area is currently unsuitable for rice cultivation. Regarding AK, maize is in great demand, and 52.29% of the area is currently unsuitable for maize cultivation. Only 8.41% is suitable for soybeans, and rice is completely suitable. The currently unsuitable areas are all distributed in the western plains region of Jilin Province, but there are relatively high levels in other areas. Through analysis, it was found that soil fertility has relatively little influence on agricultural planting and growth in Jilin Province. Although the contents of TN, AP, and AK are low in some areas, the contents of OC are relatively high, which is beneficial to the growth of crops.

3.3.4. Soil Type Suitability

Soil texture plays an important role in planting structure. The main reason for this is that different crops have different growth requirements [12]. The proportions of soil texture for maize, rice, and soybeans in the total cultivated land area were 90.60%, 8.22%, and 84.17%, respectively. The effect of drainage capacity on the planting of the three crops is small, and the proportions of highly suitable areas in the cultivated land area are large and the differences are small. This indicates that soil texture is one of the main limiting factors for crop cultivation in the area. Drainage capacity has little influence on the planting of the three crops, and the proportions of highly suitable areas in the cultivated land area are large and the differences are small. This indicates that soil texture is one of the major limiting factors for crop cultivation in the region.

4. Discussion

4.1. Comparison and Discussion on Land Suitability Evaluation Methods

In order to evaluate the performance of the AHP–MEA model, it was compared with an AHP-alone model. The coefficient of determination ( R 2 ) between the land suitability index data and the yields of maize, rice, and soybeans were calculated using the AHP model (Figure 8). Compared with the results of the AHP–MEA model, the results showed that the accuracy of the rice land suitability evaluation results obtained by the AHP model was higher ( R 2 = 0.670 ), but the accuracy was also slightly lower than that of the AHP–MEA model. The accuracy of maize ( R 2 = 0.311 ) and soybean ( R 2 = 0.262 ) land suitability evaluations was much lower than that of the AHP–MEA model. Therefore, the land suitability evaluation featured higher accuracy when using the AHP–MEA model. The results show that the AHP-MEA model is effective for evaluating land suitability. In the evaluation process, evaluation factors such as the climate, soil, and slope need to be taken into account simultaneously, and the influences of these factors on land suitability are not equal [62]. In this study, the weights of influencing factors were allocated well with the AHP–MEA model, indicating that the AHP model can systematically integrate different data and that it is a very effective method for determining weights, which is widely used in various studies [12,19,24,35]. At the same time, it is shown that MEA based on extension mathematics can classify a problem as compatible or incompatible, integrate qualitative and quantitative information, and quantify a problem by the degree of correlation. Compared with the traditional land suitability evaluation method, the AHP–MEA evaluation results are more objective and accurate, and regional scale analysis of each land unit can be carried out to find the influence of each evaluation factor on the suitability of different crops. Finally, the method is easy to understand and can be calculated using basic software such as MATLAB or Python, which is much simpler than other methods.

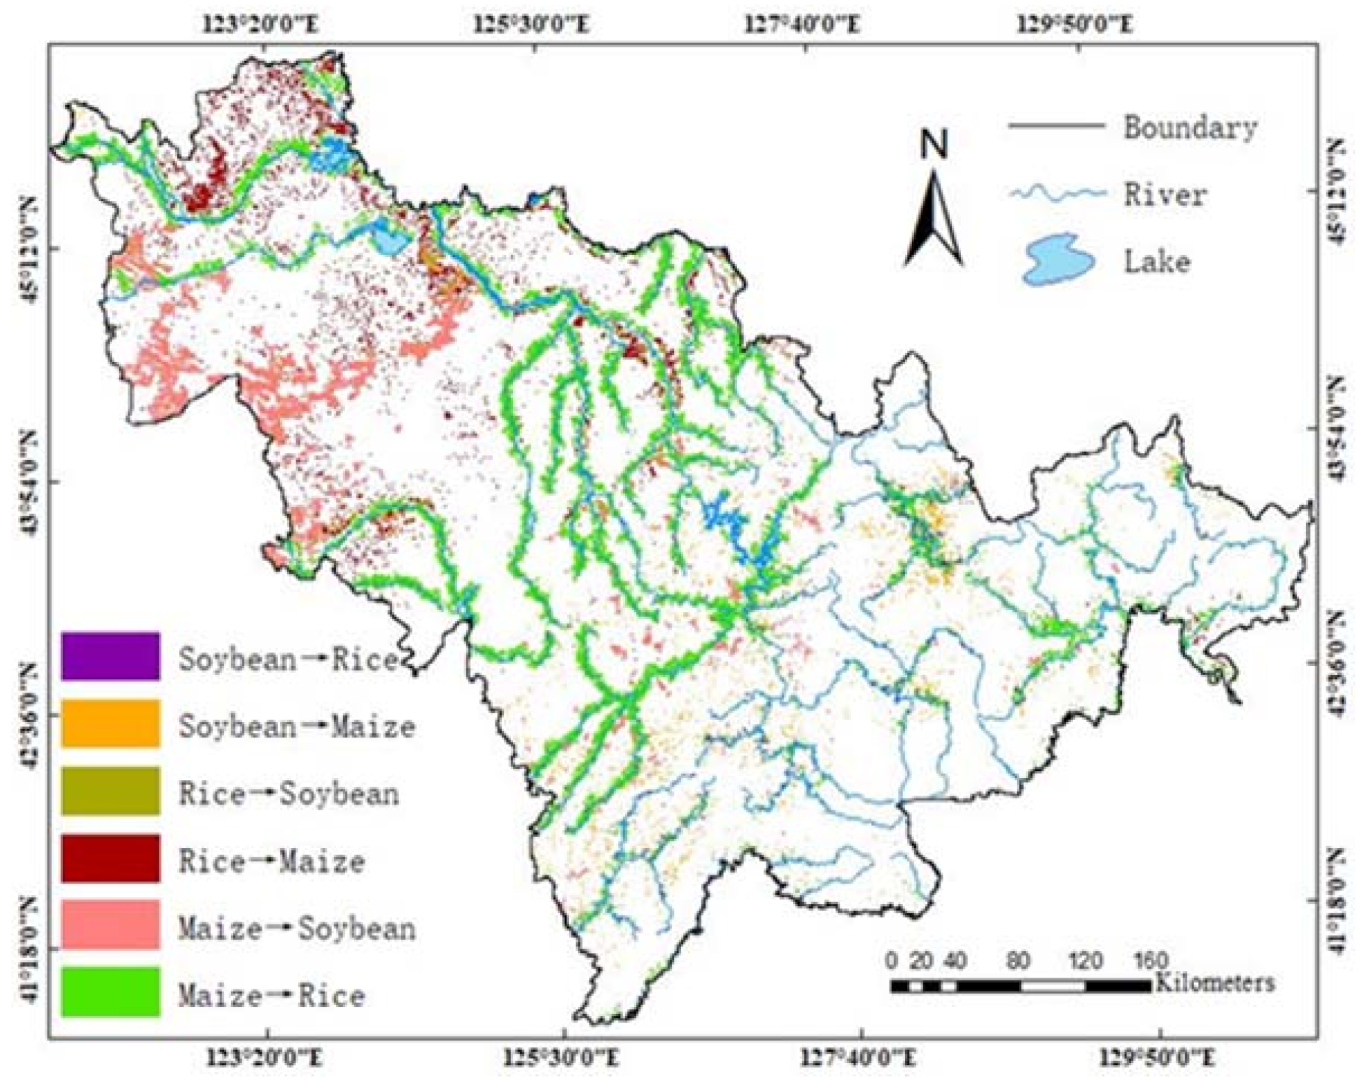
4.2. Analysis of Spatial Planting Structure

4.2.1. Discussion of Different Planting Structures

There are large differences in the yields and prices of maize, rice, and soybeans. It is necessary to optimize the land use of the three crops such that the agricultural production value of Jilin Province can reach a maximum. According to the estimation of the actual yields of maize, rice, and soybeans, the actual yields were divided into four grades based on the LSI data, and the average yields for crops in each grade were used to represent the yields of that grade (Table 6). According to the data for maize, rice, and soybeans in Jilin Province in 2019, as published by the Price Department of National Development and Reform Commission (Table 7), the spatial planting structures of the three crops are analyzed here.
Through the analysis of different spatial planting structures (Table 8 and Figure 9), it was found that with Spatial Planting Structure 1, which only considered crop yield and price, the output would rise by 3.27 billion yuan compared with the existing planting structure. There are no suitable planting areas for soybeans, and the main reason for this is that the soybean yields are far lower than maize and rice, the production costs are high, and the entailing field management is complex. China has introduced a grain subsidy policy to boost farmer incomes and encourage the growth of soybeans. This is a policy that, along with farmer profit maximization, has led to more farmers choosing to grow soybeans. Therefore, Spatial Planting Structure 2, which takes producer subsidies and costs into account, can reflect the wishes of farmers and the increase in the agricultural output value of the region better, reaching 12.44 billion yuan more than the total output value for Spatial Planting Structure 1. Through the comparative analysis of Planting Structure 1 and Planting Structure 2, it can be found that Jilin Province, a province in the “golden maize belt”, is suitable for maize cultivation in most areas, and the yields of maize would be high. Rice is mainly distributed in the vicinity of rivers and lakes, but the area for Planting Structure 2 is 1.35 million ha larger than that of Planting Structure 1, and the increased area is mainly distributed in the vicinity of rivers and lakes. In this way, water resources can be fully utilized [63]. With Planting Structure 2, soybeans are mainly distributed in the western part of Jilin Province, which is adjacent to Inner Mongolia. The region features strong wind and sand deposition in spring, resulting in serious soil desertification and poor fertility. There are also a few areas suitable for soybean planting in the eastern mountainous area of Jilin Province. Ground slope is the main factor limiting the planting of maize in these areas. A study has shown that areas with a larger slope are more suitable for soybean cultivation [16]. In these regions, maize yields are far lower than in other regions, and the output value is lower than that of soybeans after food subsidies. Therefore, soybean cultivation is more suitable in these regions, which is conducive to the increase of the total output value of grain in Jilin Province. At the same time, planting different crops can realize the rational utilization of land resources and water resources, which is conducive to the sustainable development of agriculture.

4.2.2. Adjustment of the Existing Planting Structure

Through the comparison and analysis of the existing planting spatial structure and the optimal planting spatial structure (Planting Structure 2) in Jilin Province, it can be found that there is some irrationality in the planting structure of cultivated land in Jilin province at present. As seen in Figure 10, in areas rich in water resources, more maize is planted in the central and western parts of Jilin Province, and more soybeans are planted in the eastern part. These studies show that rice should be planted in areas rich in water resources, which is conducive to the full utilization of water resources. In the southwest of Jilin Province, there is relatively little precipitation, relatively insufficient water resources, and poor soil quality; the region is adjacent to Inner Mongolia. Soil desertification is not conducive to the growth of maize, but it is suitable for the cultivation of soybeans. In practice, it has also been found that the quality of maize grown in this area is poor. Therefore, it would be ideal to cultivate soybeans in this area. At present, large areas of rice are planted in the northwest of Jilin Province; however, due to the lack of water resources, irrigation water mainly comes from groundwater, which is not conducive to the sustainable use of agriculture and resources. Therefore, the region needs to reduce the planting of rice in these areas. Although the planting areas changed greatly before and after optimization (Table 9), the utilization of resources is more reasonable, and the agricultural output value also improves greatly. The output value after optimization increased by 15.71 billion yuan compared with that before optimization. Therefore, based on the suitability for different crops, the rational utilization of land and water resources is realized here, and the planting space structure is optimized in order to provide a reliable basis for increasing agricultural production and income in the region.
In this paper, based on the natural conditions of crop growth, the crop planting structure is optimized in Jilin Province, and the results are good. Not only have optimal planting areas for different crops been determined, but a theoretical basis for the development of the agricultural economy in Jilin Province has also been provided. However, there are some deficiencies in this paper. As a major factor in agricultural production, river discharge has not been taken into account here. In Jilin Province, the crop planting season (the period with the highest water demand) is the dry season for rivers. Meanwhile, this paper also lacks the influence of population density on the planting and production of different crops, as the planting and management of rice require a high level of human resources. Therefore, these reasons make it more suitable to grow rice in large quantities near rivers. In future studies, more practical and social factors regarding crop suitability need to be considered.

5. Conclusions

The factors affecting land suitability are complex and varied, and the aspects of each factor are also different. Remote sensing provides a fast and reliable method for rapid and reliable factor acquisition. A multifactor land suitability evaluation method that can provide theoretical support for the rational utilization of land and water resources and the sustainable development of agriculture has been studied here. The AHP–MEA model studied in this paper can overcome the indeterminacy and subjectivity inherent in other methods and models. The feasibility of the model has been proven by analyzing the suitability of land use for maize, rice, and soybean cultivation in the study area, which confirmed that the model presented here is a reliable method for solving similar problems.
The results for the suitability evaluation of maize, rice, and soybeans showed that 5% and less than 1% of cultivated land is unsuitable for maize and soybean cultivation, respectively, and the main limiting factors here were the pH, TN, AP, and soil texture. However, fertilization can eliminate these limitations and increase cultivation suitability for various crops. The average annual precipitation in the study area is 400–600 mm, surface water resources are scarce, and there are significant seasonal and regional differences, which are the main reasons for the limitation of rice cultivation.
Based on the agricultural economic data for the study area, the spatial planting structure optimization research shows that the planting structure has some irrationality in the study area. Soybeans should be planted in the western part of the study area with poor soil quality, rice should be planted in the area with rich surface water resources, and a large amount of maize should be planted in the rest of the areas. The areas for different crops changed greatly before and after optimization: the area for maize cultivation decreased by 1.95 million ha, and that of rice and soybeans increased by 1.51 million ha and 0.44 million ha, respectively. The optimized planting structure was more reasonable, and gross agricultural product increased by 15.71 billion yuan. The structure provides a reliable basis for the rational utilization of land and water resources and the sustainable development of agriculture in this study area, consequently providing a theoretical basis for the optimization of spatial planting structures in other areas.

Author Contributions

Conceptualization, S.C. and C.H.; methodology, C.H.; software, C.H.; validation, S.C. and C.H.; formal analysis, Y.Y.; investigation, Y.Y. and X.X.; data curation, B.Z.; writing—original draft preparation, C.H.; writing—review and editing, C.H.; visualization, Z.X. and Z.W. All authors have read and agreed to the published version of the manuscript.

Funding

This research received no external funding.

Institutional Review Board Statement

Not applicable.

Informed Consent Statement

Not applicable.

Data Availability Statement

Not applicable.

Conflicts of Interest

The authors declare no conflict of interest.

References

  1. Food and Agriculture Organization (FAO). A Framework for Land Evaluation; FAO Soils Bulletin, 32; Food and Agriculture Organization: Rome, Italy; International Institute for Land Reclamation and Improvement: Wangeningen, The Netherlands, 1976. [Google Scholar]
  2. Collins, M.G.; Rushman, F.R.S.J. Land-use suitability analysis in the United States: Historical development and promising technological achievements. Environ. Manag. 2001, 28, 611–621. [Google Scholar] [CrossRef] [PubMed]
  3. Mendas, A.; Delali, A. Integration of multi-criteria decision analysis in GIS to develop land suitability for agriculture: Application to durum wheat cultivation in the region of Mleta in Algeria. Comput. Electron. Agric. 2012, 83, 117–126. [Google Scholar] [CrossRef]
  4. Fontes, M.P.F.; Fontes, R.M.O.; Carneiro, P.; Cio, A.S. Land suitability, water balance and agricultural technology as a Geographic-Technological Index to support regional planning and economic studies. Land Use Policy 2009, 26, 589–598. [Google Scholar] [CrossRef]
  5. Kazemi, H.; Sadeghi, S.; Akinci, H. Developing a land evaluation model for faba bean cultivation using geographic information system and multi-criteria analysis (A case study: Gonbad-Kavous region, Iran). Ecol. Indic. 2016, 63, 37–47. [Google Scholar] [CrossRef]
  6. Falasca, S.L.; Ulberich, A.C.; Ulberich, E. Developing an agro-climatic zoning model to determine potential production areas for castor bean (Ricinus communis L.). Ind. Crops Prod. 2012, 40, 185–191. [Google Scholar] [CrossRef]
  7. Baroudy, A.A.E. Mapping and evaluating land suitability using a GIS-based model. Catena 2016, 140, 96–104. [Google Scholar] [CrossRef]
  8. Gowda, J.V.; Anilkumar, S.N.; Sathish, A.; Parama, V.R.R. Soil fertility mapping, land suitability assessment for suggesting maize and pomegranate crops in Hosakere micro-watershed of Davanagere district, Karnataka. J. Soil Water Conserv. 2018, 17, 75–82. [Google Scholar] [CrossRef]
  9. Hoseini, Y.; Kamrani, M. Using a fuzzy logic decision system to optimize the land suitability evaluation for a sprinkler irrigation method. Outlook Agric. 2018, 47, 298–307. [Google Scholar] [CrossRef]
  10. Abd-Elmabod, S.K.; Muoz-Rojas, M.; Jordán, A.; Anaya-Romero, M.; Phillips, J.D.; Jonesh, L.; Zhang, Z.; Pereira, P.; Fleskens, L.; van der Ploeg, M.; et al. Climate change impacts on agricultural suitability and yield reduction in a Mediterranean region. Geoderma 2020, 374, 114453. [Google Scholar] [CrossRef]
  11. Dong, Z.; Pan, Z.; Wang, S.; An, P.; Zhang, J.; Zhang, J.; Pan, Y.; Huang, L.; Zhao, H.; Han, G.; et al. Effective crop structure adjustment under climate change. Ecol. Indic. 2016, 69, 571–577. [Google Scholar] [CrossRef]
  12. Zhang, J.Q.; Su, Y.R.; Wu, J.S.; Liang, H.B. GIS based land suitability assessment for tobacco production using AHP and fuzzy set in Shandong province of China. Comput. Electron. Agric. 2015, 114, 202–211. [Google Scholar] [CrossRef]
  13. Wanyama, D.; Mighty, M.; Sim, S.; Koti, F. A Spatial Assessment of Land Suitability for Maize Farming in Kenya. Geocarto Int. 2019, 11, 1–18. [Google Scholar] [CrossRef]
  14. Jahanshiri, E.; Nizar, N.M.M.; Suhairi, T.A.S.T.M.; Gregory, P.J.; Mohamed, A.S.; Wimalasiri, E.M.; Azam-Ali, S.N. A Land Evaluation Framework for Agricultural Diversification. Sustainability 2020, 12, 3110. [Google Scholar] [CrossRef] [Green Version]
  15. Najafabadi, M.M.; Ziaee, S.; Nikouei, A.; Borazjani, M.A. Mathematical programming model (MMP) for optimization of regional cropping patterns decisions: A case study. Agric. Syst. 2019, 173, 218–232. [Google Scholar] [CrossRef]
  16. Zolekar, R.B.; Bhagat, V.S. Multi-criteria land suitability analysis for agriculture in hilly zone: Remote sensing and GIS approach. Comput. Electron. Agric. 2015, 118, 300–321. [Google Scholar] [CrossRef]
  17. Bennett, R.; Oosterom, P.; Lemmen, C.; Koeva, M. Remote Sensing for Land Administration. Remote. Sens. 2020, 12, 2497. [Google Scholar] [CrossRef]
  18. Ceballos-Silva, A.; Lopez-Blanco, J. Delineation of suitable areas for crops using a Multi-Criteria Evaluation approach and land use/cover mapping: A case study in Central Mexico. Agric. Syst. 2003, 77, 117–136. [Google Scholar] [CrossRef]
  19. Pilevar, A.R.; Matinfar, H.R.; Sohrabi, A.; Sarmadian, F. Integrated fuzzy, AHP and GIS techniques for land suitability assessment in semi-arid regions for wheat and maize farming. Ecol. Indic. 2020, 110, 105887. [Google Scholar] [CrossRef]
  20. Said, N.; Henning, B.; Joachim, H. Digital Mapping of Soil Properties Using Multivariate Statistical Analysis and ASTER Data in an Arid Region. Remote. Sens. 2015, 7, 1181–1205. [Google Scholar]
  21. Vincent, D.R.; Deepa, N.; Elavarasan, D.; Srinivasan, K.; Chauhdary, S.H.; Iwendi, C. Sensors Driven AI-Based Agriculture Recommendation Model for Assessing Land Suitability. Sensors 2019, 19, 3667. [Google Scholar] [CrossRef] [Green Version]
  22. Ferguson, C.A.; Bowen, R.L. Statistical evaluation of an agricultural land suitability model. Environ. Manag. 1991, 15, 689–700. [Google Scholar] [CrossRef]
  23. Wang, F. The use of artificial neural networks in a geographical information system for agricultural land-suitability assessment. Environ. Plann. A 1994, 26, 265–284. [Google Scholar] [CrossRef]
  24. Dedeoglu, M.; Dengiz, O. Generating of land suitability index for wheat with hybrid system aproach using AHP and GIS. Comput. Electron. Agric. 2019, 167, 1–15. [Google Scholar] [CrossRef]
  25. Cheng, L.; Hu, Z.; Lou, S. Improved methods for fuzzy comprehensive evaluation of the reclamation suitability of abandoned mine lands. Int. J. Mining Reclam. Environ. 2017, 31, 212–229. [Google Scholar] [CrossRef]
  26. Pan, G.B.; Xu, Y.P.; Yu, Z.H.; Song, S.; Zhang, Y. Analysis of river health variation under the background of urbanization based on entropy weight and matter-element model: A case study in Huzhou City in the Yangtze River Delta, China. Environ. Res. 2015, 139, 31–35. [Google Scholar] [CrossRef]
  27. Feng, L.; Hong, W. Application of matter element analysis in weather forecasting. Meteorol. Appl. 2014, 21, 398–402. [Google Scholar] [CrossRef]
  28. Xiao, Q.; Wan, S.; Lu, F.; Li, S. Risk assessment for engagement in sharing economy of manufacturing enterprises: A matter–element extension based approach. Sustainability 2019, 11, 4774. [Google Scholar] [CrossRef] [Green Version]
  29. Cai, W. Extension theory and its application. Chin. Sci. Bull. 1999, 44, 1538–1548. [Google Scholar] [CrossRef]
  30. Xie, X.F.; Pu, L.J. Assessment of urban ecosystem health based on matter element analysis: A case study of 13 cities in Jiangsu Province, China. Int. J. Environ. Res. Public Health 2017, 14, 940. [Google Scholar] [CrossRef] [Green Version]
  31. Su, M.; Xie, H.; Yue, W.; Zhang, L.; Yang, Z.; Chen, S. Urban ecosystem health evaluation for typical Chinese cities along the Belt and Road. Ecol. Indic. 2019, 101, 572–582. [Google Scholar] [CrossRef]
  32. He, Y.-X.; Dai, A.-Y.; Zhu, J.; He, H.-Y.; Li, F. Risk assessment of urban network planning in china based on the matter-element model and extension analysis. Int. J. Electr. Power Energy Syst. 2011, 33, 775–782. [Google Scholar] [CrossRef]
  33. Wang, Q.; Li, S.; He, G.; Li, R.; Wang, X. Evaluating sustainability of Water-Energy-Food (WEF) Nexus using an improved matter-element extension model: A case study of China. J. Clean. Prod. 2018, 202, 1097–1106. [Google Scholar] [CrossRef]
  34. Halil, A.; Ayşe, Y.Ö.; Bülent, T. Agricultural land use suitability analysis using GIS and AHP technique. Comput. Electron. Agric. 2013, 97, 71–82. [Google Scholar]
  35. Yilmaz, F.C.; Zengin, M.; Cure, C.T. Determination of ecologically sensitive areas in Denizli province using geographic information systems (GIS) and analytical hierarchy process (AHP). Environ. Monit. Assess. 2020, 192, 589. [Google Scholar] [CrossRef]
  36. Colak, H.E.; Tugba, M.; Yasin, G. Optimal site selection for solar photovoltaic (PV) power plants using GIS and AHP: A case study of Malatya Province, Turkey. Renew. Energy 2020, 149, 565–576. [Google Scholar] [CrossRef]
  37. Zytoon, M.A. A decision support model for prioritization of regulated safety inspections using integrated Delphi, AHP and Double-Hierarchical TOPSIS approach. IEEE Access. 2020, 8, 83444–83464. [Google Scholar] [CrossRef]
  38. FAO (Food and Agriculture Organization). Guidelines: Land Evaluation for Rain-Fed Agriculture; Soil Bulletin No 52; Food and Agriculture Organization: Rome, Italy, 1983; p. 237. [Google Scholar]
  39. Soil Survey Staff. Keys to Soil Taxonomy, 8th ed.; National Resource Conservation Centre, USDA: Blacksburg, VA, USA, 1998. [Google Scholar]
  40. IIASA (International Institute for Applied Systems Analysis); FAO (Food and Agriculture Organization). Global Agroecological Zones; Version 3; IIASA: Laxenburg, Austria; FAO: Rome, Italy, 2012; p. 196. [Google Scholar]
  41. Wahyunto, H.; Suryani, E.; Tafakresnanto, C.; Ritung, S.; Mulyani, A.; Sukarman, N.K.; Nursyamsi, D. Teknis Pedoman Penilaian Kesesuaian Lahan untuk Komoditas Pertanian Strategis Tingkat Semi Detail Skala 1: 50,000; Balai Besar Penelitian dan Pengembangan Sumberdaya Lahan Pertanian, Badan Penelitian dan Pengembangan Pertanian: Bogor, Indonesia, 2016. [Google Scholar]
  42. Sys, C.; Van Ranst, E.; Debaveye, J.; Beernaert, F. Land Evaluation, Part 3: Crop Requirements; Agricultural Publications 7; General Administration for Development Cooperation: Brussels, Belgium, 1993. [Google Scholar]
  43. Muljadi, D.; Dent, F.J.; AGL (AGL Energy). Reconnaissance Land Resource Surveys 1:250,000 Scale. Atlas Format Procedures [for Use in Indonesia]. By CSR/FAO Staff; AGOF/INS/78/006; Manual 4; Version 1; Centre for Soil Research (CSR) Republic of Indonesia: Bogor, Indonesia, 1983. [Google Scholar]
  44. Landon, J.R. Booker Tropical Soil Manual; A Handbook for Soil Survey and Agricultural Land Evaluation in the Tropics and Subtropics; BAI Limited.: London, UK, 1984; p. 230. [Google Scholar]
  45. Ferretti, Y.; Pomarico, S. An integrated approach for studying the land suitability for ecological corridors through spatial multicriteria evaluations. Environ. Dev. Sustain. 2013, 15, 859–885. [Google Scholar] [CrossRef]
  46. Geng, S.; Shi, P.; Zong, N.; Zhu, W. Agricultural Land Suitability of Production Space in the Taihang Mountains, China. Chin. Geogr. Sci. 2019, 29, 1024–1038. [Google Scholar] [CrossRef] [Green Version]
  47. Girvan, M.S.; Bullimore, J.; Pretty, J.N.; Osborn, A.M.; Ball, A.S. Soil type is the primary determinant of the composition of the total and active bacterial communities in arable soils. Appl. Environ. Microbiol. 2003, 69, 1800–1809. [Google Scholar] [CrossRef] [Green Version]
  48. Montgomery, B.; Dragićević, S.; Dujmović, J.; Schmidt, M. A GIS-based Logic Scoring of Preference method for evaluation of land capability and suitability for agriculture. Comput. Electron. Agric. 2016, 124, 340–353. [Google Scholar] [CrossRef]
  49. Liu, J.Z.; Wei, Z.; Shen, B.J.; Li, T.S.; Liang, Q.G.; Wang, X.; Sun, J.; Chao, A. Soil quality assessment of acid sulfate paddy soils with different productivities in Guangdong Province, China. J. Integr. Agric. 2014, 13, 177–186. [Google Scholar] [CrossRef]
  50. Bandyopadhyay, S.; Jaiswal, R.K.; Hegde, V.S.; Jayaraman, V. Assessment of land suitability potentials for agriculture using a remote sensing and GIS based approach. Int. J. Remote. Sens. 2009, 30, 879–895. [Google Scholar] [CrossRef]
  51. Chapin, F.S.; Shaver, G.R. Individualistic growth response of tundra plant species to environmental manipulations in the field. Ecology 1985, 66, 564–576. [Google Scholar] [CrossRef]
  52. He, Y.; Liu, D.; Yao, Y.; Huang, Q.; Li, J.; Chen, Y.; Shi, S.; Wan, L.; Yu, S.; Wang, D. Spatializing Growth Suitability for Spring Soybean Cultivation in Northeast China. J. Appl. Meteorol. Clim. 2013, 52, 773–783. [Google Scholar] [CrossRef]
  53. Gorelick, N.; Hancher, M.; Dixon, M.; Ilyushchenko, S.; Thau, D.; Moore, R. Google Earth Engine: Planetary-scale geospatial analysis for everyone. Remote. Sens. Environ. 2017, 202, 18–27. [Google Scholar] [CrossRef]
  54. Breiman, L. Random Forests. Mach. Learn. 2001, 45, 5–32. [Google Scholar] [CrossRef] [Green Version]
  55. Phan, T.N.; Kuch, V.; Lehnert, L.W. Land Cover Classification using Google Earth Engine and Random Forest Classifier—The Role of Image Composition. Remote. Sens. 2020, 12, 2411. [Google Scholar] [CrossRef]
  56. Cohon, J.; Marks, D. A review and evaluation of multi-objective techniques. Water Resour. Res. 1973, 16, 14–20. [Google Scholar]
  57. Lamya, N.; Mohammad, A.; Saeed, B.N. Combination of GIS and AHP for site selection of pressurized irrigation systems in the Izeh plain, Iran. Agric. Water Manag. 2020, 231, 106004. [Google Scholar]
  58. Saaty, T.L. The Analytic Hierarchy Process: Planning, Priority Setting, Resource Allocation; McGraw-Hill International: New York, NY, USA, 1980. [Google Scholar]
  59. Seyedmohammadi, J.; Sarmadian, F.; Jafarzadeh, A.A.; Ghorbani, M.A.; Shahbazi, F. Application of SAW, TOPSIS and fuzzy TOPSIS models in cultivation priority planning for maize, rapeseed and soybean crops. Geoderma 2018, 310, 178–190. [Google Scholar] [CrossRef]
  60. Alfaro, F.D.; Manzano, M.; Marquet, P.A.; Gaxiola, A. Microbial communities in soil chronosequences with distinct parent material: The effect of soil pH and litter quality. J. Ecol. 2017, 105, 1709–1722. [Google Scholar] [CrossRef] [Green Version]
  61. Li, X.; Wang, D.; Ren, Y.; Wang, Z.; Zhou, Y. Soil quality assessment of croplands in the black soil zone of Jilin Province, China: Establishing a minimum data set model. Ecol. Indic. 2019, 107, 105251. [Google Scholar] [CrossRef]
  62. Seyedmohammadi, J.; Sarmadian, F.; Jafarzadeh, A.A.; McDowell, R.W. Development of a model using matter element, AHP and GIS techniques to assess the suitability of land for agriculture. Geoderma 2019, 352, 80–95. [Google Scholar] [CrossRef]
  63. Dengiz, O.; Özyazici, M.; Sağlam, M. Multi-criteria assessment and geostatistical approach for determination of rice growing suitability sites in Gokirmak catchment. Paddy Water Environ. 2015, 13, 1–10. [Google Scholar] [CrossRef]
Figure 1. Location of the study area and sample points.
Agriculture 11 00370 g001
Figure 2. Interpolation map for the parameters influencing land suitability evaluation. (a) Slope; (b) pH; (c) OC; (d) TN; (e) AP; (f) AK; (g) mean annual rainfall; (h) mean annual temperature.
Agriculture 11 00370 g002
Figure 3. Schematic overview of land suitability assessment procedures.
Agriculture 11 00370 g003
Figure 4. Existing maps of maize, rice, and soybeans.
Agriculture 11 00370 g004
Figure 5. Suitability evaluation map of different agricultural land areas in Jilin Province. (a) Land suitability assessment map for maize; (b) land suitability assessment map for rice; (c) land suitability assessment map for soybeans. S1: highly suitable, S2: moderately suitable, S3: marginally suitable, N: unsuitable.
Agriculture 11 00370 g005aAgriculture 11 00370 g005b
Figure 6. Linear regression between land suitability index and yield data (kg/ha).
Agriculture 11 00370 g006
Figure 7. The areas of the three crops in different grades after optimization (ha). S1: highly suitable, S2: moderately suitable, S3: marginally suitable, N: unsuitable.
Agriculture 11 00370 g007
Figure 8. Linear regression between LSI data for the AHP model along with yield (kg/ha).
Agriculture 11 00370 g008
Figure 9. The planting structure optimization map of Jilin province: (a) Planting Structure 1; (b) Planting Structure 2.
Agriculture 11 00370 g009
Figure 10. Comparison map of existing cultivated land and optimized areas.
Agriculture 11 00370 g010
Table 1. Factor ratings of land suitability for maize, rice, and soybean cultivation.
Characteristic ClassificationFeature CategorySuitability ClassReferences
S1S2S3N
Rating scale100–8585–6060–4040–0[38] (p. 237)
Topography (T)
Slope (%)Maize≤44–88–16>16[39]
Soybean≤55–88–16>16[40] (p. 196)
Rice≤33–88–15>15[41]
Physical soil characteristics (S)
Texture 1MaizeC, L, SiL, SiC, LSCL, SC, SL-S[42]
SoybeanL, CL, SiLSC, SLC, SiC, LSS[39]
RiceSC, C, SiC, CLL, SiLSL, LSS[41]
DrainageMaizewellimperfectpoor, excessive-[39]
Soybeanwell, imperfectpoor, excessive--[39]
Ricewellimperfectpoor, excessive-[41]
Soil fertility characteristics (F)
pH (H2O)Maize5.8–7.85.5–5.8, 7.8–8.25.2–5.5, 8.2–8.5≤5.2, >8.5[40] (p. 196)
Soybean5.5–7.55.4–5.5, 7.5–7.85.2–5.4, 7.8–8.2≤5.2, >8.2[40] (p. 196)
Rice5.5–8.25.0–5.5, 8.2–8.54.5–5.0, 8.5–9.0≤4.5, >9.0[42]
Organic carbon (OC, %)Maize>1.20.8–1.20.5–0.8≤0.5[40] (p. 196)
Soybean>10.5–1.00.25–0.5≤0.25[40] (p. 196)
Rice>1.21.2–0.8≤0.8-[41]
Total nitrogen (TN, %)Maize>0.150.15–0.10.1–0.08≤0.08[43,44] (p. 230)
Soybean>0.50.5–0.20.2–0.1≤0.1[43,44] (p. 230)
Rice>0.20.2–0.1≤0.1-[43,44] (p. 230)
Available phosphorus (AP, mg/kg)Maize>1414–1010–6.5≤6.5[40] (p. 196)
Soybean>1313–99–6≤6[40] (p. 196)
Rice>4040–2020–15≤15[41]
Available potassium (AK, mg/kg)Maize>220220–155155–100≤100[40] (p. 196)
Soybean>160160–110110–75≤75[40] (p. 196)
Rice>200200–100≤100-[41]
Climate characteristics (C)
Mean annual temperature (°C) 2Maize24–3020–24, 30–3215–20, 32–35≤15, >35[38] (p. 237)
Soybean22–2828–30, 22–2030–32, 20–18≤18, >32[43,44](p. 230)
Rice24–3022–24, 30–3218–22, 32–35≤18, >35[38] (p. 237)
Mean annual rainfall (mm/year) 2Maize>800800–700700–600≤600[38] (p. 237)
Soybean>800800–600≤600-[39]
Rice>800800–700700–600≤600[39]
Location condition (L)
Distance to water bodies (km) 3All the crops≤11–22–3>3[45]
1 Soil texture: C—clay; CL—clay loam; L—loam; LS—loamy sand; SC—sandy clay; SL—sandy loam; SiC—silty clay; SiL—silt loam; S—sand. 2 Mean annual temperature: average precipitation in the growing season from 2009 to 2018. 3 Distance to water bodies: the minimum distance from the center of mass of each village to the river.
Table 2. Overall means, standard deviations, and ranges of soil properties and nutrients in samples.
PropertypH
(H2O)
OC
(%)
TN
(%)
AP
(mg/kg)
AK
(mg/kg)
Mean6.121.590.1435.44103.17
SD0.870.770.0733.06112.57
Minimum value4.090.370.032.02527.87
Maximum value7.995.570.56259.901550.82
Table 3. Rating scales for pairwise AHP comparisons.
Intensity of ImportanceDescription
1Equal importance
3Weak importance of one over another
5Essential or strong importance
7Very strong or demonstrated importance
9Extreme importance
2, 4, 6, 8Intermediate values between the two adjacent judgments
ReciprocalsValues for inverse comparison
Table 4. Random index (RI) values.
n 1234567891011
RI 0.000.000.580.901.121.241.321.411.451.491.51
Table 5. (a) Classification accuracy evaluation table for different feature types; (b) Classification accuracy evaluation table for maize, rice, and soybeans.
(a)
GrasslandTownCultivated LandForest LandWater Body
User’s accuracy (%)80.0087.5099.24100.00100.00
Producer’s accuracy (%)88.8992.1197.76100.00100.00
Accuracy of general classification = 97.21% and kappa = 0.95
(b)
RiceMaizeSoybeanUser’s Accuracy (%)
Rice0166199.40
Maize353095.59
Soybean171463.64
Accuracy of general classification = 95.33% and kappa = 0.90
Table 6. The average yields of maize, rice, and soybeans vary in suitability (kg/ha).
Highly SuitableModerately SuitableMarginally SuitableUnsuitable
Maize7362.615763.584920.974103.14
Rice5991.324017.223156.211706.57
Soybean2050.201424.931007.22522.53
Table 7. Economic statistics for major crops in Jilin Province in 2019.
Yield
(kg/ha)
Unit Price (yuan/kg)Producer Subsidy (yuan/ha)Production Cost (yuan/ha)Artificial Cost (yuan/ha)
Maize7594.311.611544.993472.335123.37
Rice8185.912.941871.993134.837190.96
Soybean2151.143.364000.482009.694168.33
Table 8. Statistics for different planting structures.
Maize Area
(ha)
Rice Area
(ha)
Soybean Area
(ha)
Gross Output Value (Billion yuan)
Existing planting structure9,178,684.51925,850.50274,246.52136.49
Planting Structure 1 19,292,614.171,086,167.360139.76
Planting Structure 2 27,224,593.552,438,834.96715,353.02152.20
1 Planting Structure 1: the planting structure that only takes into account crop yields and prices. 2 Planting Structure 2: the planting structure that takes into account crop yield, price, producer subsidies, and costs.
Table 9. Area changes of maize, rice, and soybeans before and after optimization (ha).
ExistingSoybeanSoybeanRiceRiceMaizeMaize
Planting structure 2RiceMaizeSoybeanMaizeSoybeanRice
Area of change95,779.54169,115.8773,016.23543,603.97632,985.682,033,825.12
Publisher’s Note: MDPI stays neutral with regard to jurisdictional claims in published maps and institutional affiliations.

