Article

Assessment of Interactions between Yield Components of Common Vetch Cultivars in Both Conventional and Low-Input Cultivation Systems

by
Vasileios Greveniotis
1,2,*,
Elisavet Bouloumpasi
3,
Stylianos Zotis
2,†,
Athanasios Korkovelos
4 and
Constantinos G. Ipsilandis
5
1
Institute of Industrial and Forage Crops, Hellenic Agricultural Organization Demeter, GR-41335 Larissa, Greece
2
Department of Agricultural Technology, Technological Educational Institute of Western Macedonia, GR-53100 Florina, Greece
3
Department of Agricultural Biotechnology and Oenology, International Hellenic University, GR-66100 Drama, Greece
4
Directorate of Water Management of Thessaly, Decentralized Administration of Thessaly–Central, GR-41335 Larissa, Greece
5
Department of Agriculture, Regional Administration of Central Macedonia, GR-54622 Thessaloniki, Greece
*
Author to whom correspondence should be addressed.
Late author.
Agriculture 2021, 11(4), 369; https://doi.org/10.3390/agriculture11040369
Submission received: 26 March 2021 / Revised: 13 April 2021 / Accepted: 16 April 2021 / Published: 19 April 2021
(This article belongs to the Special Issue Crop Breeding and Genetics)

Abstract

:
The primary purpose of this study was to explore yield stability of common vetch varieties based on the stability index, with a specific aim of exploring common vetch variety behavior regarding the yield of legumes under both conventional and low-input cultivation systems. Six varieties of common vetch (Vicia sativa L.), namely, cv. Filippos, cv. Omiros, cv. Alexandros, cv. Tempi, cv. Zefyros and cv. Pigasos, were used. The cultivation was conducted using a strip-plot design with the six varieties randomized within each plot in two farming systems (conventional and low-input). Filippos was the best variety in conventional farming for seed yield, followed by Omiros. Omiros was the best variety in the low-input farming system for seed yield. Comparisons between conventional and low-input farming systems generally did not display any effect on stability estimations, but revealed the varieties that exhibit stable performance even in low-input farming systems. Stability analysis via the AMMI1 and GxE biplot analysis for one main factor showed two groups of varieties for seed yield with similar behavior. Genotype and environment distribution were used to group varieties that showed better performance in certain environments for seed yield but with differences in comparison to other traits. Correlations between traits showed the positive relation of seed yield to the number of pods per plant, the number of seeds per pod, the pod length, the mean weight of pods and, especially, the hay weight (r = 0.771), a useful finding for indirect selection for breeders. The results provide valuable data regarding the genetic material, its adaptability and stability in varied environments and suitability for low-input cultivation systems.

1. Introduction

Organic and, in many cases, traditional farming is a production system that maintains soil, ecosystems and human health. It is based on various ecological processes, biodiversity, low input and adapted cycles in local conditions. The main target is to optimize agricultural systems through agronomic improvement and therefore needs suitable varieties for low-input cultivation systems. In such systems, the need to reduce inputs (fertilizers, water, pesticides, energy) is a true challenge for both plant breeders and farmers. The objectives of plant breeders should be the shift from high-performance varieties towards the varieties achieving nutrient economy and fitting to local environments [1]. Therefore, the genetic material has to exhibit high adaptability to a wide range of different environments characterized by high heterogeneity [2].
Common vetch (Vicia sativa L.) is a widespread legume crop in the Mediterranean Basin and Western Asia [3,4]. Vetches (genus Vicia L., tribe Viciae, family Fabaceae) are cultivated in many areas around the world, with a global production area of approximately 416,552 ha in 2019. The main centers of production are located in Ethiopia, the Russian Federation, Australia, Turkey and Syria. The cultivation area of common vetch and other vetches in Greece was 31,977 ha in 2017 according to official data, the average annual yield was 1784 kg ha−1 and the crop production yield amounted to 57,060 tons in the same year [5]. Due to the vetch’s nutritional value for animal feed as a legume, it is preferred by farmers both for its hay and grains, enriching in parallel the cultivation fields by fixing the atmospheric nitrogen in the soil [2,6].
Vetch is considered compatible with organic or low-input farming systems. It reserves the atmospheric nitrogen and thus benefits subsequent crops (usually cereals) and yields satisfactorily in cultivation areas [7]. It also copes well with weeds and other biotic and abiotic stresses. Appropriate varieties must be chosen carefully to adapt in heterogeneous and low-input environments and thus extensive experimentation is needed [8]. Some researchers have proposed variety mixtures instead of searching for adaptability of single varieties in order to maintain productivity and stability [9]. In farm production, varieties that perform well and express phenotypic stability or other important characteristics are promoted to farmers [10].
Fasoulas [11] proposed the ratio of 1/CV (the coefficient of variation) between the mean and standard deviation for estimating stability and, later, Fasoula [12] used the squared form as a stability criterion. The concept of use of the coefficient of variation (CV) for stability estimations was concluded by Edmeades and Daynard [13] and Tollenaar and Wu [14], while Edmeades and Deutch [15] used many parameters for estimating stability, leading to the proposal of genotype evaluations in multiple environments. Furthermore, extended experimentation was used in common vetch to assess the available germplasm for its adaptability and expression of certain characteristics under multi-environmental conditions in order to ensure stability of performance [16].
In the current study, our primary purpose was to explore yield stability of common vetch varieties based on the stability index as described by Fasoula [17]. The specific purpose of our work was to investigate common vetch variety behavior concerning the yield of legumes (pods) under both conventional and low-input cultivation systems and, in parallel, to propose the best varieties for certain cultivation areas, as well as to assess the relationship between characteristics as a breeding selection tool.

2. Materials and Methods

2.1. Crop Establishment and Experimental Procedures

Field experiments were conducted in two consecutive years (2010–2011 and 2011–2012) in four different locations. Coordinates according to the WGS 1984 geographic coordinate system are provided.
(A)
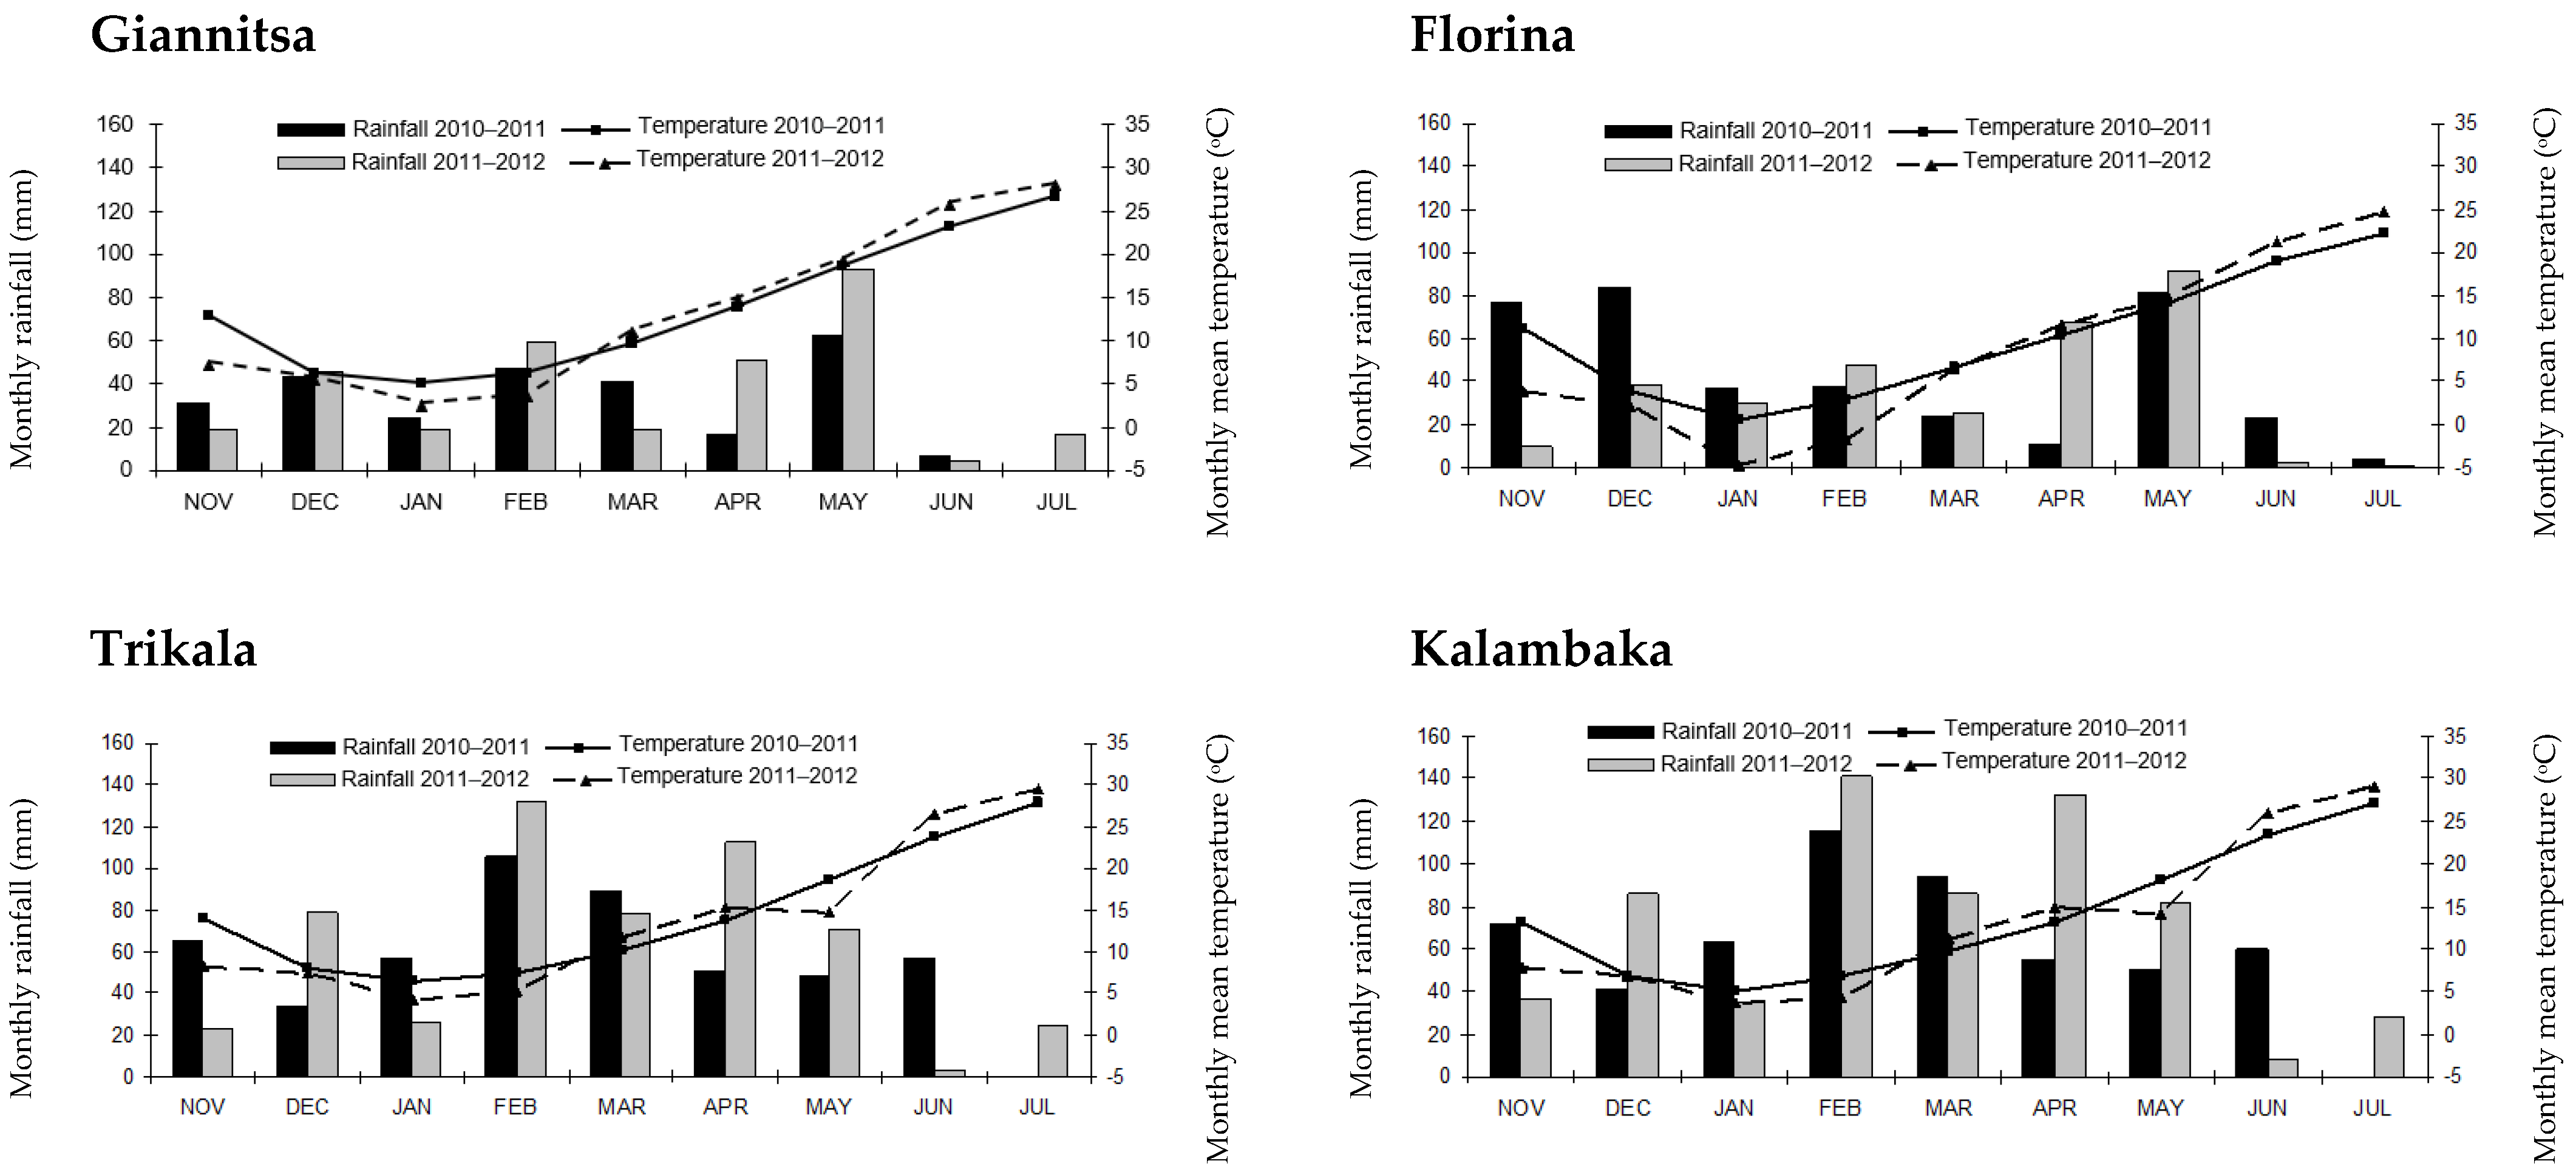
In the farm of the Technological Educational Institute of Western Macedonia in Florina, Greece (latitude, 40°46′ N; longitude, 21°22′ E; elevation, 705 m a.s.l.). The soil type was characterized as sandy loam (SL): sand, 62%; silt, 26.9%; clay, 11.1%. The chemical properties of the soil were as follows: conventional: N-NO3, 16.1 mg kg−1; P-Olsen, 26.4 mg kg−1; K, 236 mg kg−1; pHH20, 6.32; organic matter, 1.29%; and CaCO3, 1.7 (%). Low-input system: N-NO3, 17.4 mg kg−1; P-Olsen, 25.1 mg kg−1; K, 224 mg kg−1; pHH20, 6,29; organic matter, 1.32%; and CaCO3, 1.9 (%).
(B)
In Trikala, Greece (latitude, 39°55′ N; longitude, 21°64′ E; elevation, 120 m a.s.l.). The soil type was characterized as sandy clay loam (SCL): sand, 48.6%; silt, 19.2%; clay, 32.2%. The chemical properties of the soil were as follows: conventional: N-NO3, 12.7 mg kg−1; P-Olsen, 11.8 mg kg−1; K, 168 mg kg−1; pHH20, 8.15; organic matter, 2.21%; and CaCO3, 7.54 (%). Low-input system: N-NO3, 13.6 mg kg−1; P-Olsen, 11.5 mg kg−1; K, 176 mg kg−1; pHH20, 8.11; organic matter, 2.39%; and CaCO3, 7.63 (%).
(C)
In Kalambaka, Greece (latitude, 39°64′ N; longitude, 21°65′ E; elevation, 190 m a.s.l.). The soil type was silty clay (SiC): sand, 14.6%; silt, 41.2%; clay, 44.2%. The chemical properties of the soil were as follows: conventional: N-NO3, 11.39 mg kg−1; P-Olsen, 7.62 mg kg−1; K, 96.3 mg kg−1; pHH20, 8.05; organic matter, 2.14%; and CaCO3, 3.58 (%). Low-input system: N-NO3, 12.01 mg kg−1; P-Olsen, 7.56 mg kg−1; K, 98.7 mg kg−1; pHH20, 8.08; organic matter, 2.21%; and CaCO3, 3.65 (%).
(D)
In Giannitsa, Greece (latitude, 40°77′ N; longitude, 22°39′ E; elevation, 10 m a.s.l.). The soil type was clay (C): sand, 9.1%; silt, 37.5%; clay, 53.8%. The chemical properties of the soil were as follows: conventional: N-NO3, 15.1 mg kg−1; P-Olsen, 17.4 mg kg−1; K, 274 mg kg−1; pHH20, 7.69; organic matter, 3.26%; and CaCO3, 5.23 (%). Low-input system: N-NO3, 16.1 mg kg−1; P-Olsen, 15.9 mg kg−1; K, 261 mg kg−1; pHH20, 7.65; organic matter, 3.51%; and CaCO3, 5.37 (%).
Those locations were selected deliberately because of their varied environmental conditions. Basic weather data (mean monthly temperatures in °C and rainfall in mm) for each experimental site based on daily records are presented in Figure 1.
Six varieties of common vetch (Vicia sativa L.), namely, cv. Filippos, cv. Omiros, cv. Alexandros, cv. Tempi, cv. Zefyros and cv. Pigasos, were used. The cultivation was conducted using a strip-plot design with the six varieties randomized within each plot. Each plot consisted of seven rows 5 m in length and the rows were spaced 25 cm apart. The plot size was 8.75 m2.
Two types of cultivation approaches were selected: under low-input and conventional farming systems.
Fertilization of experimental plots cultivated under the conventional farming system consisted of the nitrogen and phosphorus fertilizer (element level) applied before sowing at the rate of 30 and 50 kg ha−1, respectively. The selected fields were cultivated conventionally for years preceding the experiment.
For low-input cultivation, no fertilizers or other agrochemicals were applied during the experiment in all four different locations, while prior to establishment of the experiment in 2010, the fields had been in a two-year rotation consisting of bread wheat/legume without nutritional supplementation or other agrochemical inputs.
Weeds appearing in the experimental area were removed by hand. The seeds were sown in early November and the harvest of legumes was completed in late June.

2.2. Measurements

The traits measured were as follows: seed yield (kg ha−1), thousand kernel weight (g), number of pods per plant, number of seeds per pod, number of seeds per plant, pod length (cm), pod width (mm), (mean) pod weight (g), hay weight (kg ha−1), plant height (cm).
Seed yield (kg ha−1) and hay weight (kg ha−1) were estimated based on the data recorded for each plot and variety. Hay yield was calculated by subtracting the weight of seeds from the total biomass weight.
For the estimation of plant height (cm) and yield components (number of pods per plant, number of seeds per pod, number of seeds per plant, pod length, pod width), ten plants were randomly selected per plot. In order to measure the (mean) pod weight (g), 10 pods per plant were weighted, while for the thousand kernel weight (g), five random samples per plot were used.

2.3. Data Analysis

Stability estimations were based on stability index ( x ¯ / s ) 2 , where x ¯ and s are the entry mean yield and the standard deviation, respectively [17].
Trait correlations were examined using the Pearson coefficient according to Steel et al. [18], and the significance of all the statistics was checked at p < 0.05 using SPSS ver. 25. Stability analysis was performed using the free version of PB Tools over locations and years for each characteristic and the statistical tools were the AMMI1 and (GGE) biplot analysis.

3. Results

Stability estimations are presented in Table 1, Table 2 and Table 3. In Table 1, indices are calculated across environments for all the traits measured. Seed yield stability showed low values (<50), while the number of seeds per plant showed very high values (>500) and almost the same was found for pod width (>450). Low values were also found for other traits such as the number of pods per plant, pod weight and hay yield.
The remaining traits showed intermediate values. The two farming systems displayed slight differences not affecting stability estimations. Differences between environments also did not affect stability estimations.
For seed yield stability, the Giannitsa area showed the highest values (near 50) for both cultivation systems. In Table 1, the Giannitsa area showed the highest values for almost all the traits, indicating a favorable environment for vetch cultivation that can ensure high and stable performance. Some specific traits were favored in other environments (as presented for Florina and Trikala). The number of seeds per plant showed a very high value in the Giannitsa area (951) for conventional cultivation, followed by Florina in both cultivation systems.
Table 2 depicts the differences between the six varieties. The various traits displayed low, high or intermediate values, but some varieties displayed increased values for stability estimations. Filippos was the best common vetch variety in conventional farming for seed yield (209), followed by Omiros (175). The latter was the best variety in the low-input farming system for seed yield (351). Combined estimations showed that Omiros (43) and Filippos (40) appeared to be the most stable varieties for seed yield. Omiros exhibited very good stability for the thousand kernel weight (>1300), while Zefyros appeared to be the most stable for the number of seeds per plant (>1300). Within environments, Omiros showed extremely high values for the thousand kernel weight (especially in Giannitsa and Trikala), including over 2000. Regarding the seed yield, Omiros appeared to be a very stable choice for Giannitsa, Florina, Trikala and Kalambaka in the low-input farming system, while other varieties showed specific adaptability in the four different environments. Some impressive results were retrieved for various traits and different varieties, with above 1100 stability index values, indicating extreme stability performance of these varieties for specific traits.
Comparisons between the conventional and low-input farming systems generally did not affect stability estimations, but revealed varieties that exhibit stable performance, even in the low-input farming system.
In Table 3, stability indices combine both environmental and genotypic behavior for all the traits for the two cultivation systems. Florina displayed some extreme stability index values in both cultivation systems for the number of seeds per plant, indicating a perfect environment for seed production purposes due to stable contribution.
The AMMI1 and GxE biplots can explore both environmental and genotype behavior concerning all the traits for stability and performance. The AMMI1 and GxE biplots were used to analyze stability and adaptability of the varieties in the different environments over the years of experimentation. For yield, both AMMI1 and the GGE biplot analyses clustered the varieties in two groups, the one expressing high yield and the other with low yield. Both groups seemed to be stable, expressing low variability between them within environments (Figure 2). Τhousand kernel weight (TKW) seemed to be stable between the environments, while two of the varieties expressed the highest TKW of all (Figure 3). For the number of seeds per plant, the adaptation map showed a pattern indicating specific adaptability for varieties and environments (Figure 4). The hay yield showed that the varieties were not stable between the environments. The depiction of the varieties in Figure 5 showed specific adaptability between the environments. The analysis of AMMI1 and GGE biplots for the environments showed that there are two that are stable and favorable for all the traits.

Correlations between Characteristics

Correlations between traits (Table 4) showed the positive correlation of seed yield to the number of pods per plant (r = 0.172), number of seeds per pod (r = 0.116), pod length (r = 0.116), mean weight of pods (r = 0.109) and especially hay weight (r = 0.771). The number of pods per plant is positively correlated to pod width and hay weight. Some other positive or negative correlations are presented in Table 4.

4. Stability Analysis, Total Results and Discussion

Stability of performance is the main purpose of plant breeders in many research works in maize [19] and in vetch [2,20]. In our research, the two farming systems showed differences in variety expression, but overall the different farming systems did not affect stability expression of the traits tested. In combination with the GGE biplot analysis, the two farming systems revealed the most stable varieties across all the environments, as well as the more stable varieties in specific environments. Additionally, some varieties displayed stability in low-input farming systems, which is a common practice in many cultivation areas to support livestock nutrition needs. Variety Filippos was generally stable across the environments, but Omiros was the most stable variety regarding seed yield, especially in low-input farming systems. The availability of suitable varieties is very important in order to maintain productivity (yielding performance) in low-input organic farming systems [21,22]. Aydemir et al. [23], through the application of various statistic techniques and the GGE biplot, concluded that several yield components such as biological yield, straw yield, forage yield and natural plant height resulted in highly significant variations that can be utilized as selection criteria in breeding programs for common vetch. The GGE biplot may help breeders with choosing the proper genotypes for certain environments.

4.1. Seed Yielding Ability

Regarding the seed yielding ability, Figure 2a, the adaptation map which, according to the environment IPCA1, explains 78.1% of variability, shows that E3 (Trikala), E2 (Florina) and E1 (Giannitsa) are the favorable environments, with E1 (Giannitsa) being the most favorable among them. Environment E4 (Kalambaka) was the least productive. Across the genotypes, G3 (Alexandros), G1 (Filippos) and G4 (Tempi) expressed high yielding ability, and G4 (Tempi) was the most productive. The PC1 factor of the AMMI1 analysis expressed 78.1% of environmental variability, which is relatively high and gives consistent results. According to the AMMI1 biplot, the most stable environments were E2 (Florina) and E3 (Trikala) and the most favorable was E1 (Giannitsa). Environment E4 (Kalambaka) was stable but less productive compared to all others. The GGE biplot for environments analysis, as expressed by the two axes (PC1 and PC2), explained 94.9% and 4.2% of variability, respectively. The overall expression of 97.1% was very high, thus contributing to the consistency of the results. Regarding the stability of the environments based on the GGE biplot, environments E2 and E3 appear to be stable over years and close to the ideal environment. Environment E1 seems to be a little less stable and is depicted near the first circle of stability, which means that it is acceptably stable as well. The GGE biplot figure for the genotype stability analysis expressed the same level of variability as for the environments, 97.1%, which is very high. The analysis of the varieties showed that the most stable were G4 (Tempi) and G1 (Filippos), with G3 (Alexandros) following very closely. Regarding the average and the ideal environments, both of them seem to be very close, which is an indication of the adaptation of the G4, G1 and G3 varieties in the testing environment. The remaining varieties appear to be stable enough but not productive.

4.2. Thousand Kernel Weight (TKW)

The adaptation map for the thousand kernel weight (TKW) according to IPCA1 explains a high portion of variability, amounting to 83.9%. In this figure, the favorable environments are E4 (Kalambaka), E1 (Giannitsa) and the most favorable is E2 (Florina), while the environment expressing the least productivity is E3 (Trikala). The variety having the highest TKW was G6 (Pigasos), followed by G5 (Zefyros). Regarding the best varieties for TKW and yield, varieties expressing both high yield and high TKW were not found; only either one of these traits was expressed highly in any of the varieties. Therefore, it is obvious that both traits follow quantitative genetic heritability and are negatively correlated. The AMMI1 biplot expressed 83.9% of the variability and showed the same findings for the varieties as described above. Furthermore, with regard to the environments, the most stable was found to be E4 (Kalambaka), followed by E1 (Giannitsa) and E2 (Florina), with the least favorable being E3 (Trikala). The GGE biplot for the environment analysis expressed overall 99.9% of the variability; 98.1% for PC1 and 1.8% for PC2. According to Figure 3, the average and the ideal environment are almost identical, and E4 (Kalambaka), E1 (Giannitsa) and E2 (Florina) are extremely close to the average environment and the ideal environment. Environment E3 that is less favorable is also stable and in the radius of the first and second circle from the ideal environment. The GGE biplot for genotypes showed that the G6 (Pigasos) variety is the most stable and desirable for TKW as almost identical values are depicted for the average environment and the ideal environment. Variety G5 (Zefyros) is very stable and within the range of desirable varieties.

4.3. Number of Seeds per Plant

The adaptation map for the number of seeds per plant showed lack of clear grouping for environments, but there is specific adaptability for varieties and environments. For example, the E1 (Giannitsa) environment favored the G6 (Pigasos) variety, which was the most productive among all the varieties, while G1 (Filippos) and G2 (Omiros) were classified last. On the contrary, G1 (Filippos) and G2 (Omiros) were the most productive varieties in the E4 (Kalambaka) environment, while G6 (Pigasos) was the least productive variety. Similar results are presented in the AMMI1 biplot figure. The GGE biplot for environments showed that the average environment was far away from the ideal for this trait. The GGE biplot for genotypes explained 88.4% of the total variability and showed that even though the average environment was far from the ideal, the G4 (Tempi) variety was quite close to the ideal genotype.

4.4. Hay Yield

The adaptation map for hay yield showed that specific adaptability existed between E4 (Kalambaka) and the varieties G6 (Pigasos) and G4 (Tempi). Furthermore, specific adaptability appeared between the environments E1 (Giannitsa) and E3 (Trikala) and the varieties G1 (Filippos) and G3 (Alexandros). The same conclusion was drawn from the AMMI1 biplot analysis, which explained 59.6% of the variability. The GGE biplot for environments showed that the average and the ideal environments were very close and explained 92.5% (PC1: 81.7%, PC2: 10.8%) of the variability. Regarding the classification of the environments, environment E1 (Giannitsa) followed by E2 (Florina) and E3 (Trikala) were close to the average and the ideal environments. The GGE biplot for genotypes explained the same amount of variability (92.5%) and appeared to be very close to the points of the average environment and the ideal genotype (Figure 5d). Variety G4 (Tempi) was very close to the ideal genotype, followed by the G1 (Filippos) and G3 (Alexandros) varieties.
Tiryaki et al. [24] observed the importance of correlations between yield and other yield parameters. In our work, correlations showed a significant relation between seed yield and some other traits like pod length, number of pods per plant, number of seeds per pod, and thus, indirect seed yield improvement may be based on pod length improvement, which is considered a stable trait with regard to our results retrieved from the stability index.

5. Conclusions

Correlations showed a significant relation between seed yield and some other traits. Indirect seed yield improvement may be implemented by improving pod length, which generally shows high stability indices.
Comparisons between conventional and low-input farming systems generally did not affect stability estimations, but revealed varieties that exhibited stable performance, even in low-input farming systems. Among the six common vetch varieties studied, Filippos and Omiros were found to be generally stable varieties, especially Omiros that exhibited high stability index values in low-input farming systems.
Varieties G4 (Tempi) and G2 (Omiros) appeared to be stable and productive across all the environments for yield, number of seeds per plant and hay yield. Especially for yield, G4 (Tempi), G1 (Filippos) and G2 (Omiros) were found to be stable varieties, G5 (Zefyros) and G6 (Pigasos) were stable for TKW, G6 (Pigasos), G5 (Zefyros) and G4 (Tempi)—for the number of seeds per plant, while G4 (Tempi), G1 (Filippos) and G3 (Alexandros) were stable for hay yield. Regarding the environments, E1 (Giannitsa) was found to be the most favorable for stable productivity, followed by E2 (Florina).
Many varieties showed stable performance across the environments or in specific environments and could be recommended for similar ecological areas. Some of them, like Omiros, were appropriate for low-input systems and seed yield, while others were more stable in conventional farming. Depending on the trait in question (for improvement or cultivation purposes), we can now choose the best variety for the best environment and farming system.

Author Contributions

Conceptualization, V.G. and S.Z.; methodology, V.G. and S.Z.; investigation, V.G. and E.B.; statistical analysis, A.K. and V.G., writing—original draft preparation, V.G. and C.G.I.; writing—review and editing, E.B., A.K. and C.G.I.; visualization, A.K. and V.G.; supervision, S.Z., project administration, S.Z. All authors have read and agreed to the published version of the manuscript.

Funding

This research received no external funding.

Institutional Review Board Statement

Not applicable.

Informed Consent Statement

Not applicable.

Data Availability Statement

The datasets used and/or analyzed during the current study are available from the corresponding author on reasonable request.

Conflicts of Interest

The authors declare no conflict of interest.

References

  1. Fess, T.L.; Kotcon, J.B.; Benedito, V.A. Crop breeding for low input agriculture: A sustainable response to feed a growing world population. Sustainability 2011, 3, 1742–1772. [Google Scholar] [CrossRef] [Green Version]
  2. Vlachostergios, A.; Lithourgidis, A.; Korkovelos, A.; Baxevanos, D.; Lazaridou, T. Mixing ability of conventionally bred common vetch (Vicia sativa L.) cultivars for grain yield under low-input cultivation. Aust. J. Crop Sci. 2011, 5, 1588–1594. [Google Scholar]
  3. Dhima, K.V.; Lithourgidis, A.S.; Vasilakoglou, I.B.; Dordas, C.A. Competition indices of common vetch and cereal intercrops in two seeding ratio. Field Crops Res. 2007, 100, 249–256. [Google Scholar] [CrossRef]
  4. Yolcu, H.; Gunes, A.; Dasci, M.; Turan, M.; Serin, Y. The effects of solid, liquid and combined cattle manure applications on the yield, quality and mineral contents of common vetch and barley intercropping mixture. Ekoloji 2010, 19, 71–81. [Google Scholar] [CrossRef]
  5. Food and Agriculture Organization of the United Nations. 2021: FAOSTAT Online Database. Available online: http://www.fao.org (accessed on 4 December 2020).
  6. Acikgoz, E. Annual forage legumes in the arid and semi-arid regions of Turkey. In Nitrogen Fixation by Legumes in Mediterranean Agriculture; Beck, D.B., Materon, L.A., Eds.; Springer: Dordrecht, The Netherlands, 1988; pp. 47–54. [Google Scholar]
  7. Rinnofner, T.; Friedel, J.K.; de Kruijff, R.; Pietsch, G.; Freyer, B. Effect of catch crops on N dynamics and following crops in organic farming. Agron. Sustain. Dev. 2008, 28, 551–558. [Google Scholar] [CrossRef]
  8. Fasoulas, A.C. Principles of Crop Breeding; Fasoulas A.C.: Thessaloniki, Greece, 1993. [Google Scholar]
  9. Rédei, G.P. Genetics Manual: Current Theory, Concepts, Terms; Word Scientific: River Edge, NJ, USA, 1998. [Google Scholar]
  10. Dechev, D. Genotype—Environment interaction and stability for some traits of durum wheat genotypes. Agrar. Sci. 2004, 2, 62–66. [Google Scholar]
  11. Fasoulas, A.C. The Honeycomb Methodology of Plant Breeding. Department of Genetics and Plant Breeding; Aristotle University of Thessaloniki: Thessaloniki, Greece, 1988. [Google Scholar]
  12. Fasoula, V.A. Prognostic Breeding: A new paradigm for crop improvement. Plant. Breed. Rev. 2013, 37, 297–347. [Google Scholar]
  13. Edmeades, G.E.; Deutsch, J.A. Stress Tolerance Breeding: Maize that Resists Insects, Drought, Low Nitrogen and Acid Soils; CIMMYT: Mexico City, Mexico, 1994. [Google Scholar]
  14. Tollenaar, M.; Wu, J. Yield improvement in temperate maize is attributable to greater stress tolerance. Crop Sci. 1999, 39, 1597–1604. [Google Scholar] [CrossRef]
  15. Edmeades, G.O.; Daynard, T.B. The relationship between final yield and photosynthesis at flowering in individual maize plants. Can. J. Plant Sci. 1979, 59, 585–601. [Google Scholar] [CrossRef]
  16. Dong, R.; Shen, S.H.; Jahufer, M.Z.Z.; Dong, D.K.; Luo, D.; Zhou, Q.; Chai, X.T.; Luo, K.; Nan, Z.B.; Wang, Y.R.; et al. Effect of genotype and environment on agronomical characters of common vetch (Vicia sativa L.). Genet. Resour. Crop Evol. 2019, 66, 1587–1599. [Google Scholar] [CrossRef]
  17. Fasoula, V.A. A novel equation paves the way for an everlasting revolution with cultivars characterized by high and stable crop yield and quality. In Proceedings of the 11th National Hellenic Conference in Genetics and Plant Breeding, Orestiada, Greece, 31 October–2 November 2006; pp. 7–14. [Google Scholar]
  18. Steel, R.G.D.; Torie, H.; Dickey, D.A. Principles and Procedures of Statistics. A Biometrical Approach, 3rd ed.; McGraw-Hill: New York, NY, USA, 1997. [Google Scholar]
  19. Fasoula, V.A. Selection of High Yielding Plants Belonging to Entries of High Homeostasis Maximizes Efficiency in Maize Breeding. In Proceedings of the XXI International Eucarpia Conference in Maize and Sorghum Breeding in the Genomics Era, Bergamo, Italy, 21–24 June 2009; p. 29. [Google Scholar]
  20. Kebede, G. Evaluation of vetch species for yield, yield components and herbage quality in the central highlands of Ethiopia. Acad. Res. J. Agric. Sci. Res. 2016, 4, 264–278. [Google Scholar]
  21. Mikó, P.; Löschenberger, F.; Hiltbrunner, J.; Aebi, R.; Megyeri, M.; Kovács, G.; Molnár-Láng, M.; Vida, G.; Rakszegi, M. Comparison of bread wheat varieties with different breeding origin under organic and low input management. Euphytica 2014, 199, 69–80. [Google Scholar] [CrossRef] [Green Version]
  22. Georgieva, N.; Nikolova, I.; Delchev, G. Response of spring vetch (Vicia sativa L.) to organic production conditions. Bulg. J. Agric. Sci. 2020, 26, 520–526. [Google Scholar]
  23. Aydemir, S.K.; Karakoy, T.; Kokten, K.; Nadeem, M.A. Evaluation of yield and yield components of common vetch (Vicia sativa L.) genotypes grown in different locations of Turkey by GGE bıplot analysis. Appl. Ecol. Environ. Res. 2019, 17, 15203–15217. [Google Scholar] [CrossRef]
  24. Tiryaki, G.Y.; Cil, A.; Tiryaki, I. Revealing seed coat colour variation and their possible association with seed yield parameters in common vetch (Vicia sativa L.). Int. J. Agron. 2016, 2016, 1804108. [Google Scholar]
Figure 1. Basic weather data (mean monthly temperatures in °C and rainfall in mm) based on daily records for two years.
Agriculture 11 00369 g001
Figure 2. Stability analysis for seed yield (kg ha−1) based on (a) the adaptation map where the X-axis (PC1) visualizes the stability of varieties over environments and the Y-axis—the performance of varieties for the trait; (b) the AMMI1 biplot where the Y-axis is the one visualizing the trait performance and the X-axis (PC1) visualizes the stability of varieties over environments; (c) the GGE biplot for environments depicting the stability of the environments over years via the placement as near as possible to the ideal and average environment; (d) the GGE biplot for varieties depicting the stability of the varieties over environments where the productive varieties are those to the right on the AEA vector and the stable ones are those which are as close to the AEA axis as possible.
Agriculture 11 00369 g002
Figure 3. Stability analysis for thousand kernel weight (g) based on (a) the adaptation map where the X-axis (PC1) visualizes the stability of varieties over environments and the Y-axis—the performance of varieties for the trait; (b) the AMMI1 biplot where the Y-axis is the one visualizing the trait performance and the X-axis (PC1) visualizes the stability of varieties over environments; (c) the GGE biplot for environments depicting the stability of the environments over years via the placement as near as possible to the ideal and average environment; (d) the GGE biplot for varieties depicting the stability of the varieties over environments where the productive varieties are those to the right on the AEA vector and the stable ones are those which are as close to the AEA axis as possible.
Agriculture 11 00369 g003
Figure 4. Stability analysis for the number of seeds per plant based on (a) the adaptation map where the X-axis (PC1) visualizes the stability of varieties over environments and the Y-axis—the performance of varieties for the trait; (b) the AMMI1 biplot where the Y-axis is the one visualizing the trait performance and the X-axis (PC1) visualizes the stability of varieties over environments; (c) the GGE biplot for environments depicting the stability of the environments over years via the placement as near as possible to the ideal and average environment; (d) the GGE biplot for varieties depicting the stability of the varieties over environments where the productive varieties are those to the right on the AEA vector and the stable ones are those which are as close to the AEA axis as possible.
Agriculture 11 00369 g004
Figure 5. Stability analysis for hay yield (kg ha−1) based on (a) the adaptation map where the X-axis (PC1) visualizes the stability of varieties over environments and the Y-axis—the performance of varieties for the trait; (b) the AMMI1 biplot where the Y-axis is the one visualizing the trait performance and the X-axis (PC1) visualizes the stability of varieties over environments; (c) the GGE biplot for environments depicting the stability of the environments over years via the placement as near as possible to the ideal and average environment; (d) the GGE biplot for varieties depicting the stability of the varieties over environments where the productive varieties are those to the right on the AEA vector and the stable ones are those which are as close to the AEA axis as possible.
Agriculture 11 00369 g005
Table 1. Trait stability index across environments for two farming systems: seed yield (kg ha−1), thousand kernel weight (g), number of pods per plant, number of seeds per pod, number of seeds per plant, pod length (cm), pod width (mm), (mean) pod weight (g), hay weight (kg ha−1), plant height (cm).
EnvironmentsSeed Yield (kg ha−1)Thousand Kernel Weight (g)Number of Pods per PlantNumber of Seeds per PodNumber of Seeds per PlantPod Length (cm)Pod Width (mm)Pod Weight (g)Hay Yield (kg ha−1)Plant Height (cm)
ConventionalGiannitsa4917538899512257554643241
Florina4721067629373204552647311
Trikala3719859605882116694730270
Kalambaka3717859795982534816033365
Low-inputGiannitsa48187561047221919075746296
Florina3320476638352964873636238
Trikala4418587675442486515344380
Kalambaka3918458657392104476747404
Conventional and low-inputGiannitsa3716744978271727785142269
Florina3019268638872824713034273
Trikala2717566645542146175126318
Kalambaka2317154726452154526428387
Table 2. Trait stability index across genotypes for the two farming systems: seed yield (kg ha−1), thousand kernel weight (g), number of pods per plant, number of seeds per pod, number of seeds per plant, pod length (cm), pod width (mm), (mean) pod weight (g), hay weight (kg ha−1), plant height (cm).
GenotypesSeed Yield (kg ha−1)Thousand Kernel Weight (g)Number of Pods per PlantNumber of Seeds per PodNumber of Seeds per PlantPod Length (cm)Pod Width (mm)Pod Weight (g)Hay Yield (kg ha−1)Plant Height (cm)
ConventionalFilippos20954767746831126112058120350
Omiros17515623554375623111975284331
Alexandros92780507811015857086733296
Tempi37521538012564258877347249
Zefyros4612754564143585911798352309
Pigasos30110377762854223898228262
Low-inputFilippos145474716977152411088196335
Omiros35119775561380502126196341367
Alexandros180693587280875012637075298
Tempi46385529069945711028574292
Zefyros26945476613734909439536278
Pigasos44110276683904744937825328
Conventional and low-inputFilippos40418637272353810836857345
Omiros431392415838141211908670353
Alexandros3544553759335528467031301
Tempi3634050869053928727846273
Zefyros28650426613944429368936295
Pigasos3588972733273804338125289
Table 3. Combined trait stability index across genotypes and environments for the two farming systems: seed yield (kg ha−1), thousand kernel weight (g), number of pods per plant, number of seeds per pod, number of seeds per plant, pod length (cm), pod width (mm), (mean) pod weight (g), hay weight (kg ha−1), plant height (cm).
GenotypesSeed Yield (kg ha−1)Thousand Kernel Weight (g)Number of Pods per PlantNumber of Seeds per PodNumber of Seeds per PlantPod Length (cm)Pod Width (mm)Pod Weight (g)Hay Yield (kg ha−1)Plant Height (cm)
Giannitsa
Conventional Filippos47269436788074207975069555366
Omiros1652265127867462769298377494245
Alexandros160795377853252519177340299
Tempi708875168245035610599464217
Zefyros7011926612627631136164611252198
Pigasos5712901328028353046648369213
Low-inputFilippos16742440786655741102252107370
Omiros70026121481008296342417102454272
Alexandros19031066955281070296478128250
Tempi4863958100624304957103114217
Zefyros381116871243830722219512275275
Pigasos4713408198468331322277797292
Florina
ConventionalFilippos2339771177750021389290628268451
Omiros1791232634025874396644274362
Alexandros149568846844875184484061258
Tempi47732499716828677144478264
Zefyros5511861294751,45286438254068359
Pigasos39937789142,0659581877674327
Low-inputFilippos119441126694699998106680152290
Omiros47322669340258524309566383301
Alexandros140586634747131297132338102172
Tempi32652658052868915764862214
Zefyros30853666935,609133615215928176
Pigasos32985878423,8775832455539281
Trikala
ConventionalFilippos11838413064297160018608271306
Omiros25818942257855670123085183372
Alexandros5995980672233103815647619324
Tempi24441875773652912747141370
Zefyros311255734547746377548771350
Pigasos2612748755294317105810930175
Low-inputFilippos119502111712801475151799135351
Omiros21419896257362564149192200475
Alexandros18112708110976675312438951503
Tempi53301125802900989153966124360
Zefyros45997139471936975574124115251
Pigasos45108312548308506174212130274
Kalambaka
ConventionalFilippos241378208582764780155810190546
Omiros117115814756295262779794509394
Alexandros6362054106253899813658041335
Tempi3854111385351243814179586338
Zefyros3315652471854788127014273344
Pigasos171154747334169020048014321
Low-inputFilippos159395875116827721903121115341
Omiros6701499115772819365747101716370
Alexandros165156658612830405129710673457
Tempi40736129732525759151316095321
Zefyros23106022492424453871107110433
Pigasos47925895619454526757124354
Table 4. Correlations between all the traits measured: seed yield (kg ha−1), thousand kernel weight (g), number of pods per plant, number of seeds per pod, number of seeds per plant, pod length (cm), pod width (mm), (mean) pod weight (g), hay weight (kg ha−1), plant height (cm).
Seed Yield (kg ha−1)Thousand Kernel Weight (g)Number of Pods per PlantNumber of Seeds per PodNumber of Seeds per PlantPod Length (cm)Pod Width (mm)Pod Weight (g)Hay Yield (kg ha−1)
Thousand kernel weight (g)−0.007
Number of pods per plant0.172 **0.027
Number of seeds per pod0.116 *0.057−0.106 *
Number of seeds per plant−0.0030.0390.031−0.182 **
Pod length (cm)0.116 *0.0790.0420.0640.024
Pod width (mm−0.032−0.070−0.209 **0.138 **−0.0930.046
Pod weight (g)0.109 *0.0810.0420.122 *0.017−0.104 *−0.066
Hay yield (kg ha−1)0.771 **0.0280.148 **0.140 **0.0330.132 **−0.184 **0.075
Plant height (cm)0.0780.0460.0310.079−0.0530.0000.0020.0530.097
* differences significant at p < 0.05; ** differences significant at p < 0.01.
Publisher’s Note: MDPI stays neutral with regard to jurisdictional claims in published maps and institutional affiliations.

