Article

A Spectroscopic Approach to Evaluate the Effects of Different Soil Tillage Methods and Nitrogen Fertilization Levels on the Biochemical Composition of Durum Wheat (Triticum turgidum subsp. durum) Leaves and Caryopses

1
Department of Life and Environmental Sciences, Università Politecnica delle Marche, 60131 Ancona, Italy
2
Department of Agricultural, Food and Environmental Sciences, Università Politecnica delle Marche, 60131 Ancona, Italy
3
Department of Clinical Sciences, Section of Biochemistry, Biology and Physics, Università Politecnica delle Marche, 60131 Ancona, Italy
*
Author to whom correspondence should be addressed.
These authors equally contributed to this work.
Current address: Centre for Molecular Informatics, Department of Chemistry, University of Cambridge, Cambridge CB2 1EW, UK.
Agriculture 2021, 11(4), 321; https://doi.org/10.3390/agriculture11040321
Submission received: 18 March 2021 / Revised: 1 April 2021 / Accepted: 4 April 2021 / Published: 6 April 2021
(This article belongs to the Section Crop Production)

Abstract

:
The agricultural sector is required to produce food at the same pace as population growth, while accounting for pollution and costs. For this reason, conservative agricultural practices have been employed worldwide. Attenuated Total Reflectance–Fourier Transform Infrared (ATR-FTIR) spectroscopy has the ability to provide a snapshot of the macromolecular composition of a sample in a timely and cost-effective way and it has been widely applied in the field of agriculture to assess food quality. The aim of this study was to exploit ATR-FTIR spectroscopy to assess the impact of different soil tillage methods (conventional tillage, CT; minimum tillage, MT, and no tillage, NT) and nitrogen fertilization levels (0, 90 and 180 kg N ha−1) on the macromolecular composition of leaves and caryopses of durum wheat (Triticum turgidum subsp. durum). The analysis of the spectral data revealed that the quality of durum wheat, in terms of protein content, grown on soil with no tillage was not reduced. Indeed, with regards to caryopses, the different tillage methods influenced only the lipid and hemicellulose content, whereas the macromolecular composition of leaves was sensitive to tillage methods mostly during the early stage of growth. Moreover, no relevant effects were found in leaves and caryopses when different fertilizer concentrations were used. These results provide important knowledge supporting the adoption of both no-tillage soil treatments and reduced fertilization dosage for the development of durum wheat management strategies and support the use of spectroscopy for conservative agriculture practices.

1. Introduction

According to the 2019 report of the United Nations, the world population is expected to increase by 2 billion in the next 30 years [1]. As a consequence, there is an increasing need for agriculture to fill the demand for food while accounting for pollution and production costs [2].
The adoption of conservative agriculture (CA) practices represents a key step to undertake in order to reduce both the economic and the environmental impact of worldwide agriculture. CA has three main pillars, which include: (i) the reduction of soil disturbance in order to preserve soil structure, soil fauna and organic matter; (ii) a permanent soil cover to protect the soil and contribute to the suppression of weeds, and (iii) diversified crop rotations and combinations, to promote soil micro-organisms and to disrupt plant pests, weeds and diseases [3]. Among these pillars, the reduction of soil disturbance is the one that has received the most attention from the scientific community due to its wide range of associated benefits. More specifically, reduced tillage—or, even better, the total absence of tillage—has been shown to reduce soil erosion, nitrate leaching and agricultural machinery use, with the latter lowering greenhouse gas emissions and fuel costs [4]. In addition, the reduction of soil disturbance results in a higher level of humidity and nutrient levels, a reduced mineralization rate of the organic matter and enhanced diversity and stability of the soil microbial community [5,6,7].
State-of-the-art science in the agricultural field relies on the use of precision agriculture approaches [8,9]. These approaches employ either digital measuring devices, which are able to estimate different parameters (i.e., chlorophyll/nitrogen status, soil plant analysis development (SPAD)) [10,11], or remote sensors, such as hyperspectral or RGB cameras mounted on unmanned aerial vehicles, which allow the creation of spatial maps of a wide range of plant metrics (i.e., nutrient status, growth vigor and biomass, water status, etc.) [12,13,14]. Although these methods have been successfully applied towards the investigation of the effects of both tillage methodologies and nitrogen fertilization [15,16,17,18], they lack the ability to provide a snapshot of plants’ biochemical features, which have the potential to further refine current farming management strategies. Fourier Transform Infrared (FTIR) spectroscopy has been already employed, in the mid- and near-spectral regions, to spectrally characterize several agricultural samples [19,20] as well as to assess food quality and for cereal classification [21,22,23,24]. With respect to the above-described and routinely employed methods, FTIR spectroscopy allows us to obtain, in the same sample and through a single measurement, information on the macromolecular composition of plants, in terms of the lipid, protein and carbohydrate patterns. Moreover, it does not require any specific sample processing before spectral acquisition and it is completely label-free. In particular, among the infrared spectroscopy setups, Attenuated Total Reflectance–Fourier Transform Infrared (ATR-FTIR) spectroscopy is particularly suitable for the analysis of solid biological samples, since it allows us to increase the signal-to-noise ratio with respect to the transmission mode [25,26].
In this context, we leveraged the ability of ATR-FTIR spectroscopy, along with multivariate analyses, to assess the impact of different soil tillage methods (conventional tillage, CT; minimum tillage, MT, and no tillage, NT), and nitrogen fertilization levels (0, 90 and 180 kg N ha−1) on the macromolecular composition of leaves and caryopses of durum wheat (Triticum turgidum subsp. durum). The obtained results supported the adoption of both no-tillage soil treatments and a reduced fertilization dosage in durum wheat management strategies, also confirming the use of spectroscopy as a valuable tool in conservative agriculture practices.

2. Materials and Methods

2.1. Experimental Site and Design

The study was performed between November 2017 and July 2018, in the experimental site located at the “Pasquale Rosati” experimental farm of Università Politecnica delle Marche, Agugliano, Ancona (Italy) (43°32′ N, 13°22′ E, 100 m a.s.l.) (Figure 1A). This site was established in 1994 and is still on-going: the field has a rainfed 2-year rotation with durum wheat (Triticum turgidum L. var. durum cv. Grazia, ISEA) and sunflower (Helianthus annuus L., cv. Starsol, ISEA) up to 2001 or maize (Zea mays L., DK440 hybrid, Dekalb Monsanto, FAO class 300) from 2002 onwards [27]. It is a silty-clay soil, classified as Calcaric Gleyic Cambisols [28]. All the information on soil properties is investigated in Fiorentini et al., 2019 [17].
The site exhibits a Mediterranean climate, with an average rainfall of 838 mm in the long-term period (1998–2018): November was the rainiest month (93 mm), whereas July was the driest (36 mm); moreover, the average minimum air temperature was 11.4 °C, whereas the maximum was 20.0 °C. As regards the period of the study (November 2017–July 2018), a trend similar to the average was observed in February, which was the rainiest month (173 mm), whereas January was the driest (29 mm); the average minimum temperature of the air was 10.0 °C, whereas the maximum was 17.9 °C. Thermo-pluviometric data are showed in Table 1.
On the experimental site, three portions (5.7 × 80 m2 each) corresponding to non-fertilized soil, treated with conventional tillage (CT0), minimum tillage (MT0) and no tillage (NT0) methods were chosen (Figure 1B). In detail, conventional tillage (CT) is representative of the usual tillage practice in the study area—soil is ploughed with moldboard at a depth of 40 cm. Minimum tillage (MT) involves ploughing with a chisel at a depth of 10 cm; efore the sowing date, the seedbed was prepared with double harrowing. No-tillage (NT) soil was left undisturbed, except for crop residues, weed chopping and total herbicide spraying before direct seed drilling. Moreover, two further portions (5.7 × 80 m2 each) of no-tillage soil submitted to nitrogen fertilizer treatments with 90 and 180 kg N ha−1 (respectively NT1 and NT2) were selected (Figure 1B). The N source, distributed in two rates in March and April after Zadoks scale (ZS) 22 and ZS 35, was urea (46%). The treatment with 90 kg N ha−1 (NT1) was compliant with the agri-environmental measures adopted within the rural development plans at the local scale [27], whereas the treatment with 180 kg N ha−1 (NT2) was the usual N rate used in the study area of the experiment. The no-tillage soil without fertilization (NT0) was used as a control. To perform a reliable and representative sampling, each portion (NT0, MT0, CT0, NT1 and NT2) was furtherly divided into three parts (5.7 m width and ~27 m length), named up (U); mid (M) and bottom (B).
All sampling was carried out in 2018 and sampling times were directly related to phenology and fertilization times, according to the Zadoks scale [29]. In particular, leaves were picked up at three timepoints, on 28 March 2018 (ZS 22), 26 April 2018 (ZS 35) and 28 May 2018 (ZS 60), whereas caryopses were collected at two timepoints, on 28 May 2018 (ZS 60) and 5 July 2018 (ZS 92), respectively before and after the harvest. ZS 22, representing the tillering phase (Zadoks score 22), corresponded to the day before the first fertilization; ZS 35, representing the stem elongation phase (Zadoks score 35), corresponded exactly to one month after the first fertilization and to the day before the second fertilization; ZS 60, representing the anthesis phase (Zadoks score 60), corresponded to one month after the second fertilization; ZS 92, representing the ripening phase (Zadoks score 92), corresponded to the day just before the harvest time [29].
A complete overview of the experimental setup is reported in Figure 2.

2.2. ATR-FTIR Measurements and Data Analysis

IR spectra were acquired in reflectance mode using a Perkin Elmer Spectrum GX1 spectrometer, using the ATR accessory equipped with a ZnSe diamond crystal. The spectral range was 4000–650 cm−1, with a spectral resolution of 4 cm−1; each spectrum was the result of 64 scans.
Leaves and caryopses of durum wheat, sampled as described above, were air-dried at 25 °C for 48 h; caryopses were also finely powered using liquid nitrogen. Then, five IR spectra were acquired on each sample: on the upper pagina of leaves and on the powder of caryopses. A background spectrum was collected before each sample acquisition. All the experimental groups are reported in Table 2. Raw IR spectra were converted in absorbance mode and vector normalized, and then submitted to multivariate analysis in the R statistical environment. Principal component analysis (PCA) was performed to compare the following spectral populations: l-NT0/l-MT0/l-CT0 at ZS 22, ZS 35 and ZS 60; c-NT0/c-MT0/c-CT0 at ZS 60 and ZS 92; l-NT0/l-NT1/l-NT2 at ZS 22, ZS 35 and ZS 60; c-NT0/c-NT1/c-NT2 at ZS 60 and ZS 92.
Pre-processed spectra were also submitted to univariate analysis. The integrated area of the following spectral ranges was calculated using the “integration” routine (mode B) in the Opus 7.1 software package (Bruker Optics, Ettlingen, Germany): 3050–2800 cm−1 (stretching vibrations of alkyl groups in lipid chains, LIP), 1700–1480 cm−1 (Amide I and II vibrational modes of proteins, PRT), and 1250–850 cm−1 (stretching vibrations of C-O groups of cellulose, CE). Durum wheat leaves’ and caryopses’ compositions in terms of lipid alkyl chains (LIP) and proteins (PRT) were calculated by means of reconstructed ratios of each band area with the area of the cellulose band (CE): LIP/CE and PRT/CE.
To evaluate the topographical distribution of the most relevant biochemical compounds in leaves at ZS 22, ZS 35 and ZS 60, and caryopses at ZS 60 and ZS 92 and to detect possible modifications as a function of time, false color images representative of U, M and B portions of CT0, MT0 and NT0 areas were created. To this purpose, IR maps were generated and integrated on the following spectral regions: 3050–2800 cm−1 (alkyl groups in lipid chains, LIP maps), 1700–1480 cm−1 (proteins, PRT maps) and 1250–850 cm−1 (cellulose, CE maps) (“assemble map” and “integration” routines, Opus 7.1 software package, Bruker Optics, Ettlingen, Germany).

2.3. Statistical Analysis

Data visualization and statistical analyses were all performed within the R statistical environment. Principal component analysis (PCA) was performed using the “prcomp” function. Differences in soil management, as well as those on fertilization levels, at each sampling time were determined by either one-way ANOVA followed by a Tukey post-hoc test or by the Kruskal–Wallis test followed by a Dunn post-hoc test, depending on the data distribution. p-value adjustment for multiple tests was performed using the Benjamini–Hochberg (BH) method. Different letters over box plots indicate statistically significant differences among the above-defined experimental groups, which was set at p < 0.05. Data normality was assessed using the Shapiro–Wilk test.

3. Results

The average absorbance spectra of leaves (collected at ZS 22, ZS 35 and ZS 60 timepoints) and caryopses (collected at ZS 60 and ZS 92 timepoints) are shown in Figure 3. The wavenumbers of the most significant peaks are reported on the top of the peaks and listed in Table 3, together with the corresponding vibrational modes and biochemical assignments.
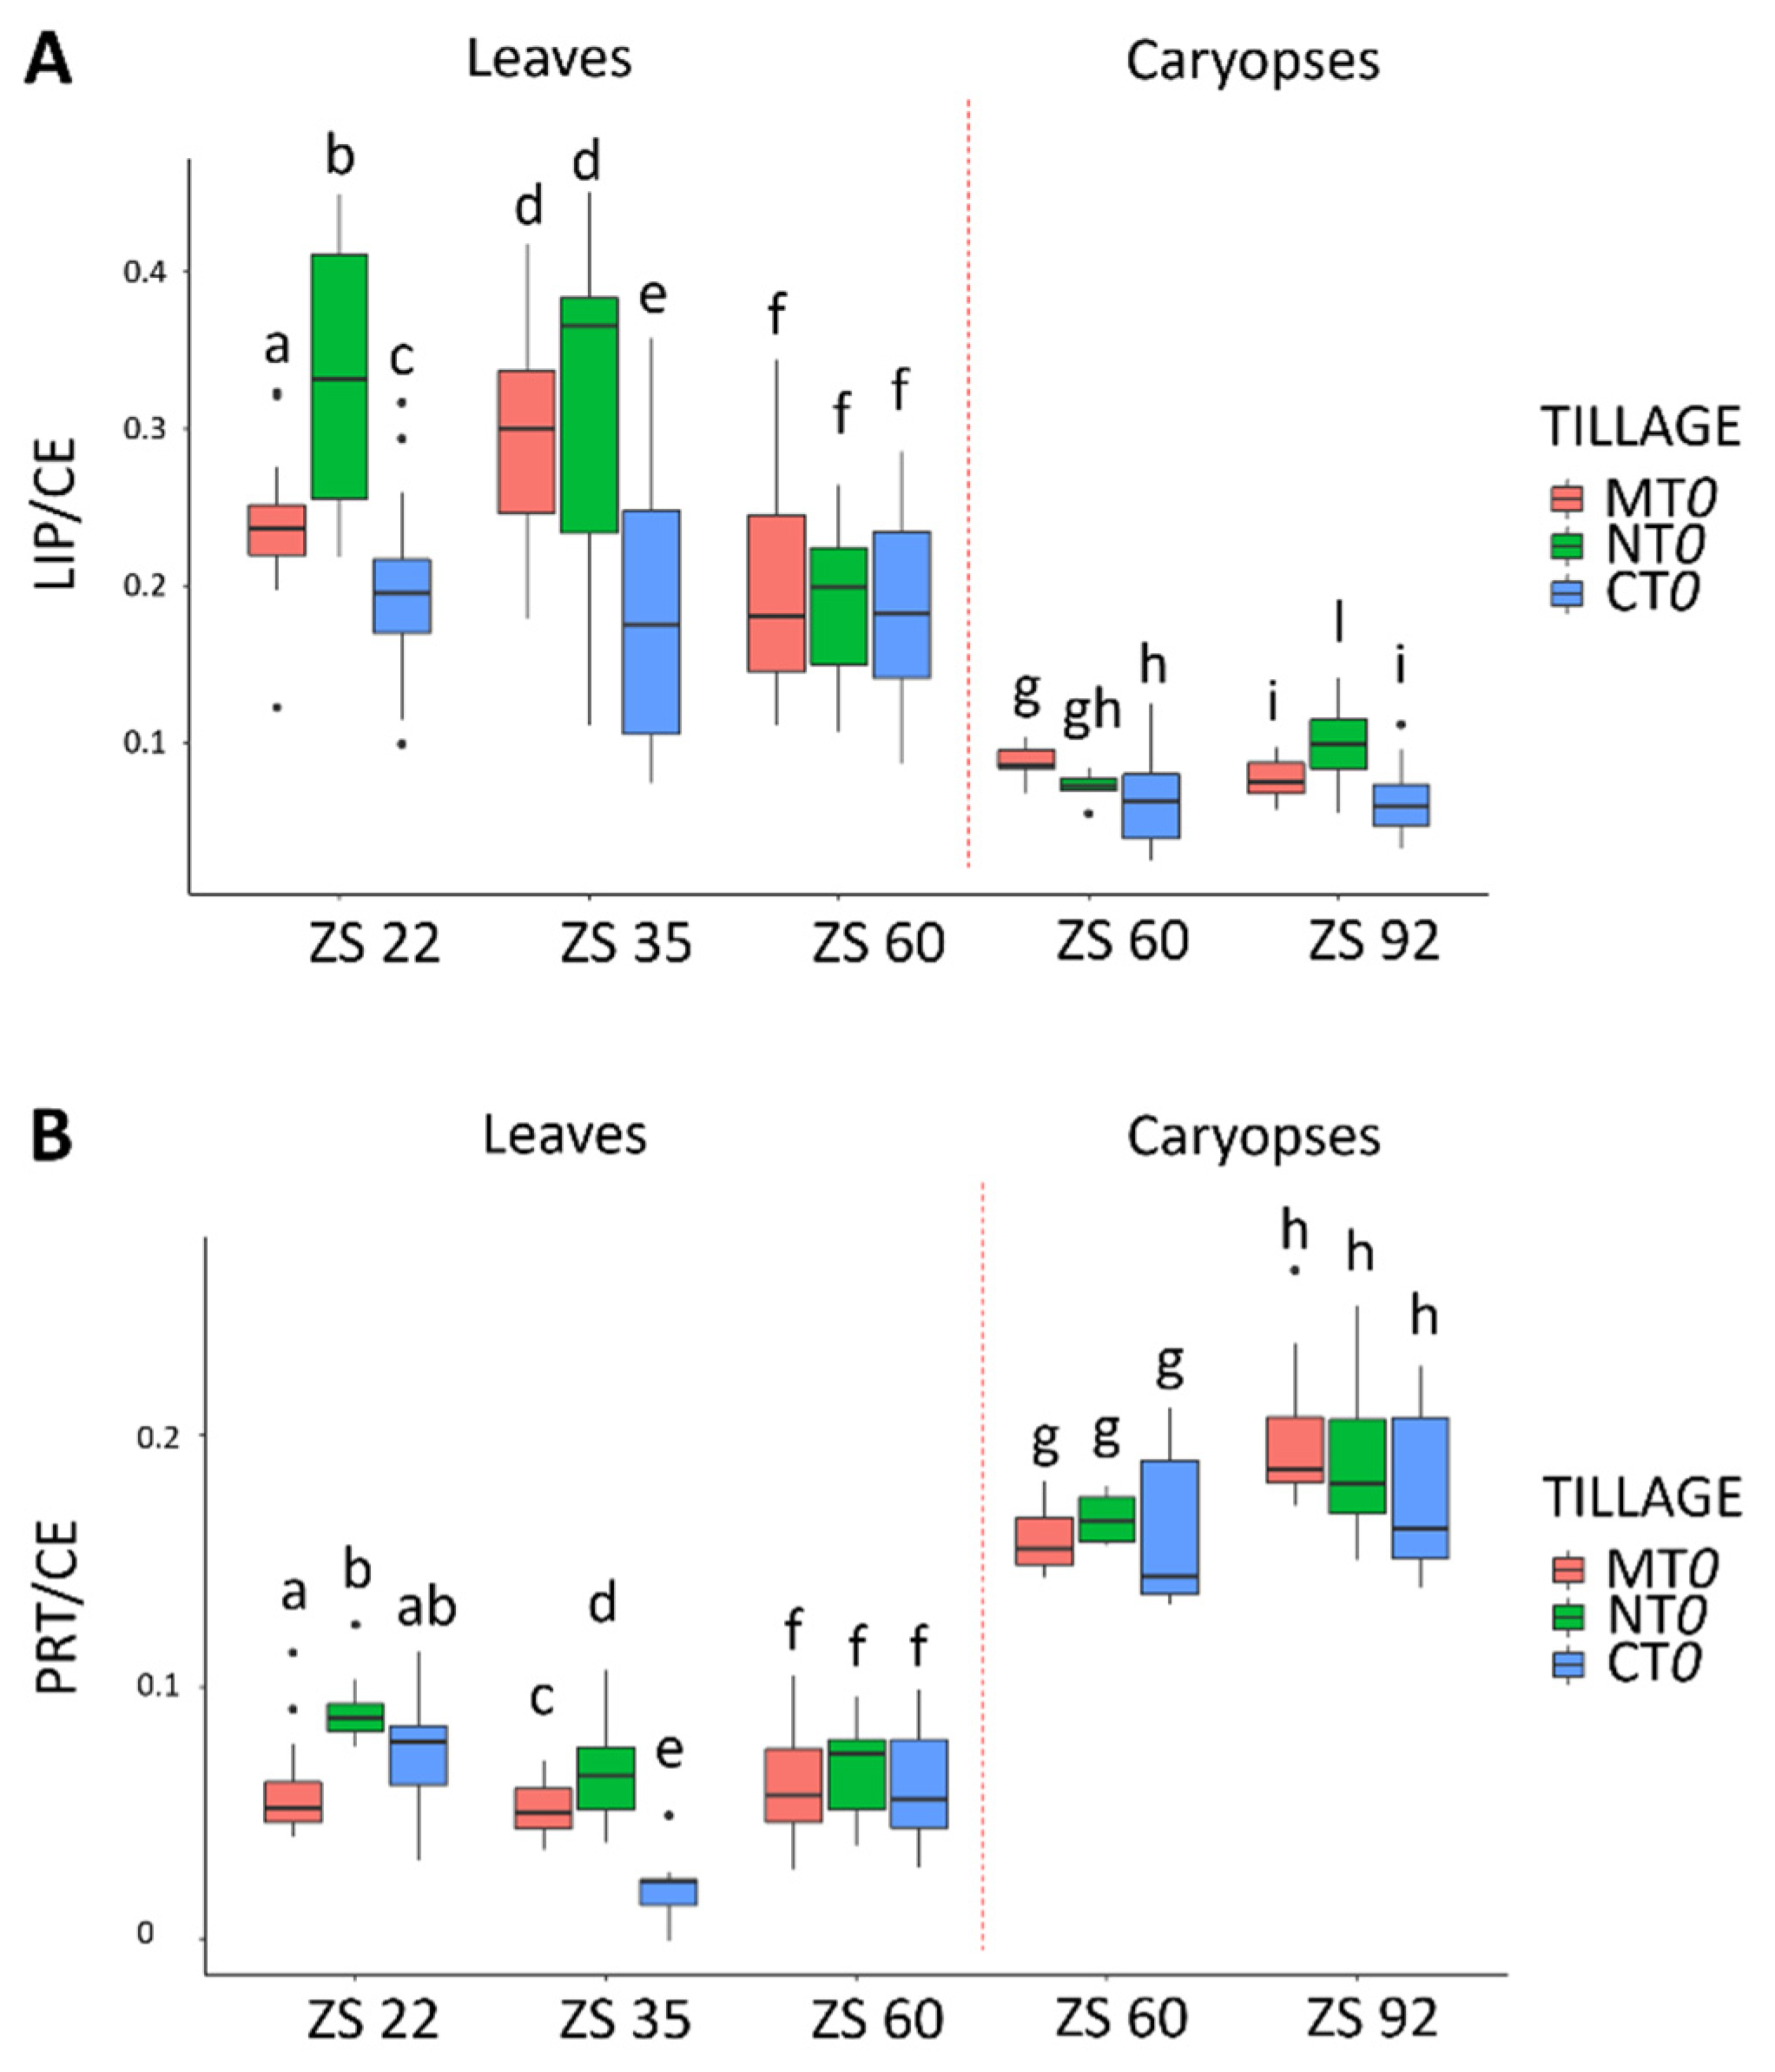
An exploratory analysis using PCA was employed to investigate the presence of potential differences in durum wheat leaves’ and caryopses’ composition between the different tillage methods (Figure 4). Based on a visual inspection, the ability of the different tillage methods to induce substantial changes in leaf composition was already clear at the earliest timepoint (ZS 22), but these differences were found to be reduced over time up to the last timepoint (ZS 60) (Figure 4A). On the contrary, the effect of the different tillage methods on caryopses was found to be stable in the two timepoints tested (Figure 4B). It is worth mentioning the fact that at the timepoint ZS 60 the tillage effects were more evident in the caryopses than in the leaves. To better investigate the differences arising as a consequence of different tillage methods and to provide biological insights, the biochemical composition of these samples was investigated. For this purpose, the LIP/CE (lipids to cellulose ratio) and PRT/CE (proteins to cellulose ratio) parameters were analyzed (Figure 5); the band referred to cellulose (CE) at 1033 cm−1 was considered as standard because of its minimum variability in all the acquired spectra. When investigating lipid content (LIP), a greater variability was observed in leaves with respect to caryopses (Figure 5A). More specifically, statistically significantly higher values of lipids were detected in leaves at ZS 22 in l-NT0, with respect to l-CT0 and l-MT0 (p < 0.05) whereas at ZS 35, l-NT0 still displayed higher lipid values with respect to l-CT0 (p < 0.05), but they were comparable with those of l-MT0 (p > 0.05). As observed in the PCA, in which differences as a consequence of tillage methods were more evident at the earliest timepoint (ZS 22) but gradually disappeared up to the latest timepoint (ZS 60), no differences in alkyl chain content were found at ZS 60 (p > 0.05) (Figure 5A). Conversely, in caryopses, only a few differences were detectable at ZS 60, where alkyl chain content was slightly higher in c-CT0 than c-MT0 (p > 0.05). At ZS 92, the month in which the harvest takes place, lipid content was not found to differ between the different tillage methods (Figure 5A). Overall, lipid content was found to be higher in leaves compared to caryopses.
When investigating the protein content (PRT/CE), a higher amount was found in caryopses compared to leaves. Specifically, l-NT0 samples displayed the highest values at ZS 22 and ZS 35 (p < 0.05), whereas at ZS 60, no difference was observed among different tillage methods (p > 0.05) (Figure 5B). When considering caryopses, no statistically significant differences were found between the different tillage methods (p > 0.05).
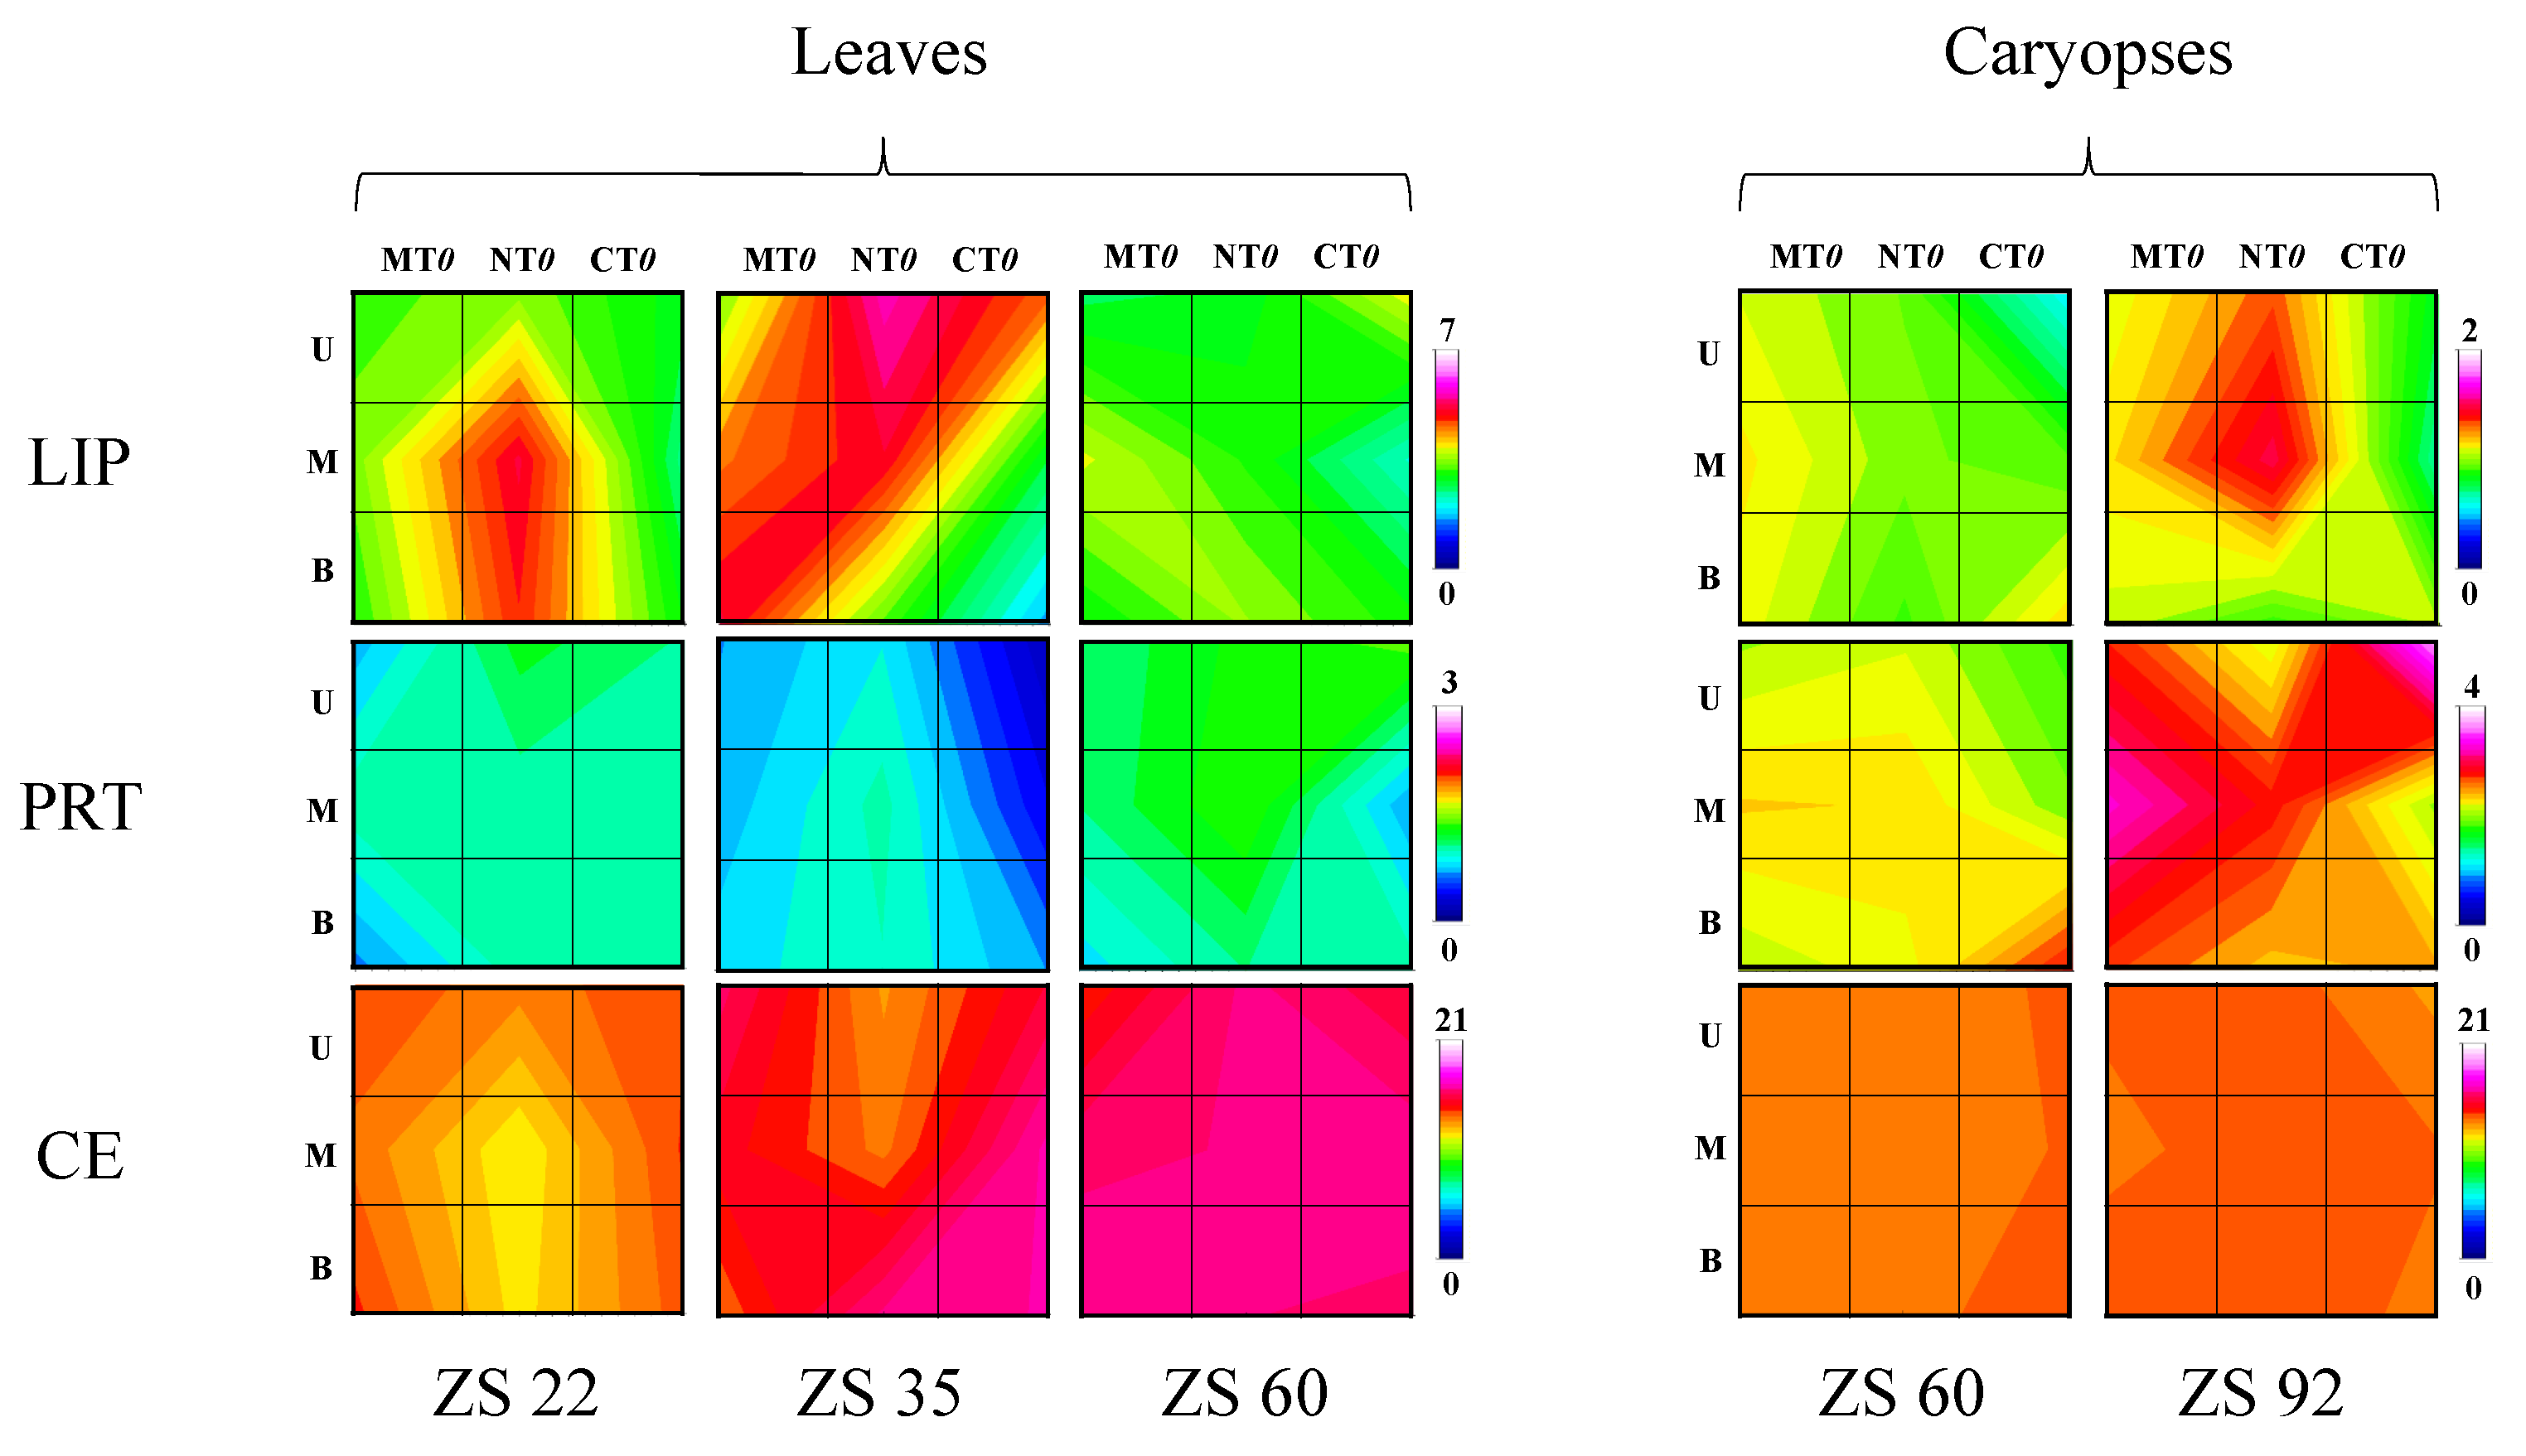
The biochemical composition of both durum wheat leaves and caryopses was further investigated by means of IR maps (Figure 6). The maps display the topographical distribution of lipids (LIP), proteins (PRT) and cellulose (CE) in leaves (collected at ZS 22, ZS 35 and ZS 60) and caryopses (collected at ZS 60 and ZS 92) with respect to the experimental site. In leaves, a different distribution of LIP, PRT and CE was observed in the different soil tillage methods at ZS 22 and ZS 35, whereas at ZS 60 a more homogeneous distribution was found, supporting the findings of both PCA and biochemical composition analyses. On the other hand, in caryopses relevant differences were found in the distribution of LIP and PRT between ZS 60 and ZS 92, whereas no change was observed in CE.
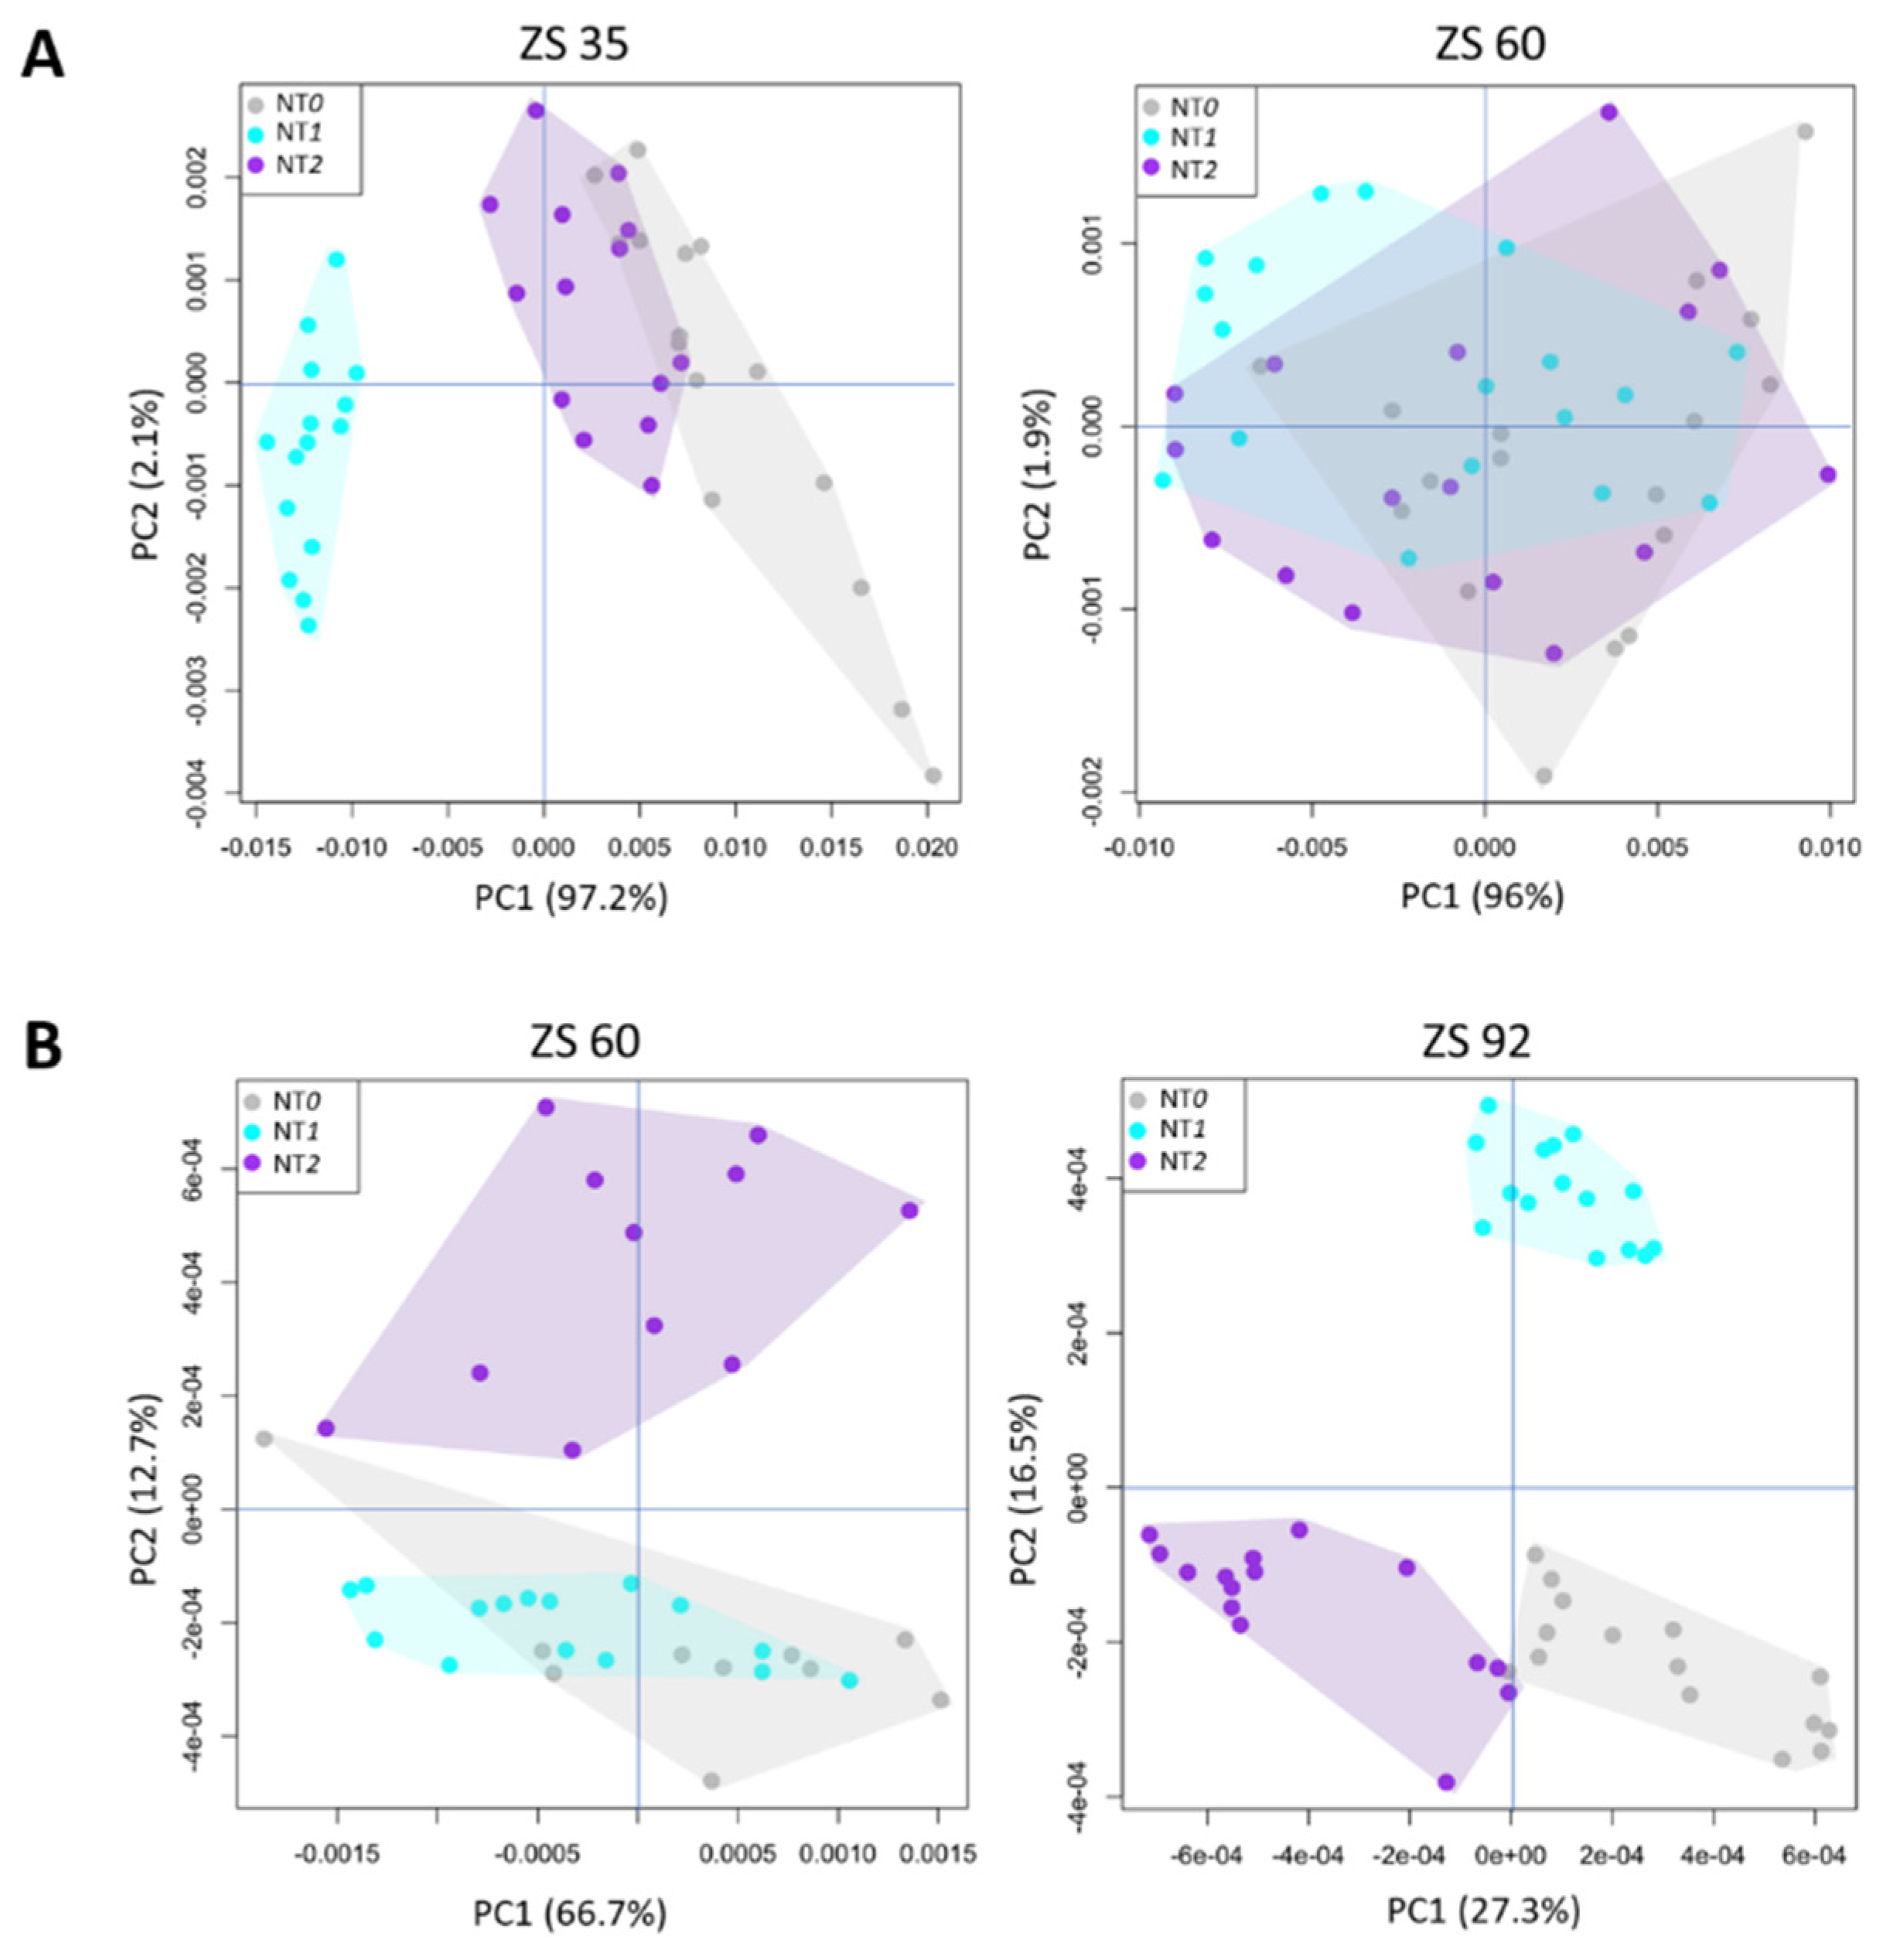
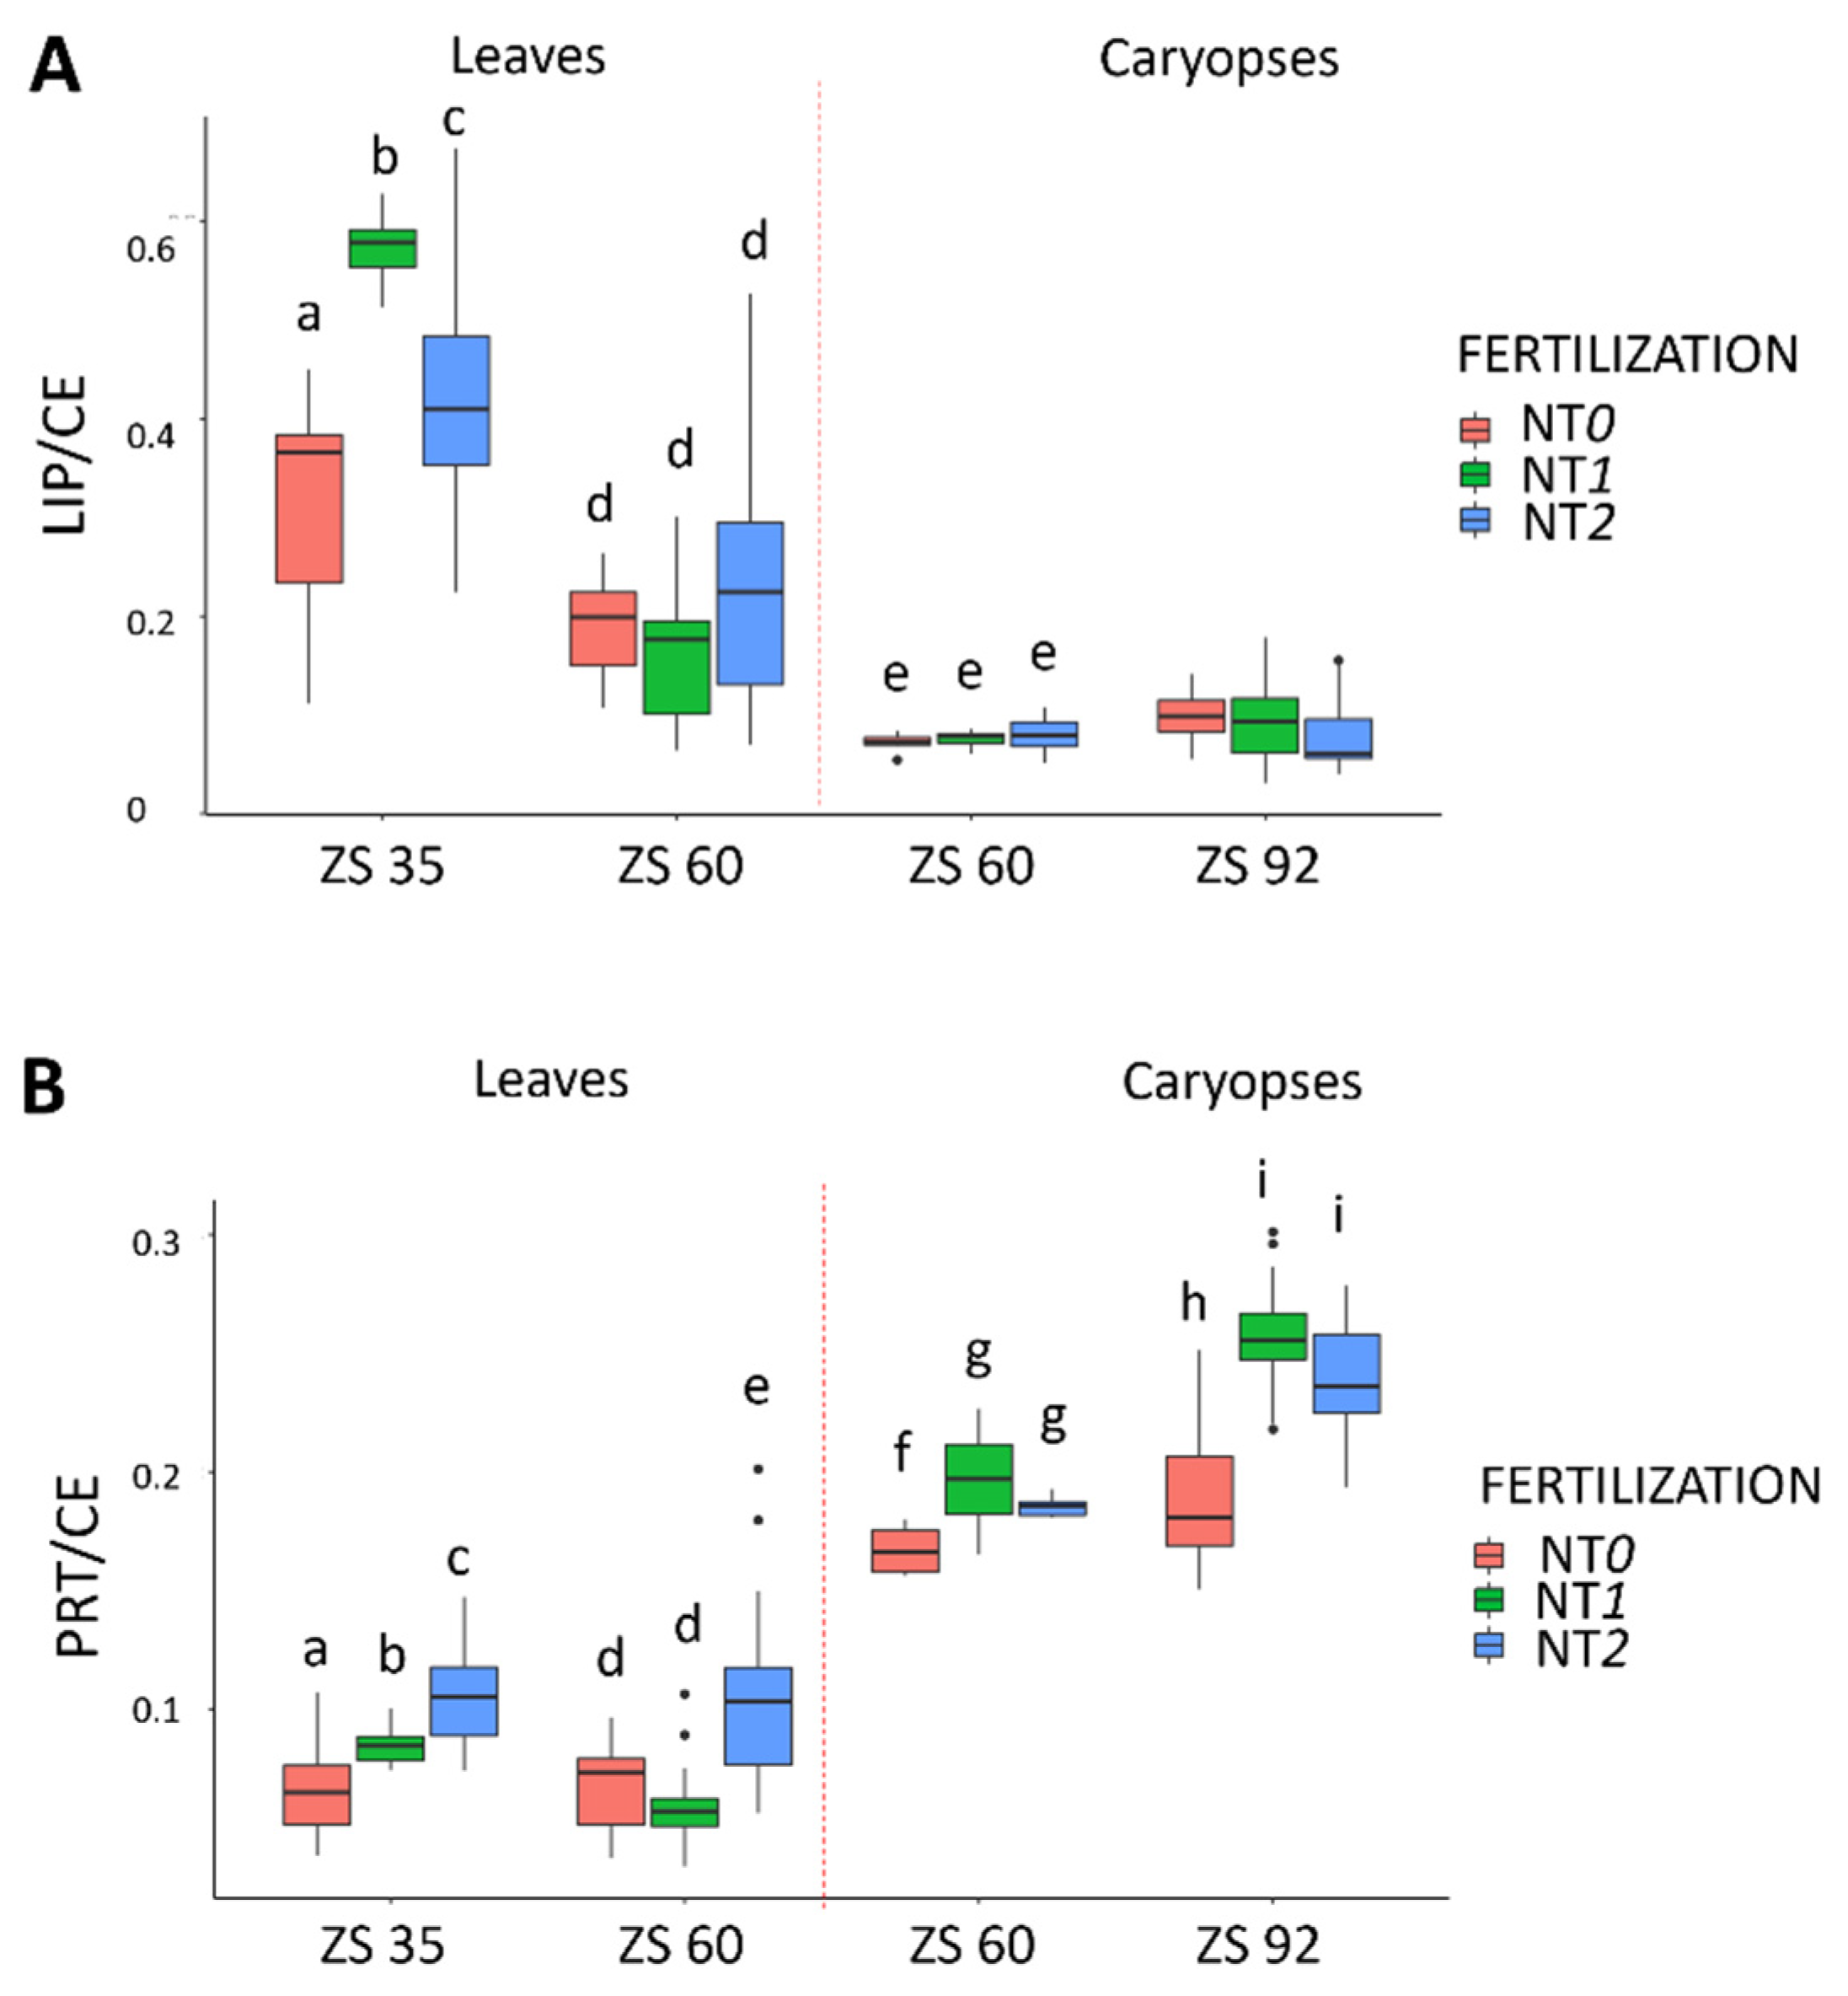
Having assessed the effects of different tillage methods on durum wheat biochemical composition and having found that quality, in terms of protein content, was not reduced as a consequence of no tillage, we set to evaluate whether the effects of different nitrogen fertilization dosages, 90 kg N ha−1 (l-NT1 and c-NT1) and 180 kg N ha−1 (l-NT2 and c-NT2) of nitrogen fertilizer, were able to modulate both leaves’ and caryopses’ macromolecular composition. An exploratory analysis by PCA identified differences among fertilization dosages at ZS 35 where the PC1, which accounted for the largest source of variation, clearly discriminated both l-NT0 and l-NT2 with respect to l-NT1. Interestingly, no segregation among groups was observed at ZS 60 (Figure 7A). Conversely, in caryopses a clear discrimination among different nitrogen dosages was already detectable at ZS 60, where c-NT2 was segregated along PC2 axis with respect to c-NT0 and c-NT1. This separation increased at ZS 92, the month in which the harvest takes place, where differences were detectable among all the groups (Figure 7B).
We then set to investigate whether these changes were reflected by both durum wheat leaves’ and caryopses’ biochemical content and whether the higher concentration of fertilizer significantly improving crop quality over the lowest concentration. In leaves, statistically significant differences in lipid content (LIP/CE) were already observed at ZS 35 (p < 0.05) between all the groups, whereas no differences were found at ZS 60 (Figure 8A). Conversely, no statistically significant differences were found in caryopses at both the timepoints (ZS 60 and ZS 92) (Figure 8A). The leaves’ protein content (PRT/CE) after fertilization with both concentrations was found to be significantly higher than the control at ZS 35, but only the highest concentration led to a statistically significant increase at ZS 92. Instead, in caryopses, although both the nitrogen dosages (c-NT1 and c-NT2) induced a significant increase in proteins with respect to c-NT0 (p < 0.05), no differences were detected between the two concentrations (Figure 8B).

4. Discussion

In this study, we leveraged the potential of ATR-FTIR spectroscopy to investigate the effects of different tillage methods and nitrogen fertilization levels on the biochemical composition of durum wheat leaves and caryopses. In fact, a deeper knowledge of plant composition and needs, in relation with the crop phenological stage, could be used to provide the correct type, amount and spatial position of fertilizer using site-specific management (SSM) technology, which is the most popular precision agriculture application [32]. The use of SSM can provide several positive effects such as balancing and stabilizing soil nutrients, producing better economic income for the farmer and improving the soil fertility and sustainability indicators [33].
Orsini and colleagues [34] demonstrated on the same site that unfertilized soil with no tillage process (NT0) achieved better performance in terms of the number of kernels per spike (+46%) and grain yield (t ha−1) (+48%) than the unfertilized conventional tillage process (CT0). This could likely be ascribable to the higher organic matter (+24.7%) and nitrogen availability (+24.6%) present in the NT soil as a consequence of the repeated years of no-tillage management [4]. Conversely, when nitrogen has been supplied to a crop, differences among soil managements are flattened, as reported by Fiorentini et al. [35]. In particular, no significant difference was reported between NT0-NT1 and CT0-NT1 in terms of the number of kernels per spike and grain yield (t ha−1), with average values respectively of 31 and 3.85 t ha−1. The same trend was observed between NT0-NT2 and CT0-NT2, with an average value of 35 number kernels per spike and 5.28 t ha−1 for grain yield. Moreover, vegetation indexes calculated using multispectral images from an unmanned aerial vehicle (UAV) showed an excellent capability to be related with the crop nutritional status [16]. In addition, Tabaglio and colleagues revealed that soil organic matter, total nitrogen, available phosphorus and water aggregate stability were found to be significantly increased under no-tillage conditions compared with conventional tillage ones [36]. The no-tillage method also brings benefits to the environment in terms of soil erosion, leaching of nitrates, reduction in the use of agricultural machinery, as well as a lower emission of greenhouse gases and fuel costs [37].
Infrared analysis is widely applied in the biological field for its ability to provide a molecular fingerprint of the most relevant biological molecules [38,39]. Its translation to agronomy has the potential to give additional insight into crop quality, with the final goal of supporting the development of precision agriculture applications [40,41]. In this light, the application of ATR-FTIR to study both durum wheat leaves and caryopses sheds light on the ability of the different tillage methods to modulate crop quality by influencing its biochemical content. In particular, the relationships between the different tillage methods identified by PCA are in agreement with the differences detected in terms of biochemical composition. More specifically, the different soil tillage methods significantly modulated the biochemical composition of unfertilized durum wheat leaves early in March (ZS 25) and April (ZS 35), whereas in May (ZS 60), these differences were smaller or no longer detectable. This finding, consistent for both lipids and proteins, suggests that leaves are sensitive to tillage methods during only the early stage of growth, whereas differences are significantly reduced at later stages. When investigating the caryopses, their biochemical content was found to be significantly affected by the different tillage methods in terms of lipids but not of proteins.
It is reported that lipids and proteins can be considered indexes of soil organic matter [17,27]. The 3050–2800 cm−1 spectral region is likely attributed to the symmetric and asymmetric stretching modes of lipid alkyl chains, whereas with regard to proteins, the region of interest is that at 1700–1480 cm−1, containing the vibrational modes related to peptide bindings (ν C=O, ν C-N, δ N-H). Lipids are present in food seeds, leaves, stems and roots, and in all the biological membranes, in the form of phospholipids, glycolipids and sterols, and make up the outer surface of leaves, fruits and stems, in the form of cutin, wax and suberin [42,43]. Their content in wheat caryopses is associated with its maturity, class and cropping condition. Regarding the class, hard wheat varieties contain more lipid compared to soft wheat types. IR analysis indicated a lower amount of long chain lipids in caryopses with respect to leaves. Moreover, the lipid content was significantly higher in caryopses of crops grown on soil where no tillage was performed. Despite a significant number of proteins having already been characterized in mature grain, most of them are only present in small amounts and their impact is low [36,44]. However, a small protein fraction called grain storage proteins (GSPs), of which the amount and impact are of paramount importance, is also present. This fraction, accounting for 60–80% of the total seed proteins, corresponds to the gluten proteins (mainly glutenins and gliadins) and plays an important role as a quality determinant, since it affect dough elasticity and extensibility, which are key properties in the production of a range of end-products [45,46]. Caryopses’ protein content was found not to be modulated by the different tillage methods, but a significantly higher content was found in caryopses compared with leaves.
According to Pittelkow and colleagues, no tillage may lead to reduced yields; however, when NT is combined with the other two CA principles of residue retention and crop rotation, its negative impact is minimized [47]. Moreover, Seddaiu and colleagues recently assessed the effects of different tillage practices on the same experimental site and demonstrated that for durum wheat, the no-tillage practice did not influence total yields [27]. All our results are in line with these findings, supporting the hypothesis that ground where no tillage was applied has agronomic and environmental advantages.
Having highlighted the benefits of no-tillage practices, we set out to explore whether durum wheat leaves’ and caryopses’ biochemical content could be influenced by fertilization. Interestingly, the half-dose (90 kg N ha−1) was able to produce results comparable to the highest dose (180 kg N ha−1), suggesting that it could eventually be considered a good choice for fertilization, instead of the full one. Our results are not completely in line with those obtained by Seddaiu and colleagues and by Orsini and colleagues. Our hypothesis is that nitrogen content is not only due to the nitrogen administered dose (0, 90 kg N ha−1 and 180 kg N ha−1), but that its presence is also linked to the overall rainfall registered in the experimental site during the considered period—the less the rainfall, the less plants are able to absorb and to commute nitrogen in organic matter, especially protein [34]. In fact, it has been recorded that the total rainfall for the month of April 2018 was considerably lower with respect to the historical value, probably contributing to a lack of nitrogen absorption in the soil. At the same time, the maximum and minimum temperatures registered in April 2018 were higher than the historical values, leading to a higher volatilization of the administered nitrogen. It is widely known that protein concentration in wheat can be influenced by genotype, environmental conditions and the availability of nutrients in the soil (especially nitrogen). Indeed, under dry conditions, the uptake of nitrogen fertilizer from the soil may be impaired [48].

5. Conclusions

In conclusion, the obtained results support the use of ATR-FTIR spectroscopy in conservative agricultural practice to obtain reliable and objective evidence on the biochemical composition of a crop during its growth and to pave the way for the development of efficient crop strategies. With regard to durum wheat farming, the analysis of the spectral data confirmed the beneficial adoption of no-tillage methods and demonstrated how the lowest concentration of nitrogen fertilizer was enough to obtain high quality caryopses. All these findings support the development of good practices, minimizing the impact on the environment. Thanks to these encouraging results, we are planning to extend this method to study other crops over a longer period (2–3 years) in order to correlate spectral data to weather conditions as well.

Author Contributions

R.O. and E.G. conceived and designed the experiment. M.F. and S.Z. carried out the sampling activities. C.P., A.B. and S.A. processed the samples. D.B., C.P., V.N. and E.G. analyzed the data. D.B., C.P., R.O., E.G. and A.V. wrote the paper. All authors have read and agreed to the published version of the manuscript.

Funding

This research was supported by Università Politecnica delle Marche, through University Strategic Project (PSA 2017) “PFRLab: Setting of a Precision Farming Robotic Laboratory for cropping system sustainability and food safety and security” and Regione Marche through measure 16.1 Action 2 of the Rural Development Plan (PSR 2014/2020) “Precision agriculture: reduction of the environmental impact of production systems” (project ID 29000).

Institutional Review Board Statement

Not applicable.

Informed Consent Statement

Not applicable.

Acknowledgments

The authors wish to thank engineers and workers of the “Pasquale Rosati” experimental farm of the Università Politecnica delle Marche and Carla Conti of the Department of Materials, Environmental Science and Urban Planning, of the Università Politecnica delle Marche for their professionality and technical contribution. Weather data were provided by the Marche Agrometeo service (ASSAM) (www.assam.marche.it, 2016 ©).

Conflicts of Interest

The authors declare no conflict of interest.

References

  1. United Nations. World Population Prospects 2019: Highlights; ST/ESA/SER.A/423; Department of Economic and Social Affairs: New York, NY, USA, 2019. [Google Scholar]
  2. Bodirsky, B.L.; Popp, A.; Lotze-Campen, H.; Dietrich, J.P.; Rolinski, S.; Weindl, I.; Schmitz, C.; Müller, C.; Bonsch, M.; Humpenöder, F.; et al. Reactive nitrogen requirements to feed the world in 2050 and potential to mitigate nitrogen pollution. Nat. Commun. 2014, 5, 3858. [Google Scholar] [CrossRef] [PubMed] [Green Version]
  3. Kassam, A.; Friedrich, T.; Derpsch, R. Global spread of Conservation Agriculture. Int. J. Environ. Stud. 2019, 76, 29–51. [Google Scholar] [CrossRef]
  4. Iocola, I.; Bassu, S.; Farina, R.; Antichi, D.; Basso, B.; Bindi, M.; Dalla Marta, A.; Danuso, F.; Doro, L.; Ferrise, R.; et al. Can conservation tillage mitigate climate change impacts in Mediterranean cereal systems? A soil organic carbon assessment using long term experiments. Eur. J. Agron. 2017, 90, 96–107. [Google Scholar] [CrossRef]
  5. López-Garrido, R.; Madejón, E.; Murillo, J.M.; Moreno, F. Short and long-term distribution with depth of soil organic carbon and nutrients under traditional and conservation tillage in a Mediterranean environment (southwest Spain). Soil Use Manag. 2011, 27, 177–185. [Google Scholar] [CrossRef]
  6. Badagliacca, G.; Benítez, E.; Amato, G.; Badalucco, L.; Giambalvo, D.; Laudicina, V.A.; Ruisi, P. Long-term no-tillage application increases soil organic carbon, nitrous oxide emissions and faba bean (Vicia faba L.) yields under rain-fed Mediterranean conditions. Sci. Total Environ. 2018, 639, 350–359. [Google Scholar] [CrossRef]
  7. Wang, Y.; Li, C.; Tu, C.; Hoyt, G.D.; DeForest, J.L.; Hu, S. Long-term no-tillage and organic input management enhanced the diversity and stability of soil microbial community. Sci. Total Environ. 2017, 609, 341–347. [Google Scholar] [CrossRef] [PubMed]
  8. Gebbers, R.; Adamchuk, V.I. Precision Agriculture and Food Security. Science 2010, 327, 828–831. [Google Scholar] [CrossRef] [PubMed]
  9. Stafford, J.V. Implementing Precision Agriculture in the 21st Century. J. Agric. Eng. Res. 2000, 76, 267–275. [Google Scholar] [CrossRef] [Green Version]
  10. Yuan, Z.; Cao, Q.; Zhang, K.; Ata-Ul-Karim, S.T.; Tian, Y.; Zhu, Y.; Cao, W.; Liu, X. Optimal Leaf Positions for SPAD Meter Measurement in Rice. Front. Plant Sci. 2016, 7. [Google Scholar] [CrossRef] [PubMed] [Green Version]
  11. Xiong, D.; Chen, J.; Yu, T.; Gao, W.; Ling, X.; Li, Y.; Peng, S.; Huang, J. SPAD-based leaf nitrogen estimation is impacted by environmental factors and crop leaf characteristics. Sci. Rep. 2015, 5, 13389. [Google Scholar] [CrossRef] [PubMed] [Green Version]
  12. Mogili, U.R.; Deepak, B.B.V.L. Review on Application of Drone Systems in Precision Agriculture. Procedia Comput. Sci. 2018, 133, 502–509. [Google Scholar] [CrossRef]
  13. Maes, W.H.; Steppe, K. Perspectives for Remote Sensing with Unmanned Aerial Vehicles in Precision Agriculture. Trends Plant Sci. 2019, 24, 152–164. [Google Scholar] [CrossRef]
  14. Orsini, R.; Basili, D.; Belletti, M.; Bentivoglio, D.; Bozzi, C.A.; Chiappini, S.; Conti, C.; Galli, A.; Giorgini, E.; Fiorentini, M.; et al. Setting of a precision farming robotic laboratory for cropping system sustainability and food safety and security: Preliminary results. IOP Conf. Ser. Earth Environ. Sci. 2019, 275, 012021. [Google Scholar] [CrossRef]
  15. Sonmez, N.K.; Slater, B. Measuring Intensity of Tillage and Plant Residue Cover Using Remote Sensing. Eur. J. Remote Sens. 2016, 49, 121–135. [Google Scholar] [CrossRef] [Green Version]
  16. Orsini, R.; Fiorentini, M.; Zenobi, S. Testing vegetation index categories as influenced by soil management and nitrogen fertilization in cereal based cropping systems. In Proceedings of the 2019 IEEE International Workshop on Metrology for Agriculture and Forestry, Portici, Italy, 24–26 October 2019; pp. 13–18. [Google Scholar] [CrossRef]
  17. Fiorentini, M.; Zenobi, S.; Giorgini, E.; Basili, D.; Conti, C.; Pro, C.; Monaci, E.; Orsini, R. Nitrogen and chlorophyll status determination in durum wheat as influenced by fertilization and soil management: Preliminary results. PLoS ONE 2019, 14, e0225126. [Google Scholar] [CrossRef] [PubMed]
  18. Liu, S.; Wang, X.; Yin, X.; Savoy, H.J.; McClure, A.; Essington, M.E. Ammonia Volatilization Loss and Corn Nitrogen Nutrition and Productivity with Efficiency Enhanced UAN and Urea under No-tillage. Sci. Rep. 2019, 9, 6610. [Google Scholar] [CrossRef] [PubMed]
  19. Watson, C.; Carville, D.; Dikeman, E.; Daigger, G.; Booth, G. Evaluation of two infrared instruments for determining protein content of hard red winter wheat. Cereal Chem. 1976, 53, 214–222. [Google Scholar]
  20. Polesello, A.; Giangiacomo, R.; Dull, G.G. Application of near infrared spectrophotometry to the nondestructive analysis of foods: A review of experimental results. Crit. Rev. Food Sci. Nutr. 1983, 18, 203–230. [Google Scholar] [CrossRef]
  21. Scotter, C.N.G. Non-destructive spectroscopic techniques for the measurement of food quality. Trends Food Sci. Technol. 1997, 8, 285–292. [Google Scholar] [CrossRef]
  22. Yu, P.; McKinnon, J.J.; Christensen, C.R.; Christensen, D.A. Using Synchrotron Transmission FTIR Microspectroscopy as a Rapid, Direct, and Nondestructive Analytical Technique to Reveal Molecular Microstructural–Chemical Features within Tissue in Grain Barley. J. Agric. Food Chem. 2004, 52, 1484–1494. [Google Scholar] [CrossRef] [PubMed]
  23. Cocchi, M.; Foca, G.; Lucisano, M.; Marchetti, A.; Pagani, M.A.; Tassi, L.; Ulrici, A. Classification of Cereal Flours by Chemometric Analysis of MIR Spectra. J. Agric. Food Chem. 2004, 52, 1062–1067. [Google Scholar] [CrossRef]
  24. Karoui, R.; Downey, G.; Blecker, C. Mid-Infrared Spectroscopy Coupled with Chemometrics: A Tool for the Analysis of Intact Food Systems and the Exploration of Their Molecular Structure–Quality Relationships—A Review. Chem. Rev. 2010, 110, 6144–6168. [Google Scholar] [CrossRef]
  25. Siano, F.; Moccia, S.; Picariello, G.; Russo, G.; Sorrentino, G.; Di Stasio, M.; La Cara, F.; Volpe, M. Comparative Study of Chemical, Biochemical Characteristic and ATR-FTIR Analysis of Seeds, Oil and Flour of the Edible Fedora Cultivar Hemp (Cannabis sativa L.). Molecules 2018, 24, 83. [Google Scholar] [CrossRef] [PubMed] [Green Version]
  26. Pennesi, C.; Amato, A.; Occhialini, S.; Critchley, A.T.; Totti, C.; Giorgini, E.; Conti, C.; Beolchini, F. Adsorption of indium by waste biomass of brown alga Ascophyllum nodosum. Sci. Rep. 2019, 9, 16763. [Google Scholar] [CrossRef] [PubMed]
  27. Seddaiu, G.; Iocola, I.; Farina, R.; Orsini, R.; Iezzi, G.; Roggero, P.P. Long term effects of tillage practices and N fertilization in rainfed Mediterranean cropping systems: Durum wheat, sunflower and maize grain yield. Eur. J. Agron. 2016, 77, 166–178. [Google Scholar] [CrossRef]
  28. FAO (Food and Agriculture Organization). World Reference Base for Soil Resources. World Soil Resources Report 103; FAO: Rome, Italy, 2006. [Google Scholar]
  29. Zadoks, J.C.; Chang, T.T.; Konzac, C.F. A decimal code for the growth stages of cereals. Weed Res. 1974, 14, 415–421. [Google Scholar] [CrossRef]
  30. Türker-Kaya, S.; Huck, C. A Review of Mid-Infrared and Near-Infrared Imaging: Principles, Concepts and Applications in Plant Tissue Analysis. Molecules 2017, 22, 168. [Google Scholar] [CrossRef] [PubMed] [Green Version]
  31. Movasaghi, Z.; Rehman, S.; Rehman, I. Fourier Transform Infrared (FTIR) Spectroscopy of Biological Tissues. Appl. Spectrosc. Rev. 2008, 43, 134–179. [Google Scholar] [CrossRef]
  32. Cisternas, I.; Velásquez, I.; Caro, A.; Rodríguez, A. Systematic literature review of implementations of precision agriculture. Comput. Electron. Agric. 2020, 176, 105626. [Google Scholar] [CrossRef]
  33. Sanches, G.M.; Magalhães, P.S.G.; Kolln, O.T.; Otto, R.; Rodrigues, F.; Cardoso, T.F.; Chagas, M.F.; Franco, H.C.J. Agronomic, economic, and environmental assessment of site-specific fertilizer management of Brazilian sugarcane fields. Geoderma Reg. 2021, 24, e00360. [Google Scholar] [CrossRef]
  34. Orsini, R.; Fiorentini, M.; Zenobi, S. Evaluation of Soil Management Effect on Crop Productivity and Vegetation Indices Accuracy in Mediterranean Cereal-Based Cropping Systems. Sensors 2020, 20, 3383. [Google Scholar] [CrossRef] [PubMed]
  35. Fiorentini, M.; Zenobi, S.; Orsini, R. Remote and Proximal Sensing Applications for Durum Wheat Nutritional Status Detection in Mediterranean Area. Agriculture 2021, 11, 39. [Google Scholar] [CrossRef]
  36. Tabaglio, V.; Gavazzi, C.; Menta, C. The Influence of No-Till, Conventional Tillage and Nitrogen Fertilization on Physico-Chemical and Biological Indicators After Three Years of Monoculture Barley. Ital. J. Agron. 2008, 3, 233. [Google Scholar] [CrossRef] [Green Version]
  37. De Sanctis, G.; Roggero, P.P.; Seddaiu, G.; Orsini, R.; Porter, C.H.; Jones, J.W. Long-term no tillage increased soil organic carbon content of rain-fed cereal systems in a Mediterranean area. Eur. J. Agron. 2012, 40, 18–27. [Google Scholar] [CrossRef]
  38. Notarstefano, V.; Sabbatini, S.; Conti, C.; Pisani, M.; Astolfi, P.; Pro, C.; Rubini, C.; Vaccari, L.; Giorgini, E. Investigation of human pancreatic cancer tissues by Fourier Transform Infrared Hyperspectral Imaging. J. Biophotonics 2020, 13, 1–10. [Google Scholar] [CrossRef]
  39. Notarstefano, V.; Sabbatini, S.; Pro, C.; Belloni, A.; Orilisi, G.; Rubini, C.; Byrne, H.J.; Vaccari, L.; Giorgini, E. Exploiting fourier transform infrared and Raman microspectroscopies on cancer stem cells from oral squamous cells carcinoma: New evidence of acquired cisplatin chemoresistance. Analyst 2020, 145, 8038–8049. [Google Scholar] [CrossRef]
  40. Cortés, V.; Blasco, J.; Aleixos, N.; Cubero, S.; Talens, P. Monitoring strategies for quality control of agricultural products using visible and near-infrared spectroscopy: A review. Trends Food Sci. Technol. 2019, 85, 138–148. [Google Scholar] [CrossRef]
  41. Ge, Y.; Thomasson, J.A.; Sui, R. Remote sensing of soil properties in precision agriculture: A review. Front. Earth Sci. 2011, 5, 229–238. [Google Scholar] [CrossRef]
  42. Zhukov, A.V. Very Long-Chain Fatty Acids in Composition of Plant Membrane Lipids. Russ. J. Plant Physiol. 2018, 65, 784–800. [Google Scholar] [CrossRef]
  43. Pallardy, S.G.; Kozlowski, T.T. Physiology of Woody Plants; Elsevier: Amsterdam, The Netherlands, 2008; ISBN 978-0-12-088765-1. [Google Scholar]
  44. Skylas, D.J.; Mackintosh, J.A.; Cordwell, S.J.; Basseal, D.J.; Walsh, B.J.; Harry, J.; Blumenthal, C.; Copeland, L.; Wrigley, C.W.; Rathmell, W. Proteome Approach to the Characterisation of Protein Composition in the Developing and Mature Wheat-grain Endosperm. J. Cereal Sci. 2000, 32, 169–188. [Google Scholar] [CrossRef]
  45. Shewry, P.R. Wheat. J. Exp. Bot. 2009, 60, 1537–1553. [Google Scholar] [CrossRef] [PubMed]
  46. Rasheed, A.; Xia, X.; Yan, Y.; Appels, R.; Mahmood, T.; He, Z. Wheat seed storage proteins: Advances in molecular genetics, diversity and breeding applications. J. Cereal Sci. 2014, 60, 11–24. [Google Scholar] [CrossRef] [Green Version]
  47. Pittelkow, C.M.; Liang, X.; Linquist, B.A.; Van Groenigen, L.J.; Lee, J.; Lundy, M.E.; Van Gestel, N.; Six, J.; Venterea, R.T.; Van Kessel, C. Productivity limits and potentials of the principles of conservation agriculture. Nature 2015, 517, 365–368. [Google Scholar] [CrossRef] [PubMed]
  48. Wang, Z.-H.; Li, S.-X.; Malhi, S. Effects of fertilization and other agronomic measures on nutritional quality of crops. J. Sci. Food Agric. 2008, 88, 7–23. [Google Scholar] [CrossRef]
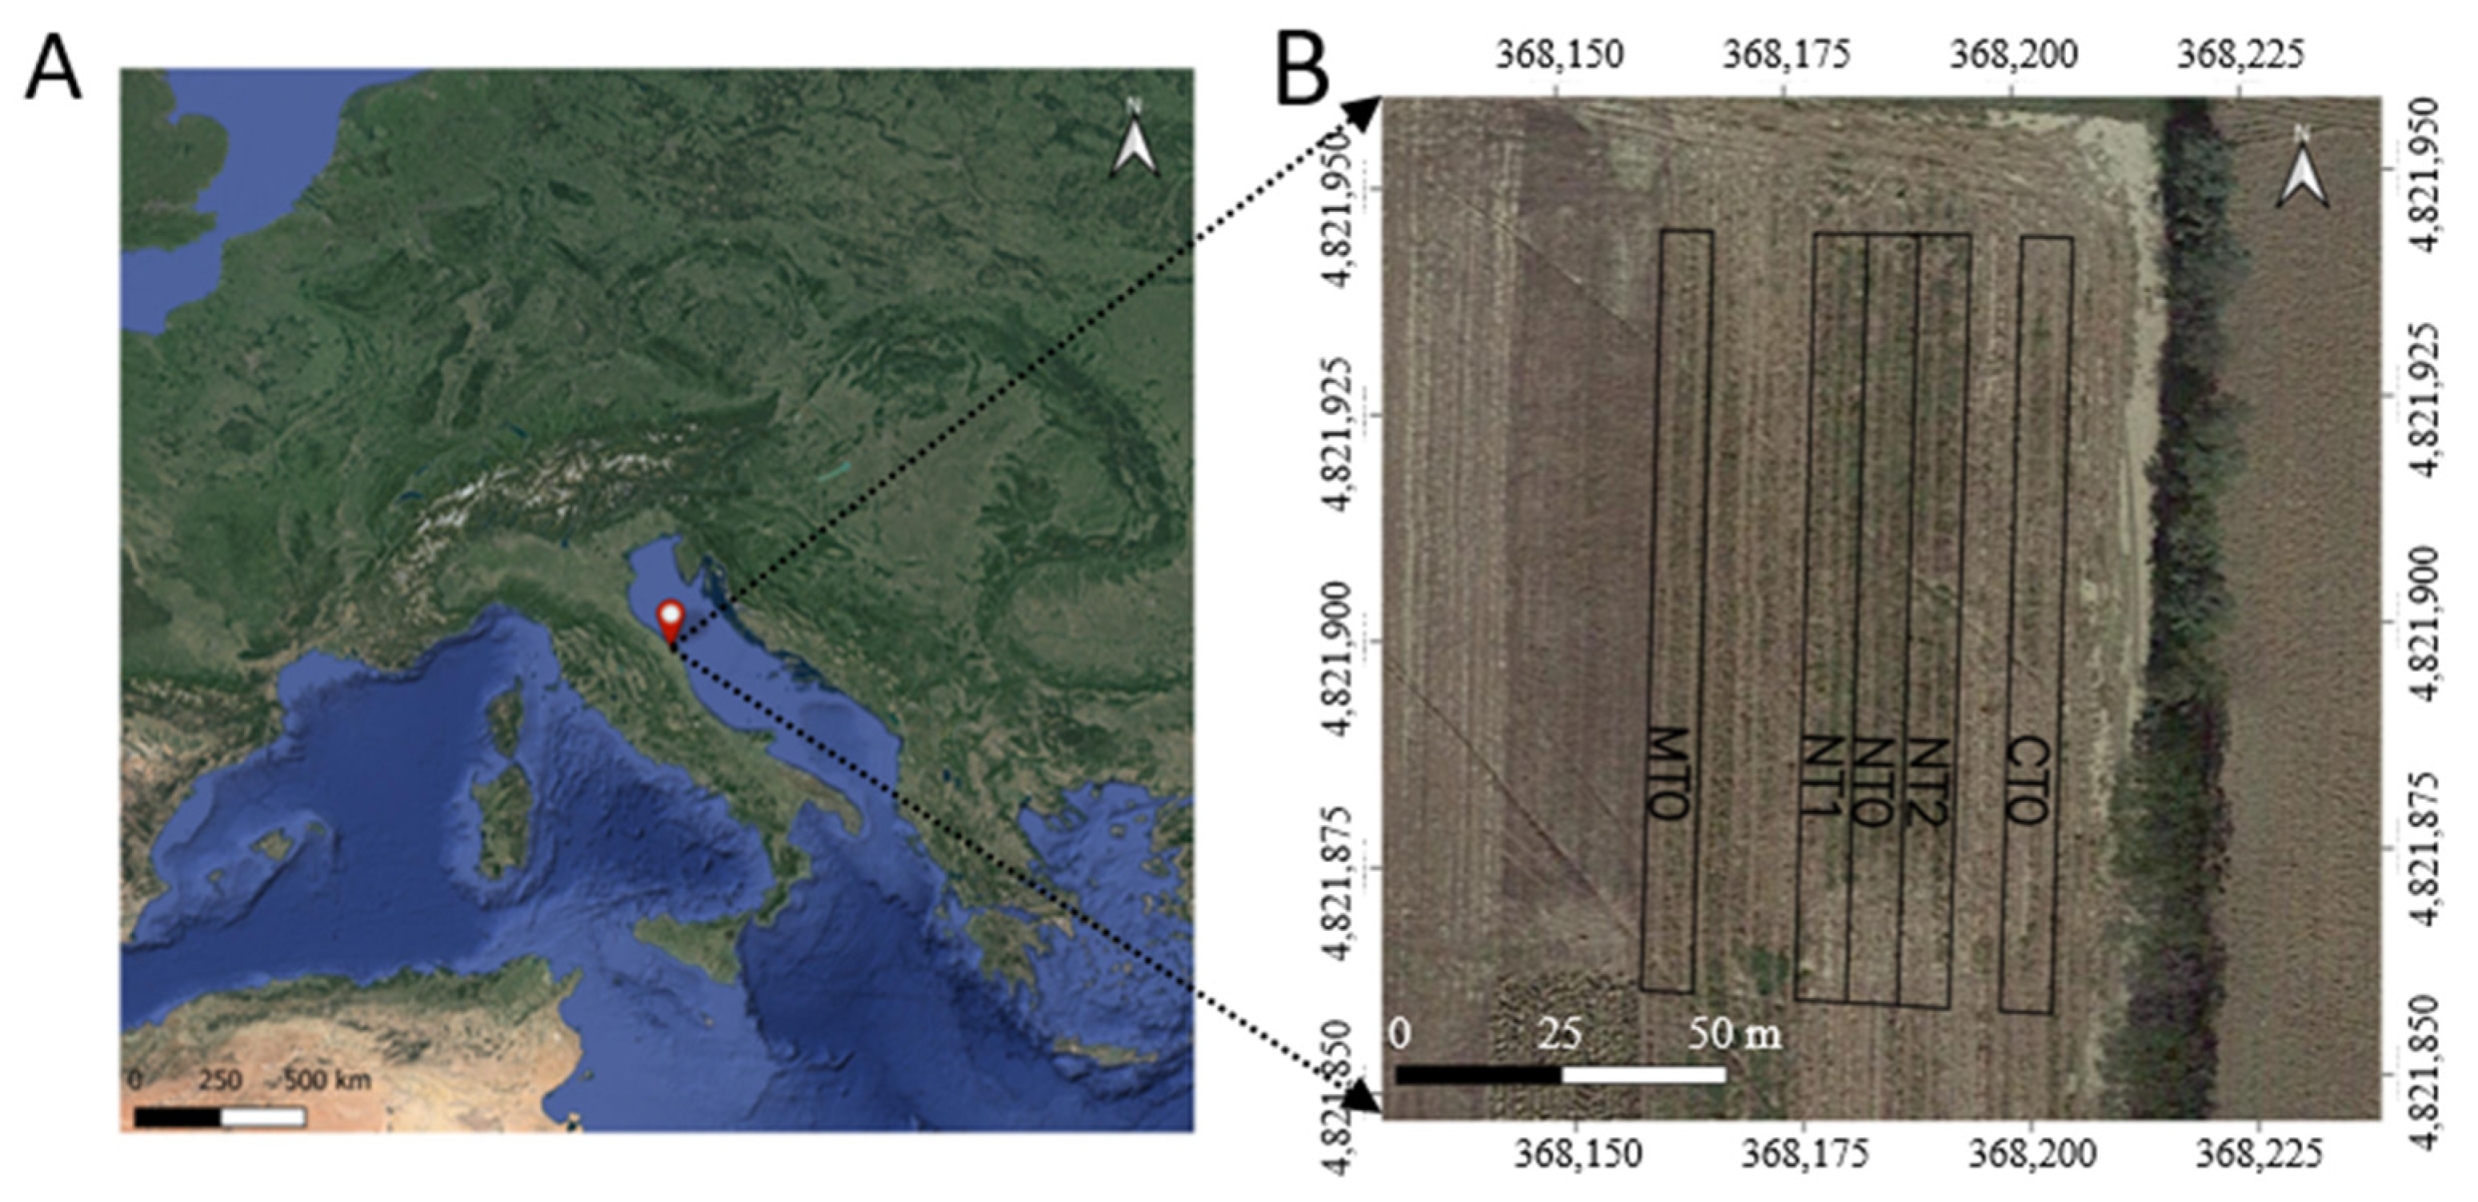
Figure 1. (A) “Pasquale Rosati” experimental farm of Università Politecnica delle Marche, Agugliano, Ancona (Italy) (coordinate system: WGS 84/UTM zone 33N, 100 m a.s.l.) (red point). (B) Subdivision of the experimental site in relation to tillage methods and nitrogen fertilizer treatments: conventional tillage without fertilization (CT0); minimum tillage without fertilization (MT0); no tillage without fertilization (NT0); no tillage with 90 kg N ha−1 fertilization (NT1), and no tillage with 180 kg N ha−1 fertilization (NT2).
Agriculture 11 00321 g001
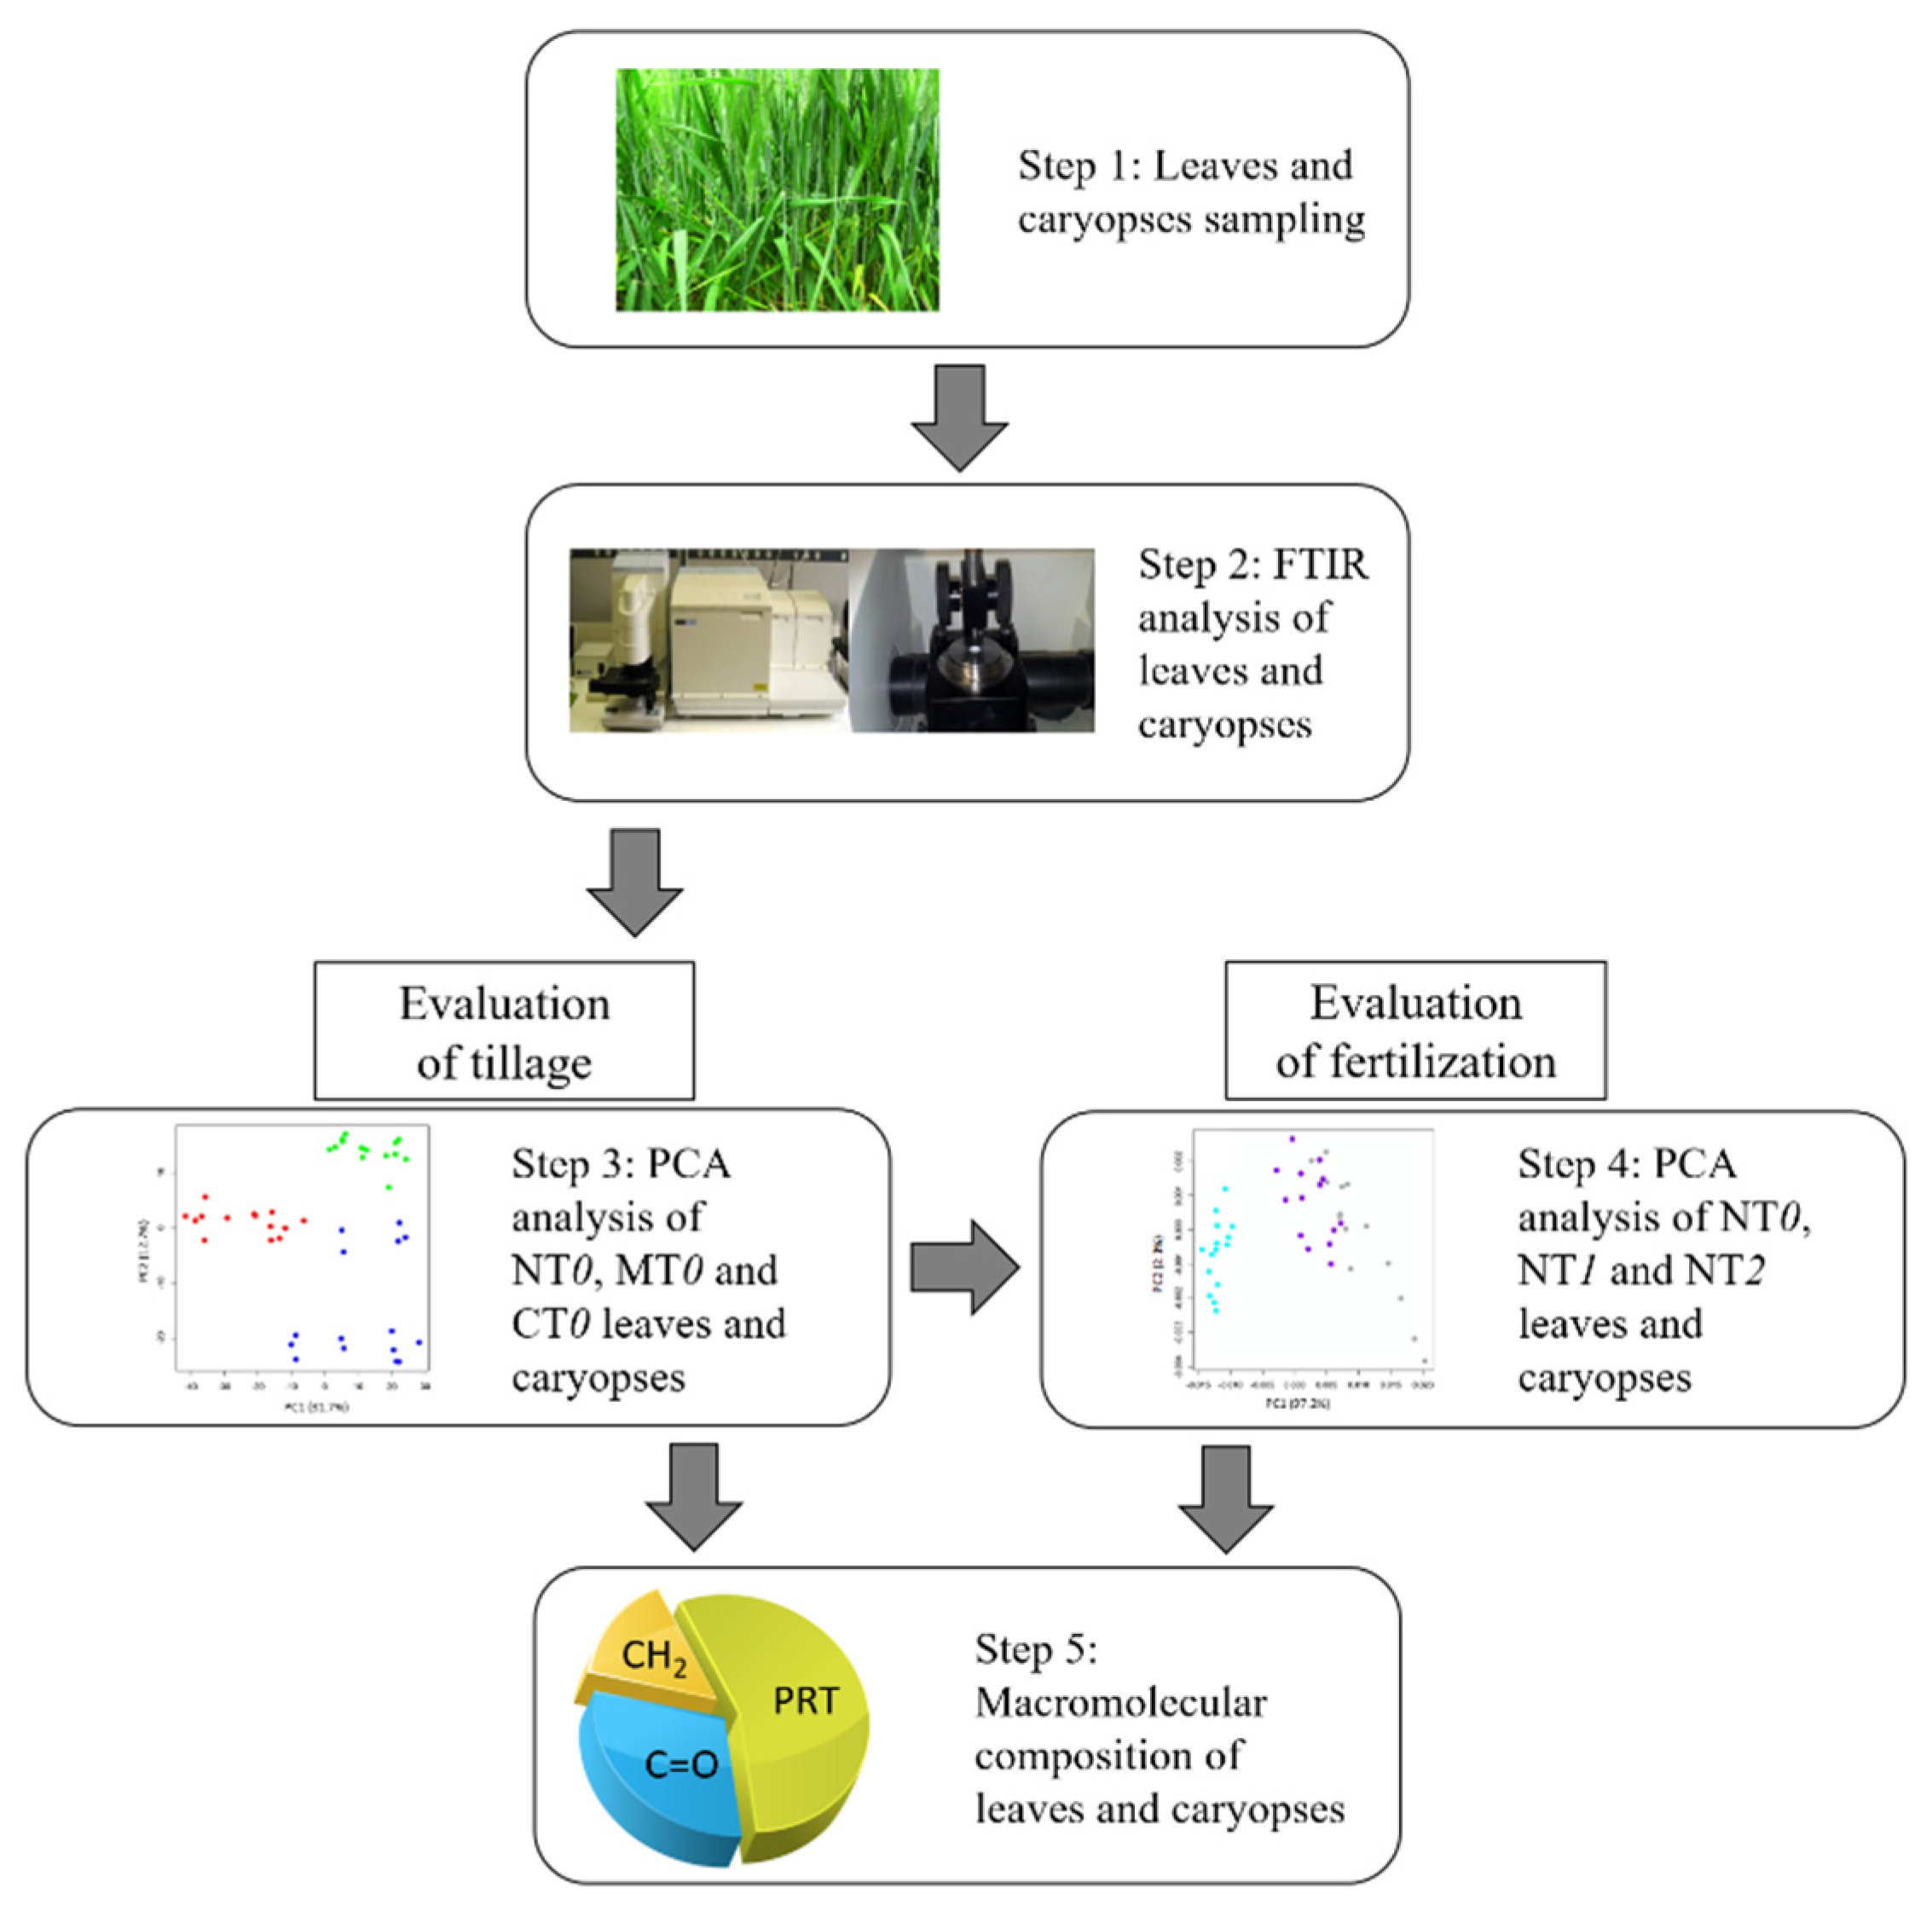
Figure 2. Experimental setup overview. Caryopses and leaves were sampled over a period of five months, from tillering to agronomic ripening (Step 1) and were analyzed using attenuated total reflectance–Fourier transform infrared (ATR-FTIR) spectroscopy (Step 2). A multivariate analysis of spectral data (PCA) was employed to investigate the relationships between the different tillage methods (Step 3) and only on no-tillage (NT) samples to evaluate the effects of different nitrogen fertilization dosages (Step 4). Finally, all samples were also investigated in terms of macromolecular composition (Step 5). Abbreviations: NT0, MT0 and CT0—no tillage, minimum tillage and conventional tillage, without nitrogen fertilization; NT1—no tillage with 90 kg N ha−1; NT2—no tillage with 180 kg N ha−1.
Agriculture 11 00321 g002
Figure 3. Average absorbance spectra of (A) durum wheat leaves collected at the tillering phase (ZS 22), stem elongation phase (ZS 35) and anthesis phase (ZS 60); (B) durum wheat caryopses collected at the anthesis phase (ZS 60) and ripening phase (ZS 92). Spectra are reported in the 4000–650 cm−1 range and are shifted along the y-axis for clarity. The position of the most relevant peaks is reported in terms of wavenumbers (ZS refers to the Zadoks scale).
Agriculture 11 00321 g003
Figure 4. Principal component analysis (PCA) score plots of the spectral data of durum wheat leaves and caryopses in regard to different soil management methods and sampling timepoints: (A) durum wheat leaves (l-NT0, green, l-MT0, red, and l-CT0, blue) at ZS 22, ZS 35 and ZS 60 sampling times, and (B) durum wheat caryopses (c-NT0, green, c-MT0, red, and c-CT0, blue) at ZS 60 and ZS 92 sampling times. Tillage methods are indicated with CT0 (conventional tillage), MT0 (minimum tillage) and NT0 (no tillage); no nitrogen fertilization was applied.
Agriculture 11 00321 g004
Figure 5. Statistical analysis of the biochemical composition of durum wheat leaves and caryopses collected at different sampling timepoints as a consequence of various soil management methods. The box plot shows the differences in lipid alkyl chains (LIP) (A) and protein (PRT) (B) content with respect to cellulose (CE). Tillage methods without fertilization processes are indicated with CT0 (conventional Tillage), MT0 (minimum Tillage) and NT0 (no Tillage). Sampling times were ZS 22, ZS 35 and ZS 60 for leaves, and ZS 60 and ZS 92 for caryopses. The center line marks the median; edges indicate the 25th and 75th percentiles; vertical lines indicate the 5th and 95th percentiles; black points indicate the potential outliers. Different letters above box charts indicate a statistically significant difference among groups. Statistical significance was set at p < 0.05.
Agriculture 11 00321 g005
Figure 6. IR maps representing the biochemical composition of durum wheat leaves and caryopses, in terms of lipids (LIP maps), proteins (PRT maps) and cellulose (CE maps) in relation with the topography of the cultivated areas and in relation with sampling times. Each square represents the ground arrangements according to Figure 1B (see Materials and Methods). The chromatic scales used for leaves and caryopses goes from blue (low content) to red/pink (high content); ranges are indicated on the right side of each square. Tillage methods are indicated with CT0 (conventional tillage), MT0 (minimum tillage) and NT0 (no tillage); no nitrogen fertilization was applied. Sampling times were ZS 22, ZS 35 and ZS 60 for leaves, and ZS 60 and ZS 92 for caryopses. The letters on the left belong to the land position: up (U); mid (M) and bottom (B).
Agriculture 11 00321 g006
Figure 7. PCA scores plots of the spectral data of durum wheat leaves and caryopses grown on no-tillage soil, fertilized with 90 kg N ha−1 (NT1) and 180 kg N ha−1 (NT2): (A) durum wheat leaves (l-NT0, grey, l-NT1, light blue, and l-NT2, violet) at ZS 35 and ZS 60 sampling times, and (B) durum wheat caryopses (c-NT0, grey, c-NT1, light blue, and c-NT2, violet) at ZS 60 and ZS 92 sampling times.
Agriculture 11 00321 g007
Figure 8. Statistical analysis of the biochemical composition of durum wheat leaves and caryopses collected on no-tillage soil at different sampling timepoints as a consequence of various nitrogen fertilization levels. The box plot shows the differences in LIP (A) and PRT (B) content with respect to cellulose (CE). No-tillage soil, fertilized with 90 kg N ha−1 (NT1) and 180 kg N ha−1 (NT2), was used. The center line marks the median; edges indicate the 25th and 75th percentiles; vertical lines indicate the 5th and 95th percentiles; black points indicate the potential outliers. Different letters above box charts indicate a statistically significant difference among groups. Statistical significance was set at p < 0.05.
Agriculture 11 00321 g008
Table 1. Thermo-pluviometric trends observed in the experimental site during the experimental period (November 2017–July 2018) and in a long-term period (1998–2018). Rainfall (mm) is reported monthly and in total for the whole period, and minimum (Tmin) and maximum (Tmax) air temperatures are shown monthly and for the whole period.
MonthsPeriod (Years)Total Rainfall (mm)Average Air Temperature (°C)
TminTmax
November2017–20181247.911.1
1998–2018938.715.3
December2017–2018964.111.9
1998–2018874.410.9
January2017–2018295.212.8
1998–2018543.29.6
February2017–20181732.08.3
1998–2018683.811.0
March2017–20181435.713.3
1998–2018856.614.9
April2017–20183711.821.5
1998–2018709.718.8
Mai2017–20189514.923.7
1998–20187313.723.5
June2017–20184817.727.8
1998–20185417.828.1
July2017–20185720.530.8
1998–20183620.230.8
Total2017–201880210.017.9
1998–201883811.420.0
Table 2. Experimental groups. Leaves (l) were sampled at Zadoks scale (ZS) 22, ZS 35 and ZS 60, whereas caryopses (c) were ampled at ZS 60 and ZS 92.
Nitrogen FertilizationSoil Tillage
CTMTNT
0 kg N ha−1 (0) Agriculture 11 00321 i001
l-CT0
Agriculture 11 00321 i002
c-CT0
Agriculture 11 00321 i001
l-MT0
Agriculture 11 00321 i002
c-MT0
Agriculture 11 00321 i001
l-NT0
Agriculture 11 00321 i002
c-NT0
90 kg N ha−1 (1)---- Agriculture 11 00321 i001
l-NT1
Agriculture 11 00321 i002
c-NT1
180 kg N ha−1 (2)---- Agriculture 11 00321 i001
l-NT2
Agriculture 11 00321 i002
c-NT2
Table 3. Meaningful IR peaks of samples of durum wheat leaves and caryopses: peak position (in terms of wavenumbers, cm–1), vibrational mode and biological assignment.
Peak Position (cm−1)Vibrational ModeBiochemical Assignment
LeavesCaryopses
~2917, ~2849~2924, ~2855Symmetric and asymmetric stretching modes of CH2 moieties
νsym CH2, νasym CH2
Alkyl chains [30]
~1736~1746Stretching mode of carbonyl moiety ν C=OHemicellulose [31]
~1625~1648Stretching and bending modes of peptide linkage
ν C=O, ν C-N, δ N-H
Amide I of proteins, pectin [30]
~1463~1539Bending mode of CH2 moieties
δ CH2
Alkyl chains [31]
~1033, ~800~998, ~762Vibrational modes of C-OH groupsCellulose [30]
Publisher’s Note: MDPI stays neutral with regard to jurisdictional claims in published maps and institutional affiliations.