1. Introduction
The global ambition is to limit global warming potential to 2 °C, so all European Union countries committed to reduce global greenhouse gas emissions by 30% compared to the 1990 level [
1]. The most significant harmful gases include carbon dioxide, methane, and ammonia, which have negative effects on the environment, health of animals and people. Cattle manure harbors microbial constituents that make it a potential source of pollution in the environment and infections in humans [
2]. By controlling ammonia emissions from agriculture, therefore the need for analogous estimates of air pollution is increasing significantly [
3,
4]. In order to simultaneously reduce the risk of gas emissions from farm animals, the release of gases into the atmosphere must be controlled and reduced [
5,
6,
7].
Air pollution, eutrophication, and soil acidification cause reactive nitrogen emissions into the atmosphere [
8,
9,
10,
11]. Ammonia emission sets up with all manure management moments—keeping of animals, grazing, storage, and divert injection reduce ammonia emission into the soil [
12,
13]. The principal key categories for NH
3 emissions are animal manure applied to soils, inorganic N-fertilizers, and manure management. They jointly make up 52% of total NH
3 emissions. A single sector group, agriculture, is responsible for most (92%) of the NH
3 emissions in the EU [
14,
15]. In Europe, approximately 80% of NH
3 emissions responsible for the acidification of soil originate from livestock production [
16,
17].
The modernization of the livestock buildings often involves issues related to ambient air pollution, such as the application of littered or un-littered livestock keeping technology. Scientific results showed that NH
3 emissions increased linearly with increasing air temperature (°C) inside the barn by 1.47 g [NH
3] cow
−1 d
−1 when temperature increased by one degree. Refs. [
18,
19]. It was determined the impact of climate parameters (temperature, relative humidity) on concentrations of harmful gases (carbon dioxide-CO
2, methane-CH
4, and ammonia-NH
3) have such a negative impact on the atmosphere [
7,
20]. Reduction of the dairy building temperature could reduce pH and biological activities which create ammonia in the manure [
18]. The effect of air emission and ventilation rate on NH
3 effect in animal husbandry, ammonia emission, is 37% higher with lower ventilation rate (5–16 m
3 h
−1) than with intensive ventilation (15–40 m
3 h
−1) [
7,
21]. To reduce the atmospheric pollution, it is recommended to conduct detailed research to find the optimal ventilation rate and ambient temperature in cattle barns.
Harmful gas emissions depend on the type and composition of the manure. Manure was characterized by a total solid content (TS) of 8.5%, a volatile solid content (VS) of 85.3% TS, a pH of 7.34, and total nitrogen concentration of 3500 mg·L
−1 [
22]. Liquid manure is a major source of ammonia emissions from barns. One of the main issues, arising in the modernization of the cowhouses, is the application of bedding or bedding less animal housing technologies. NH
3 and NH
4 together are often referred to as total ammonia nitrogen (TAN). TAN = NH
4-N + NH
3-N. NH
3 (ammonia) is a gas and sometimes called toxic or free ammonia. This type of ammonia is the dangerous part. NH
4 (ammonium) is a nontoxic salt. It is the ionized form of ammonia. Under normal conditions, NH
3 (ammonia) and NH
4 (ammonium) will both be present in aquarium water. The two exist at an equilibrium point that is governed largely by pH and temperature. However, salinity and the ionic strength of the water also influence this equilibrium point. The solids content of the manure also has an impact on the amount of TAN that is in the ammonia form. 1.2 ± 0.3 kg NH
3-N year
−1 m
−2 (mean ± SD) or 5 ± 1% of the total N released or 10 ± 2% of the removed TAN is discharged with grooves and recirculated manure channels. 1.0 ± 0.2 kg NH
3-N year
−1 m
−2 production area or 5 ± 1% of total N or 11 ± 2% of TAN excreted in dairy barns with a solid drained floor excavated 12 times a day [
23]. Crude and acid-treated carbon (BC) and pure acids can reduce the volatility of ammoniacal nitrogen (NH
3-N) and increase nitrogen retention in slurry digestion. Acidified BC can be an effective conditioner to reduce NH
3-N emissions from slurry digestion enzyme storage. The results confirm findings previously reported by other scientists [
24,
25,
26,
27]. NH4-N-loaded biochars are suitable candidates for soil amendment and fertilization. NH
3 volatilization was closely related to concentration of NH4+-N, temperature, and pH of surface water. A more accurate comparison of actual values of emissions with research results reported by other scientists necessitates taking into consideration all the factors that contribute to the effect on gas emissions from animal husbandry.
Animal manure is an additional source of nutrients for growing crops and improving soil quality. During the entire period of fertilization, plants take up approximately 50–60% of nitrogen, up to 50% of phosphorus, and up to 80% of potassium [
28]. It was discovered, that combining livestock manure (15 Mg ha
−1 year
−1 pig manure or 30 Mg ha
−1 year
−1 livestock manure) with inorganic fertilizers has no effect on soil stability change over a period of 34 years [
29]. Considering the reason for the formation of ammonia emissions—the bacterial and enzymatic degradation of organic components in the excrement—it is important to determine the influence of 100% natural biotreatment composition on the emission of ammonia from organic waste and to find the optimal method practice. The microorganisms contained in the biotreatments can assimilate nitrogen from urea and exhibit antagonistic activity against the pathogens that produce metabolites that cause bad smells; as a result, the substrate is deodorized [
30]. The bio-preparation slightly affects the enhanced removal of total nitrogen (7.40%) and ammonia nitrogen (15.30%) [
31,
32]. Other scientists think that the use of biological methods can improve the quality of the environment in livestock farming, reduce the economic costs of manure storage and disposal, improve soil, yield, producing organic food and feed. Solutions are sought for using biotreatments that aid in reducing the intensity of ammonia emission from manure [
33].
It is important to find compromises and to improve all aspects of beneficial and positive solutions in parallel with animal welfare, product quality, cost reduction, and harmful emissions into the environment [
34]. There is also a great need to find and develop microbiological biotreatments containing microbes that naturally occur in manure [
35] that will be able to remove odorous compounds and disinfect the livestock buildings. It is relevant to carry out detailed research on livestock manure in order to determine the effect of biological agents on the emission of ammonia, depending on the manure storage time and the variation in airflow over the layer of manure and other factors.
The study of the process of ammonia evaporation from manure evaluated the benefits of the mixture of biological preparations in reducing odors, increasing the rate of organic decomposition, general hygiene of premises and the environment. According to the obtained results, the spread of ammonia gas from various sources on farms can be neutralized by optimal use of biological preparations.
The aim is to evaluate the possibilities of using biological preparations to reduce ammonia emissions from cattle manure and to develop recommendations for increasing their efficiency.
Odor formation occurs when microorganisms decompose organics and under anaerobic conditions, biodegradation occurs in the presence of SRMs (sulfur-reducing microorganisms), which are optional anaerobes. During the metabolic processes of these microorganisms, hydrogen sulfide, mercaptans, indole, skatole, etc., pungent substances are released. The hazard values of these substances are different. Ammonia, carbon dioxide, methane, etc. vary depending on the process conditions. Together, they produce very unpleasant odors.
Masking agents are chemicals that do not eliminate (do not break down) odor-causing substances but increase the value of the odor threshold. Synthetic essential oils, terpenes, glycols, ethylene oxide, etc. are used. It is not known what compounds are formed during deodorization, their harmfulness.
The aim of the research is to evaluate biotreatment (Azospirillum sp. (N), Frateuria aurentia (K), Bacillus megaterium (P), seaweed extract, phytohormones, auxins, cytokinin, gibberellins, amino acids, vitamins) effect on dynamics of cattle manure composition and reduction of ammonia emissions.
2. Materials and Methods
Supramental research was used to identify the effect of biotreatment on reduction of ammonia emission from manure, considering the dynamics of manure composition. It was evaluating cattle manure, because most ammonia is released into the environment by keeping cattle (approximately 50%) and from liquid manure [
19,
25] why it was used for research. Randomized cattle manure samples were taken from barn and homogenized.
Research has been carried out to determine the manure composition and ammonia emissions from stored manure without biotreatment and using manure biotreatment. At the time of the study, a bio solution was selected, which was one of the newest and popular possible complex solutions for manure, asked by farmers and business companies (not scientifically tested) to study. The bio solution composition was completely natural, and the main goal of its use would be to reduce environmental pollution. The purpose of this bio solution is precisely to turn rotten, stinking manure into an effective, full-fledged, nutrient-containing fertilizer. In this way, the aim could be to improve the production of milk from available basic feeds and to increase the profitability of the farm. The studied bio solution does not contain any genetically modified organisms, so it is 100 percent natural.
Biotreatment is manure treating with 100% natural composition measure solution, which contains
Azospirillum sp. (N) number of bacterial colonies −1 × 109 cm
−3,
Frateuria aurentia (K) number of bacterial colonies −1 × 109 cm
−3,
Bacillus megaterium (P) bacterial colony count −1 × 109 cm
−3, seaweed extract (10% by volume), phytohormones, auxins, cytokinin, gibberellins, amino acids, and vitamins mixed with water. The biotreatment is intended for biodegradable manure to turn it into a full-blown fertilizer by combining valuable nutrients. Another combination of adapted bacterial blend is intended to stimulate soil microbiological activity and accumulate high levels of macro and microelements in the soil [
36].
2.1. Manure Biotreatment Effect on Manure Composition
At the beginning of the research, the agrochemical composition of the fresh manure was investigated in 4 repetitions and was repeated in 4 repetitions at the end of every research repeating period after more than three months.
The agrochemical analysis of the manure composition was carried out before starting ammonia gas emission research by taking a sample of manure from a homogenized fresh liquid manure. When the results of agrochemical research were recorded, the mass of the manure was divided into two equal capacities: the solution of the biotreatments was added to the manure in the first capacity, and the control manure without it was added to the second capacity. The research objects were kept for 49–96 days in every 5 repetition (until the end of the biotreatment was effective), and in every period of 7, 14, 21, 28, 35, 42, 49 days, the ammonia emission intensity was summarized, because ammonia concentration average values were fixed in every research minute and then calculated to emission values. At the end of every research repetition (after 49 to 96 days (depending on the end of the effectiveness of biotreatment)), analogous manure agrochemical research was repeated. The changes in manure composition in each manure capacity was estimated. Research was carried on manure composition content and established ammoniacal nitrogen content, nitrogen nitrate (N-NO3) content using LVP D-05: 2017.91 Edition—flow analysis (FIA) spectrometric method, total nitrogen content, total phosphorus (P2O5) content, total potassium (K2O) content—using LVP D-07: 2016,91 Edition—Egner–Rime–Domingo (A-L) method.
The manure content of dry matter is determined according to the requirements of standard LST 1530: 2004 [
37]. The sample, prepared for drying, was placed in a Memmert Model 100–800 drying oven, and dried at 105 °C to a constant weight (by 8 repetitions). The value of pH in manure was determined by a pH meter HI98129-HI98130 (range from 0 to 14.0 pH, accuracy ± 0.05 pH), the automatically sample temperature measurement (ranging from 0 to 60 °C, accuracy 0.5 °C of measured values). The test specimen was mixed, and the pH meter electrode was pressed (it must be well-immersed). After setting pH-meter readings, the pH value was recorded.
2.2. Manure Biotreatment Effect on Gas Emission
Gas emissions were estimated and recalculated based on manure-contaminated surfaces in the barn. A gaseous emission is the release of a certain amount of gas in milligrams from a certain surface area over a period of time.
The assessment of manure biotreatment effect on gas emission was carry out using homogenized manure samples placed in a wind tunnel. The manure sample was biotreated by spraying bio solution over a 0.16–0.20 m layer which a surface area (S)—0.1748 m2 (0.38 × 0.46 m). One manure (25 l liquid cattle manure) sample in the capacity biotreated with bio solution, which consists of 5 cm−3 mixture composition for manure treatment, 2.5 cm−3 mixture composition to stimulate the microbiological activity of the soil and accumulate macro and microelements (all biotreatment consist of Azospirillum sp. (N) number of bacterial colonies −1 × 109 cm−3, Frateuria aurentia (K) number of bacterial colonies −1 × 109 cm−3, Bacillus megaterium (P) bacterial colony count −1 × 109 cm−3, seaweed extract (10% by volume), phytohormones, auxins, cytokinin, gibberellins, amino acids, and vitamins), 100 cm−3 of water (H2O). The control untreated manure sample was prepared in the other capacity with 25 l liquid cattle manure and sprayed with 100 cm−3 of H2O.
Emission of ammonia from manure was carried out in a specially reconstructed experimental research unit (
Figure 1).
The manure was poured into a 25 liter manure capacity (2), which was placed in a wind tunnel (a, 3). The wind tunnel has a section for storing manure with a sealed lid (16). The duct (4) pumped air from the wind tunnel, and a directional airflow was created over the layer of manure. The air outlet duct (4) has a diameter of 100 mm and length of 1500 mm. The length of the orb to the air sampling probe is 1000 mm, i.e., triangle times its diameter. Such a duct length ensures laminar airflow in the wind tunnel. The wind tunnel ventilation intensity changed in the air extraction duct (4) using valve (8), changing the duct cross-sectional area and changing the fan speed (9) by the frequency converter. The air samples were taken from the duct with probes (5) and the heated hose (12) was supplied to the GME700 gas analyzer (13). The GME700 laser gas analyzer performs “coordinated” complex process analysis. Reliability and accuracy are the hallmarks of the GME700 laser gas analyzer. Based on the principle of TDLS (tunable diode laser spectroscopy) and using specific light absorption, GME700 can measure the ammonia (NH3) gas component. The compact 19-inch unit includes an analyzer and evaluation unit, as well as a heated multi-track measuring element.
The GME700 analyzer was used to measure the concentration of ammonia (NH
3) gas (
Figure 1). NH
3 gas measurements range from 0 to 2000 ppm. This principle of measuring the device is laser spectroscopy. The air samples taken from the duct with probes and the heated hose were supplied to the GME700 gas analyzer. The analyzer hoses that draw air into the analyzer are specialized and heated to 150 degrees Celsius to prevent condensation. The analyzer preheated the pumped gas, and therefore, the gas conditioning ensures that the cell is not contaminated and does not form condensation. Electro-heated triple-bar valves were used to ensure that the operating temperature exceeds the temperature of the sample dew point. Operating mode: automatic (continuous or cyclic measurement with data accumulation). The air temperature and humidity were measured with temperature and humidity sensors connected to the Almemo 2590-9 system (temperature range from 30 to 60 °C, relative humidity of the air from 5 to 98%, accuracy of the device ± 0.1%).
The air in the analyzer was supplied by an uninterrupted pump (15) with a capacity of 6 l min−1. To prevent air condensation, it was warmed up in the intestine (12) and heated to 150 °C in the electrically heated valve (14). The test gas analyzer (13) was programmed to record the concentration of ammonia gas every 1 min. At the start of the test, the analyzer readings stabilized on average every 1–2 min, and then the ammonia gas concentration was captured. The emission intensity was calculated according to Equation (1).
Gas emission was researched using the mass flow rate method and laser spectroscopy sensors by measuring gas concentrations (
Figure 1). Identifying intensity of the capacity ventilation
G (m
3 h
−1) and the concentration of gas
Ce (mg m
−3) entering in the capacity and outgoing from its
Co, the gas emission intensity was calculated [
38]:
where the concentration of
Ce in the air entering the capacity, mg m
−3; the
Co concentration of gas from the capacity in discharged air, mg m
−3;
G capacity ventilation intensity, m
3 h
−1.
Experimental research on the influence of each factor was performed for approximately 4 months (until the end of the biotreatment was effective).
The specially prepared manure samples poured into capacities: in the first capacity—the manure was homogenized with a mixture of biological composition, and the manure was left without additives in the second capacity. The manure in both capacities was maintained under the same aerobic conditions at a constant temperature of 18.3 ± 0.2 °C.
Every 7 days, each manure sample was placed in a wind tunnel capacity periodically, and the ammonia emission from manure was determined. Each ammonia emission repeat test was carried out for approximately 168 h.
The first part of the ammonia emission from manure research was to evaluate ammonia concentration and emission from control and biotreated manure dependence on storage time. The assessment was carried out with constant airflow over manure and a constant ambient temperature. The air velocity in a 100 mm diameter wind tunnel duct before each test, was 0.1 ± 0.02 m s−1.
The second part of the ammonia emission from manure research was to evaluate ammonia concentration and emission from control and biotreated manure dependence on intensity of air movement. Analyzing the influence of the air velocity movement on ammonia emissions, research was performed by recording fixed different 0.1, 0.2, and 0.7 m s
−1 air speeds in the channel. The wind tunnel ventilation intensity changed in the wind tunnel air extraction duct (4) using valve (8), changing the duct cross-sectional area and changing the fan speed (9) by the frequency converter (
Figure 1).
In addition, for the analysis and evaluation of the next step, the change in the reduction or increase of gaseous emissions depending on the bio-effect was examined and the aim was always to sell the final conclusion in terms of change in units or percentage change due to the effect of biopreparations. Then, having the values of the percentage change rather than the initial results, we can partially absolute, because such a percentage change would be independent of the exact specific initial values.
Additionally, by controlling the microclimatic factors in the manure environment, it is possible to influence the processes on the manure surface and slow down the evaporation process of ammonia from the manure, intensifying the formation of the crust and reducing the ammonia concentration gradient vertically above the manure.
2.3. Statistical Analysis
The data for calculating the baseline results by one-factor analysis of the data variance using the honest significant difference method between the averages of the manure composition and gas concentration, and emission data values (HSD
05) (probability level 95%). A dispersion analysis performed on the Tukey HSD test for mathematical statistics, evaluating the essential difference margin of HSD
05 at a probability level of 95%, in order to make sure that the differences between the averages of the data were significant. In the figures, the letters indicate substantial differences between the factors. Uniform letter shows that there is no substantial difference. After the evaluation of the accuracy of the experimental data, the calculated numerical values of the test accuracy revealed that the calculated data were very precise. The accuracy specified did not exceed 5% (with a numeric accuracy value of
p < 0.05) [
39].
3. Results
3.1. Manure Biotreatment Effect on Manure Composition
The agrochemical analysis of the manure composition was carried out before starting an ammonia gas emission study by taking a sample of manure from a blended fresh liquid buckwheat manure stored in one container. The test objects were kept for 96 days and at the end of the research, analogous manure agrochemical tests were repeated. The variation of manure composition in each manure sample was estimated. To compare the changes in the control and biotreated manure, the percentage differences between the two samples were calculated (
Figure 2 and
Figure 3).
During the storage of manure, its pH changed slightly: on average from 7.8 to 8.9 in the control manure and up to 8.8 in the biotreated manure. Biodegradation, manure, and the water solution became even more alkaline (pH > 7). The dry matter content of fresh manure was 10.62%, and at the end of the research, it increased to 12.22%, while the biotreated manure was still on average 2% more, i.e., to 14.57% (
Figure 2).
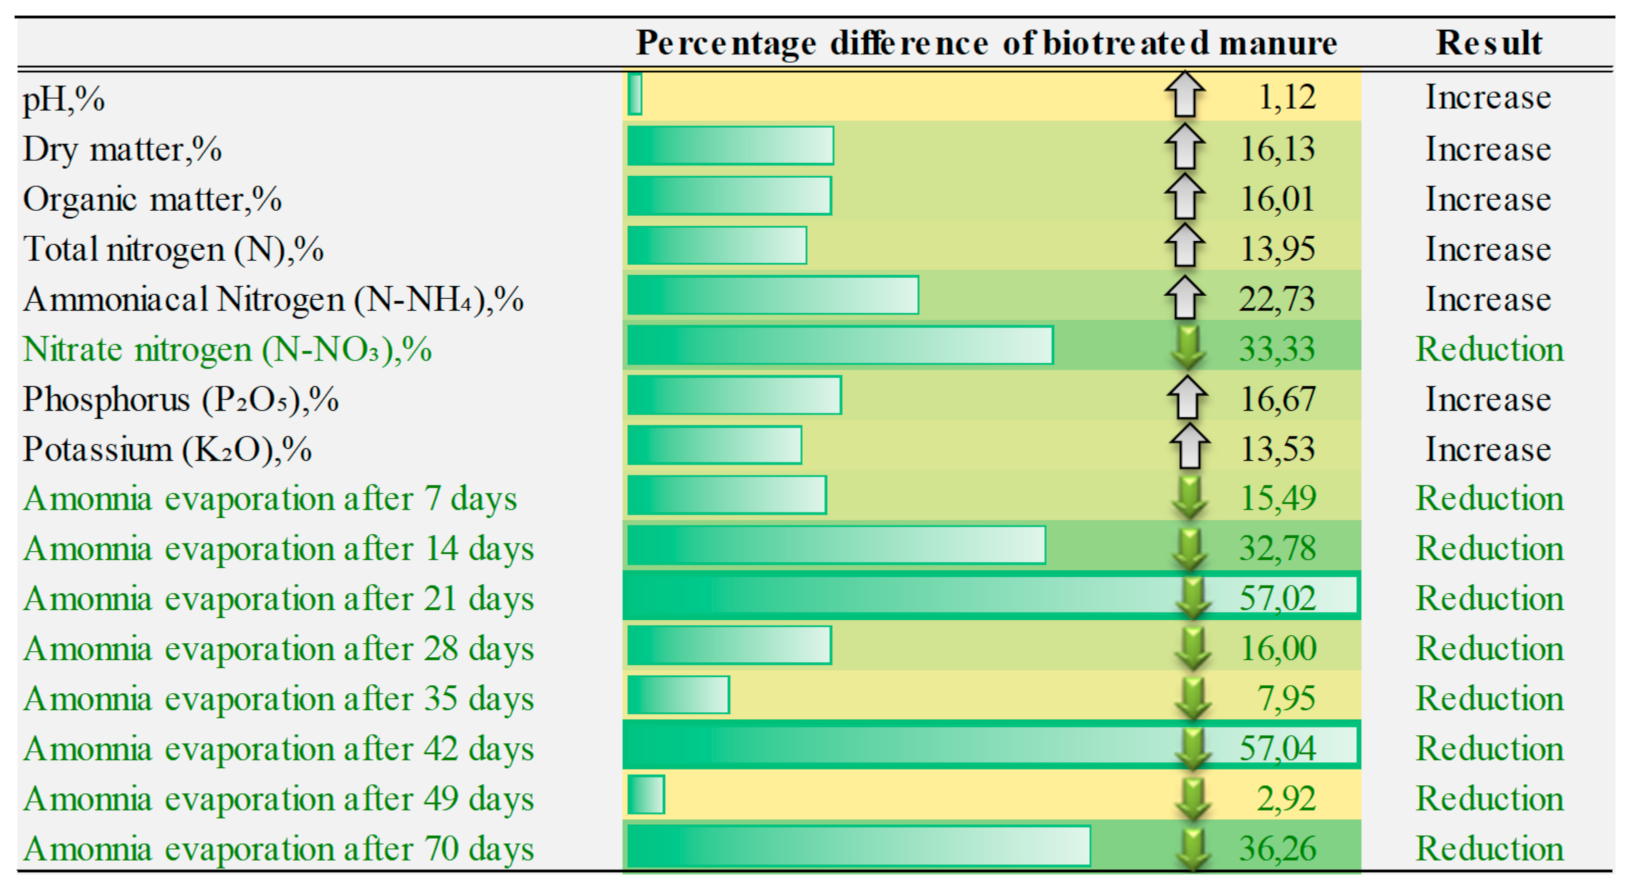
Significant changes in manure composition were observed for biotreated and final 96-day manure compared to fresh manure. The increase of manure alkalinity was determined. The values of the composition of manure that were exposed to biotreatment and stored for several months increased: dry and organic matter, total and ammoniacal nitrogen, phosphorus, and potassium. Only a percentage decrease of nitrate nitrogen was found.
The largest component was 8.55% to contain less organic material in the control manure compared to 10.18% in a biotreated manure. After 96 days, the nitric nitrogen content in both variants was almost unchanged at 0.0025% without significant differences. After 96 days of manure storage, the total amount of ammoniacal nitrogen, phosphorus, and potassium biotreated manure compared to the control manure was higher. Thus, it could be argued that the compound of biotreatment enriched the manure by adding it to soil remediation and vitality maintenance materials. The evaluation of the results was structurally approved in their general context. According to the calculation, there was a clear increase in the parameters of the organic and dry matter composition of biotreated manure, which is more than twice the control manure.
Percentage difference manure composition parameters—pH, dry matter, organic matter, total nitrogen, phosphorus, potassium using manure biotreatment was approximately 15% (
Figure 4).
The difference in ammonia nitrogen variation comparing control and biotreated manure is 24%. The minimum difference in pH between control and biotreated manure is possible and can be considered for the pH difference of final 96 days at the end of the research. The highest manure biotreatment effectiveness identified till 35% in nitrate nitrogen (N-NO3).
In sum, most of the established manure composition parameters have not changed significantly. The most significant differences were found in the parameters of organic matter and dry matter in both variants from 0.67 to 3.95 in the overall research. The differences between the control and the biodegradable manure composition parameters, the highest percentage difference of nitrate-nitrogen was established, and the pH difference between manure was not detected at the end.
3.2. Manure Biotreatment Effect on Ammonia Emission Reduction Depends on Manure Storage Time
The amount of ammonia emission from manure was analyzed by measuring the concentration of ammonia gas in a wind tunnel with biotreated and control manure. Each research study lasted an average of 4 months, with regular measurements periodically every 7 days. In the wind tunnel, the manure had constant air flow, and every 1 min, the concentration of ammonia in the wind tunnel was recorded. After one rehearsal, which lasted longer than 60 min, the research repeated. A constant air velocity of 0.1 ± 0.02 m s−1 at a diameter of 100 mm was determined. Manure samples in wind tunnel capacity: first sample consists—mixture of liquid manure, water, and biotreatment measurement which consists of Azospirillum sp. (N) number of bacterial colonies −1 × 109 cm−3, Frateuria aurentia (K) number of bacterial colonies −1 × 109 cm−3, Bacillus megaterium (P) bacterial colony count −1 × 109 cm−3, seaweed extract (10% by volume), phytohormones, auxins, cytokinin, gibberellins, amino acids, and vitamins, Second control sample consists—mixture of liquid manure and water. The analysis of the data shows the established concentration of ammonia, i.e., when the start of the research stabilizes the stationary process of ammonia emission from the manure or calculates the mean concentration over a 60-min period. The process of drying the manure surface with biodegradable manure began earlier, with an apparent decrease in liquids on the surface of the manure and the development of crust on the manure surface at the end of the research complicated process. Therefore, the use of biotreatments for degradation of the crust on the manure surface under such conditions is not recommended.
Before analyzing the effect of biotreatment on ammonia gas emissions from manure, the ammonia emissions from manure in both samples with fresh manure without additives was determined, and the average of ammonia concentration was 16.52 ppm in fresh manure.
Seven days after manure biotreatment, ammonia emissions from manure were tested, and the ammonia concentration was on average between 7 and 15 ppm. The approximation of data, the intersection of the set values, and the uneven variation only show the degree of polynomial curvature dependence of grades 4 and 5. At the beginning of the study, an increase in ammonia concentration in both test manure samples was observed after 10 min. The mean decrease in ammonia concentration was determined after 1 h. From the start of the research, the ammonia concentration was, on average, 12 ppm.
Summarizing the results 1 week after manure biotreatment, there was a significant drop in ammonia propagation (2 times), in contrast to the control manure, where the change in the gas concentration was not significant, only 1–2 ppm. Therefore, taking in account the results of this measurement, with the mixture of these biomaterials after treatment of the manure and its storage under aerobic conditions, after a week, the ammonia emission from it decreased twice.
After two weeks, the concentration of ammonia from biotreated manure dropped 1.6 times on average, in contrast to control manure, there was an increase in the ammonia concentration to an average of 3 ppm. Comparing the results of the first two weeks, the reduction in gas emissions from biotreated manure after 1 week was 0.5 times higher than after two weeks of manure storage. Twenty-one days after the use of the biotreatment, the concentration of gas in both capacities were uniform, and no significant mean values were detected.
Detecting the intensity of ammonia vaporization from control manure and biotreated manure after 28 days, there was a clear convergence of meanings and interconnections. After analyzing the regression results, the concentration of ammonia after 4 weeks of biotreated manure followed a logarithmic curve, and the addition of control manure was described by a polynomial. The ammonia gas concentration values were 1.5 times higher than in the tests a week prior, the growing concentration of ammonia gas could influence other factors (manure storage time, activation of urease production, chemical composition changes).
Ammonia gas concentrations in both variants were 80% evenly distributed throughout the study after 5 weeks. The measured gas concentrations were on average 14 ± 1 ppm. No significant upward or downward trend was observed in research during this period.
Six weeks after the start of the study, no such significant change was identified during the whole period under investigation, this could have been influenced by intensive phenomena in manure depletion processes. Analyzing the results of the research, there was a clear consecutive but not very significant decrease in the concentration of ammonia in biotreated manure compared to the measurements obtained a week prior.
The results of experiments at an airborne velocity of 0.1 m s
−1 in the channel after 49 days are distinguished by an uneven increase in the ammonia concentration after insertion into the tunnel of the manure samples, with the values scattered around the polynomial curve. The concentration of ammonia increased by an average of 2 times (in the case of manure without additives) after 7 weeks compared with the data established after 6 weeks of manure storage. This may be due to a decrease in the efficacy of biotreatments (
Figure 5).
After 70 days of storage of manure, the test conditions were changed, and the air velocity in the channel was increased to 0.2 m s−1. The changes in the ammonia gas concentration depend not only on the manure storage time but also on the air velocity of a certain microclimate factors in the barn. The results of the study showed a near-parallel variation of the ammonia gas concentration in the control and biotreated manure. Air velocity change in channel could affect the ammonia concentration increases compared with previously obtained results, or, regarding a minor increase in the gas concentration in the control manure, it can also be assumed that the biotreatment to these conditions became ineffective after 70 days.
To analyze other possible changes in the concentration of ammonia gas after 70 days, the air velocity in the channel was further increased to 0.7 m s−1, simulating, and estimating the higher air venting intensity in the barn.
According to the obtained results of the ammonia concentration study over biologically treated and control manure, a more even change of values in the wind tunnel in the case of a capacity with biotreated manure is observed. No increase or decrease in concentrations was observed in these research studies. Comparing the results of changes in ammonia concentrations, when the air velocity in the channel was 0.7 m s
−1, the ammonia concentration decreased by 2 times compared to the control manure, and on average 2.5 times that of the biomass treated manure (
Figure 6).
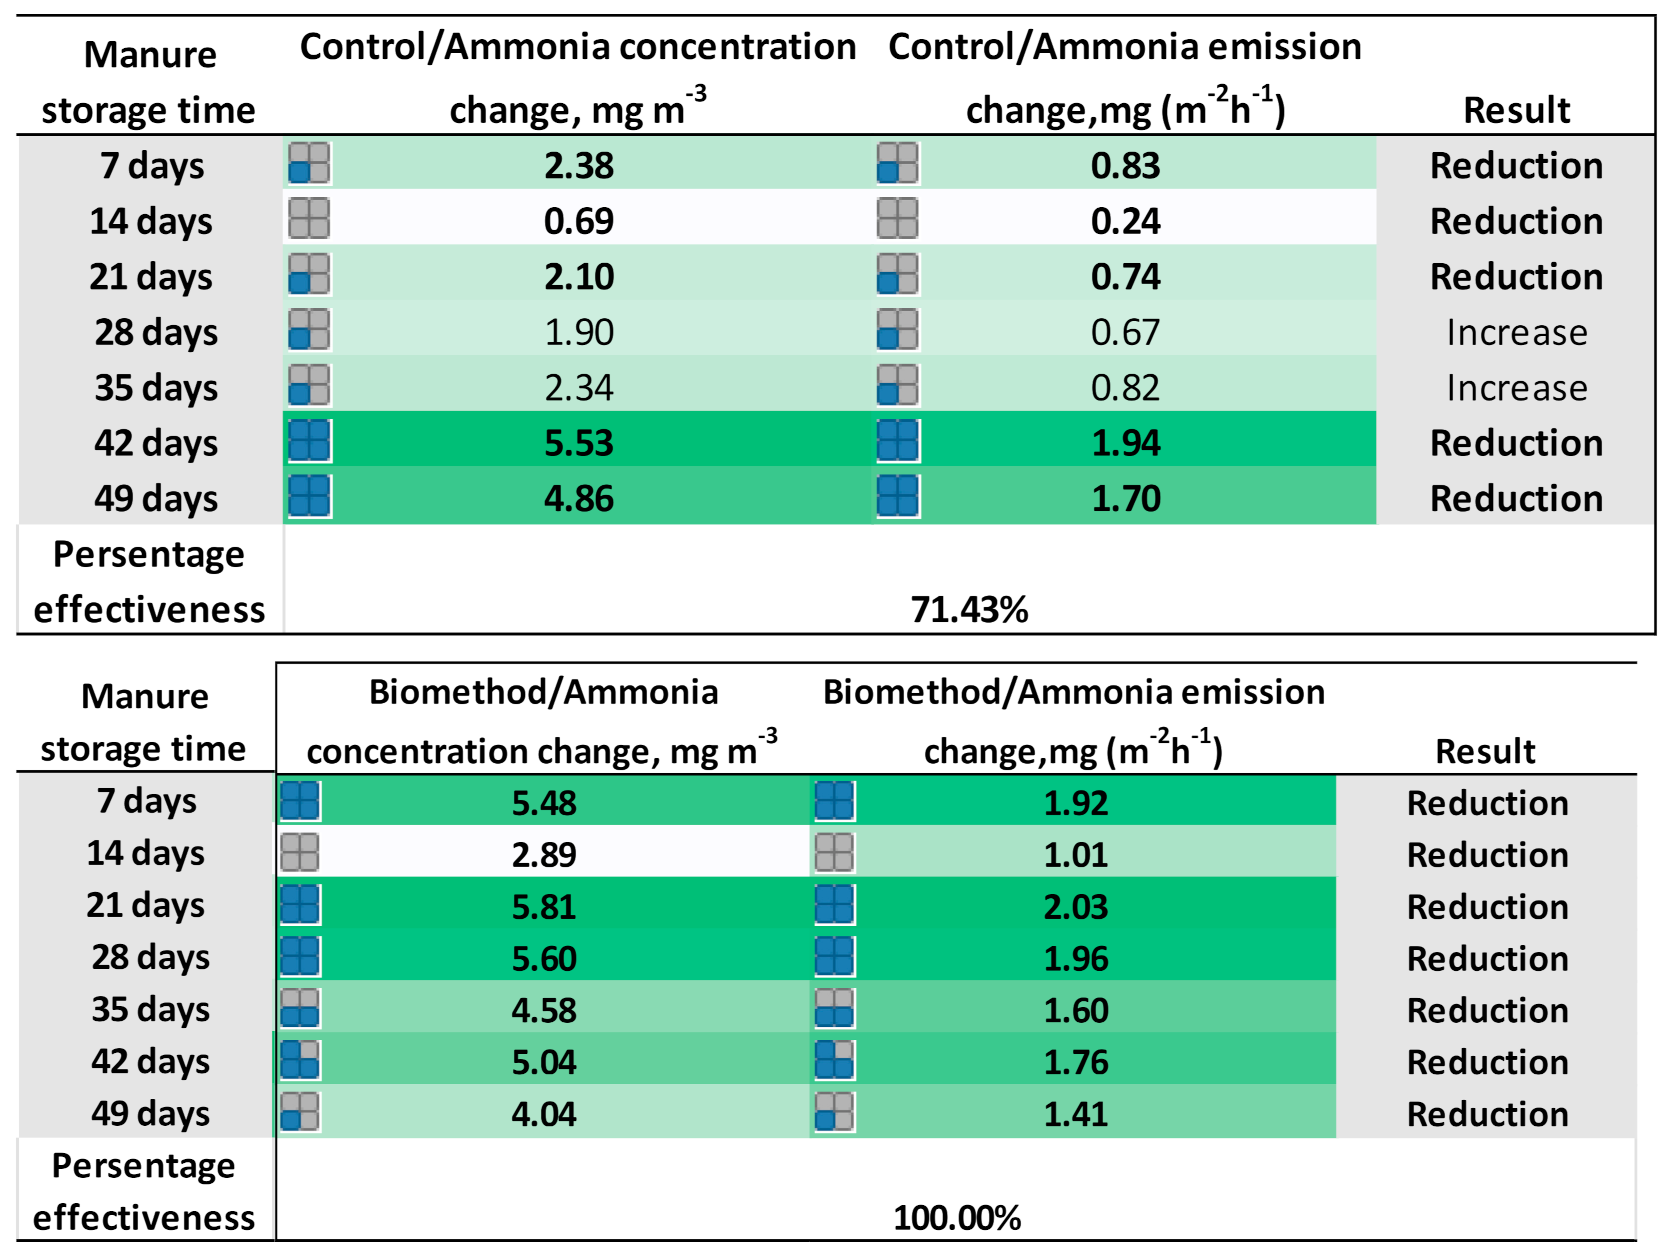
According to the results of the ammonia concentration in the wind tunnel above the biotreated and control manure, depending on the manure storage time after the use of the biotreatment, significant differences are established only at certain periods. Significant reductions in ammonia emissions from biotreated manure occur within one week. Taking ammonia concentration differences in the wind tunnel into account, placing manure samples depending on the manure storage time compared to the original concentration, fresh manure without biotreatments was added, and it can be stated that during the whole period, the ammonia concentration of biotreated manure declined. To show the maximum change from the initial ammonia concentration, attention should be paid to the storage of manure on day 42. According to the results of the change, with the introduction of a control manure without biotreatments, an increase in ammonia concentration over certain periods and a maximum decrease of 5.11 ppm were apparent, but unfortunately did not achieve the best results, with biotreated manure (
Figure 6).
Differences in the concentration of ammonia can be estimated, regardless of the initial values. Differences in the concentration of ammonia can be estimated, regardless of the initial values, because all research of every 5 replications begin fixed just after all values settle down. At the beginning of all gas emission research, all gas concentration values are zero and then rise to moderately constant. The test values must be recorded in a statistically and methodologically reliable manner only from the moment when the initial values must be eliminated. The concentration of gases has stabilized, and the difference in ammonia concentration has not changed, which indicates that different manure disintegration processes occurred in the manure affected by the combination of biotreatments. The lowest differences in average of ammonia concentrations from manure were maintained for 49 days and could be due to the reduced efficacy of the biotreatments (
Figure 7,
Figure 8 and
Figure 9).
Differences in ammonia emissions from control manure and from biotreated manure after a certain period of the time confirm the results obtained previously and show the effectiveness of the mixture of biotreatment in order to purposefully influence the processes of manure and reduce the release of ammonia into the environment. Identified manure biotreatment effect on ammonia emission percentage reduction from 2.92 up to 57.04% respectively storage manure 49 days and 42, 21 days.
3.3. Manure Biotreatment Effect on Ammonia Emission Reduction Depends on Intensity of Air Movement
Ammonia emissions from manure vary in varying ventilation intensities in the environment. Theoretical research has shown that the process of emission of ammonia from manure is influenced by many variables and interconnected factors, one of which is the intensity of air movement. As the air velocity changes within the recommended limits for cowsheds (up to 2 m s−1 in summer), the emission of ammonia is even more pronounced. With an increase in air velocity from 0.1 to 2.0 m s−1, ammonia emissions increase by as much as 10 times. With increasing air velocity, its influence on emissions decreases. At an air velocity range of 0–0.5 m s−1, an increase in speed of 0.1 m s−1 increases the average ammonia emissions by 39.4%, and it increases in the range of 1.5–2.0 m s−1 in the range of only 4.7%.
During the drying of manure, a crust forms on the outer layer, which acts as protection against ammonia diffusion. Ammonia diffusion is strongly influenced by air velocity. During intense ventilation, the concentration of ammonia in the air over the manure is low, which leads to more intense ammonia emission. However, if there is a strong air flow, the top layer of manure can dry more intensively, which will also reduce the emission of ammonia.
The influence of variable airflow on the emission of ammonia from the control manure and biotreated manure was determined when the intensity of air movement was 17.66 m
3 h
−1, 35.33 m
3 h
−1, and 123.6 m
3 h
−1 (
Figure 10 and
Figure 11).
The results of the study of the effect of air velocity on the average wind ammonia concentration in the wind tunnel indicate that the increase in intensity of air movement to 123.6 m3 h−1 decreases the ammonia concentration 2.6 times. The inconsistent development of ammonia emissions from manure has been determined, increasing the speed of air movement. The reason for this could be the changing processes of decomposition of manure.
The maximum deviations from the average difference in the concentration of ammonia are set at air speeds of 0.7 m s−1. At the beginning of the study, the difference in ammonia emissions from biotreatment and control manure was low when the air velocity in the channel was 0.1 and 0.7 m s−1. Subsequently, the difference in the gas concentration in the wind tunnel above the two tested manure samples was completely different; at an average velocity of 0.1 m s−1, it ranged from 0 to 1.3 ppm, with a speed of 0.2 m s−1 averaging between 5 and 7 ppm, and at the 0.7 m s−1 speed, varying from 0.8 to 3.5 ppm.
The approbation established manure biotreatment effect on ammonia emission percentage reduction depends on intensity of air movement from 27.03 up to 36.26%, when intensity of air movement varied from 17.66 up to 123.64 m
3 h
−1 (
Figure 10 and
Figure 11). The maximum manure biotreatment effect on ammonia emission percentage reduction was assessed when intensity of air movement was 35.33 m
3 h
−1.
A test of ammonia emissions from manure after 80 days of manure storage was performed to determine if the effect of the mixture of biotreatments was reduced or eliminated. It is almost identical to the trend of changes in ammonia emission values over both variants (control and manure biotreatment). The determination of the efficacy of biotreatments after 90 days of manure has shown uneven variation in the range of 3 to 5.5 mg (m−2 h−1). A clear change in the emission of ammonia between both variants was detected compared to a verified manure biotreatment effect research. The effect of biotreatment decreased and disappeared after approximately 49–56 days.
3.4. Manure Biotreatment Effect on Ammonia Emission Reduction Dependence on Dynamics of Manure Compositions
For the evaluation of manure biotreatment effect, experimental research was carried out to determine the changes in agrochemical composition and NH
3 gas emissions, depending on the storage duration and intensity of air movement. Manure biotreatment effect on ammonia emission reduction dependence on dynamics of manure compositions (
Figure 12) was assessed.
In abstraction ammonia emission reduction by linear dependence on dynamics of manure composition such as pH, dry matter, organic matter, total nitrogen, ammoniacal nitrogen, nitrate nitrogen, phosphorus, potassium. The analysis of the residual linear regression model used in the ammonia emission experiment showed that the model is acceptable because the model’s uncertainty is determined by the coefficient of determination, and the obtained results reflect almost equal coefficient variation. Manure biotreatment effect on ammonia emission reduction depends on manure pH, dry matter, organic matter, total nitrogen, phosphorus, potassium increases, and nitrate nitrogen reduction. No significant manure biotreatment effect on ammonia emission reduction dependence was identified on the ammoniacal nitrogen. In the general case trend, manure biotreatment usage was more effective on ammonia emission reduction dependence on bigger linear increase of pH, dry matter, organic matter, total nitrogen, ammoniacal nitrogen, potassium compared with the control. Then, having the values of the percentage change rather than the initial results, we can partially absolute, because such a percentage change would be independent of the exact specific initial values.
Depending on the liquid manure, high levels of NH
3 are formed at alkaline pH (7.0 to 8.0) and lowering of pH from 6 to 8 has been shown to reduce ammonia losses by 0.04 to 40%, respectively. Ammonia has been identified as one of the major environmental pollutants in livestock farming and biological additives can reduce its levels by reducing the pH of manure by improving nutrient utilization [
40,
41]. With different research, the reduction of excreta NH
3 may be considered as an improved ileal digestibility of amino acids and an increased intestinal Lactobacillus population [
41]. In agreement with other scientific results, refs. [
42,
43] reported that the dietary application of 107 cfu kg
−1 of Lactobacillus- or Bacillus-based probiotics could reduce the NH
3 contents in the broiler excreta. Ref. [
43] found also that dietary supplementation with B. subtilis UBT-MO
2 resulted in 26.5 and 37.9% lower excreta NH
3 and H
2S concentrations, respectively, compared with no supplementation.
In abstraction, all different biodegradation impact assessments could confirm that manure biotreatment reduces ammonia emissions through dynamics of manure compositions and increased emission of ammonia from manure affects the biggest impact of biological measurements on suppressing gas emission. Less ammonia emission will make organic fertilizer create more valuable.
Companies in the dairy sector are facing increasing challenges, one of which is rising production costs. Unpredictable weather in recent years (moisture shortages, droughts, late frosts, frosts) is driving up the price of cereals and protein feeds, leading to rising farm costs. Therefore, one way to reduce costs is to maximize the amount of basic fodder grown on own pastures, both in terms of quality and quantity.
For the European Union, to implement the green course, the main goal is to abandon the use of mineral routes. Therefore, substantial benefits are assessed through the reduction of air pollution. By reducing ammonia emissions, we conserve nitrogen.
According to the main priority—save nitrogen losses—manure biotreatment will reduce ammonia emissions from cow farms by approximately 32%, and will also reduce 5% nitrogen losses from manure. By the Nitrates Directive providing fertilization with up to 170 kg ha−1 of pure nitrogen, ammonium nitrate will require an average 510 kg ha−1 (about 100–120 Eur ha−1) and urea an average 340 kg ha−1 (about 90–100 Eur ha−1). Thus, when applying 170 kg ha−1 of active ingredient nitrogen, the cost of nitrogen fertilizer, about 110 Eur ha−1, using manure treatment could reduce approximately 5.5 Eur ha−1. Manure will retain more nitrogen and reduce the use of inorganic N fertilizers by approximately 5%. World demand for nitrogen fertilizer nutrients was approximately 118.22 × 10⁶ Mg in 2019, so could reduce approximately 591.11 × 10⁴ Mg nitrogen fertilizer.


