Article

Bread Wheat Quality under Limiting Environmental Conditions: I-Molecular Properties of Storage Proteins and Starch Constituents in Mature Grains

1
Rural Development Department, Ministry of Agriculture, Beirut 2827, Lebanon
2
Transformations & Agro-Ressources Research Unit–ULR 7519, Institut Polytechnique UniLaSalle, Université d’Artois, 19 Rue Pierre Waguet, 60026 Beauvais CEDEX, France
*
Author to whom correspondence should be addressed.
Agriculture 2021, 11(4), 289; https://doi.org/10.3390/agriculture11040289
Submission received: 12 February 2021 / Revised: 22 March 2021 / Accepted: 24 March 2021 / Published: 27 March 2021
(This article belongs to the Section Agricultural Product Quality and Safety)

Abstract

:
To support the introduction of local soft wheat varieties, the Lebanese state has implemented, during recent years, an improvement program to select plant material with good productivity in semi-arid conditions that can lead to national production that can, at the same time, meet quality needs expressed by Lebanese processors. In the present study, the main biochemical components of grains conventionally associated with bread-making properties (storage proteins, starch polysaccharides) were physiochemically characterized for a panel of local soft wheat varieties selected. During the two consecutive years of cultivation, the post-flowering thermal constraints significantly modified the kinetics of accumulation of the major constituents by mainly limiting the grain filling time. The level of polymerization/aggregation (i.e., gliadin/glutenin ratio, unextractable polymeric protein (UPP) amount, molecular weight average of glutenins) of prolamins was very high. The reduction in the amount of starch was accompanied by a significant change in the amylopectin/amylose ratio. Finally, the genotypes studied were characterized by significantly different distributions of starch granules; the percentage of the volume occupied by A-type and B-type starch granules varied between genotypes for the two cropping years. All these observations must be considered because of their determining role in the technological aptitude of the flours generated.

1. Introduction

Wheat count among the most important raw materials for human consumption. It is well known for its nutritional qualities. In Lebanon, this cereal is grown mainly in the Beqaa plain, considered as the country’s agricultural basket. Annual production in 2019 reached a level of 140,000 tons [1], with 75% made up of durum wheat (Triticum durum), mainly due to its better adaptation to environmental conditions, resulting in acceptable levels of yield appreciated by farmers. At the same time, annual imports in 2019 amounted to 1,575,000 tons [1], mainly constituting soft wheat suitable for breading. Today, in order to limit this level of imports, the Lebanese state wishes to support the introduction of local soft wheat varieties. Thus, an improvement program has been put in place to select plant material adapted to environmental conditions (i.e., good productivity in semi-arid conditions) that can lead to national production of a good quality (i.e., respect the needs expressed by Lebanese processors (i.e., millers and bakers)).
It is mostly environmental conditions (i.e., temperature and/or humidity) observed during the grain filling phase [2,3,4] that significantly affect productivity and the quality of wheat grains [5,6,7,8]. As early as the 1950s, Finney and Barmore [9] confirmed that the technological capacities are principally conferred by gluten [10]. Gluten consists of a polydisperse mix of prolamin proteins (i.e., glutenins and gliadins) that interact via non-covalent and covalent bonds (ionic, hydrogen, hydrophobic, inter S-S bonds, etc.) [11,12,13,14,15]. From these works, the variation of the baking properties of wheat flour clearly depends on the ability of its storage protein fractions (i.e., prolamins) to establish, during mixing, a three-dimensional structure with viscoelasticity characteristics [16]. Consequently, the storage proteins found in common wheat flour show a strong tendency to auto-aggregate into a three-dimensional plastic network during the kneading of dough. Since the 2000s, particular attention has been paid to glutenin proteins because a close relationship/correlation has been established between baking properties (i.e., extensibility, mixing time, and loaf volume) and the molecular weight distribution (MWD) of the aggregates of polymeric proteins [17].
Beyond these important protein parameters, it is essential to consider modifications of the content and/or characteristics of starch components contained in the grains [18,19,20,21]. Indeed, several authors have previously pointed to the influence of different amylaceous characteristics (i.e., amylose/amylopectin ratio [22], distribution of starch granule sizes [23], grain surface-to-volume ratio [24]) on grain processing aptitudes.
Our work is part of a general study on the assessment of processing skills (mainly bread-making performance) of local soft wheat varieties selected by LARI’s (Lebanese Agricultural Research Institute) Grain and Vegetable Research Department in collaboration with the International Center for Agricultural Research in the Dry Areas (ICARDA) and the Arab Center for the Studies of Arid Zones and Drylands (ACSAD) for their agronomic behavior to handle environmental constraints. The first part of this general study (part I: present paper) is dedicated to the characterization of the main biochemical components selected (i.e., molecular properties of storage proteins and starch of matured grains) and a second part, which is in press [9], is dedicated to the characterization of the rheological behavior of flours and doughs produced.

2. Materials and Methods

2.1. Plant Materials

Four different bread wheat genotypes, selected for their potential tolerance/resistance to hydric stress and rust [25,26,27] by two agricultural research centers operating in dry zones (ICARDA and ACSAD, Bekaa Valley, Lebanon), are delivered by LARI (Bekaa Valley, Lebanon) to be the material of this study. These cultivar pedigrees are shown in Table 1.
Bread wheat varieties were cultivated for 2 successive years (2015 and 2016) at Tal Amara Lebanon in LARI experimental farm, located at 905 m altitude, 33°28’ N latitude, and 36°30’ E longitude. The four cultivars were grown in a sandy loam clay soil with three replications according to a randomized complete block design. Experiments were performed without irrigation intervention. Seeding took place in early December, whereas harvesting was done in late June. Central Beqaa climate is semi-arid, wherein rain is concentrated between December and April.

2.2. Wheat Grain Quality Assessment

Studied traits of wheat homogeneous grain samples were based on the determination of the thousand kernels weight (TKW), the protein total content (N × 5.7) by Dumas method (AACC 76.13.01) on LECO FP-528 (Perkin Elmer, Villebon sur Yvette, France), and starch content [28].

2.3. Wheat Flour Preparation

Wheat grains were dampened at 16% (w/w) humidity and tempered for 24 h before being milled on an experimental Bühler miller (type MLU-202, Bühler, Villepinte, France) according to (AACC 26-21.02) [28]. Resulting white flour, having a mean extraction rate of 65% and a mean ash content of 0.68%, was subjected to different analysis with 3 replicates of each sample.

2.4. Quantification of Grain Proteins by Size Exclusion–High Performance Liquid Chromatography (SE-HPLC)

For the extraction of Sodium Dodecyl Sulphate (SDS)-extractable proteins, 10 mg of white flour samples were mixed with sodium phosphate buffer solution (1 mL, pH 6.90, 0.05 M, SDS (2%, w/v)). After 2 h of incubation at 60 °C with continuous stirring, mixtures were centrifuged at 12,500× g for 30 min at 20 °C. Supernatants containing the SDS-soluble proteins were filtrated through a syringe filter of regenerated cellulose (porosity = 0.45 µm), and 20 µL was then injected into the SE-HPLC system. The pellets were resuspended in of the same sodium phosphate solution (1 mL, pH 6.90, 0.05 M, SDS (2%, w/v)) and sonicated for 20 s using a 3 mm microtip probe (Sonics Materials, Thermo Fisher Scientific, Les Ulis, France, model 75038) and centrifuged for 30 min (12,500× g at 20 °C). The supernatants containing the SDS-unextractable proteins were filtered through 0.45 µm followed by injection of 20 µL.
For the total protein extraction, 10 mg of white flour was incubated at 60 °C for 2 h with a continuous stirring in the presence of sodium phosphate buffer solution (1 mL, pH 6.90, 0.05 M, SDS (2%, w/v)). Sonication was then performed for 20 s using a 3 mm microtip probe (Sonics Materials, Thermo Fisher Scientific, Les Ulis, France model 75038). After this, samples were centrifuged at 12,500× g for 30 min at 20 °C. As above, the supernatants were filtered through 0.45 µm, and 20 µL was then injected into the column.
The analysis of protein fractions was performed on a Spectra SYSTEM LC (Thermo Fisher Scientific, Les Ulis, France). The used column for SE-HPLC analysis was a TSK G 400 SW (300 × 7.5 mm, 450 Å) preceded by a pre-column (6 × 40 mm TSK gel SWXL). Eluent consisted of sodium phosphate solution (0.05 M, pH 6.90, SDS (0.1%, w/v)). The pump was set at a constant flow rate (0.7 mL·min−1). In order to avoid SDS precipitation during protein separation, we thermostated the HPLC oven at 25 °C. In accordance with the work of Hajas et al. [29], 3 protein fractions were quantified: fraction 1 (glutenins), fraction 2 (gliadins), and fraction 3 (albumins/globulins). Amounts of the different protein fractions were determined as a relative proportion of the total chromatogram area. Unextractable polymeric proteins (UPP) were calculated as follows:
UPP   ( % )   = ( nextractable   glutenin / total   glutenin )   ×   100

2.5. Determination of the Molecular Distribution of Flour Protein by Asymmetrical Flow Field Flow Fractionation (A4F)

Wheat protein molecular weight distribution was performed as reported previously [17]. Flour (30 mg) was mixed with sodium phosphate solution (1 mL, pH 6.90, 0.05 M, SDS (2%, w/v)) and incubated for 2 h at 60 °C with vortexing every 10 min. Samples were then sonicated (20 s at power setting ≈30%) with a 3 mm microtip probe before being centrifuged (12,500× g) for 15 min at 25 °C and filtered through 0.45 μm and then injected (30 μL) in A4F/MALLS system. The A4F machine used was an Eclipse3 F System (Wyatt Technology, Santa Barbara, CA, USA) combined with a multi-angle light scattering (MALLS) detector (Dawn multi-angle Heleos TM, Wyatt Technology, Santa Barbara, CA, USA) and an Optilab T-rEX refractive index detector (Wyatt Technology, Santa Barbara, CA, USA). In addition, The Agilent HPLC 1200 Series (Agilent Technologies, Les Ulis, France) was used in tandem with the AF4 system. The Trapezoidal channel had 286 mm of length and the used spacer was 350 μm. The ultrafiltration wall consisted of regenerated cellulose membrane with a cutoff of 10 kDa. The mobile phase consisting of a sodium phosphate buffer solution (pH 6.90, 0.05 M, SDS (0.1%, w/v)) passed continually through a 0.1 µm regenerated cellulose filter (Merck Millipore, Guyancourt, France). Absorbance was recorded at 214 nm. The cross flow used for fractionation was focused at 0.5 min at a constant flow rate of 2 mL·min−1. Injection step was realized during 1.0 min at a flow rate of 0.2 mL·min−1, and a relaxation phase was adjusted to 0.5 min. These steps were followed by elution at flow detector of 1.0 mL·min−1 and cross-flow rate decreasing from 3.0 to 0.0 mL·min−1. After 14 min of elution, cross-flow rate was maintained at 0.0 mL·min−1 for 9 min. Determination of number-average molar mass (Mn), weight-average (Mw) molar mass, radius of gyration (Rz), and hydrodynamic radius of gyration (Rh) was performed using ASTRA 7.1.2 software (Wyatt Technology, Santa Barbara, CA, USA).

2.6. Quantitation of High Molecular Weight Glutenin Subunits (HMW-GS) by Lab-on-a-Chip

Extraction and quantification of glutenin subunits was achieved as reported in our previous study [30]. Wheat flour (30 mg) was suspended for 20 min at 22 °C in a buffer solution (1 mL, 0.08 M Tris-HCL, pH 7.50, propanol-1 (50%, v/v)). Samples were centrifuged for 15 min (15,900× g). Monomeric proteins (i.e., gliadins, albumins, and globulins) contained in the supernatant were discarded. Pellets containing polymeric proteins were mixed with 0.6 mL of a Tris-HCl solution with SDS (2%, w/v) and DTT (1%, w/v) and sonicated for 20 s (30%) with a microtip probe of 3 mm. The mixes were incubated for 30 min at 60 °C before being centrifuged for 15 min (12,500× g at 22 °C). The separation of glutenin subunits was performed on a Lab-on-a-Chip apparatus (LabChip GXII Touch HT Protein Characterization System, PerkinElmer, Waltham, MA, USA), where the chip channel was primed with a polymer solution of polydimethyl methacrylate of high molecular weight (pDMA) in a solution of Tris-Tricine containing SDS and a non-covalent coloration of 0.27% (w/v).

2.7. Extraction of Starch Granules of the Wheat Flours and Determination of Their Size

Starch granule extraction was based on the developed INRA (Institut National de la Recherche Agronomique) protocol by Bancel et al., 2010 [31]. A sample of 500 mg of flour was added to 10 mL of ultrapure water, mixed and filtered (100 µm), and then centrifuged at 4000× g for 5 min at 22 °C. The precipitated material was twice treated in the same way. A total of 5 mL of Tris-HCL buffer (55 mM, pH 6.80, SDS 2.3% (w/v), 10% glycerol (v/v), and 1% thiothreitol (w/v)) were then added to the precipitate and vigorously stirred for 30 min. Samples were then sonicated (20 s, 30% at power max) (3 mm microtip probe) and centrifuged (4000× g) for 5–10 min at 20 °C. Pellets were washed for 3 consecutive times using ultra-pure water (10 mL) and then washed twice with acetone (10 mL). Centrifugation for 5–10 min (4000× g, 20 °C) was performed after each washing step. Dried starch was kept at 4 °C.
Starch granule size distribution was performed through laser diffraction using Malvern Masterizer 2000 (Malvern, Palaiseau, France). Distribution of starch granules is expressed by the percentage of the volume occupied by granules due to their size. It is a particle size analyzer that sizes starch particles through a wet dispersion unit. The measurements were conducted using a MU hydro dispersion unit. The stirring energy ensured the homogenization of the sample suspension. The chosen pump speed was 2500 revolution per minute (rpm) in order to obtain a maximum homogenization of the suspension in the beaker by elimination of air bubbles. A particular detector registers the intensity of laser light in the optical cell that is converted to particles size distribution.

2.8. The Molecular Weight Distribution of Starch Polysaccharides by Asymmetrical Flow Field Flow Fractionation (A4F)

The molar mass distribution of starch polysaccharides was performed according to the developed procedure reported by Chiaramonte et al. [32]. Purified starch (10 mg) was dissolved in dimethyl sulfoxide (1 mL, DMSO 95% (w/v)) at 100 °C for 1 h, then precipitated in 5 mL of ethanol and centrifuged (20,000× g) for 20 min (20 °C). The precipitate was added to 4 mL of NaOH (20 mM) and solubilized for 8 min at 135 °C in a microwave (Discover CEM, Saclay, France), then filtered through a 0.45 μm syringe filter (Merck Millipore, Guyancourt, France) and injected (100 µL) in the A4F/MALLS system. The A4F machine used was an Eclipse3 F System (Wyatt Technology, Toulouse, France), which can be similarly described as previously (Section 2.5). However, the used channel was the short channel that had a 195 mm length and the used spacer was of 0.35 mm. The system was normalized and checked with pullulan 110 kDa and 800 kDa, respectively. Detection of molecules was obtained by a differential refractometer (DRI) and through multiangular light scattering MALLS.

2.9. Statistical Analysis

Data statistical analysis was performed using XLSTAT 2020 (Addinsoft, Paris, France). Multiple mean comparison by ANOVA multifactor was calculated through a variance analysis-type ANOVA (p = 0.05). Multiple mean comparisons were performed using Tukey’s test HSD (honestly significant difference) (p = 0.05).

3. Results

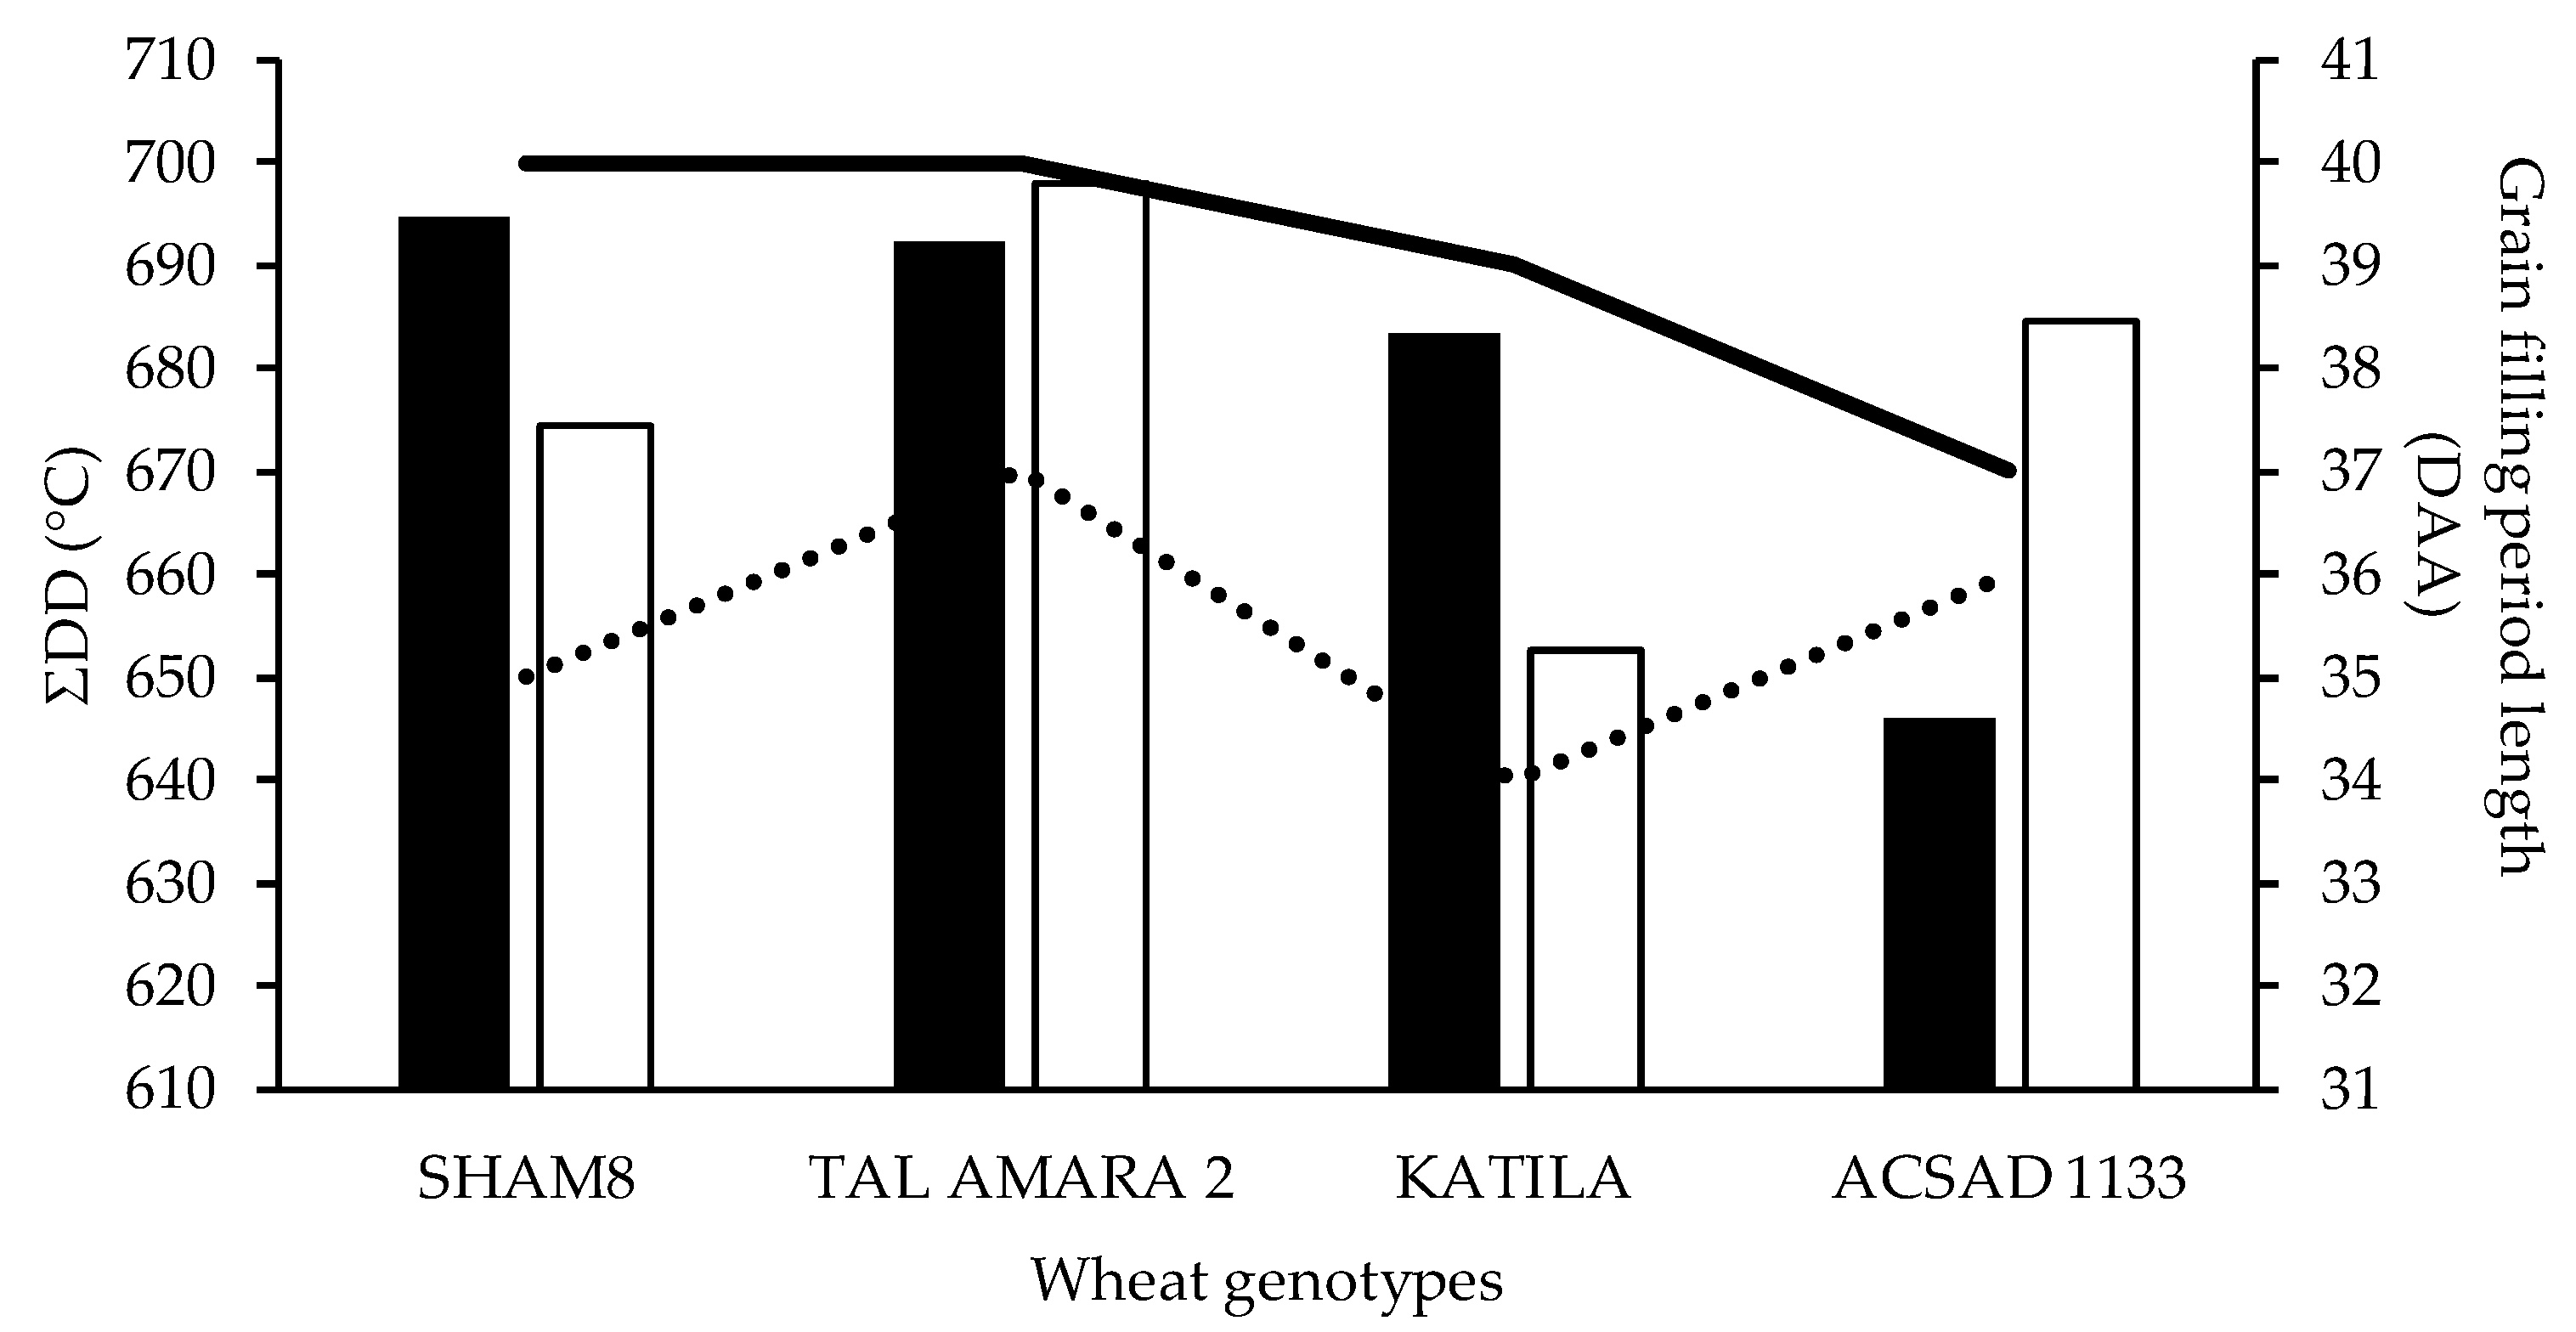
3.1. Characteristics of the Grain Filling Period

Climatic changes impact on ecophysiology, and potentials of wheat cultures essentially depend on the temperature and water. In semi-arid zones, such as in Lebanon, mean day temperatures and maximal day temperature are of higher levels [33]. The frequency of day temperature level exceeding 30 °C is significantly elevated. Thus, in these particular zones, high temperatures can lead to higher evapotranspiration and the apparition of a hydric deficit, resulting in a lower photosynthesis activity. These environmental conditions can have important consequences if they occur after the anthesis during the phases of cell division and/or the cell enlargement in wheat kernels.
In our study, the grain filling period of the different wheat genotypes studied can be characterized by the sum of degree day (ΣDD) registered during two different seasons of culture (i.e., 2015 and 2016) from anthesis up to the harvest maturity of the grains. Figure 1 shows the data recorded in terms of (i) sum of degree day (ΣDD) but also in terms of (ii) grain filling period duration for the four different wheat genotypes studied. The sums of degree day observed were fairly homogeneous; they varied between 677 DD (mean value for 2015) and 679 DD (mean value for 2016). KATILA and ACSAD 1133 are two genotypes characterized by higher precociousness, and this is regardless of the cultivation year concerned. At the same time, the grain filling period length observed for the same wheat genotypes varied between 34 days after anthesis (DAA) (mean value for 2016) and 39 DAA (mean value for 2015). Whatever the wheat genotype studied, these values correspond to a severe limitation of the accumulation time length of the grain reserves (storage proteins and starch) classically observed (i.e., more than 10 or 20 days of limitation) [34]. Thus, the higher the daily temperature, the number of days of accumulation decreases.
For the two cultivation seasons, the temperatures and the precipitation recorded during the same period are presented in Figure 2.
These first physiological observations seem to confirm that the different soft wheat genotypes used during our study were subjected to environmental conditions that can be qualified as “limiting” physiological conditions. These environmental conditions have led to a natural limitation of the length of the grain filling phase that, in the absence of modification of the filling speed of the grains [2], has had, as is shown later, a significant impact on the intensity of the accumulation of total dry matter in the grains.
The general characteristics of wheat grains (i.e., TKW, protein content, starch content) harvested in 2015 and in 2016 are presented in Table 2. Thus, the TKW values were between 21.42 and 25.96 g, with a very low multi-year average value corresponding to 24.5 g (from 23.35 to 25.69 g for 2016 and 2015, respectively). In fact, TKW values observed in our study were significantly reduced (i.e., from −25% to −35%) compared to those previously obtained by El-Kareem and El-Saidy [35], who mentioned mean values of about 34.2 g for the genotypes parented of the wheat cultivars studied here in classical environmental conditions in Egypt. In our study, SHAM 8 was the only wheat genotype that differentiated statistically (p = 0.05), with an average value of 21.42 g. These results, which reflect a strong limitation of the dry matter accumulation in the grains for all the genotypes studied, seemed to be mainly related to a significant dysfunction of the post-anthesis carbon metabolism (i.e., the biosynthesis and the accumulation of the starch resulting from post-anthesis photosynthetic activity). Indeed, as shown in the results presented in Table 2, the grains of the different genotypes studied were characterized by very high levels of total proteins (average protein content of 17.43 g/100 g DM (dry matter) with annual averages between 14.78 and 20.29 for 2016 and 2015, respectively) and low levels of starch (average starch content of 55.16 g/100 g DM with annual averages between 53.57 and 56.75 for 2015 and 2016, respectively).
In contrast to the metabolism of protein accumulation, which is mainly is a remobilization metabolism, the starch accumulation metabolism essentially corresponded to a de novo synthesis metabolism from the post-anthesis photosynthetic activity of the terminal leaf surfaces (i.e., mainly the last two foliage stages) [36]. In fact, any reduction in photosynthetic activity will result in a deficit of biosynthesis and starch accumulation in the grains and, consequently, a lack of dilution of the accumulated protein content, resulting in the consequent reduction of TKW [37]. These results are in total accordance with some previous observations made in different environmental limiting conditions [38,39] and, in the case of our study, these limiting conditions were even more marked in 2015 than in 2016.

3.2. Prolamin Content of Wheat Grains and Their Molecular Weight Distribution

All the different results of these assays are compiled in Table 2. Although there were slight significant differences between the four genotypes studied (i.e., between TAL AMARA 2 and the other wheat genotypes), the polymeric prolamin contents were very close (from 29.92% to 36.51% for KATILA and TAL AMARA 2, respectively). At the same time, the content of gliadin (monomeric prolamins) represented between 50.20% and 55.47% of the total protein content of wheat grains, with a multi-year average value corresponding to 54.06%.
In view of these results, it appears that the four genotypes in the context of our study were characterized by relatively high gliadin contents. In fact, this fraction of prolamins represented here more than 54% of the total protein content, i.e., approximately +10 to +15% more than the protein content commonly encountered for soft wheat varieties [40]. Gliadins were generally synthesized and accumulated most rapidly between 10 and 30 DAA. On the contrary, glutenin subunits [Low molecular weight glutenin subunits (LMW-GS) and particularly high molecular weight glutenin subunits (HMW-GS)] accumulated more slowly but for a longer period during grain filling.
As was shown above, the environmental conditions that were recorded during our study led to a significant reduction in the filling time of the grains. As a consequence, these limiting environmental conditions caused a significant reduction in the synthesis and accumulation of polymeric prolamins in favor of the monomeric prolamins.
Since the 2000s, scientists agreed that the molecular weight distribution (MWD) of prolamin proteins are the main factors determining the technological properties of flours [41]. However, variations in MWD that may exist between wheat genotypes can theoretically result from modification of the ratio between monomeric proteins and polymeric proteins (gliadin to glutenin ratio) but also from modification of size distribution of polymeric proteins alone [42] determined by quantification of the non-extractable polymeric protein (UPP) and/or by analysis of the glutenin fraction using A4F.
In our study, whatever the wheat genotype studied, the gliadin/glutenin ratio (also called the prolamin polymerization index) was herein characterized by high values (i.e., >1.2–1.3) (Table 2). Indeed, this ratio varied between 1.38 and 1.89 for TAL AMARA 2 and KATILA, respectively, with a general mean value of 1.72. TAL AMARA 2 is the only wheat genotype that differentiates statistically (p = 0.05) with an average value of 1.38. At the same time, UPP contents were quite comparable between genotypes, with values between 41.35% and 46.70% for TAL AMARA 2 and SHAM 8, respectively. On average (i.e., 45.00%), these high values corresponded to highly aggregated/polymerized glutenin contents.
Table 3 presents the macromolecular features (Mn, Mw, Rz, and Rh) of polymeric prolamins of the wheat grains. As can be seen from the calculation of the polydispersity index (Ip = Mw/Mn), all the polymeric fractions present in the different wheat grains were characterized by a high heterogeneity (i.e., Ip > 5.0). Indeed, the values collected varied between 6.96 and 9.41 for TAL AMARA 2 and SHAM 8, respectively. The genotypes studied differed significantly (p = 0.05) in two statistically distinct groups.
The number-average molar mass (Mn) and the weight-average molar mass (Mw) respectively varied from 0.55 × 10⁶ g/mol to 0.61 × 10⁶ g/mol, and from 3.92 × 10⁶ g/mol to 5.13 × 10⁶ g/mol. These two macromolecular features allowed us to discriminate some genotypes studied (mainly SHAM8 and TAL AMARA 2), with the calculated average molecular weights being characteristic of highly polymerized/aggregated prolamins, thus confirming the results obtained previously by quantifying the UPP fraction. In the same way, radius of gyration Rz and hydrodynamic radius Rh respectively ranged from 85.70 nm to 94.16 nm and from 8.01 nm to 8.23 nm.

3.3. Composition and Content of Glutenin Subunits of Wheat Grains

Table 4 shows, for the first time to our knowledge, the high molecular weight glutenin subunits (HMW-GS) composition of the polymeric prolamins of each of the selected genotypes and the HMW-GS/LMW-GS (Low molecular weight glutenin subunits) ratio.
As can be seen from the results, the majority of the protein samples (i.e., SHAM 8, TAL AMARA 2, and ACSAD 1133) had the same composition in HMW-GS, namely, the allelic combination Glu-A1: 2*, Glu-B1: 7 + 9, and Glu-D1: 5 + 10, with rather similar relative concentrations except for the HMW-GS 9 and 2*, for which the proportions varied significantly for SHAM 8 and TAL AMARA 2 vs. ACSAD 1133 (13.77% and 13.71% vs. 18.67% for the HMW-GS 9 and 12.41% vs. 4.59% for the HMW-GS 2*). The only genotype characterized by a different HMW-GS composition corresponded to KATILA with the allelic combination Glu-A1: 1, Glu-B1: 7 + 9, and Glu-D1: 5 + 10. In addition, the polymeric prolamins of the various wheat genotypes can be characterized by their HMW-GS/LMW-GS ratios. Although these ratios were fairly close statistically (p = 0.05), some genotypes had quite different ratios despite the same allelic combination. Thus, TAL AMARA 2 and ACSAD 1133, which have the allelic combination (Glu-A1: 2*, Glu-B1: 7 + 9, and Glu-D1: 5 + 10), were found to be characterized by HMW-GS/LMW-GS ratios of 0.23 and 0.26, respectively.
The interactions that may exist between polymeric proteins were strongly related to the nature of the HMW-GS (especially HMW-GS pair 5 + 10 vs. HMW-GS pair 2 + 12 coded by Glu-D1) and the HMW-GS/LMW-GS ratio [41]. Thus, any modification of HMW-GS composition within the polymeric prolamins will cause a modification of the MWD of these polymers. As seen in SHAM and TAL AMARA 2, for the same allelic combination of HMW-GS, any improvement in the HMW-GS/LMW-GS ratio (Table 4) resulted in an increase in the weight-average molecular weight (Mw) (Table 3) and vice versa.

3.4. Starch Content of Wheat Grains and Their Molecular Weight Distribution

Starch consists of two structurally different polymers: (i) amylose (AML), a linear polymer of (1,4) α-linked glucose units, and (ii) amylopectin (AMP), a highly branched structure of glucose units with (1,6) and (1,4) α-linkages [43]. Amylopectin and amylose are present in a ratio of about 3:1 in most plant starches, and analysis of the mature grains in our study showed about 34.22% amylose (Table 5). Our results can be considered important; however, this quantification is very dependent on the methodology used. As has already been demonstrated [32], the separation and quantification of starch polymers by A4F makes it possible to obtain more reliable and reproducible results. In any case, this content seems very stable (i.e., no significant differences between the different genotypes during the two years of culture).
The two constituent polymers of starch (AML and AMP) can be characterized by different macromolecular features (Mn, Mw, and Rz). As shown by the results of these measurements (Table 5), the amylopectin polymers (AMP), which were the most abundant polymers, were characterized by very high molecular weights: 16.1 × 10⁶ g/mol and 58.8 × 10⁶ g/mol for Mn the Mw, respectively.
For the same AMP content, TAL AMARA 2 was the only genotype to differ in having significantly higher molecular weights than the other three genotypes studied (i.e., 24.0 × 10⁶ g/mol and 66.2 × 10⁶ g/mol for Mn and Mw, respectively). At the same time, amylose polymers (AML) were characterized by more limited molecular weights: 0.66 × 10⁶ g/mol and 0.33 × 10⁶ g/mol for Mn and Mw, respectively. As in the previous case, for the same AML content, TAL AMARA 2 was the only genotype to differ in having significantly higher molecular weights than the other three genotypes studied (i.e., 0.80 × 10⁶ g/mol and 0.37 × 10⁶ g/mol for Mn and Mw, respectively).
For macromolecular assemblies such as starch polymers, the shape or the branching rate was most reliably determined from the slope V of the log–log plot of Rz vs. Mw. The calculated values of V for the AMP polymers (≈0.32) corresponded to branched macromolecular assemblies. As can be seen from the results presented in Table 5 even if the calculated data for V were close, TAL AMARA 2 differentiated significantly (p = 0.05) from the other wheat genotypes retained, with a value of V = 0.29. Thus, under the conditions of our study, for a quantity of stable AMP comparable to that of the other genotypes (i.e., no statistical difference in AMP%), TAL AMARA 2 presented polymers of AMP whose branching rate was higher (i.e., significant decrease of V).

3.5. Starch Granule Distribution

Starch presents as granules in the wheat grain endosperm. These granules have been reported to have trimodal size distributions [44]. The biosynthesis of the A-type starch granules (generally with diameters > 10 nm) begins in the first days of endosperm formation. The formation of B-type starch granules (with diameters < 10 nm) starts from about 10 DAA. Finally, the synthesis of C-type starch granules (less than 5 nm) initiates from approximately 21 DAA [45].
Table 5 shows the distribution of starch granules in the grains of the four wheat genotypes studied. As shown in our results, A-type were present in a very large majority (76.3%), and B-type and C-type represented 18.8% and 4.0%, respectively. Our observations were in total agreement with previous results obtained from the majority of common wheat genotypes. Under the physiological conditions of our study (i.e., “limiting” conditions, §3.1), certain genotypes differed statistically (p = 0.05). Thus, SHAM 8 was characterized by a population of granules poorer in A-type starch granules (72.8% vs. 76.3% on average) and richer in B-type starch granules (22.8% vs. 18.8% on average). Conversely, KATILA was characterized by a starch granule distribution with a large majority of A-type starch granules (79.2% vs. 76.3% on average) and a lower proportion in B-type starch granules (16.8% vs. 18.8% on average).
The modifications of the size and/or the number of the different types of starch granules in grains can be a characteristic of wheat genotype studied, or it can be caused by the modification of environmental conditions (particularly growth temperature) during the grain-filling period. The volume percentage of A-type and B-type starch granules can be modified when growth temperature increases from about 15 to 40 °C during the grain storage accumulation period [46]. These environmental effects could induce changes in the grain-filling pattern of starch granules (A- and B-type granules specifically). A-type granules are formed in the amyloplast from approximately 5 DAA and continue to grow until achieving a maximum diameter at physiological maturity [43]. However, the final number of A-amyloplasts is reached at about 7 DAA, coinciding with the cessation of cell division. On the other hand, B-type granules are initiated at about 11 DAA and continue to increase until 21 DAA, and up to a maximum diameter at maturity (35 DAA). Therefore, considering the behavior of type A and type B granules, we argue that any increase in temperature during the cell enlargement phase could induce a reduction in the activity of starch synthase but also a reduction in the grain filling phase (Figure 1 and Table 2), resulting in significant changes in the size and number of different types of starch granules in the endosperm. All of these elements must be considered because, due to their significant differences in terms of composition, molecular structure, granule swelling, gelatinization properties, and pasting/rheological behavior, proportion of the different type of starch granules (particularly A- and B-type) in flour has an impact on the properties of traditional wheat-based products [46].

4. Conclusions

Within the general framework of the implementation of a program to improve the production of local common wheat by the Lebanese State, we characterized the plant material selected for its adaptation to environmental conditions (i.e., good productivity in semi-arid conditions) by initially retaining all the biochemical components of the grains that are able to guarantee the desired processing performance (i.e., mainly baking performance).
Despite the selection of the plant material used in this study, our results demonstrate that environmental conditions induce limitations in its physiological functioning during the important phases of grain development and maturation. Thus, the post-flowering thermal constraints characteristic of semi-arid environments significantly modify the kinetics of accumulation of the major constituents of the grain by mainly limiting the grain filling time. The wheat grains thus formed were characterized by reduced TKW resulting from a deficit in starch accumulation.
At the same time, the synthesized and accumulated prolamins can be characterized by their particular molecular distributions. Whatever plant material selected, the level of polymerization/aggregation of polymeric prolamins was very high. The reduction in the amounts of synthesized and accumulated starch polysaccharides was accompanied by a significant change in the amylopectin/amylose ratio, with amylose content being greater than normal (i.e., >34%). Finally, the different genotypes studied were characterized by significantly different distributions of starch granules, with the percentage of the volume occupied by A-type and B-type starch granules varying between genotypes for the two cropping years. Here, again, we confirm with our results that the specific thermal regime during the synthesis and accumulation phases of prolamins and starch can explain the polymerization/aggregation changes of prolamins but also the modifications in the distribution of granules starch (A-type vs. B-type).
All these observations (i.e., molecular distribution of prolamins and starch, distribution of starch granules) must be considered because of their determining role for the definition of the technological aptitudes of the flours generated. These relationships between composition and rheological properties will be discussed in a future publication.

Author Contributions

All of the authors contributed significantly to the research. T.A. designed the experimental studies in collaboration with L.R.; N.S. and L.R., performed all prolamin and starch characterizations; N.S., L.R., and T.A. performed the statistical analyses; N.S., T.A., and L.R. contributed to the writing of the final manuscript. All authors have read and agreed to the published version of the manuscript.

Funding

No specific funding has been implemented for this program.

Institutional Review Board Statement

Not applicable.

Informed Consent Statement

Not applicable.

Data Availability Statement

The data presented in this study are available on request from the corresponding author.

Acknowledgments

Authors would like to thank LARI (Lebanese Agricultural Research Institute) and Taj Mills for supporting part of this research.

Conflicts of Interest

The authors declare no conflict of interest.

References

  1. Indexmundi. 2019. Available online: https://www.indexmundi.com/agriculture/?country=lb&commodity=wheat&graph (accessed on 20 February 2019).
  2. Triboi, E. Modèle d’élaboration du poids du grain chez le blé tendre (Triticum aestivum em Thell). Agronomie 1990, 10, 191–200. [Google Scholar] [CrossRef]
  3. Farooq, M.; Bramley, H.; Palta, J.A.; Siddique, K.H.M. Heat stress in wheat during reproductive and grain-filling phases. Crit. Rev. Plant Sci. 2011, 30, 491–507. [Google Scholar] [CrossRef]
  4. Satorre, E.H.; Slafer, G.A. Wheat: Ecology and Physiology of Yield Determination; Food Products Press: New York, NY, USA, 1999. [Google Scholar]
  5. Dupont, F.M.; Altenbach, S.B. Molecular and biochemical impacts of environmental factors on wheat grain development and protein synthesis. J. Cereal Sci. 2003, 38, 133–146. [Google Scholar] [CrossRef]
  6. Farooq, J.; Khaliq, I.; Mahmood, A. Evaluation of some wheat hybrids under normal and heat stress conditions. Triticeae Genom. Genet. 2015, 5, 1–11. [Google Scholar] [CrossRef]
  7. Narayanan, S.; Prasad, P.V.V.; Fritz, A.K.; Boyle, D.L.; Gill, B.S. Impact of high night-time and high daytime temperature stress on winter wheat. J. Agro. Crop Sci. 2015, 201, 206–218. [Google Scholar] [CrossRef]
  8. Asseng, S.; Ewert, F.; Martre, P.; Rötter, R.P.; Lobell, D.B.; Cammarano, D.; Kimball, B.A.; Ottman, M.J.; Wall, G.W.; White, J.W.; et al. Rising temperatures reduce global wheat production. Nat. Clim. Chang. 2015, 5, 143–147. [Google Scholar] [CrossRef]
  9. Finney, K.F.; Barmore, M.A. Loaf volume and protein content of hard winter and spring wheats. Cereal Chem. 1948, 25, 291–312. [Google Scholar]
  10. Schofield, J.D. Wheat proteins: Structure and functionality in milling and breadmaking. In Wheat Production, Properties and Quality; Bushuk, W., Rasper, V.F., Eds.; Chapman & Hall: London, UK, 1994; pp. 72–106. [Google Scholar]
  11. Shewry, P.R.; Halford, N.G.; Belton, P.S. The structure and properties of gluten: An elastic protein from wheat grain. Philos. Trans. R. Soc. B 2002, 357, 133–142. [Google Scholar] [CrossRef]
  12. Shewry, P.R.; Tatham, A.S.; Barro, F.; Barcelo, P.; Lazzeri, P. Biotechnology of breadmaking: Unraveling and manipulating the multi-protein gluten complex. Nat. Biotechnol. 1995, 13, 1185–1190. [Google Scholar] [CrossRef] [PubMed]
  13. Keck, B.; Köhler, P.; Wieser, H. Disulphide bonds in wheat gluten: Cystine peptides derived from gluten proteins following peptic and thermolytic digestion. Z. Lebensm. Unters. Forsch. 1995, 200, 432–439. [Google Scholar] [CrossRef]
  14. D’Ovidio, R.; Masci, S. The low-molecular-weight glutenin subunits of wheat gluten. J. Cereal Sci. 2004, 39, 321–339. [Google Scholar] [CrossRef]
  15. Tatham, A.S.; Shewry, P.R. The conformation of wheat gluten proteins. The secondary structures and thermal stabilities of α-, β, γ and ω-Gliadins. J. Cereal Sci. 1995, 3, 103–113. [Google Scholar] [CrossRef]
  16. Bietz, J.A.; Huebner, F.R. Structure of glutenin: Achievements at the Northern Regional Research Center. Ann. Technol. Agric. 1980, 29, 249–277. [Google Scholar]
  17. Lemelin, E.; Branlard, G.; Salvo, L.; Lein, V.; Aussenac, T.; Daydé, J. Breadmaking stability of wheat flours: Relation between mixing properties and molecular weight distribution of polymeric glutenins. J. Cereal Sci. 2005, 42, 317–326. [Google Scholar] [CrossRef]
  18. Barrera, G.; Pérez, G.; Ribotta, P.; León, A. Influence of Damaged Starch on Cookie and Bread-making Quality. Eur. Food Res. Technol. 2007, 225, 1–7. [Google Scholar] [CrossRef]
  19. Dodds, N.J.H. Damaged Starch Determination in Wheat Flours in Relation to Dough Water Absorption. Starch Stärke 1971, 23, 23–27. [Google Scholar] [CrossRef]
  20. Ghodke, S.K.; Ananthanarayan, L.; Rodrigues, L. Use of Response Surface Methodology to Investigate the Effects of Milling Conditions on Damaged Starch, Dough Stickiness and Chapatti Quality. Food Chem. 2009, 112, 1010–1015. [Google Scholar] [CrossRef]
  21. Kaletunc, G.; Breslauer, K.J. Characterization of Cereals and Flours: Properties, Analysis and Applications; Marcel Dekker, Inc.: New York, NY, USA, 2003; p. 496. [Google Scholar]
  22. Hug-Iten, S.; Handschin, S.; Conde-Petit, B.; Escher, F. Changes in Starch Microstructure on Baking and Staling of Wheat Bread. LWT Food Sci. Technol. 1999, 32, 255–260. [Google Scholar] [CrossRef]
  23. Massaux, C.; Bodson, B.; Lenartz, J.; Sindic, M.; Sinnaeve, G.; Dardenne, P.; Falisse, A.; Deroanne, C. L’amidon Natif du Grain de blé: Un Composé Naturel à Valoriser Par la Connaissance de ses Propriétés Techno-Fonctionnelles; Livre blanc « céréales »; F.U.S.A et CRAW: Gembloux, Belgium, 2006. [Google Scholar]
  24. Hoseney, R.C.; Finney, K.F.; Pomeranz, Y.; Shogren, M.D. Functional (breadmaking) and biochemical properties of wheat flour components. VIII. Starch. Cereal Chem. 1971, 48, 191–201. [Google Scholar]
  25. Sakr, N.; Rhazi, L.; Aussenac, T. Bread wheat quality under limiting environmental conditions: II—Rheological properties of Lebanese wheat genotypes. J. Saudi Soc. Agric. Sci. 2021, in press. [Google Scholar] [CrossRef]
  26. Baum, M.; Tadesse, W.; Nachit, M.; Abdalla, O.; Rajaram, S.; Singh, R.; Payne, T.; Ammar, K.; Morgounov, A.; Braun, H. Global Crop Improvement Networks to Bridge Technology Gaps. In Advances in Wheat Genetics: From Genome to Field; Ogihara, Y., Takumi, S., Handa, H., Eds.; Springer: Tokyo, Japan, 2015; pp. 387–399. [Google Scholar]
  27. Fellahi, Z.; Hannachi, A.; Ferras, K.; Oulmi, A.; Boutalbi, W.; Bouzerzour, H.; Benmahammed, A. Analysis of the phenotypic variability of twenty f 3 biparental populations of bread wheat (Triticum aestivum L.) evaluated under semi-arid environment. J. Fundam. Appl. Sci. 2017, 9, 102–118. [Google Scholar] [CrossRef] [Green Version]
  28. AACC. (76.13.01) Approved Methods of the American Association of Cereal Chemists, 10th ed.; AACC: St. Paul, MN, USA, 2000. [Google Scholar]
  29. Hajas, L.; Scherf, K.A.; Török, K.; Bugyi, Z.; Schall, E.; Poms, R.E.; Koehler, P.; Tömösközi, S. Variation in protein composition among wheat (Triticum aestivum L.) cultivars to identify cultivars suitable as reference material for wheat gluten analysis. Food Chem. 2018, 267, 387–394. [Google Scholar] [CrossRef]
  30. Rhazi, L.; Bodard, A.-L.; Fathollahi, B.; Aussenac, T. High throughput microchip-based separation and quantitation of high-molecular-weight glutenin subunits. J. Cereal Sci. 2009, 49, 272–277. [Google Scholar] [CrossRef]
  31. Bancel, E.; Rogniaux, H.; Debiton, C.; Chambon, C.; Branlard, G. Extraction and proteome analysis of starch granule-associated proteins in mature wheat kernel (Triticum aestivum L.). J. Proteome Res. 2010, 9, 3299–3310. [Google Scholar] [CrossRef]
  32. Chiaramonte, E.; Rhazi, L.; Aussenac, T.; Richard White, D., Jr. Amylose and amylopectin in starch by asymmetric flow field-flow fractionation with multi-angle light scattering and refractive index detection (AF4-MALS-RI). J. Cereal Sci. 2012, 56, 457–463. [Google Scholar] [CrossRef]
  33. Cook, B.I.; Anchukaitis, K.J.; Touchan, R.; Meko, D.M.; Cook, E.R. Spatiotemporal drought variability in the Mediterranean over the last 900 years. J. Geophys. Res. Atmos. 2016, 121, 2060–2074. [Google Scholar] [CrossRef]
  34. Carceller, J.L.; Aussenac, T. Accumulation and changes in molecular size distribution of polymeric proteins in developing grains of hexaploid wheats: Role of the desiccation phase. Aust. J. Plant Physiol. 1999, 26, 301–310. [Google Scholar] [CrossRef]
  35. El-Kareem, T.H.A.A.; El-Saidy, A.E. Evaluation of yield and grain quality of some bread wheat genotypes under normal irrigation and drought stress conditions in calcareous soils. J. Biol. Sci. 2011, 11, 156–164. [Google Scholar]
  36. Jenner, C. Starch Synthesis in the Kernel of Wheat under High Temperature Conditions. Aust. J. Plant Physiol. 1994, 21, 791. [Google Scholar] [CrossRef]
  37. Branlard, G.; Lesage, V.S.; Bancel, E.; Martre, P.; Méleard, B.; Rhazi, L. Coping with wheat quality in a changing environment: Proteomics evidence for stress caused by environmental changes. In Advances in Wheat Genetics: From Genome to Field; Ogihara, Y., Takumi, S., Handa, H., Eds.; Springer: Tokyo, Japan, 2015; pp. 255–264. [Google Scholar]
  38. Graybosch, R.A.; Peterson, C.J.; Baenziger, P.S.; Shelton, D.R. Environmental modification of hard red winter wheat flour protein composition. J. Cereal Sci. 1995, 22, 45–51. [Google Scholar] [CrossRef] [Green Version]
  39. Williams, R.M.; O’Brien, L.; Eagles, H.A.; Solah, V.A.; Jayasena, V. The influences of genotype, environment, and genotype × environment interaction on wheat quality. Aust. J. Agric. Res. 2008, 59, 95. [Google Scholar] [CrossRef]
  40. Aussenac, T.; Rhazi, L. Storage Proteins Accumulation and Aggregation in Developing Wheat Grains. In Global Wheat Production; Fahad, S., Basir, A., Adnan, M., Eds.; IntechOpen: London, UK, 2018; pp. 134–163. [Google Scholar]
  41. Southan, M.; MacRitchie, F. Molecular Weight Distribution of Wheat Proteins. Cereal Chem. 1999, 76, 827–836. [Google Scholar] [CrossRef]
  42. MacRitchie, F.; Lafiandra, D. Structure-fonction relationships of wheat proteins. In Food Proteins and Their Applications; CRC Press: New York, NY, USA, 1997; pp. 293–323. [Google Scholar]
  43. Stone, B.; Morell, M.K. Carbohydrates. In Wheat: Chemistry and Technology; Khan, K., Shewry, P.R., Eds.; AACC: St. Paul, MN, USA, 2009; pp. 299–362. [Google Scholar]
  44. Bechtel, D.B.; Zargas, I.; Kaliekau, L.; Pomeranz, Y. Size distribution of wheat starch granules during endosperm development. Cereal Chem. 1990, 67, 59–63. [Google Scholar]
  45. Shi, Y.C.; Seib, P.A.; Bernardin, J.E. Effects of temperature during grain-filling on starches from six wheat cultivars. Cereal Chem. 1994, 71, 369–383. [Google Scholar]
  46. Park, S.-H.; Chung, O.K.; Seib, P.A. Effects of varying weight ratios of large and small wheat starch granules on experimental straight-dough bread. Cereal Chem. 2005, 82, 166–172. [Google Scholar] [CrossRef]
Figure 1. Grain filling period for the four different wheat genotypes. ΣDD (sum of degree day) for 2015 (■) and for 2016 (□); grain filling period length for 2015 (—) and for 2016 (…). DAA-days after anthesis.
Agriculture 11 00289 g001
Figure 2. Temperatures (a,b) and precipitations (c) for the two cropping seasons (2015/2016 (■); 2016/2017 (□)). (a) Monthly minimum temperatures; (b) monthly maximum temperatures. Historical averages (1954–2010) (dotted lines).
Agriculture 11 00289 g002
Table 1. Parentage and pedigree of the bread wheat genotypes studied.
Wheat GenotypesLine/Pedigree Source
SHAM 8KAUZ = JUP/BJY/URES/CM67458 (ICARDA, 2015)
TAL AMARA 2Belikh/Gediz/Bit/ACS-D-7284-22 IZ-17-IZ-4 IZ-OIZ (ACSAD, 2015)
KATILAKAUZ/ATTILA/CMSS93Y0066S-5AP-2AP-6AP-0APS-0AP (ICARDA, 2015)
ACSAD 1133Snb›s›//shi4414/crow›s›/3/Mon›s›/crows›s›/ACS-W-9678 (2001)-23IZ-2IZ-0IZ (ACSAD, 2015)
ICARDA—International Center for Agricultural Research in the Dry Areas, ACSAD—the Arab Center for the Studies of Arid Zones and Drylands.
Table 2. General characteristics of wheat grains harvested.
GenotypeTKW (g)Protein Content (3)Starch Content (3)ProlaminUPP Content (4)
Glutenin Content (3)Gliadin Content (3)Gliadin/Glutenin
SHAM 821.42 a (1)16.96 a57.86 b30.69 a55.18 b1.82 a46.70 a
TAL AMARA 225.85 b17.58 b54.34 a36.51 b50.19 a1.38 b41.35 b
KATILA24.85 b17.46 b54.31 a29.92 a55.42 b1.89 a44.74 a
ACSAD 113325.96 b18.14 c54.13 a31.25 a55.47 b1.79 a46.40 a
Mean (2)24.5217.5355.1632.0954.061.7245.00
CV (%)8.672.763.279.334.7913.465.48
2015 mean25.6920.2953.3732.5453.731.7046.50
2016 mean23.3514.7856.7531.6454.401.7343.10
(1) Multiple mean comparisons were made using Tukey’s test (HSD—honestly significant difference) and different letters indicate a statistically difference (p < 0.05). (2) Mean values of two consecutive cultivation years and three blocks. (3) Protein and starch content in g/100 g DM. (4) UPP (%) = [unextractable glutenin/total glutenin] × 100. TKW—thousand kernels weight, UPP—Unextractable polymeric proteins.
Table 3. Macromolecular features of polymeric prolamins of wheat grains harvested.
GenotypeMn (1)
(×106 g/mol)
Mw (1)
(×106 g/mol)
Ip (1)Rz (nm) (2)Rh (nm) (2)
SHAM 80.55 c (3)5.13 a9.41 a94.16 a8.06 a
TAL AMARA 20.58 b3.92 c6.96 b87.74 b8.21 a
KATILA0.61 a4.47 b7.40 b88.18 b8.23 a
ACSAD 11330.56 bc4.17 bc7.30 b85.70 b8.01 a
Mean (4)0.584.427.7792.958.13
CV (%)4.6011.8114.274.091.32
(1) Mn: molecular weight number-average, Mw: molecular weight weight-average, Ip: polydispersity index (Mw/Mn); (2) Rz: radii of gyration, and Rh: hydrodynamic radii of gyration; (3) multiple mean comparisons made using Tukey’s test (HSD) and different letters indicate a statistically difference (p < 0.05); (4) mean values of two consecutive years and three blocks.
Table 4. Composition and content of glutenin subunits of wheat grains harvested.
GenotypeHMW/LMW HMW-GS (%) (1)
910712*5
SHAM 80.25 a (2)13.77 a16.95 ab29.24 a-12.41 b27.63 a
TAL AMARA 20.23 a13.71 a17.30 ab29.38 a-12.41 b27.03 a
KATILA0.25 a11.92 a18.87 b31.25 a13.62-24.33 a
ACSAD 11330.26 a18.67 b15.84 a31.05 a-4.59 a27.54 a
Mean (3)0.2514.5217.2430.23-9.8626.63
CV (%)4.1119.957.273.53-46.315.85
(1) Glutenin subunit content: relative percentage expressed in relation to the total content of HMW-GS (high molecular weight glutenin subunits); (2) multiple mean comparisons made using Tukey’s test (HSD) and different letters indicate a statistically difference (p < 0.05); (3) mean values of two consecutive years and three blocks. LMW—low molecular weight.
Table 5. Composition and macromolecular features of starchy fraction of wheat grains harvested and distribution of corresponding starch granules.
GenotypeAmylopectin (AMP)Amylose (AML)Starch Granules
Mn (1)Mw (1)Rz (1)V(1)AMP Content
(%)
Mn (1)Mw (1)Rz (1)AML Content
(%)
A-Type
(%)
B-Type
(%)
C-Type
(%)
SHAM 812.7 a (2)55.3 a134.4 a0.33 b66.0 a0.61 a0.33 b69.3 b34.2 a72.8 a22.8 c3.9 b
TALAMARA 224.0 b66.2 b139.3 a0.29 a66.6 a0.80 b0.37 c72.7 b33.4 a76.5 b17.3 a4.7 c
KATILA14.8 a59.5 a140.3 a0.32 ab65.0 a0.61 a0.31 ab70.5 b34.5 a79.2 c16.8 a3.3 a
ACSAD 113313.0 a54.3 a140.6 a0.33 b65.3 a0.60 a0.29 a58.9 a34.7 a76.7 b18.4 b4.2 b
Mean (3)16.158.8138.60.3265.70.660.3367.834.276.318.84.0
CV (%)33.09.22.16.71.114.410.49.01.63.514.613.9
(1) Mn = molecular weight number-average (×106 g/mol), Mw = molecular weight-average (×106 g/mol), Rz = radii of gyration (nm), V = slope of the log–log plot of Rz vs. Mw; (2) multiple mean comparisons made using Tukey’s test (HSD) and different letters indicate a statistically difference (p < 0.05); (3) mean values of two consecutive years and three blocks.
Publisher’s Note: MDPI stays neutral with regard to jurisdictional claims in published maps and institutional affiliations.

