Article

Multi-Feature Patch-Based Segmentation Technique in the Gray-Centered RGB Color Space for Improved Apple Target Recognition

1
College of Mechanical and Electronic Engineering, Northwest A&F University, Yangling 712100, China
2
School of Computer Science and Technology, Baoji University of Arts and Science, Baoji 721016, China
3
Shannxi Key Laboratory of Apple, Yangling 712100, China
4
Apple Mechanized Research Base, Yangling 712100, China
5
State Key Laboratory of Soil Erosion and Dryland Farming on Loess Plateau, Yangling 712100, China
*
Author to whom correspondence should be addressed.
Agriculture 2021, 11(3), 273; https://doi.org/10.3390/agriculture11030273
Submission received: 20 February 2021 / Revised: 16 March 2021 / Accepted: 18 March 2021 / Published: 22 March 2021
(This article belongs to the Special Issue Image Analysis Techniques in Agriculture)

Abstract

:
In the vision system of apple-picking robots, the main challenge is to rapidly and accurately identify the apple targets with varying halation and shadows on their surfaces. To solve this problem, this study proposes a novel, multi-feature, patch-based apple image segmentation technique using the gray-centered red-green-blue (RGB) color space. The developed method presents a multi-feature selection process, which eliminates the effect of halation and shadows in apple images. By exploring all the features of the image, including halation and shadows, in the gray-centered RGB color space, the proposed algorithm, which is a generalization of K-means clustering algorithm, provides an efficient target segmentation result. The proposed method is tested on 240 apple images. It offered an average accuracy rate of 98.79%, a recall rate of 99.91%, an F1 measure of 99.35%, a false positive rate of 0.04%, and a false negative rate of 1.18%. Compared with the classical segmentation methods and conventional clustering algorithms, as well as the popular deep-learning segmentation algorithms, the proposed method can perform with high efficiency and accuracy to guide robotic harvesting.

Graphical Abstract

1. Introduction

With agricultural production developing toward large-scale, intensive, and precise processes to realize intelligence, demand for intelligent automation of agricultural equipment has been increasing rapidly [1,2,3]. Apples, one of the major fruits in the world, are still picked manually owing to the complex environment of the orchards. To decrease the cost of labor, agricultural production activities must shift from being labor-intensive to technology-intensive [4]. Agricultural fruit-picking equipment based on artificial technology play an important role in accelerating and promoting agricultural modernization [5,6].
The picking robot includes vision and control systems. The main function of the vision system is to accurately identify the target fruit and provide information for motion control [7,8]. However, under the complex natural environment, orchards experience constantly changing weak and strong illumination conditions [9,10]. Depending on the intensity of illumination, different degrees of shadows are formed on the surface of the apples, because of the occlusion caused by fruit branches and leaves as well as clusters of neighboring fruits. Thus, non-uniform halation and shadows are special kind of noise in the images acquired by the vision system, and they cause the loss of information regarding the location of apples in the images, thereby increasing the difficulty of recognition and segmentation [11]. How to effectively and accurately remove or weaken the effect of halation and shadows is one of the key issues of the vision system of agricultural harvesting robots; this topic has received extensive research attention [12].
In the vision system of existing apple-harvesting robots, the effect of illumination on the target is reduced by using specific transformation or enhancement algorithms after image acquisition. Algorithms for image de-lighting and shadow segmentation have also been proposed. Song et al. [13] proposed the method of mixing the illumination-invariant image with the red component extracted from the original image to eliminate the effect of illumination. Huang and He [14] segmented apple targets and the background using the fuzzy 2-partition entropy algorithm in the Lab color space and used the exhaustive search algorithm to determine the optimal threshold for image segmentation. Song et al. [15] used the illumination-invariant image principle to obtain the illumination-invariant image of the shadowed image of the apple. They then extracted the red component information of the original image, added it to the illumination-invariant image, and performed adaptive threshold segmentation on the resulting image to remove shadows. Lü et al. [16] proposed Red-Green (R-G) color feature method in which the main colors are separated to reconstruct the image and the apple target is obtained through threshold segmentation with the original image. Lv et al. [17] extracted the main colors of the image, then the image was reconstructed with the main colors, the reconstructed and original images were subtracted and denoised to realize the extraction of the highlighted region of fruits, the complete fruit target region was obtained by combining the two extracted regions. This method reduced the effect of illumination on apple recognition to a certain extent. However, for varying intensity of halation and degree of shadows on the apple surface, the accuracy of the recognition results is low.
To improve recognition accuracy, Wu et al. [18] proposed combining color and 3D geometric features for fruit point cloud segmentation. In this method, the local descriptor was applied to obtain the candidate regions, and the global descriptor was used to obtain the final segmented results. Sun et al. [19] proposed an improved visual attention mechanism named the GrabCut model, combined it with the Normalized cut (Ncut) algorithm to identify green apples in the orchard with varying illumination, and achieved good segmentation accuracy. Suh et al. [20] proposed a multi-threshold color space conversion algorithm to detect and remove shadows on ground vegetation by illumination, thus improving the accuracy of target recognition. However, the images were processed in a pixel-wise manner, and the inherent spatial information between pixels was ignored. When there is extremely strong illumination and shadow, the recognition accuracy is low, which presents new challenges for the application of the algorithm under the natural orchard environment.
A superpixel segmentation algorithm fully considers the spatial relationship between adjacent pixels. Liu et al. [21] divided the entire image into several superpixel units, then extracted the color and texture features of the superpixels, and used a support vector machine algorithm to classify the superpixels and segment the target apples. However, the execution speed of this method is low. Xu et al. [22] combined group pixels and edge probability maps to generate an image of the apple with superpixel blocks. They removed the effect of shadows by re-illuminating. This method can effectively remove the shadows from the apple’s surface in the image. However, the divided superpixels will eventually affect the segmentation accuracy. Xie et al. [23] proposed sparse representation and dictionary-learning methods for the classification of hyperspectral images by using the pixel blocks to improve the classification accuracy of the images. However, dictionary learning is used to represent images with complex structures, and the learning process is time-consuming and labor-intensive.
Recently, the deep convolutional neural networks (DCNNs) have dominated many fields of computer vision, such as image recognition [24] and object detection [25]. The DCNNs have also dominated the field of image semantic segmentation, such as fully convolutional network (FCN) [26]. An improved deep neural network DaSNet-v2, which can perform detection and instance segmentation on fruits [27]. However, these methods require large, labelled training data sets and a lot of computing power before a reliable result can be calculated. Therefore, new segmentation methods in the color space based on the apple’s characteristics are needed, so that the apples can be identified in real-time in the natural environment of the orchard.
This paper aims to effectively use the characteristic information of the apple’s color to help the picking robot recognize the target. For this purpose, we propose a multi-feature patch-based segmentation technique to segment the apple image in the gray-centered red, green, blue (RGB) color space. Cluster vectors that are not affected by illumination and shadows in the RGB color space are explored and then quaternions are used to decompose the apple image vertically along these vectors, thus obtaining feature maps.

2. Materials and Methods

2.1. Apple Image Acquisition

The variety of apple tested in this study was ‘Fuji’, which is the most popular variety in China. For image acquisition, a PowerShot G16 camera (Canon, Tokyo, Japan) was used to capture the images of apples. The fruit used for imaging were randomly selected from the apple orchards during cloudy and sunny weather conditions, and the images of apples were obtained under natural daylight conditions (08:00–17:00) during sunny days. A total of 300 images were obtained manually in the Baishui Apple experimental demonstration station of Northwest A & F University (109°16′ E, 35°4′ N). They were saved in JPEG format as 24-bit RGB color images. For the dataset, we considered those images with a shooting distance of 30–50 cm. In addition, the shooting angle with the fruit was adjusted to obtain images under different illumination and background conditions. Thus, three types of images were obtained: (1) 80 images having shadows on the apples at varying degrees. (2) 80 images having illumination at varying degrees (existing with the edge of the apple or the inside of the apple), and (3) 80 images had both shadows and illumination at varying degrees. The image resolution was 4000 × 3000 pixels (approximately 12 Megapixels).
The images were processed and analyzed using a computer with an Intel (R) Core (TM) i9-9880H, 2.70 GHz CPU, and equipped with 8 G random access memory. The proposed algorithms were simulated using MATLAB R2018b (The MathWorks Inc., Natick, MA, USA).

2.2. Vector Decomposition in Gray-Centered RGB Color Space

2.2.1. Gray-Centered RGB Color Space

Herein, we use the gray-centered RGB color space, with the origin of the RGB color space placed at the center of the color cube [28]. For 24-bit color images, the translation is achieved by simply subtracting (127.5, 127.5, 127.5) from each pixel value in the RGB space. As a result, all pixels along the same direction from mid-gray have the same hue [29]. This translation operation effectively moves all the pixels on the apple image by half the distance from their own pixels in the RGB color space, forming a new coordinate system with medium gray as the origin, as shown in Figure 1.

2.2.2. Vector Decomposition

A quaternion algebra is a mathematical tool to realize the reconstruction of a three-dimensional color image signal [30]. The quaternion-based method imitates human perception of the visual environment and processes RGB channel information in parallel [31].
A quaternion has four parts and can be written as q = a + i b + j c + k d , where a , b , c , d , and i , j , and k satisfy the condition i 2 = j 2 = k 2 = 1 . For the apple image, the RGB color triple is represented as a purely imaginary quaternion and can be written as U = R i + G j + B k [32,33,34].
Assuming that two pure quaternions P and Q are multiplied together as shown in Equation (1).
P Q = P 1 i + P 2 j + P 3 k Q 1 i + Q 2 j + Q 3 k = P 1 Q 1 P 2 Q 2 P 3 Q 3 + P 2 Q 3 P 3 Q 2 i + - P 1 Q 3 + P 3 Q 1 j + P 1 Q 2 P 2 Q 1 k = P Q + P × Q
where P and Q are two pure quaternions and i , j , and k is a set of bases.
If Q = v is a unit pure quaternion, P can be decomposed into parallel and perpendicular components about v as shown in Equation (2)
P v = P v = P cos θ P v = P v = P cos θ
where P v , P v respectively represent the component parallel to v and the component perpendicular to v .
Let C denote the chosen Color of Interest (COI), and C = C / C is a unit pure quaternion. Given a pure quaternion U and a unit pure quaternion C , U may be decomposed into components that are parallel and perpendicular to C as shown in Equation (3):
U C = 1 2 U C U C , U C C U C = 1 2 U + C U C , U C C
where C , U is a unit pure quaternion and , imply that pure quaternion are regarded as vectors.

2.3. Multiple Shadow and Halation Feature Extraction and Fusion

2.3.1. Pixel Distribution of Apple Image in the RGB Color Space

The color information is significant and distinct feature of images that includes abundant valuable information [35]. To take advantage of this information, the distribution range of pixels in the image in each of the following four cases of the apple surface appearance is counted: no halation and no shadows; only different degrees of shadows; only different degrees of halation (at the edge or inside of the apple image); and different degrees of simultaneous halation and shadows. These pixel distribution ranges are displayed in the RGB color space, which represents all elements of the entire image (i.e., apple, background, halation, and shading), as shown in Figure 2.
The red pixels representing the important characteristics of the apple are easily visible and are significantly different from the background pixels (i.e., those of foliage, soil, and background), indicating that it is easier to segment (as shown in Figure 2a). However, shadows and halation are part of the apple itself as a special kind of noise, which makes distinguishing the apple from the complex background difficult (Figure 2b–d). To analyze the distribution range of various pixels in the above-mentioned four situations in a unified manner, the comprehensive pixel distribution area of the apple and the shadows and halation on its surface is considered as shown Figure 3. Clearly, the distribution of apple images in the RGB space roughly forms a triangle AHC. The background pixels are mainly distributed around the diagonal of the space body, and the shadow and halation pixels from the two-dimensional plane are distributed at the ends of the sides HC and AC of the triangle, respectively. It is not possible to separate the apple from the shadow and halation through one COI. Therefore, in this study, we choose different COIs according to the particularity of shadows and halation in the RGB space. For example, several COIs need to be selected along HC for shadows and along AC for halation.

2.3.2. COI Selection for Shadows and Halation

From the discussion in the previous section, the pixel distribution area of shadows and halation is known. However, the RGB color space has relatively poor uniformity, making it difficult to express the red pixels of the apple by accurate numerical values [36]. The Hue-Saturation-Value (HSV) color space is a common choice for describing colors where brightness and color can be separated. Because the HSV color space is closer to the human visual system than the RGB color space, in this study, we choose the HSV color space to describe the red pixels of apples when selecting the COI for shadows and halation [37]. The formulas for RGB to HSV conversion are given in Equation (4) [38]:
V = max R , G , B S = 1 min R , G , B / V H = 60 × G B / V min R , G , B i f V = R 120 + 60 × B R / V min R , G , B i f V = G 240 + 60 × R G / V min R , G , B i f V = B
where R, G, and B are the red, green, and blue components, respectively, of the RGB color space.
After the RGB space is converted to the HSV space, the value range describing red can be obtained, but the red of the apple is only part of the red in the HSV space. By selecting the range of red distribution on HSV space, so that this range can be consistent with the red range of apple after converting back to RGB space again, then, the distribution of apple red on RGB can be drawn by the value, as shown in Figure 4.
Figure 4 shows that the pixel distribution of the apple’s red in the RGB space obtained from the HSV space roughly forms an irregular geometric figure ADHC. The pixel distribution for background is mainly around the side HA; for halation, it is inside the triangular area AEC; and for shadows, it is inside the triangular area HDE.
In the HSV color space, when the brightness V is less than 0.15, the pixels in the area HFK lose their color information, so the black that appears is not a shadow on the surface of the apple. In Figure 4, shadow pixels in the area HFK are eliminated; as a result, the real shadow range is FKED and the halation range is AEC.
Figure 4a shows the selected ten COIs divided equally between the shadow range FKED and the halation range AEC. Figure 4b shows the resulting image after rotating the five shadow COIs centered at point H. Figure 4c shows the pixel distribution map of the vertically decomposed the image along the rotated shadow COIs. The apple (including shadows) pixel data are concentrated in the area excluding the area HFK and obviously far away from the background pixel range HA. Figure 4d also shows the vertically decomposed image after rotating five of the COIs in the halation pixel distribution range. The apple (including halation) pixel data are concentrated in the area excluding the background pixel range HA.
The apple image is decomposed in parallel and perpendicularly along the ten COIs (experiment to get the most suitable number) and ten feature maps parallel and perpendicular to the COIs are obtained, respectively. Figure 5a shows an apple image with shadows and light coexisting on the target surface. A feature map is obtained after the decomposition of the image along the COIs of the selected shadow and halation.
Figure 5b,c are the images obtained by parallel and vertical decomposition along the COI of the selected shadow, and Figure 5d,e are those obtained by parallel and vertical decomposition along the COI of the selected light. Figure 5b,d are not a grayscale image, they are still color images (RGB components are equal), reflecting the degree of color dark and light in the apple image. Figure 5c,e reflects the color information of the apple image, where in Figure 5c, the shadow is eliminated to a certain extent, but the illuminated area still exists. Thus, we consider the image obtained by vertical decomposition along the ten COIs as the apple features.

2.4. Apple Image Segmentation

2.4.1. Patch-Based Multi-Feature Segmentation Algorithm

Traditional K-means is an unsupervised learning algorithm that places each pixel into two clusters based on the Euclidean distance function [39]. However, this calculation ignores the spatial relationship between pixels in the image, leading to poor segmentation results for complex images. In particular, the local variations of apple images cannot be effectively described by a pixel-based method. Based on the pixel patches, this study proposes a multi-feature patch-based segmentation model, as shown in Equation (5):
min I i , C i j i = 1 N x Ω j w j m j R m j f j x C i j 2 I i x s . t . I . i = 1 N I i x = 1 , I i x = 0 o r 1 , i = 1 , 2 , N
where fj(x) is the jth color feature of the original apple image f(x), R m j f j x is the m j × m j patch vector, Cij is the clustering center, and I i x is the label function, whose value can be 0 or 1.
As Equation (5) shows, both color features and local contents of the apple images are considered in our model, making it robust to non-uniform illumination, shadows, and local variations in apple images.
Superscript k is used to represent the kth iteration. The iteration solving process can be divided into two steps:
First, in Equation (5), Ii is fixed and Cij is updated, and the optimization problem shown in Equation (6) needs to be solved.
min C i j i = 1 N x Ω j w j m j R m j f j x C i j 2 I i k x
By differentiating, we obtain
min C i j i = 1 N x Ω j w j m j R m j f j x C i j 2 I i k x
Next, in the second step, in Equation (5), Cij is fixed and Ii is updated, and resulting optimization problem is given by Equation (7).
min I i i = 1 N x Ω j w j m j R m j f j x C i j k + 1 2 I i x s . t . I . i = 1 N I i x = 1 , I i x = 0 o r 1 , i = 1 , 2 , N
This results in Equation (8).
I i k + 1 x = 1 , i = i min x , 0 i i min x , i min x = arg min r i k + 1 i , r i k + 1 = j w j / m j R m j f j x C i j k + 1 2 , i = 1 : N , j = 1 : 3

2.4.2. Principal Component Analysis (PCA) Dimensionality Reduction

Each apple image has three channels each of R, G, and B. In this study, the selected feature maps will increase from 10 to 30. If the patch size is m × m, the number of feature maps is i = 1 30 m i 2 . It affects not only the calculation timeliness but also the classification performance.
We use the PCA method as the dimensionality reduction processing method to compress the number of features, eliminate redundant data, and reduce the dimension of data. The PCA can maximize the information of data after the intrinsic dimensionality reduction and can determine the importance of the direction by measuring the size of the data variance in the projection direction [40]. W is defined as a matrix consisting of all feature mapping vectors in the column direction. This matrix can better retain the information in the data. The covariance matrix A can be obtained as follows:
A = 1 m 1 i = 1 m x i x ¯ x i x ¯ T
where m is the number of data participating in dimensionality reduction, xi is the specific vector expression of random data i, and x ¯ is the average vector of all data participating in dimensionality reduction.
The output of PCA is Y = WX. The optimal W is composed of the eigenvectors corresponding to the first k largest eigenvalues of the data covariance matrix as column vectors, thereby reducing the original dimension of X to k dimensions. In this study, we consider the first 6 principal components after the dimensionality reduction of feature data. At this time, the contribution rate reaches more than 96%. This method not only retains the characteristics of multi-dimensional image data, but also ensures the timeliness of model operation.

2.4.3. Halation and Shadow Image Fusion

When the surface of the apple has only shadow or only halation, the shadow COI or halation COI is used to complete the target segmentation in the apple image. In fact, in the natural environment, the distribution of shadows and halation on the surface of the apple is irregular and different degrees of lighting and shadows exist simultaneously. The result of image segmentation obtained by using only the shadow COI or halation COI is not a complete segmentation of the apple.
Figure 6 shows that there is a significant difference in the RGB value distribution between the illuminated area and the shaded area. Thus, this paper sets a B threshold (B = 93), and divides apples image in the RGB space into two areas: halation and shadow. When the B value in an apple image is greater than the threshold, the segmentation result is obtained by using the halation COI, and when the B value is less than the threshold, the segmentation is performed using the shadow COI. Finally, both results are combined to obtain a complete segmentation of the apple under the simultaneous effects of shadows and light, as shown in Figure 7.

3. Experimental and Analysis

To verify the validity and reliability of the proposed apple image segmentation method, 240 images of red ripe apple targets were selected for testing. To test the performance of the algorithm to the greatest extent, the test set consisted of the apple surface images under three conditions: varying degrees of shadow, light, and both conditions simultaneously. To quantitatively evaluate the effectiveness of segmentation by the proposed algorithm, the test results were evaluated in terms of the recall rate, precision rate, F-measure index, false positive rate (FPR), and false negative rate (FNR) [41]. These metrics are calculated as follows.
R e c a l l = T P T P + F N
P r e c i s i o n = T P T P + F P
F m e a s u r e = 2 P r e c i s i o n R e c a l l P r e c i s i o n + R e c a l l
F P R = F P F P + T N
F N R = F N T P + F N
where Truth Positives (TP) represents the number of pixels that are correctly segmented as belonging to the apple; False Negatives (FN) represents the number of pixels belonging to the apple that are incorrectly segmented as the background; False Positives (FP) represents the number of pixels belonging to the background that are incorrectly classified as those belonging to the apple; and Truth Negatives (TN) represents the number of pixels that are correctly segmented as belonging to the background.
The recall rate and precision can be used to measure the ability of the algorithm to identify the apple correctly. The F-Measure is the weighted harmonic average of precision and recall. The FPR gives the percentage of the pixels that belong to the background but are classified as the target. The FNR gives the percentage of the pixels belonging to the target but incorrectly classified as the background. The fruit area in the test images of the data set was manually marked by Labelme software, and the marked results were recorded as the ground truth [42].
Figure 8 shows the comparison of the proposed algorithm with the apple image segmentation method using Red-Blue (R-B) based K-means clustering (Method 1) [17], the fast and robust fuzzy C-means target area acquisition method (Method 2) [43], and depth Comparison of the results of the Mask Regions with Convolutional Neural Network (Mask R-CNN) image target instance segmentation method (method 3) [25] during learning. Figure 8a shows the original image in the test set (the first two are with strong shadows and weak halation, the middle two are with strong lighting and weak shadows, and the last two are with strong halation and strong shadows). Figure 8b,c show the segmentation results obtained using Methods 1 and 2. Both algorithms are based on image global information clustering and segmentation. Figure 8d shows the segmentation results obtained using Method 3, which includes a branch of prediction segmentation mask on the basis of the faster R-CNN. It completes the pixel-level segmentation of the target while achieving target detection.
The segmentation result of the R-B-based K-means clustering algorithm shows more severe loss of the target, especially in the case of strong shadows. In addition, more branches, leaves, grass and sky remain in the segmented image. The fuzzy C-means clustering based on morphological reconstruction and membership filtering increases the local spatial information and membership degree filtering in the image. The segmentation result of the mask R-CNN algorithm has a better segmentation effect on weak shadows and halation, which reduces the mis-segmentation of the background. However, the algorithm does not provide complete segmentation for strong shadows and halation. Although the mask R-CNN algorithm yields outstanding segmentation results compared with the cluster-based image segmentation methods 1 and 2, it could not retain the apple’s edge and requires a large training data. Figure 8e shows the segmentation results of the proposed algorithm. Because this method is designed according to the characteristics of the apple (including shadows and halation), it is more robust to different degrees of shadows and halation and obtains a complete target segmentation.
The results of the segmentation algorithms are compared with the ground truth pixel by pixel, and the performance is evaluated on the basis of the recall, precision, F-measure, FNR, and FPR calculated for each of these algorithms. The results of the comparison test are given in Table 1. The average recall, precision, F-measure, FPR, and FNR of the proposed algorithm were, respectively, 98.79%, 99.91%, 99.35%, 0.04%, and 1.18%. Those of the K-means clustering algorithm based on R-B (Method 1) were 74.15%, 65.31%, 69.45%, 21.07%, and 24.93%. Those of the fast and robust fuzzy C-means clustering (Method 2) were 93.25%, 96.82%, 95.00%, 1.51%, and 6.68%. Those of the mask R-CNN instance segmentation algorithm (Method 3) were 97.69%, 97.92%, 97.80%, 0.33%, and 2.25%. Therefore, the average values of the recall, precision, and F-measure of the proposed algorithm improved, respectively, by 24.64%, 34.60%, and 29.89% compared with those of Method 1; by 5.54%, 3.09%, and 4.35% compared with those of Method 2; and by 1.10%, 1.99%, and 1.55% compared with those of Method 3. In addition, the average values of the FPR and FNR decreased, respectively, by 21.03% and 23.75% compared with those of Method 1; by 1.47% and 5.50% compared with those of Method 2; and by 0.29% and 1.07% compared with those of Method 3.

4. Discussion

4.1. Location of Apple Targets

After completing the apple target identification, the apple targets need to be localized. Feng et al. [44] performed segmentation of the apple targets and realized two-dimensional localization of each apple target on the basis of the center of mass. Xiao et al. [45] proposed training of an apple color recognition model on the basis of a back propagation neural network. After recognizing the apple target in the image, the outline of the apple target is extracted using morphological operations, and a circle finally determined by the Hough transform algorithm is used to locate the apple target. Niu et al. [46] used the symmetry axis of the extracted apple target to locate the apple target. In this study, we use color prior information based on gray-centered RGB space, and by considering the local variation of the image, we perform the segmentation of apples using pixel patches. As we extract the contour of the apple target with high accuracy, to achieve the timeliness of the entire model, an algorithm for circle fitting on the contour of the apple target is implemented (the parameters of the circle are determined by summing the absolute values of the distances from the data points to the circle). Further, the center coordinates and radius of the fitted circle are used to locate the apple target. The apple target localization based on circle fitting is shown in Figure 9.

4.2. Further Research Perspectives

In recent years, deep learning has become a state-of-the-art technique for many tasks in computer vision [47]. It is trained on highly configured computers by using a large number of data labels, which are not only fast to test but also perform well and are easy to deploy and apply [48]. However, the relationship between different datasets in deep learning methods and different network architecture designs and network generalization capabilities is still being explored by a large number of researchers to find out what the essence [49,50,51]. For different data objects, such as apple images, the relationships between how much data to use, what type of data to use, and which network architecture to use will have acceptable generalization capabilities are still unclear, and their interpretability needs further research in progress.
Another mainstream approach is the model-based image segmentation method used in this paper [52]. We propose a model-based segmentation algorithm for specific images of ripe apples by studying the color features and local variations of the apple images and constructing features from the essence of the segmentation target; this approach makes the segmentation of apple images easy to explain and understand [53]. Since we have a comprehensive understanding of both the data and the underlying algorithms, tuning hyperparameters and changing the model design become simple, reasonable, and interpretable. In addition, the model-based approach is not computationally expensive as fast iteration is possible and various techniques can be implemented in less time. However, traditional image algorithms can only solve certain scenario-specific, manually definable, designable, and understandable image tasks. In addition, the model-based approach requires recalculation of the algorithm model each time a new recognition task is performed, which would lead to large consumption of computational power and data in case of complex recognition targets.
We believe that one of the important reasons for the effectiveness of deep-learning methods is that they coincide with image priors such as multi-scale, non-local, multiple-anisotropy, and non-linearity of images. The discovery of image priors plays a very important role in the field of image processing, and the effective use of new image prior information can lead to effective image representation and understanding. For many years, researchers have been working on the discovery of different image prior information [54,55]. When the apple color information is significantly different from the background, a concise and effective segmentation can be accomplished by ignoring the shape and texture information, but relying only on color information and considering local variations under the a priori assumptions of the model in this paper.
In this paper, a new class of precise prior information is provided for apple images using the model-based approach and an outstanding implementation result is obtained. Therefore, it is an attractive direction to apply this new image prior information to deep learning and further explore the model-based approach or the combination of the advantages of both approaches in order to realize further improved interpretation and generalization of deep-learning methods. As a future research direction, we will further explore the combination of model-based and deep-learning approaches under the a priori conditions considered in this paper.

5. Conclusions

To address the problem of low segmentation accuracy of apple images because of the non-uniform illumination in the natural environment of unstructured orchards, a new segmentation method was established on the basis of the characteristics of the apple images (including halation and shadows). Using this method, segmented apple images using multiple shadow (strong, weak) and halation (strong, weak) features were extracted and then merged.
The segmentation process involves the following steps: First, the pixel distribution of the apple image (with and without halation and shadows) in the RGB color space is observed. Then, the distribution areas of light and shadows are determined, multiple COIs that can cover the two areas are selected, and the image is transformed to the grayscale. Subsequently, the COIs are decomposed by quaternions in the center RGB color space, and the image obtained after vertical decomposition along the COIs is used as the feature map for segmentation.
This study proposed an efficient multi-feature patch-based segmentation algorithm, which is a generalization of the K-means clustering algorithm. To ensure real-time and effective segmentation, pixel patches of appropriate size area are selected; PCA dimensionality reduction of the selected multiple features is carried out, and the segmented images of the apple in the illuminated and shadow areas are obtained. Finally, both segmentation results are combined to obtain the complete apple area. The geometrical shape of the segmented target was well maintained, and the segmentation error was significantly reduced using the proposed patch-based segmentation algorithm.
To verify the effectiveness of segmentation, the designed segmentation method was quantitatively compared and evaluated with a classic algorithm, a modified clustering algorithm, and a deep learning algorithm. The experimental results showed that the proposed method’s recall, precision, and F-measure were higher and it’s FPR and FNR were lower than those of the other three methods.

Author Contributions

P.F. developed the experimental plan, carried out the data analysis, and wrote the text. G.L. contributed to the development of the algorithm, programming, and writing. P.G. and X.L. helped in obtaining the images of apples. B.Y. contributed to the original draft preparation. Z.L. reviewed and edited the draft. F.Y. provided significant contributions to this development as the lead. All authors have read and agreed to the published version of the manuscript.

Funding

This work was financially supported by the science and technology projects in Shaanxi Province Development and Application of key equipment for Orchard Mechanization and Intelligence (Grant No. 2020zdzx03-04-01) and the National Natural Science Foundation of China (No.61971005).

Institutional Review Board Statement

The study in the paper did not involve humans or animals.

Informed Consent Statement

The study in the paper did not involve humans or animals.

Data Availability Statement

The data presented in this study are available on request from the corresponding author.

Acknowledgments

We thank the critical comments and suggestions from the anonymous reviewers for improving the manuscript.

Conflicts of Interest

The authors declare no conflict of interest.

References

  1. He, B. Intelligent Robotics for Smart Agriculture. Adv. Robot. Mech. Eng. 2018, 1, 1–3. [Google Scholar] [CrossRef]
  2. Vasconez, J.P.; Kantor, G.A.; Cheein, F.A.A. Human-robot interaction in agriculture: A survey and current challenges. Biosyst. Eng. 2019, 179, 35–48. [Google Scholar] [CrossRef]
  3. Ropelewska, E. The Application of Machine Learning for Cultivar Discrimination of Sweet Cherry Endocarp. Agriculture 2020, 11, 6. [Google Scholar] [CrossRef]
  4. Zhuang, J.; Luo, S.; Hou, C.; Tang, Y.; He, Y.; Xue, X. Detection of orchard citrus fruits using a monocular machine vision-based method for automatic fruit picking applications. Comput. Electron. Agric. 2018, 152, 64–73. [Google Scholar] [CrossRef]
  5. Gu, Y.; Shi, G.; Liu, X.; Zhao, D. Optimization spectral clustering algorithm of apple image segmentation with noise based on space feature. Trans. Chin. Soc. Agric. Eng. 2016, 32, 159–167. [Google Scholar] [CrossRef]
  6. Silwal, A.; Davidson, J.R.; Karkee, M.; Mo, C.; Zhang, Q.; Lewis, K. Design, integration, and field evaluation of a robotic apple harvester. J. Field Robot. 2017, 34, 1140–1159. [Google Scholar] [CrossRef]
  7. Zhao, Y.; Gong, L.; Huang, Y.; Liu, C. A review of key techniques of vision-based control for harvesting robot. Comput. Electron. Agric. 2016, 127, 311–323. [Google Scholar] [CrossRef]
  8. Ostovar, A.; Ringdahl, O.; Hellström, T. Adaptive Image Thresholding of Yellow Peppers for a Harvesting Robot. Robotics 2018, 7, 11. [Google Scholar] [CrossRef] [Green Version]
  9. Sabzi, S.; Abbaspour-Gilandeh, Y.; Hernandez-Hernandez, J.L.; Azadshahraki, F.; Karimzadeh, R. The Use of the Combination of Texture, Color and Intensity Transformation Features for Segmentation in the Outdoors with Emphasis on Video Processing. Agriculture 2019, 9, 104. [Google Scholar] [CrossRef] [Green Version]
  10. Yuan, T.; Lv, L.; Zhang, F.; Fu, J.; Gao, J.; Zhang, J.; Li, W.; Zhang, C.; Zhang, W. Robust Cherry Tomatoes Detection Algorithm in Greenhouse Scene Based on SSD. Agriculture 2020, 10, 160. [Google Scholar] [CrossRef]
  11. Kang, H.; Zhou, H.; Wang, X.; Chen, C. Real-Time Fruit Recognition and Grasping Estimation for Robotic Apple Harvesting. Sensors 2020, 20, 5670. [Google Scholar] [CrossRef]
  12. Arad, B.; Kurtser, P.; Barnea, E.; Harel, B.; Edan, Y.; Ben-Shahar, O. Controlled Lighting and Illumination-Independent Target Detection for Real-Time Cost-Efficient Applications. The Case Study of Sweet Pepper Robotic Harvesting. Sensors 2019, 19, 1390. [Google Scholar] [CrossRef] [Green Version]
  13. Song, H.; Qu, W.; Wang, D.; Yu, X.; He, D. Shadow removal method of apples based on illumination invariant image. Trans. Chin. Soc. Agric. Eng. 2014, 30, 168–176. [Google Scholar] [CrossRef]
  14. Huang, L.; He, D. Apple Recognition in Natural Tree Canopy based on Fuzzy 2-partition Entropy. Int. J. Digit. Content Technol. Appl. 2013, 7, 107–115. [Google Scholar] [CrossRef]
  15. Song, H.; Zhang, W.; Zhang, X.; Zou, R. Shadow removal method of apples based on fuzzy set theory. Trans. Chin. Soc. Agric. Eng. 2014, 30, 135–141. [Google Scholar] [CrossRef]
  16. Lü, J.; Zhao, D.; Ji, W. Fast tracing recognition method of target fruit for apple harvesting robot. Nongye Jixie Xuebao/Trans. Chin. Soc. Agric. Mach. 2014, 45, 65–72. [Google Scholar] [CrossRef]
  17. Lv, J.; Wang, F.; Xu, L.; Ma, Z.; Yang, B. A segmentation method of bagged green apple image. Sci. Hortic. 2019, 246, 411–417. [Google Scholar] [CrossRef]
  18. Wu, G.; Li, B.; Zhu, Q.; Huang, M.; Guo, Y. Using color and 3D geometry features to segment fruit point cloud and improve fruit recognition accuracy. Comput. Electron. Agric. 2020, 174, 105475. [Google Scholar] [CrossRef]
  19. Sun, S.; Wu, Q.; Jiao, L.; Long, Y.; He, D.; Song, H. Recognition of green apples based on fuzzy set theory and manifold ranking algorithm. Optik 2018, 165, 395–407. [Google Scholar] [CrossRef]
  20. Suh, H.K.; Hofstee, J.W.; Van Henten, E.J. Improved vegetation segmentation with ground shadow removal using an HDR camera. Precis. Agric. 2018, 19, 218–237. [Google Scholar] [CrossRef] [Green Version]
  21. Liu, X.; Zhao, D.; Jia, W.; Ji, W.; Sun, Y. A Detection Method for Apple Fruits Based on Color and Shape Features. IEEE Access 2019, 7, 67923–67933. [Google Scholar] [CrossRef]
  22. Xu, W.; Chen, H.; Su, Q.; Ji, C.; Xu, W.; Memon, M.S.; Zhou, J. Shadow detection and removal in apple image segmentation under natural light conditions using an ultrametric contour map. Biosyst. Eng. 2019, 184, 142–154. [Google Scholar] [CrossRef]
  23. Xie, M.; Ji, Z.; Zhang, G.; Wang, T.; Sun, Q. Mutually exclusive-KSVD: Learning a discriminative dictionary for hyperspectral image classification. Neurocomputing 2018, 315, 177–189. [Google Scholar] [CrossRef]
  24. Wang, P.; Zhang, Y.; Jiang, B.; Hou, J. An maize leaf segmentation algorithm based on image repairing technology. Comput. Electron. Agric. 2020, 172, 105349. [Google Scholar] [CrossRef]
  25. He, K.; Gkioxari, G.; Dollár, P.; Girshick, R. Mask R-CNN. In Proceedings of the IEEE International Conference on Computer Vision, Venice, Italy, 22–29 October 2017; pp. 2961–2969. [Google Scholar]
  26. Long, J.; Shelhamer, E.; Darrell, T. Fully convolutional networks for semantic segmentation. In Proceedings of the IEEE Conference on Computer Vision and Pattern Recognition, Boston, MA, USA, 7–12 June 2015; pp. 3431–3440. [Google Scholar]
  27. Kang, H.; Chen, C. Fruit detection, segmentation and 3D visualisation of environments in apple orchards. Comput. Electron. Agric. 2020, 171, 105302. [Google Scholar] [CrossRef] [Green Version]
  28. Weiss, M.; Baret, F. Using 3D Point Clouds Derived from UAV RGB Imagery to Describe Vineyard 3D Macro-Structure. Remote Sens. 2017, 9, 111. [Google Scholar] [CrossRef] [Green Version]
  29. Lai, C.-W.; Lo, Y.-L.; Yur, J.-P.; Chuang, C.-H. Application of Fiber Bragg Grating Level Sensor and Fabry-Pérot Pressure Sensor to Simultaneous Measurement of Liquid Level and Specific Gravity. IEEE Sens. J. 2012, 12, 827–831. [Google Scholar] [CrossRef]
  30. Liu, X.; Chen, Y.; Peng, Z.; Wu, J. Infrared Image Super-Resolution Reconstruction Based on Quaternion and High-Order Overlapping Group Sparse Total Variation. Sensors 2019, 19, 5139. [Google Scholar] [CrossRef] [Green Version]
  31. Jia, Z.; Ng, M.K.; Song, G. Robust quaternion matrix completion with applications to image inpainting. Numer. Linear Algebra Appl. 2019, 26, 2245. [Google Scholar] [CrossRef]
  32. Evans, C.J.; Sangwine, S.J.; Ell, T.A. Hypercomplex color-sensitive smoothing filters. In Proceedings of the 2000 International Conference on Image Processing (Cat. No.00CH37101), Vancouver, BC, Canada, 10–13 September 2000; pp. 541–544. [Google Scholar]
  33. Ell, T.A.; Sangwine, S.J. Hypercomplex Fourier Transforms of Color Images. IEEE Trans. Image Process. 2007, 16, 22–35. [Google Scholar] [CrossRef]
  34. Shi, L.; Funt, B. Quaternion color texture segmentation. Comput. Vis. Image Underst. 2007, 107, 88–96. [Google Scholar] [CrossRef]
  35. Zhang, X.; Yang, M. Color image knowledge model construction based on ontology. Color Res. Appl. 2019, 44, 651–662. [Google Scholar] [CrossRef]
  36. Kazakeviciute-Januskeviciene, G.; Janusonis, E.; Bausys, R.; Limba, T.; Kiskis, M. Assessment of the Segmentation of RGB Remote Sensing Images: A Subjective Approach. Remote Sens. 2020, 12, 4152. [Google Scholar] [CrossRef]
  37. Sural, S.; Qian, G.; Pramanik, S. Segmentation and histogram generation using the HSV color space for image retrieval. In Proceedings of the International Conference on Image Processing, Rochester, NY, USA, 22–25 September 2002; Institute of Electrical and Electronics Engineers (IEEE): Piscataway, NJ, USA, 2003. [Google Scholar]
  38. Wang, W.; Chen, Z.; Yuan, X.; Wu, X. Adaptive image enhancement method for correcting low-illumination images. Inf. Sci. 2019, 496, 25–41. [Google Scholar] [CrossRef]
  39. Abdalla, A.; Cen, H.; Abdel-Rahman, E.; Wan, L.; He, Y. Color Calibration of Proximal Sensing RGB Images of Oilseed Rape Canopy via Deep Learning Combined with K-Means Algorithm. Remote Sens. 2019, 11, 3001. [Google Scholar] [CrossRef] [Green Version]
  40. Wang, J.; Zhi, X.; Huang, J.; Meng, C.; Hu, Y.; Zhang, D. Hierarchical Characteristics Analysis of Forest Landscape Pattern Based on GIS and PCA Dimension Reduction Method. Nongye Jixie Xuebao/Trans. Chin. Soc. Agric. Mach. 2019, 50, 195–201. [Google Scholar] [CrossRef]
  41. Gao, L.; Lin, X. A method for accurately segmenting images of medicinal plant leaves with complex backgrounds. Comput. Electron. Agric. 2018, 155, 426–445. [Google Scholar] [CrossRef]
  42. Piramanayagam, S.; Saber, E.; Schwartzkopf, W.; Koehler, F.W. Supervised Classification of Multisensor Remotely Sensed Images Using a Deep Learning Framework. Remote Sens. 2018, 10, 1429. [Google Scholar] [CrossRef] [Green Version]
  43. Lei, T.; Jia, X.; Zhang, Y.; Liu, S.; Meng, H.; Nandi, A.K. Superpixel-Based Fast Fuzzy C-Means Clustering for Color Image Segmentation. IEEE Trans. Fuzzy Syst. 2018, 27, 1753–1766. [Google Scholar] [CrossRef] [Green Version]
  44. Feng, J.; Wang, S.; Liu, G.; Zeng, L. A Separating Method of Adjacent Apples Based on Machine Vision and Chain Code Information. In Proceedings of the International Conference on Computer and Computing Technologies, Beijing, China, 29–31 October 2011; Volume 368, pp. 258–267. [Google Scholar]
  45. Changyi, X.; Lihua, Z.; Minzan, L.; Yuan, C.; Chunyan, M. Apple detection from apple tree image based on BP neural network and Hough transform. Int. J. Agric. Biol. Eng. 2015, 8, 46–53. [Google Scholar] [CrossRef]
  46. Niu, L.; Zhou, W.; Wang, D.; He, D.; Zhang, H.; Song, H. Extracting the symmetry axes of partially occluded single apples in natural scene using convex hull theory and shape context algorithm. Multimed. Tools Appl. 2017, 76, 14075–14089. [Google Scholar] [CrossRef]
  47. Hammam, A.A.; Soliman, M.M.; Hassanien, A.E. Real-time multiple spatiotemporal action localization and prediction approach using deep learning. Neural Netw. 2020, 128, 331–344. [Google Scholar] [CrossRef] [PubMed]
  48. Jia, W.; Tian, Y.; Luo, R.; Zhang, Z.; Lian, J.; Zheng, Y. Detection and segmentation of overlapped fruits based on optimized mask R-CNN application in apple harvesting robot. Comput. Electron. Agric. 2020, 172, 105380. [Google Scholar] [CrossRef]
  49. Wu, M.; Yin, X.; Li, Q.; Zhang, J.; Feng, X.; Cao, Q.; Shen, H. Learning deep networks with crowdsourcing for relevance evaluation. EURASIP J. Wirel. Commun. Netw. 2020, 2020, 1–11. [Google Scholar] [CrossRef]
  50. Haque, I.R.; Neubert, J. Deep learning approaches to biomedical image segmentation. Inform. Med. Unlocked 2020, 18, 100297. [Google Scholar] [CrossRef]
  51. Amanullah, M.A.; Habeeb, R.A.A.; Nasaruddin, F.H.; Gani, A.; Ahmed, E.; Nainar, A.S.M.; Akim, N.M.; Imran, M. Deep learning and big data technologies for IoT security. Comput. Commun. 2020, 151, 495–517. [Google Scholar] [CrossRef]
  52. Lin, Z.; Zhang, Z.; Chen, L.-Z.; Cheng, M.-M.; Lu, S.-P. Interactive Image Segmentation with First Click Attention. In Proceedings of the IEEE/CVF Conference on Computer Vision and Pattern Recognition (CVPR), Seattle, WA, USA, 14–19 June 2020; pp. 13336–13345. [Google Scholar]
  53. Karabağ, C.; Verhoeven, J.; Miller, N.; Reyes-Aldasoro, C. Texture Segmentation: An Objective Comparison between Tradi-tional and Deep-Learning Methodologies. Preprints 2019. [Google Scholar] [CrossRef]
  54. Huang, J.; Li, J.; Liu, L.; Luo, K.; Chen, X.; Liang, F. PCB Image Registration Based on a Priori Threshold SURF Algorithm. In Proceedings of the International Conference on Smart Vehicular Technology, Transportation, Communication and Applications, Mount Emei, China, 25–28 October 2018; pp. 440–447. [Google Scholar]
  55. Li, W.; Li, F.; Du, J. A level set image segmentation method based on a cloud model as the priori contour. Signal Image Video Process. 2018, 13, 103–110. [Google Scholar] [CrossRef]
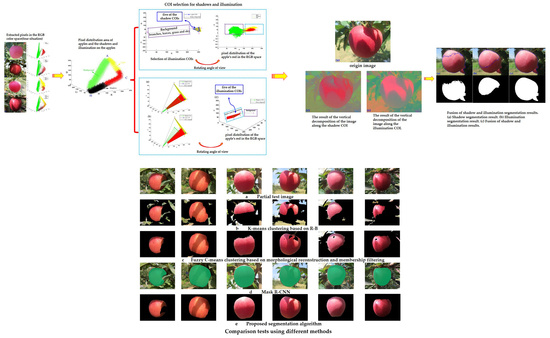
Figure 1. Gray-center RGB color space.
Agriculture 11 00273 g001
Figure 2. Extracted pixels in the RGB color space. (a) No halation and no shadows, (b) Only different degrees of shadows, (c) Only different degrees of halation at the edge of the apple surface, (d) Different degrees of both halation and shadows.
Agriculture 11 00273 g002aAgriculture 11 00273 g002b
Figure 3. Pixel distribution area of apples and the shadows and halation on the apples.
Agriculture 11 00273 g003
Figure 4. Distribution of the apple’s red in the RGB color space. (a) Selection of halation and shadow COIs, (b) Results of the shadow COI after rotation, (c) Apple image divided vertically along the pixel distribution map of the rotated shadow COI, (d) Apple image divided vertically along the pixel distribution map of the halation COI.
Agriculture 11 00273 g004
Figure 5. Apple image obtained by parallel and vertical decomposition along the COIs. (a) Origin image, (b) The result of the parallel decomposition of the image along the shadow COI, (c) The result of the vertical decomposition of the image along the shadow COI, (d) The result of the parallel decomposition of the image along the halation COI, (e) The result of the vertical decomposition of the image along the halation COI.
Agriculture 11 00273 g005
Figure 6. Selection of the B threshold.
Agriculture 11 00273 g006
Figure 7. Fusion of shadow and halation segmentation results. (a) Shadow segmentation result, (b) Halation segmentation result, (c) Fusion of shadow and halation results.
Agriculture 11 00273 g007
Figure 8. Comparison tests using different methods.
Agriculture 11 00273 g008
Figure 9. Localization process of apple targets based on circle fitting method: (a) Partial origin image, (b) Extraction of apple contours, (c) Final fitting results.
Agriculture 11 00273 g009aAgriculture 11 00273 g009b
Table 1. Performance of different methods in terms of the average values of the metrics.
MethodMethod SourceRecallPrecisionF-MeasureFPRFNR
K-meansK-means based on R-B (Jidong Lv et al., 2019)74.15%65.31%69.45%21.07%24.93%
Fuzzy C-meansFast and robust fuzzy C-means (Tao Lei et al., 2017)93.25%96.82%95.00%1.51%6.68%
Deep learningMask R-CNN (Kaiming HE et al., 2018)97.69%97.92%97.80%0.33%2.25%
Proposed algorithm 98.79%99.91%99.35%0.04%1.18%
Publisher’s Note: MDPI stays neutral with regard to jurisdictional claims in published maps and institutional affiliations.

