Article

Exploring the Link between Food Security and Food Price Dynamics: A Bibliometric Analysis

by
Marwa Ben Abdallah
1,*,
Maria Fekete-Farkas
2 and
Zoltan Lakner
2
1
Doctoral School of Economic and Regional Sciences, Hungarian University of Agriculture and Life Sciences (MATE), 2100 Gödöllő, Hungary
2
Institute of Economic Sciences, Hungarian University of Agriculture and Life Sciences (MATE), 2100 Gödöllő, Hungary
*
Author to whom correspondence should be addressed.
Agriculture 2021, 11(3), 263; https://doi.org/10.3390/agriculture11030263
Submission received: 28 January 2021 / Revised: 2 March 2021 / Accepted: 11 March 2021 / Published: 19 March 2021
(This article belongs to the Section Agricultural Product Quality and Safety)

Abstract

:
An evaluation of research studies is considered an important task to make future adjustments for securing and adjusting policies. This article presents the results of a study that explored the research that has been published with food security, price volatility, and price transmission as keywords. The study involved a bibliometric evaluation of statistical outcomes from 899 scientific publications from 1979 to June 2020 related to the subject, registered in the Web of Science database. The collected articles were used to measure bibliometric indicators and evaluate the research work on food security and agricultural products’ price movement. An analysis of the development and the identification of the related topics of greatest interest on this subject was also carried out. The analysis results found that a rising number of studies have been registered over the years, emphasizing the following keywords: food security, climate change, agriculture, health, nutrition, consumption, and income. The analysis proves that the shift in scientific research trends associated with food security analysis is linked with health and food nutrition status. Furthermore, the word "impact" was significantly present in the analyzed papers, which reveals that econometric analysis should address the relationship between price movement and nutrient intake to achieve nutritional security.

1. Introduction

Food price surges and volatility increase the political, professional, and public issues related to food security worldwide. In 2007–2008, food price volatility undermined thousands of people’s welfare, weakening their nutritional status and food security. The Food and Agriculture Organization (FAO) predicted that the 2007–2008 price increase would lead to a higher number of undernourished people. Indeed, the number increased by 173 million people in the two years from 2007 to 2009 [1]. The African continent suffers from a high number of undernourished people, which reached 240 million in 2008 because of the fluctuations in staple food price (e.g., wheat, rice, maize) [1]. In addition, the price of agricultural products is affected by COVID-19, and therefore, food supply chains are affected [2]. Food deficiency is not only caused by the unavailability of food on the market but also by price increases. Due to their lack of food access, people can be prevented from acquiring food [3]. Policymakers usually try to weaken price volatility and mitigate its negative impacts on market actors (i.e., consumers and producers) by implementing strategies in the market or public interventions [4,5].
Commodity price volatility, unforeseen supply chain disruptions, and unanticipated weather changes are crucial risks for food markets and can hamper government efforts to ensure consistently and regularly available food, which threatens food security. High price volatility depreciates household incomes and purchasing power. Issues related to price volatility are linked with the concept of food security. A price shock can disrupt the “four pillars” of food security [6,7]. It interrupts the different supply chain levels, upstream and downstream. Additionally, the magnitude of the price volatility can undermine economic growth and poverty reduction [8]. An enormous food price increase aggravates poverty, especially in low-income countries [9].
A price spike affects all stages of the supply chain. Unexpected price volatility decreases farmers’ productivity; thus, they reduce their investment [10,11,12]. Additionally, agricultural inputs become subject to price volatility, driving retailers and processors to adjust their supply strategies to mitigate the supply uncertainty [13]. Unpredictable price change endangers food security status. It harms households who allocate a high percentage of their income for food purchases [14]. Therefore, to avoid price shocks, efficient price management should be applied in the food market to ensure the stability of food supply chains.
Price booms raise questions about the position of commodities in the future market. Due to market interconnections, it is crucial to understand the price dynamics within the market. Analysing the link between food prices and food security, a research study has been established in Kenya. It aimed to assess the connection between the maize price and low birth weight as an indicator of food security and quantify its effect. A positive correlation was detected. However, this result could not be generalized to all Kenyan households. In other words, some households gained advantages from maize price increases [15].
Food security has always been an attractive topic for researchers. Different papers have been published examining issues related to food security. Food price is the driver of food security [16]. For example, in 2015, the Economist Intelligence Unit updated the global food security index estimation every four months (which is estimated based on different factors) by adding an adjusting price factor that absorbed the food price shocks that happened over that time [17].
Recently, following the spread of the COVID-19 pandemic, some research has been published showing the pandemic’s impact on the four pillars of food security [18] and measuring its impact on low-income households [19].
Food price increases may worsen poor households’ health status by preventing their access to sufficient nutritional food [20]. Climate change and food price change are considered two significant drivers for food insecurity in some countries such as Ethiopia and Ghana [21,22].
Food insecurity and price volatility are crucial issues for our future. Thus, governments need to develop clearer measures that efficiently tackle agricultural risk management for sustainable development. It is essential to have the tools and the necessary knowledge to help recognize and identify the determinants of food security an know-how to intervene to protect people from insecure food. Therefore, governments must undertake background studies that forecast a food security index. This study’s results could help identify national indicators so government scan focus on found keywords to build a global forecast model of the food security index.
Facing the upward shift in the population and how to afford enough food, the United Nations has set a number of sustainable development goals in their 2030 schedule, with Goal 2 being “zero hunger” [23].
An increase in food prices threatens the purchasing power of consumers. Governments need to develop more straight forward and more rapid measures to tackle food market management for sustainable food availability efficiently.
It is essential to understand and identify factors and variables that contribute to determining the food security state and recognizing the way of intervention to protect people from food insecurity.
The price is linked to food security; this could be explained by the fact that there are factors in a close relationship between food security and price, such as supply and real income [24]. Mathematically, it has been justified that a volatile price of food menaces the food security status [25].
Therefore, bibliometric studies are considered suitable for assessing previous research based on keywords and offering useful directional themes for new research. The bibliometric method has been chosen as a convenient method because of its ability to reveal and identify food security and price volatility factors. Different studies have adopted a bibliometric analysis for reviewing specific themes. It has been used to highlight the danger that agriculture is facing. It identifies new directions to investigate future scientific works [26]. Additionally, it was a helpful tool to design a comprehensive image of publications in food policy, describing sources and authors’ collaboration [27].
This paper affords the first overview about food security and food price dynamic scientific articles to visualize the research development. It attempts to link research in these two fields. The work novelty accentuates the connection between keywords and related words, defining clusters that attract the main research focus, and therefore, identifying areas that are growing and need more examination.
Biblioshiny and other functions in the bibliometrix package in R studio software are the tools that help to conduct our analysis. They give a simple and understandable image of bibliometric study. This serves to identify the most important and trend keywords, which serve as a valuable and comprehensive tool for communication. This paper responds to the following questions: 1—What are the main sources where research papers were mainly published? 2—Which authors highly contributed to this field of research? 3—Which countries play an important role in their research contribution? 4—What are the most frequently employed keywords, co-occurrence networks, and clusters?
To address the objectives, this paper includes three sections. Section 2 presents the data used in our research and explains the methodology followed to reach the results. Section 3 has the results and discussions of the findings. This section is divided into six sections. Section 3.1 and Section 3.2 give summary statistics of the general characteristics of the data. Section 3.3 displays the top first sources where researchers published their scientific works and which are highly cited. Section 3.4 shows the most productive authors and their multinational collaboration. Section 3.5 figures out the top countries that focus on this field. Section 3.6 exhibits the co-word analysis. It defines the interrelation between the most frequently appearing keywords and the different clusters. The last section has the conclusion of our work.

2. Materials and Methods

The main purpose of this research was to evaluate, statistically, the previous studies that have been performed and combined these two research topics, the price movement and food security, and to identify keywords linked with food security and price movement, forming a network. Before, systematic review research was elaborated with the major group, and relatively few studies utilized evaluative bibliometric and relational bibliometric studies.
Bibliometric is a developed different methodology from the traditional systematic literature review [28]. It is a crucial method for investigating research, and it originated from the subject of library and science knowledge. Analyzing the English articles that tackle food security and the price dynamic in the agricultural field, bibliometric science has been applied. It grants the elaboration of network analysis, giving a clear image of the different links between the various scientific studies, countries, authors, and keywords. Additionally, it figures out the co-occurrence of keywords and an overview of the different themes’ evolution [29,30]. Different studies have been elaborated on food security using the bibliometric method [31,32,33,34,35,36]. These studies connect food security with other keywords, providing a quantitative review paper based on research publications. It is a developed method that allows the calculation and evaluation of written communication [37], quantitatively identifying the trend and the characteristic of a specific research topic based on different indicators [38,39], and concentrating on research titles, keywords, affiliations, authors, and journals where they were published [40]. In our research, Web of Science (WoS) provides the necessary database in our analysis. It is chosen in our research study as the source which affords the articles. WoS has been chosen because of many reasons. It is considered the widest and recommended source by previous studies [41]. It includes the top three ranked citation indices that are most acknowledged and universally cited [42].

Data

The analyzed documents used in this study have been extracted from the Web of Science with advanced research on 9th of June 2020 using the keyword TS = ((“food security” or “food security index”) and (“price” or “price volatility” or “price transmission”) AND (“food” or “agriculture” or “agricultural commodity” or “agricultural product”)).
The inputs are the downloaded papers from the Web of Science. Articles in the English language are the only documents that have been considered. R Studio version 3.5.3 (https://rstudio.com/products/rstudio/download/ Accessed on 11 March 2019) is free, open-source software, and it could be installed easily. There are numerous open-source packages available that help to carry out the specific user-driven functions in R Studio. The Bibliometrix package (http://www.bibliometrix.org, version 3.0.1, Accessed on 25 November 2020) is one of the different available packages dealing with bibliometric analysis [43]. It is fundamentally established for bibliometric analysis. In this research, the Bibliometrix package was employed for data investigation and explanation.

3. Results and Discussion

3.1. General Characteristics of the Bibliometric Analysis

Table 1 describes the main information about the analyzed articles based on our keywords research.
As highlighted in Table 1, the Web of Science database search output was 899 publications from 1979 till the 9th June 2020. These articles have been elaborated by 2566 authors and published in 429 sources. Figure 1 shows the number of publications’ repartition over the years, and the curve presents the cumulative publication number. It reveals an expanding, with some fluctuation, of the number of publications from 2005.It shows the developing focus on the topic. From 2007 to 2014, the number of publications noticeably increased from 12 papers to 79 papers. It reached 109 research papers in 2019.
The cumulative number of publications followed an upward trend. It could be divided into three phases according to the speed of the increase. The first phase spanned from 1979 till 1998. The second one, which had a lower speed than the first phase, covers the period from 1999 to 2007. The last phase, which had the highest speed of increase, started from 2008 to 2020.

3.2. Verification of Lotka’s Law

Lotka’s law indicates author productivity [44]. It exhibits the relationship between the author and the publication numbers. The general form of Lotka’s law is X n= C Y where X is the number of publications, Y is the number of authors who published X publications, and n and C are constant. Using the function in R studio language, L = lotka (results), n = 3.626, C = 0.778, R2 = 0.975 and p-value is 0.056. C = 0.778 is the percentage of the total author number, which is equal to 1996.
Figure 2 presents the curve of Lotka’slaw. It shows a strong correlation between the percentage of authors and the number of publications, R2 = 0.975. As shown in Table 2, only 7.9% of the total authors (203 authors) have published twoarticles. Furthermore, 5% of the total authors (12 authors) contributed with fourarticles

3.3. Source Patterns

A total of 899 scientific papers have been produced between 1979 and 2020 in 429 journals. Table 3 and Figure 3 describes the journal classification.
As displayed in Figure 3, there are two most relevant and top-ranked sources. The first source is the journal of food security, which is in first place with the highest number of publications (58 articles), followed by the food policy journal (53 articles). Both journals are Q1 ranked. The sustainability journal occupies third place with 17 articles.
h_index is a specific index which combines the productivity and the impact of the citation of journals. As highlighted in Table 3, the food policy journal had the highest h_index and total citations with the first citation in 1993. The food policy journal has 1325 citations, followed by the food security journal with 833 citations.

3.4. Main Authors

Table 4 presents the total number of authors found and their contribution authorship (single or multi authors). A total of 2566 authors have been found. A total of167 authors had (6.5% of the total authors) held single-authored documents, while 2399 (93.5%) had multi-authored articles.
To assess the author’s dominance, we used the Dominance Factor (DF), which counts the rate of the number of articles where the author is the first over the number of multi-authored articles. As highlighted in Table 5, the first place is occupied by Groshans G.R. He is the first author in all his multi-authored papers. The dominance factor is equal to 1. The second author is Brown M.E., and he has 0.750 as a dominance factor. He is the first author of three articles from a total of four papers.
Figure 4 and Table 6 highlight the most productive authors over time. The most productive authors are those who have contributed the maximum to the field. Based on Jorge Hirsch, who suggested the h-index in 2005, it means that each author has at least "h" citations of the published papers [45].
The size of the circles in Figure 4 designates the number of articles, and a bigger size means more publications. The color of the circles symbolizes the total citations per year; a darker color means more citations.
Table 6 displays the first ten authors classified based on their total article citations, indexes (h_index, g_index, m_index), total citations (TC), number of publications (NP), and the first year of publication (PY_start). The order of authors is determined based on the number of publications. Dorosh P.A. has the highest h_index (7), with eight publications that have been cited 216 times. Timmer C.P. is in second place with the same number of publications (8 articles) cited 155 times with six as h_index. Among the ten most productive authors, Timmer C.P. is the first author who started the publication in 2000.

3.5. Principal Countries

One hundred five countries are identified in the selected articles. A large number of countries could indicate the importance of the study field.
Table 7 describes the countries where authors collaborated inside the same country, Single Country Publications (SCP) and between countries, Multiple Country Publications, (MCP). Total articles (MCP+SCP) designate the total articles made with authors from the same country and multinational authors. Ten first countries with the highest number of publications are listed in Table 7. The number of single country papers exceeds the number of multiple country publications. The USA headed the list with 171 national publications, around 72% of the total published papers (domestic and international), followed by Australia with 50 local articles, representing 78% of the total publications. The USA had the highest MCP with 67 articles (28%). The United Kingdom published 30 domestic scientific papers from a total of 54 papers.

3.6. Keywords and Network Analysis

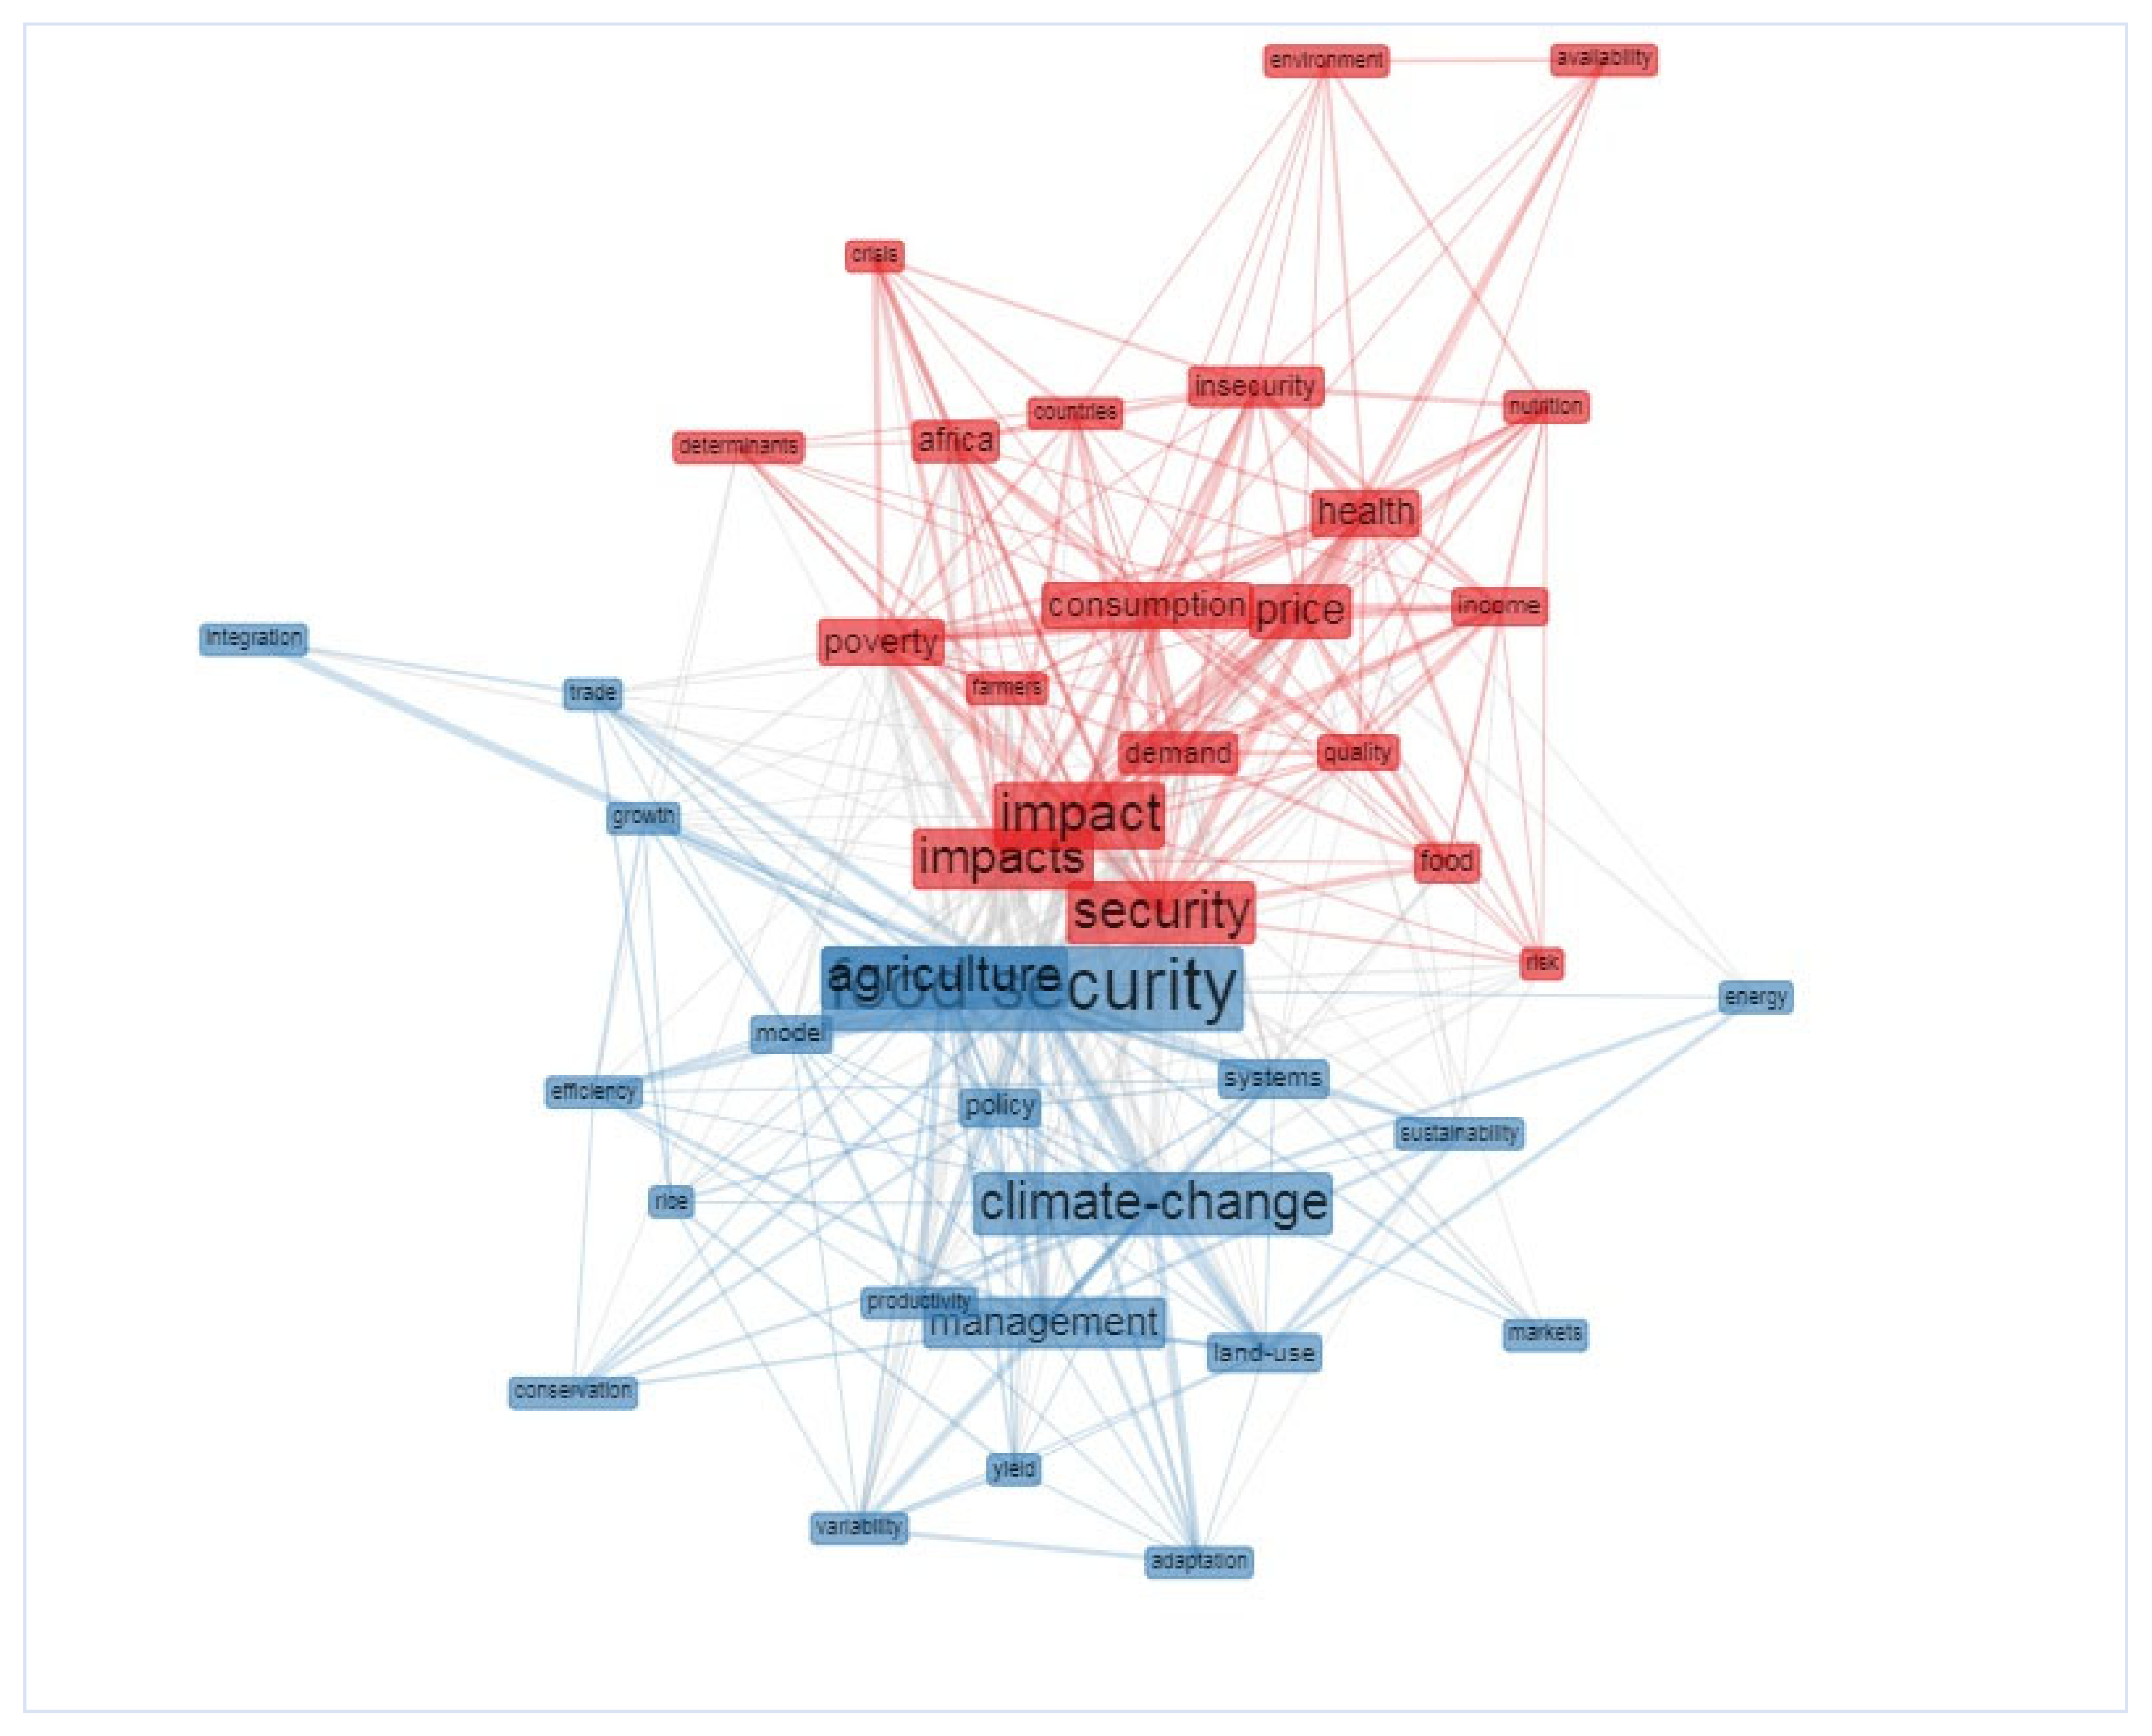
Constructing the keywords co-occurrence is an informative tool that recognizes the research composition. This method refers to the use of correlation measures between words, revealing their appearance relationships. The co-occurrence network highlights the link between keywords, forming a network map.
To investigate related keywords to food security and price dynamics, we present the first ranked 10 keywords based on their number of associations and the intensity level of their relationship. The first keyword was “food security”. Figure 5 identifies the keyword network. The color represents the cluster and links between rectangles show the strength level of the relationship between these keywords; a shorter distance signifies more intense association.
As highlighted in Figure 5, food security occupies the network hub, presented by the biggest rectangle. The keyword “Agriculture” is superposed on “food security”, reflecting the closeness between them, in other words, we cannot separate agriculture from food security.
The research’s main focus was placed on socio-economic and environmental aspects of food security such as climate change, health, poverty, price, and nutrition.
Following Figure 5, Table 8 identifies the first ranked keywords based on their co-occurrence. Food security is in first place with 77 co-occurrences, followed by the word security. Agriculture has 55 co-occurrences. The keyword price is among the first ten words, ordered by their appearance, with 44 co-occurrences. Based on these findings, food demand and consumption, income, health, and nutrition are emerging keywords in research studies. This highlights the importance of exploring the relationship between food price variability, available income, food nutritional value, and food security.
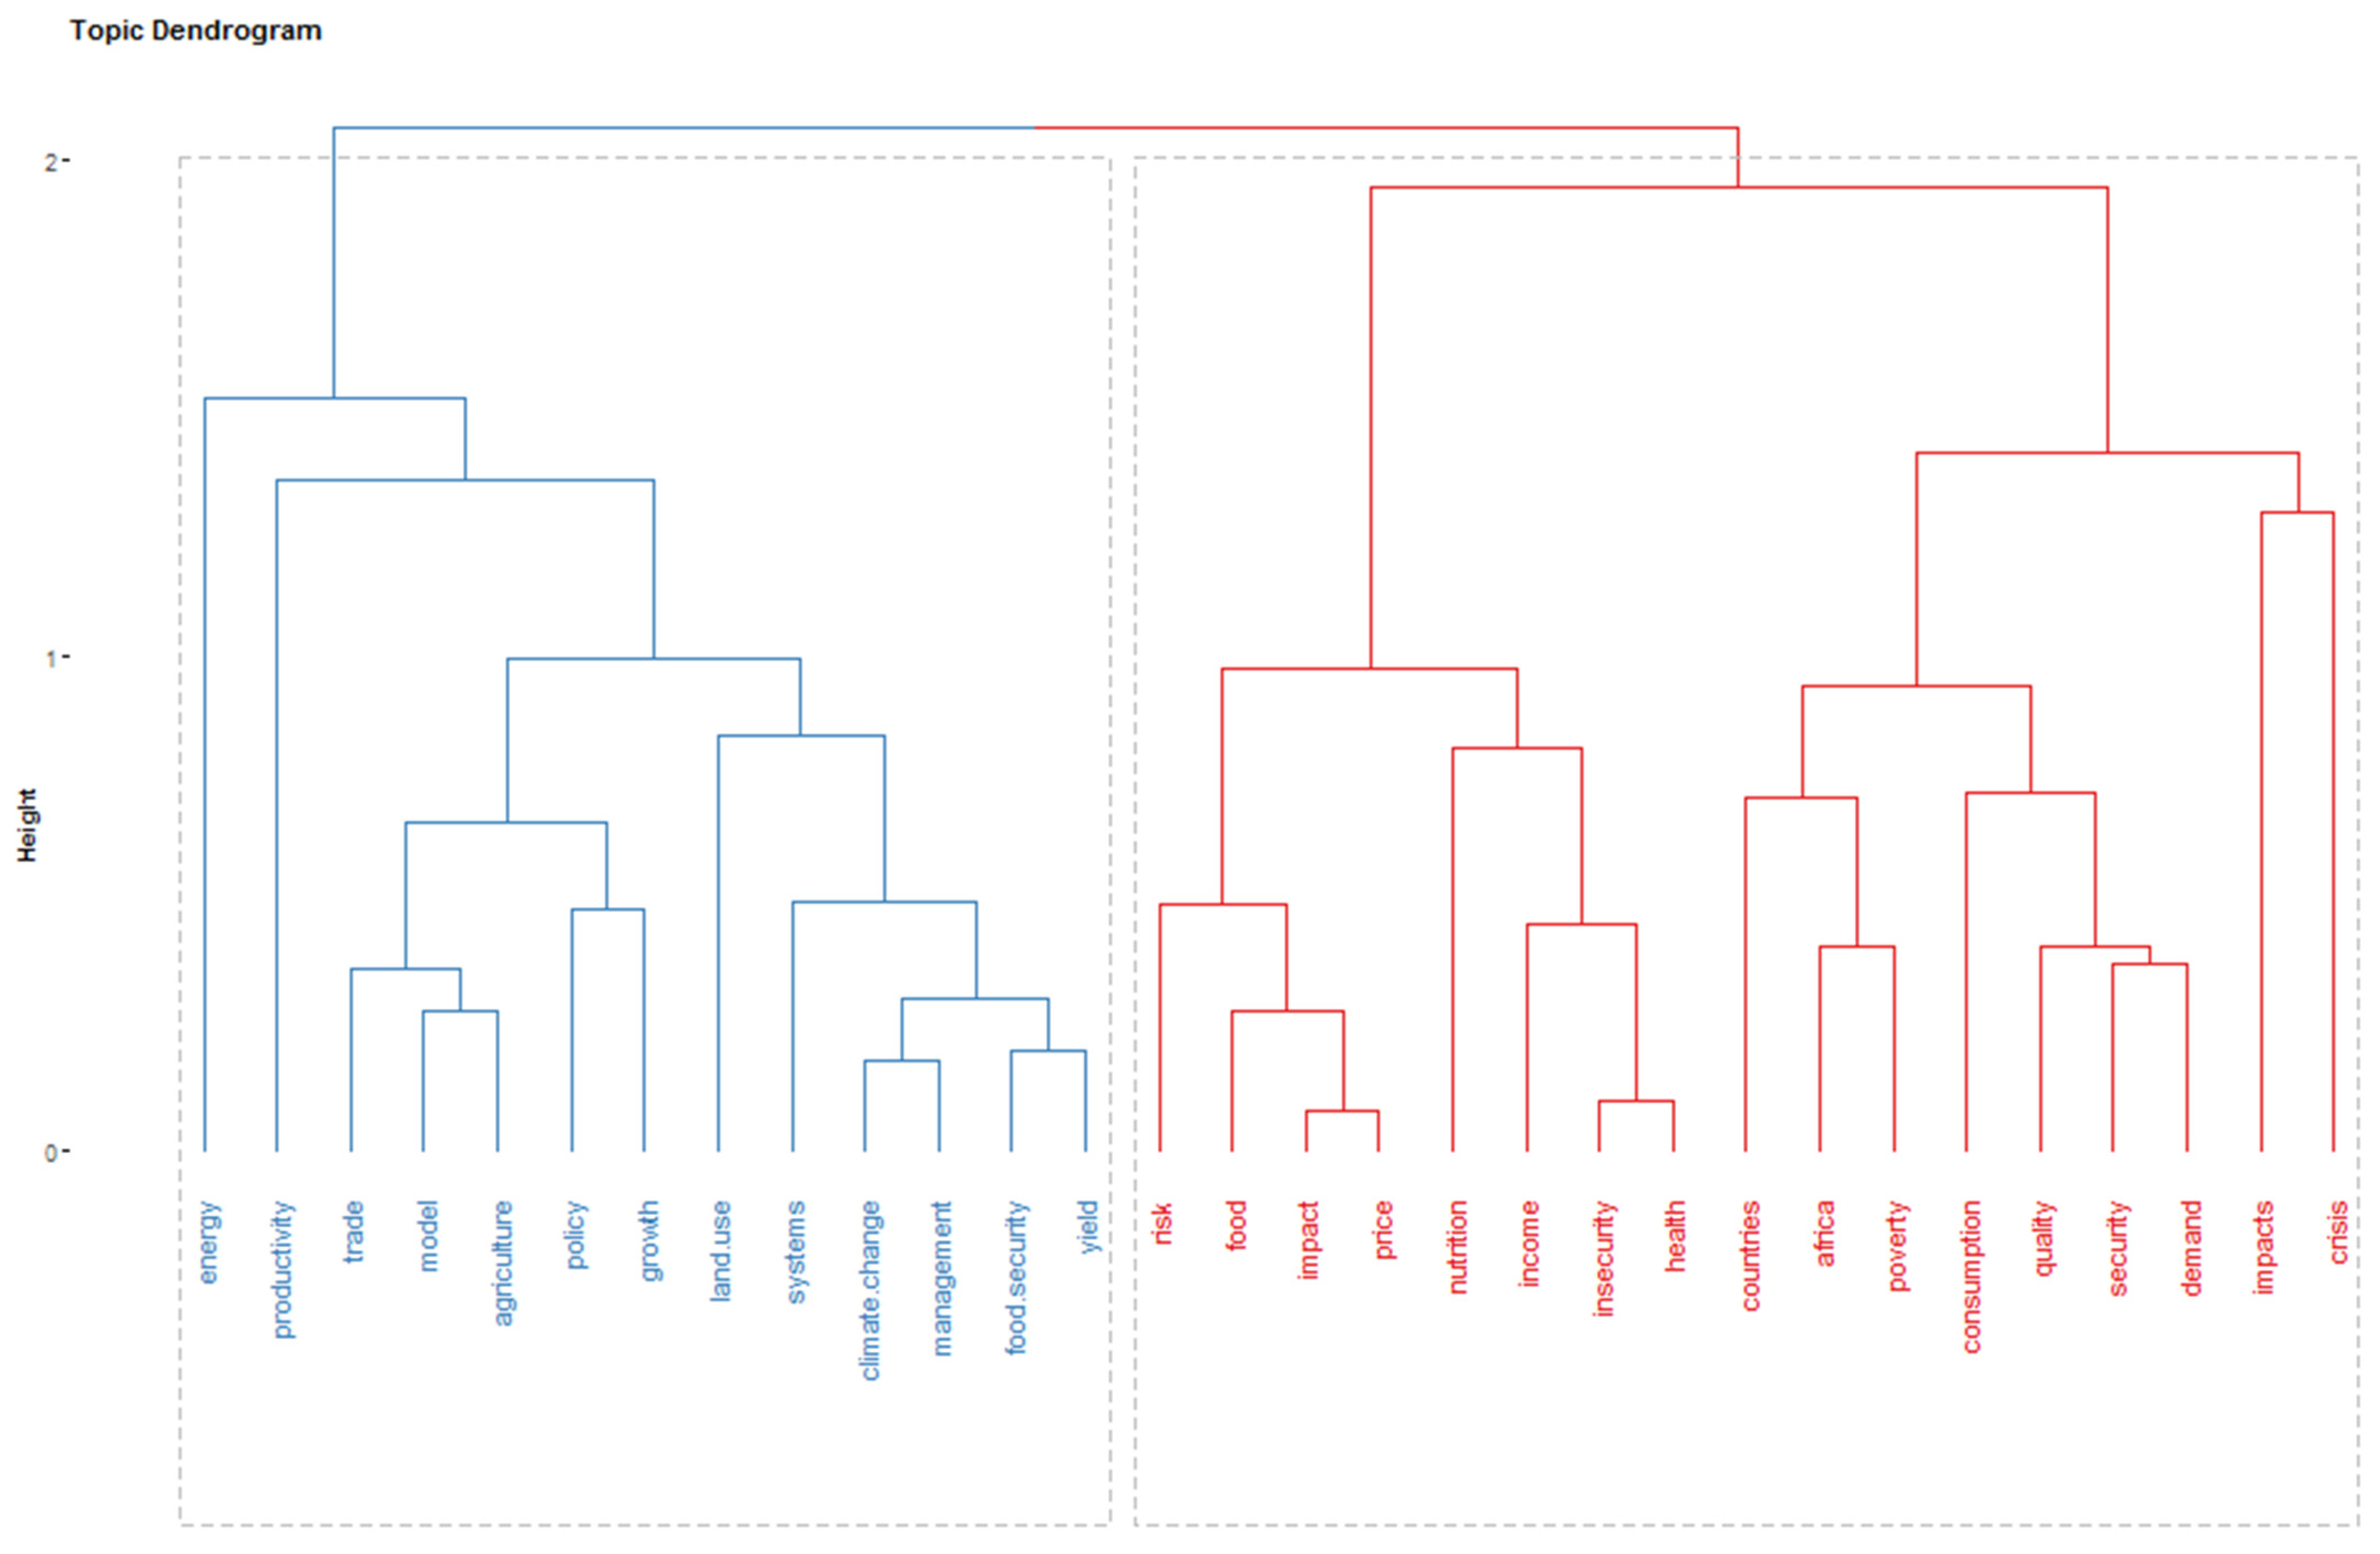
The dendrogram in Figure 6 displays the hierarchical rank and the connection between the ordered keyword groups. Multiple Correspondence Analysis (MCA) has been employed. It transforms a considerable number of variables into small structural groups of similar keywords. It helps to investigate and interpret the different identified clusters. It does not intend to find the perfect level of associations between clusters, but it aims to estimate the approximate number of clusters for further discussion.
The dendrogram of keywords approves what is presented in the keyword co-occurrence. Two clusters are identified. For the blue group, food security is linked to production and policies. For the red cluster, the word insecurity is related to quality, health, and income. Future research focuses on the production, household income, and access to healthy food, which affords them the necessary nutritive needed value to protect their health status.
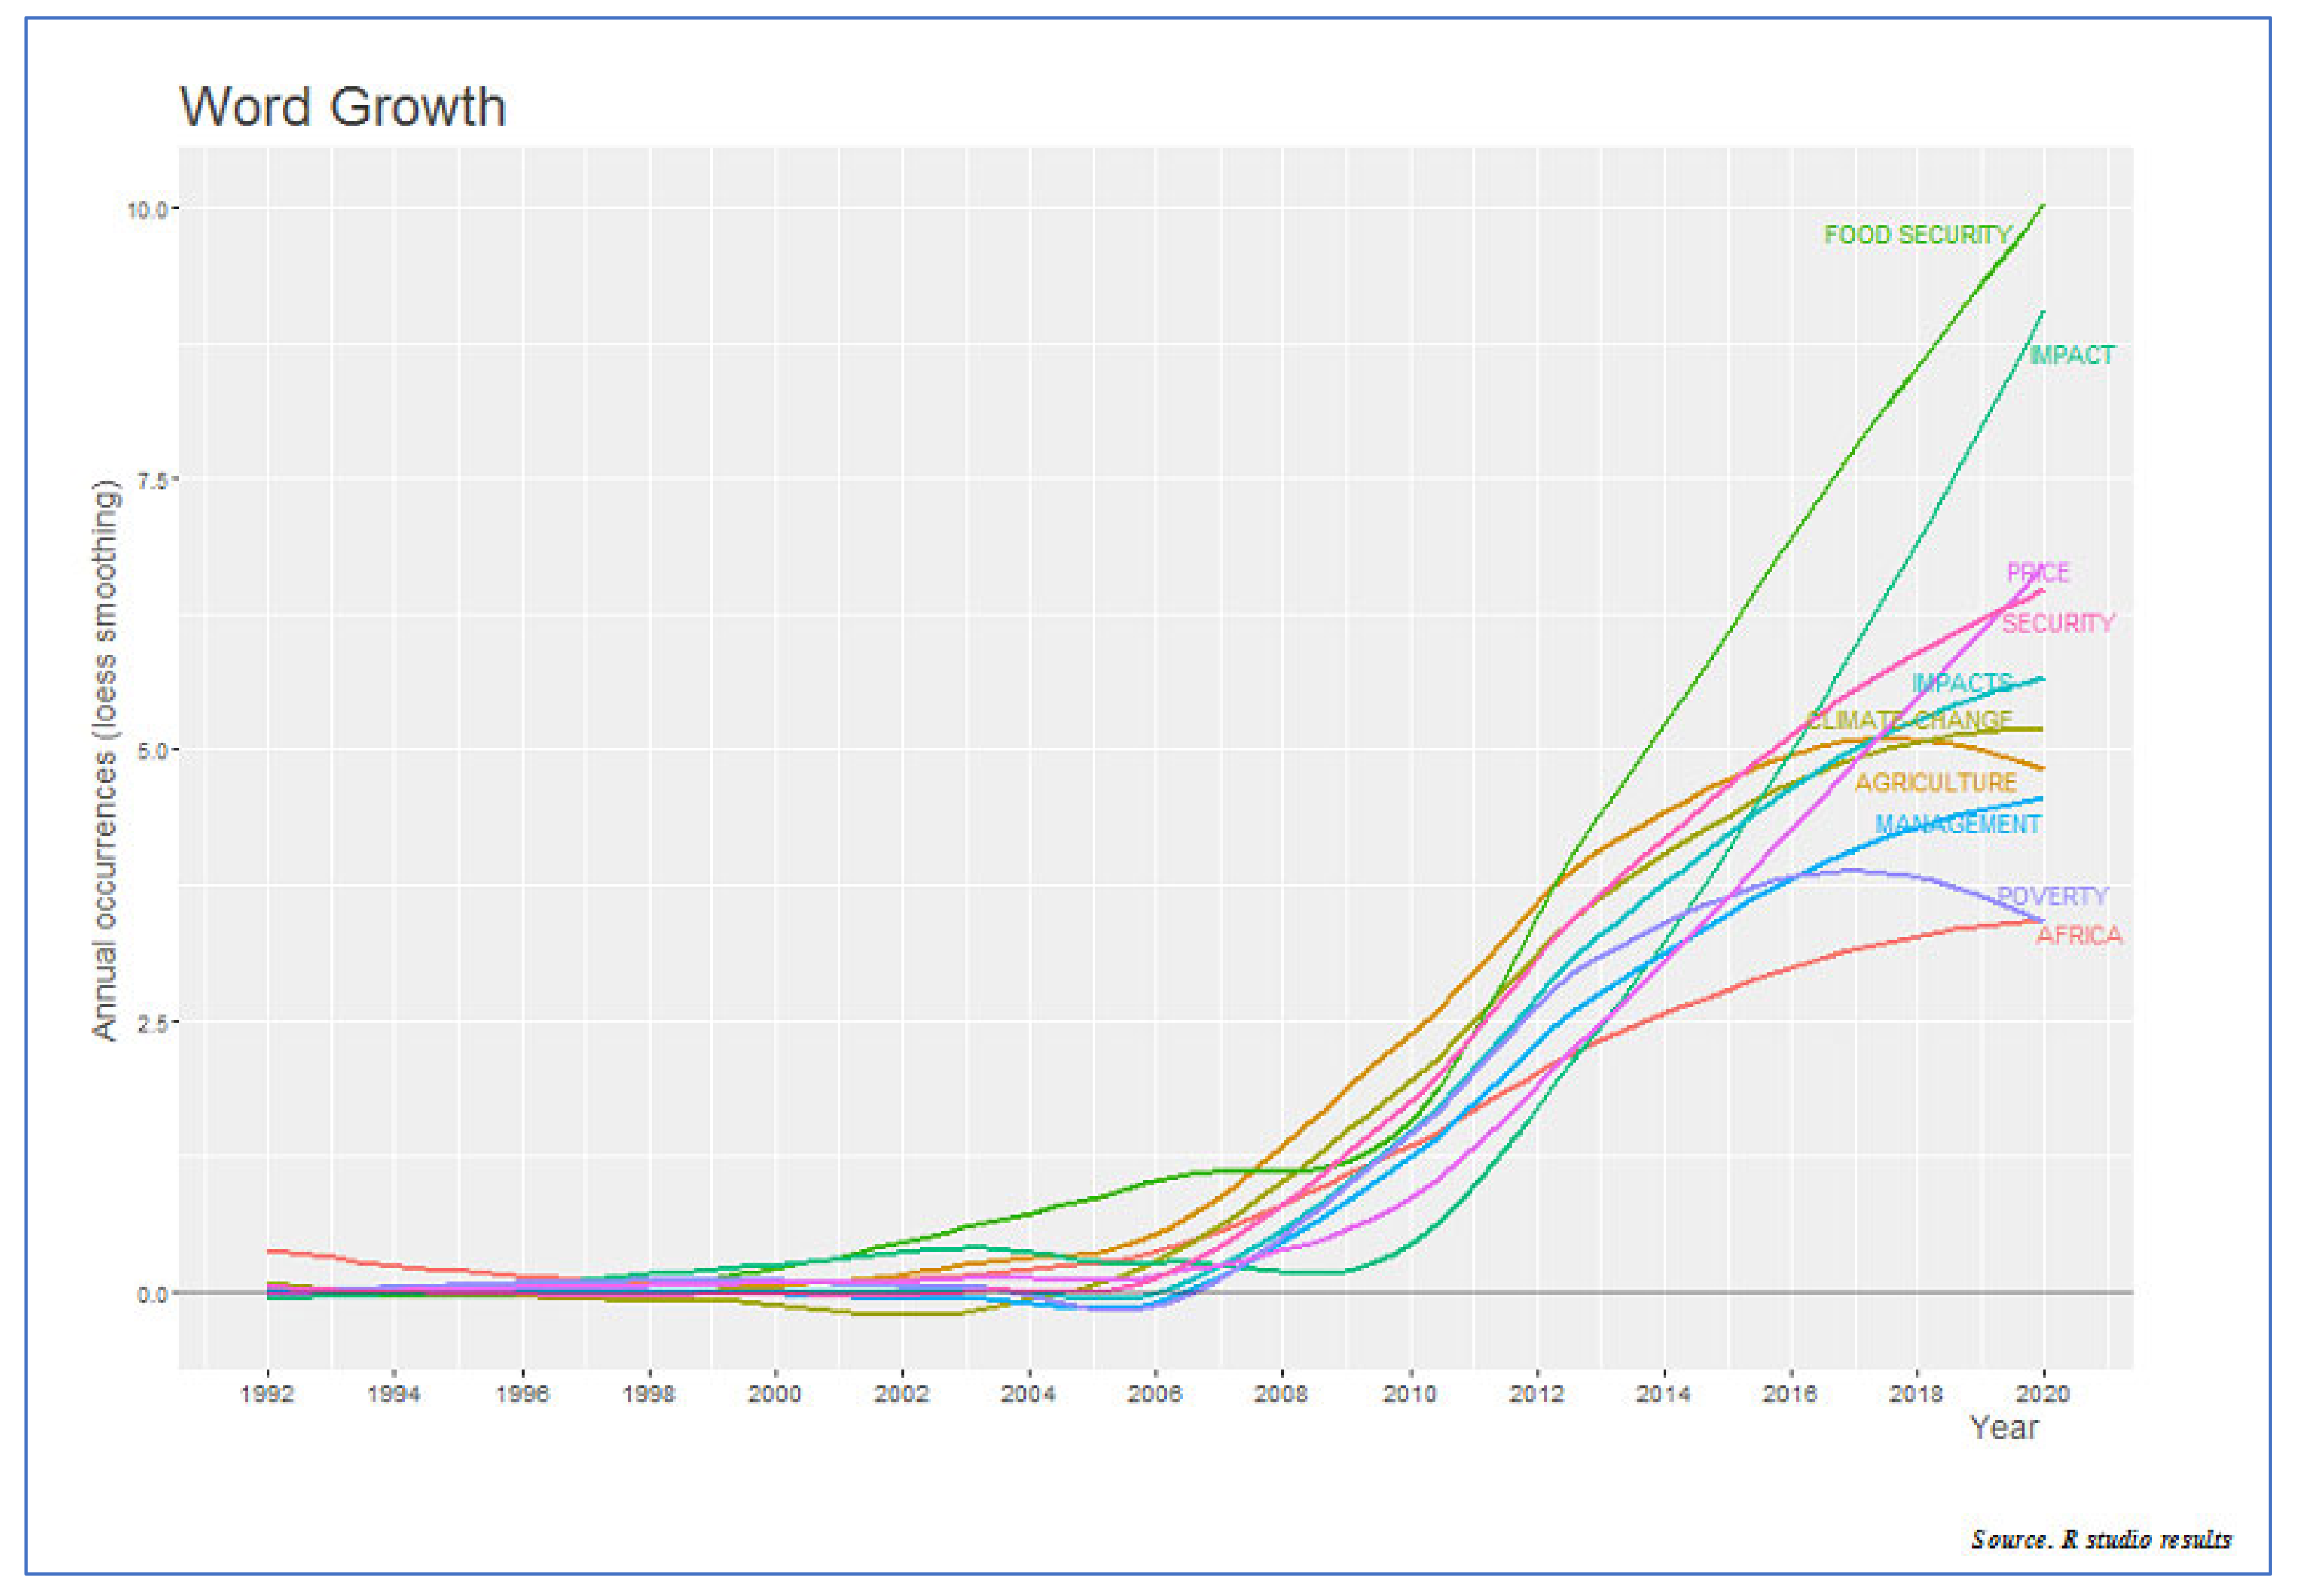
As highlighted in Figure 7, the food security field is noticeably increasing over the years. This means that it is always the core interest of many researchers. The food security composite keywords are joined with the word "price" and "impact", which also rise with an important speed. This signifies the growing interest in research in this field.
In parallel with the decreased rate of under nourished people, food security research has followed an exponential movement. It confirms that research considers food security a crucial issue for the whole world. The keyword map displays that food security presents a complicated issue related to different fields, such as human health and nutrition and climate (environment).
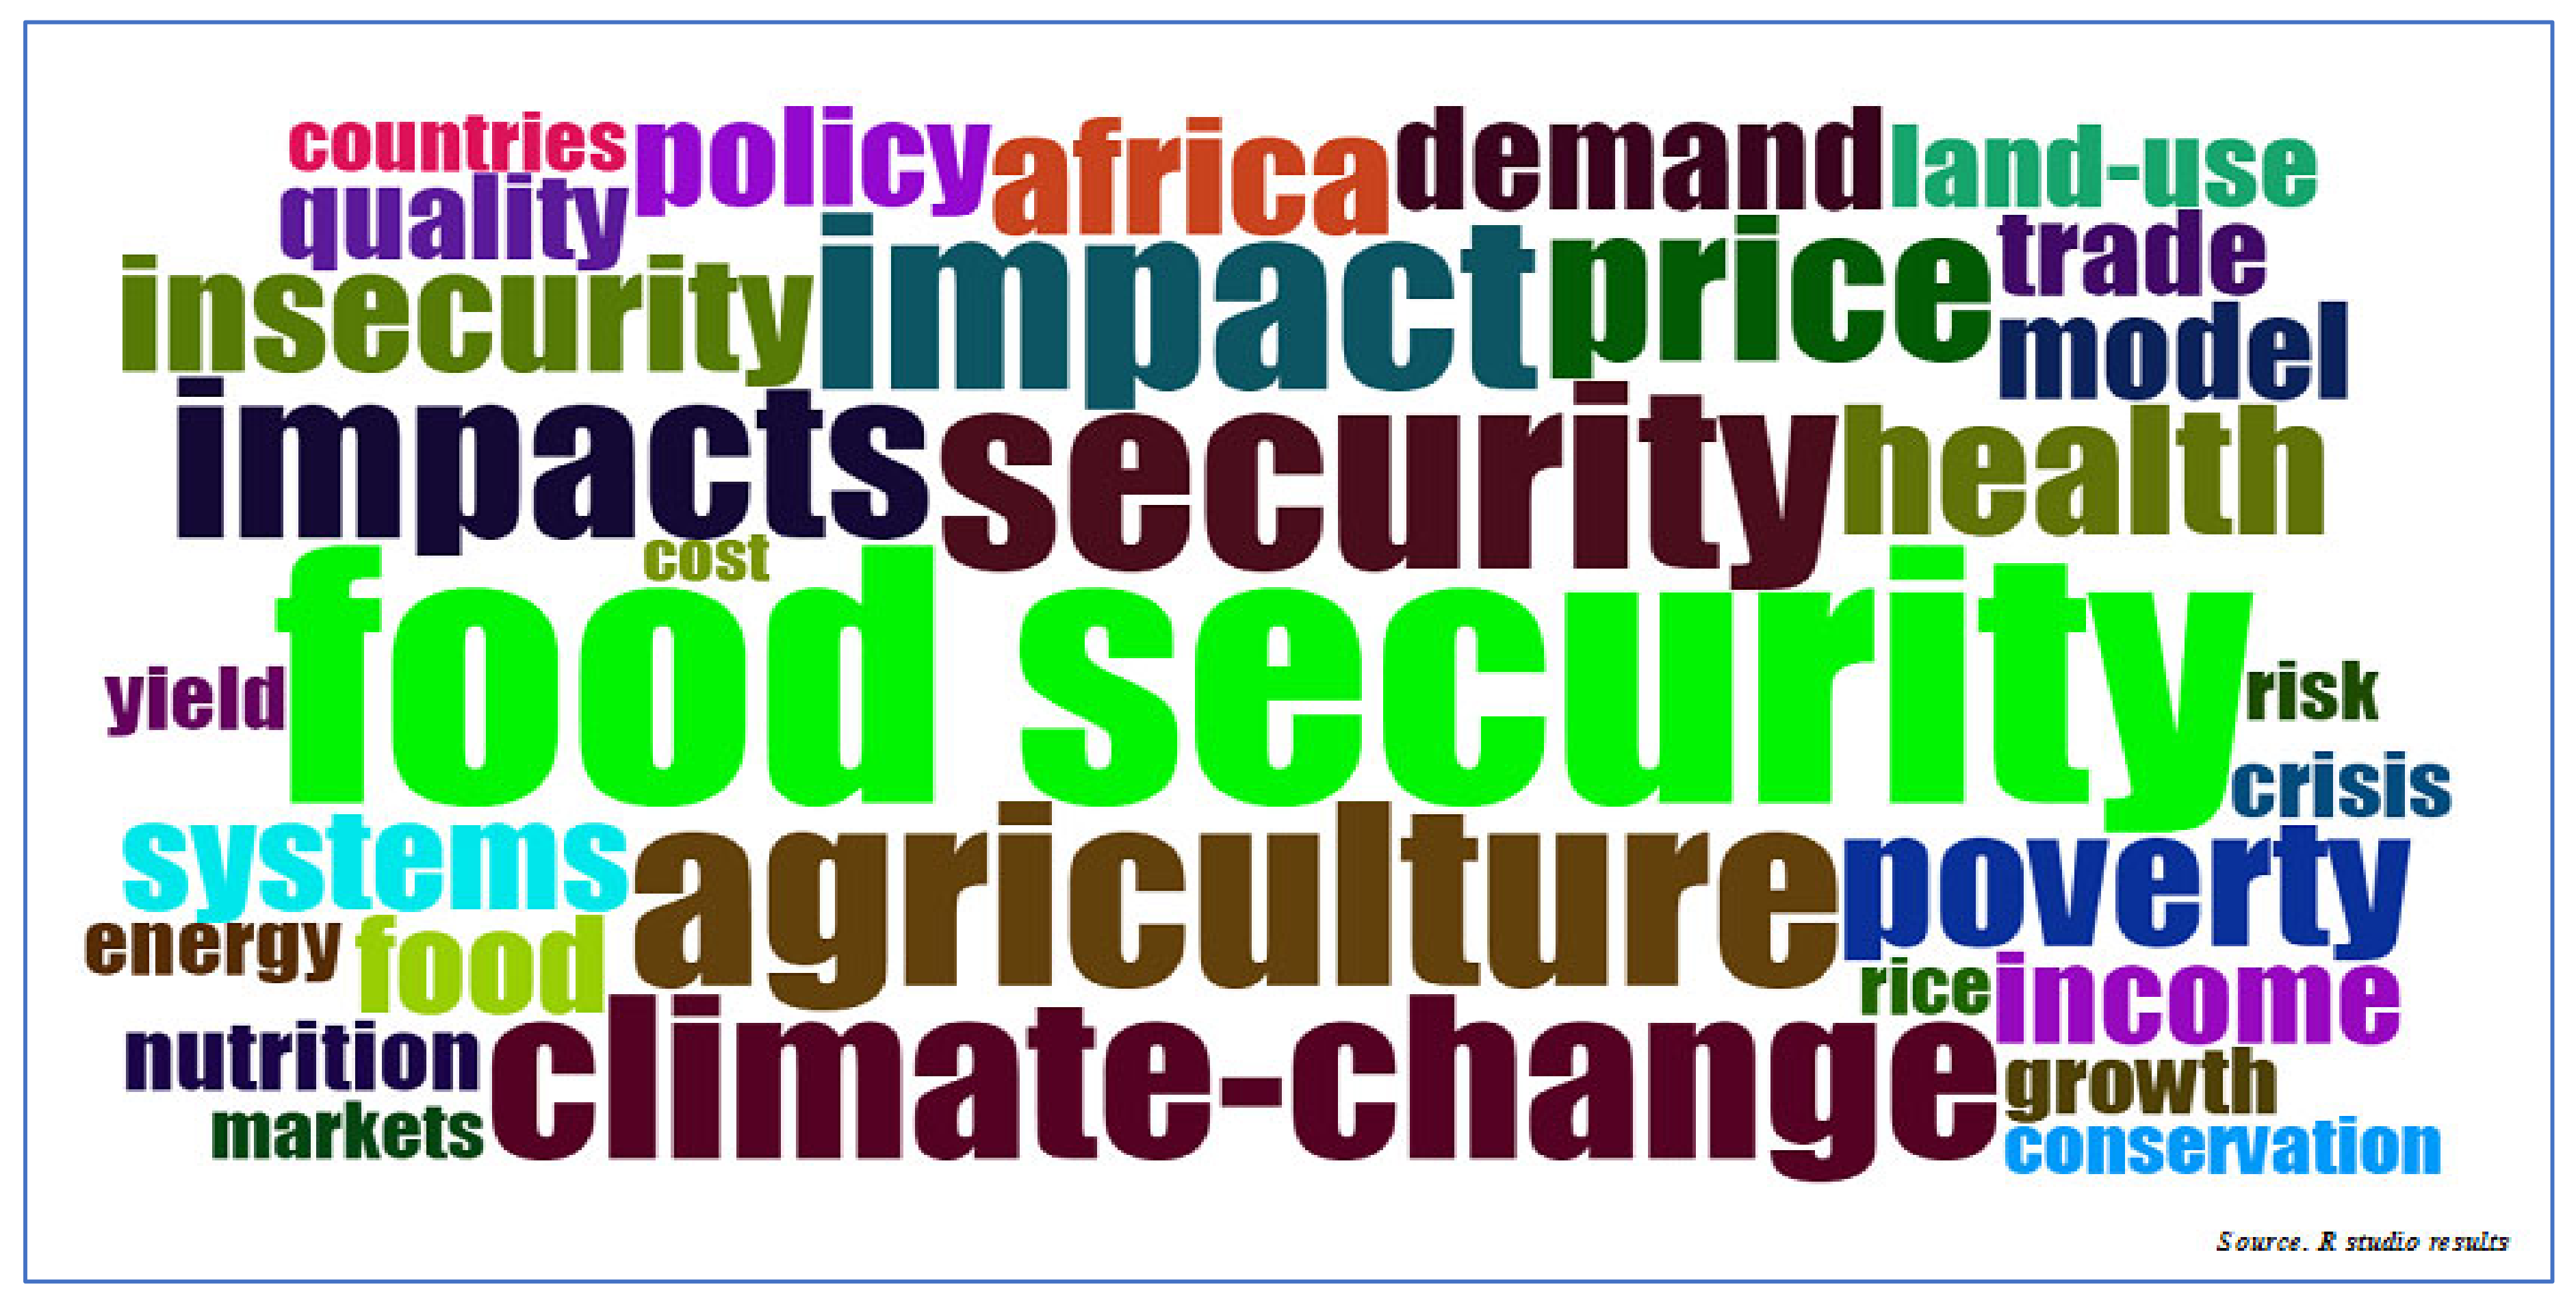
Figure 8 shows that agriculture, food security, and climate change are always the core of the analyzed research papers. We notice as well that "consumption" and “price” are present with high importance. From this point, a relationship has been exposed in previous research using these keywords in the same research topic. A relationship could be established linking agriculture, security, food, price, and consumption. This proves the importance of research in food security and its impact and the word "price". The increasing curve of these keywords, "food security", "impact", and "price" confirms the rising research linking these three keywords.
In their seminal work, Muñoz-Leiva et al. (2012) [
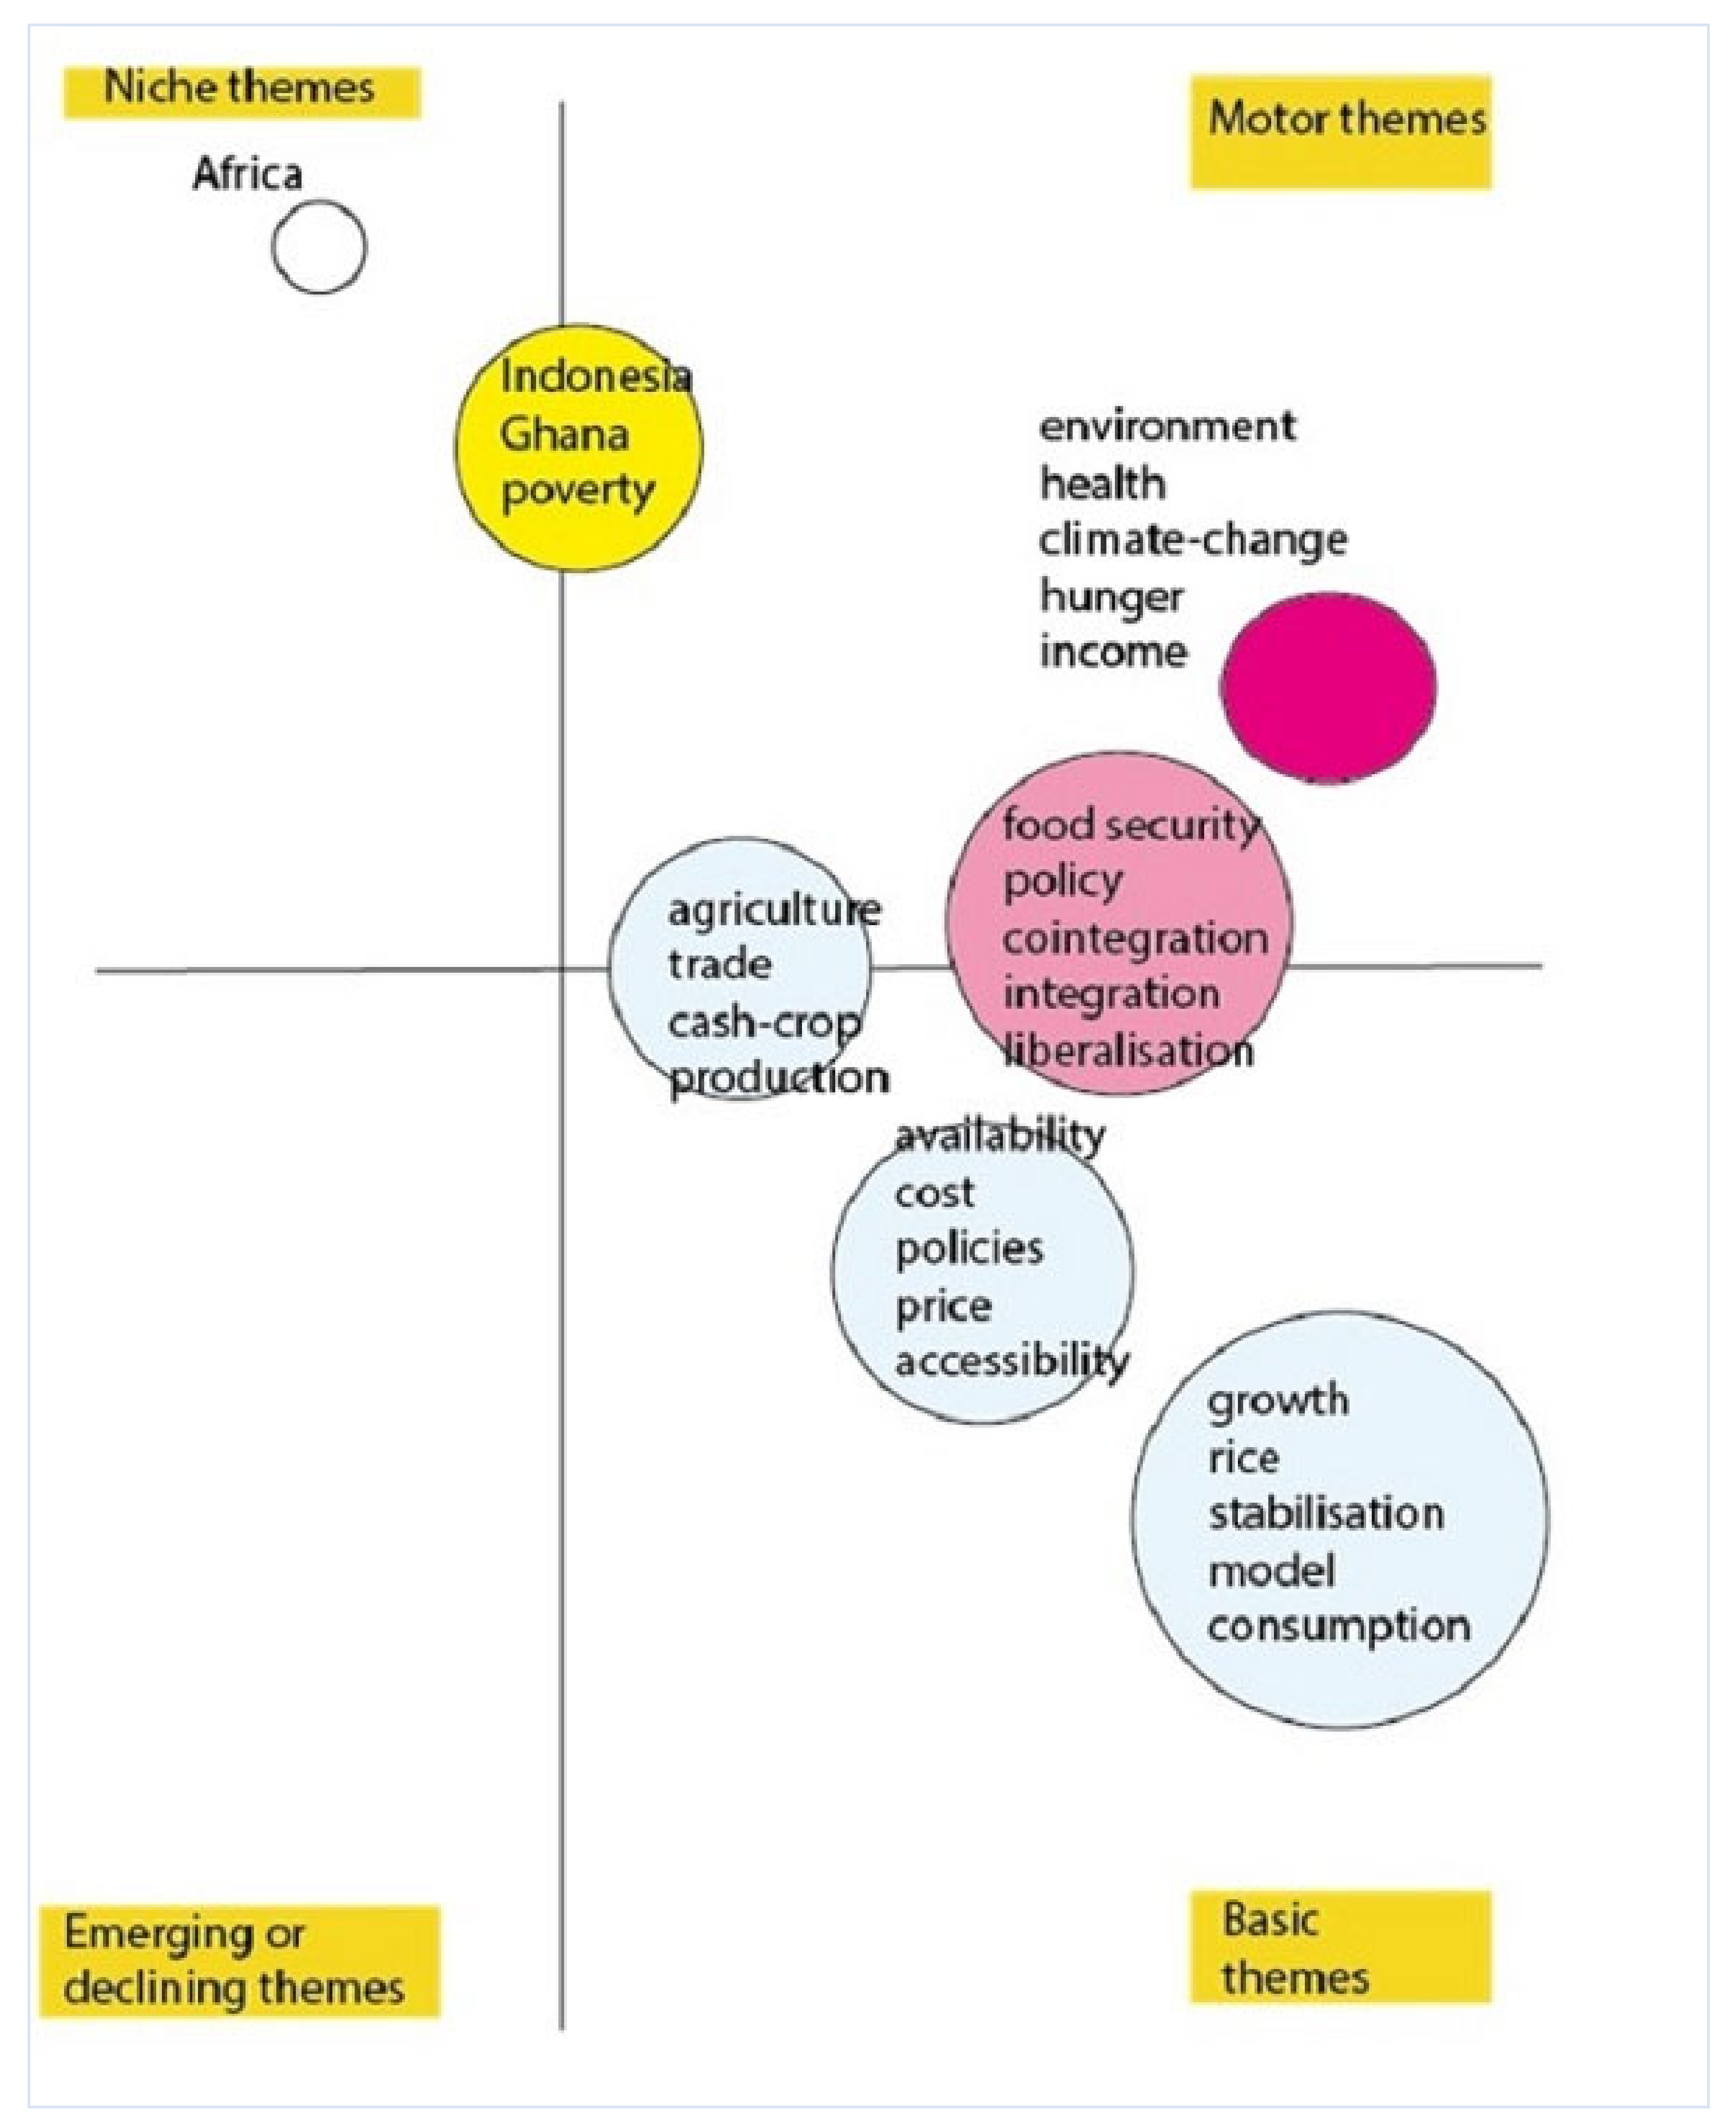
46] have analyzed the relative position of different topics according to their relationship within a network of a set of articles. In this way, combining the network and cluster analysis, they have defined four types of topics depicted in a two-dimensional coordinate system. These dimensions are suitable to describe the centrality and density of different topics.
The so-called motor themes are at the center of the research field: they are well developed and have a wide and intense relationship with other topics. The basic or transversal themes appear in the lower right part of the graph and can be considered as the backbones of the given set of publications. They can be characterized by high centrality and low density.
The highly developed but isolated topics can be characterized by high density and low centrality. There are intense academic communications within these topics, but their contribution is relatively marginal to the set in general. The emerging or declining themes can be characterized by low centrality and density.
We have divided the investigation period into two parts for convenience: up to the world economic crisis in 2008 and after this period. We have applied this approach to reflect the changes in economic thinking: the crisis has highlighted the vulnerability of the global economic system [47], and on the other hand, it has shown the importance of new market players, first of all, China [48].
The basic themes in the first period (Figure 9) were the supply of a rapidly developing population with rice and stabilization. Other important basic topics were the set of costs—price relationships, access, and availability. The application of cointegration has been on the border between basic and motor themes. The most important emerging topics in this period were the effects of climate change on hunger, health, and the environment. Interestingly, the studies analyzing the problems in Africa were rather peripheral ones.
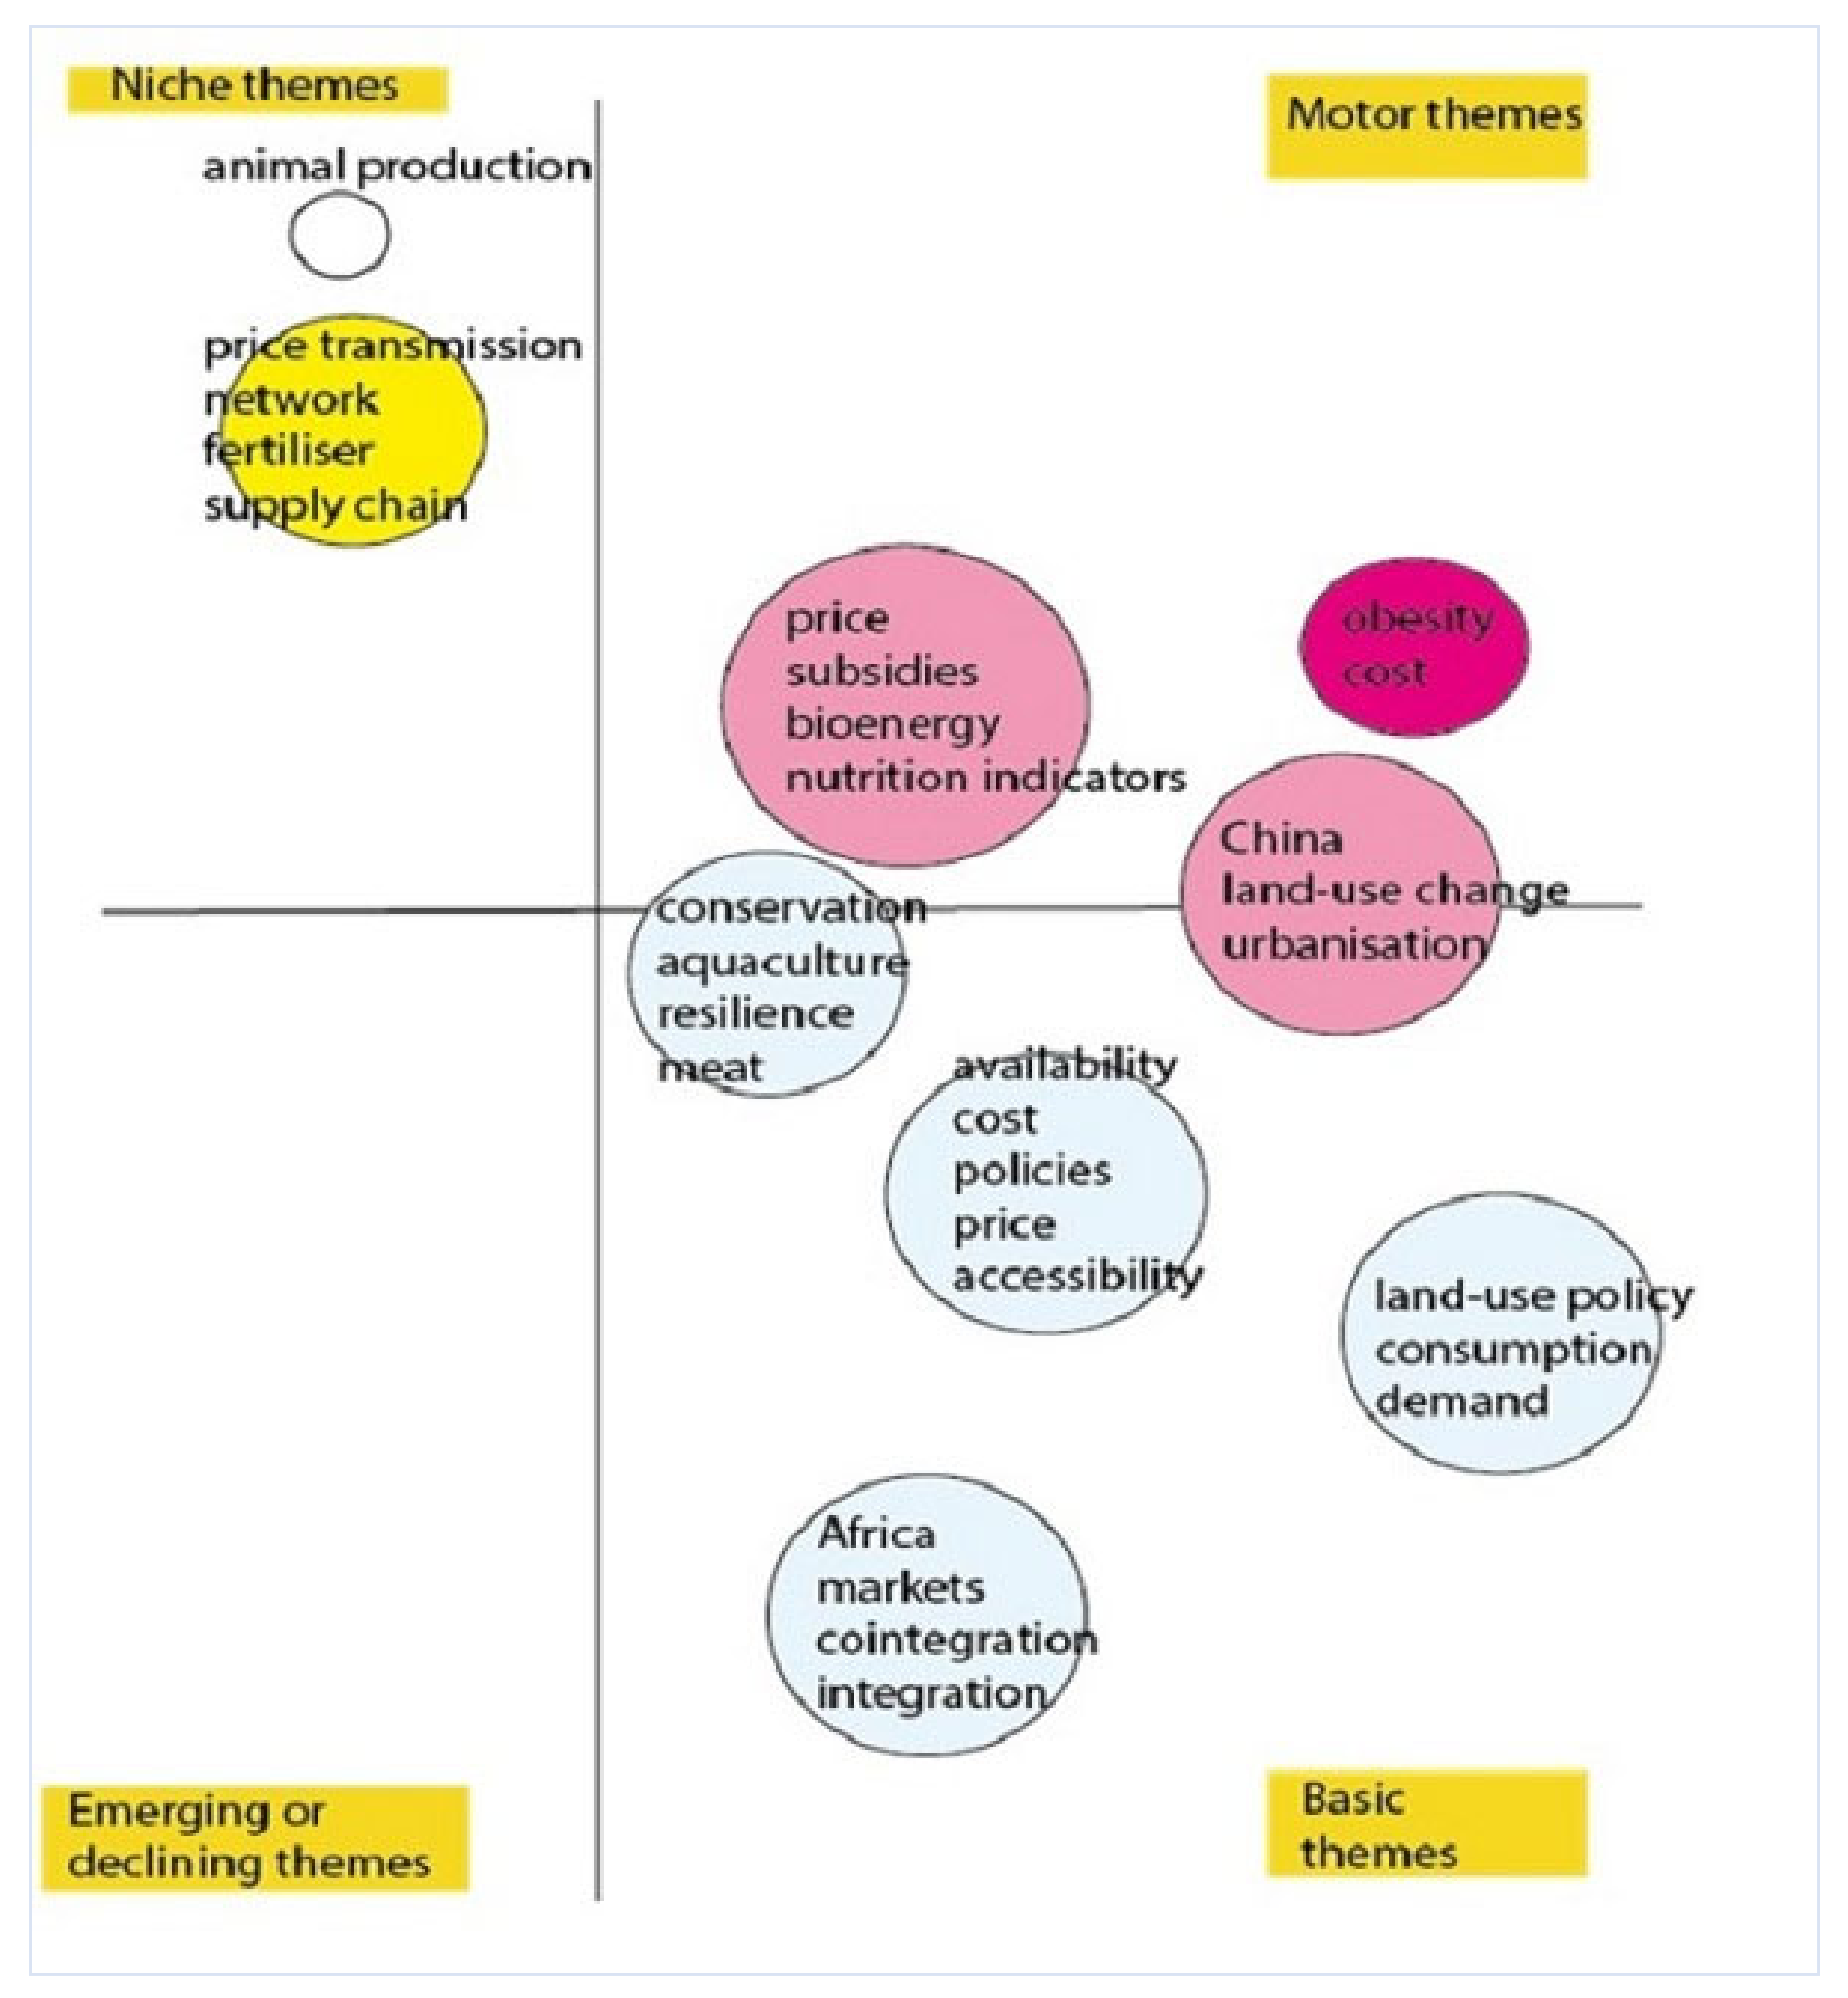
In the second period (Figure 10), practically in the last decade, some general topics (e.g., cost-price analysis, cointegration, land use policy analysis) became standard categories and became basic themes. Such relatively new topics, e.g., economic aspects of bioenergy production, have gained importance. The price distorting effects of subsidies became central topics. In recent years, it became obvious that obesity cannot be considered a local problem anymore. Under these conditions, the economic aspects of obesity became motor themes. Some relatively new topics emerged as new problems, such as price transmission, network analysis, and supply chain management.
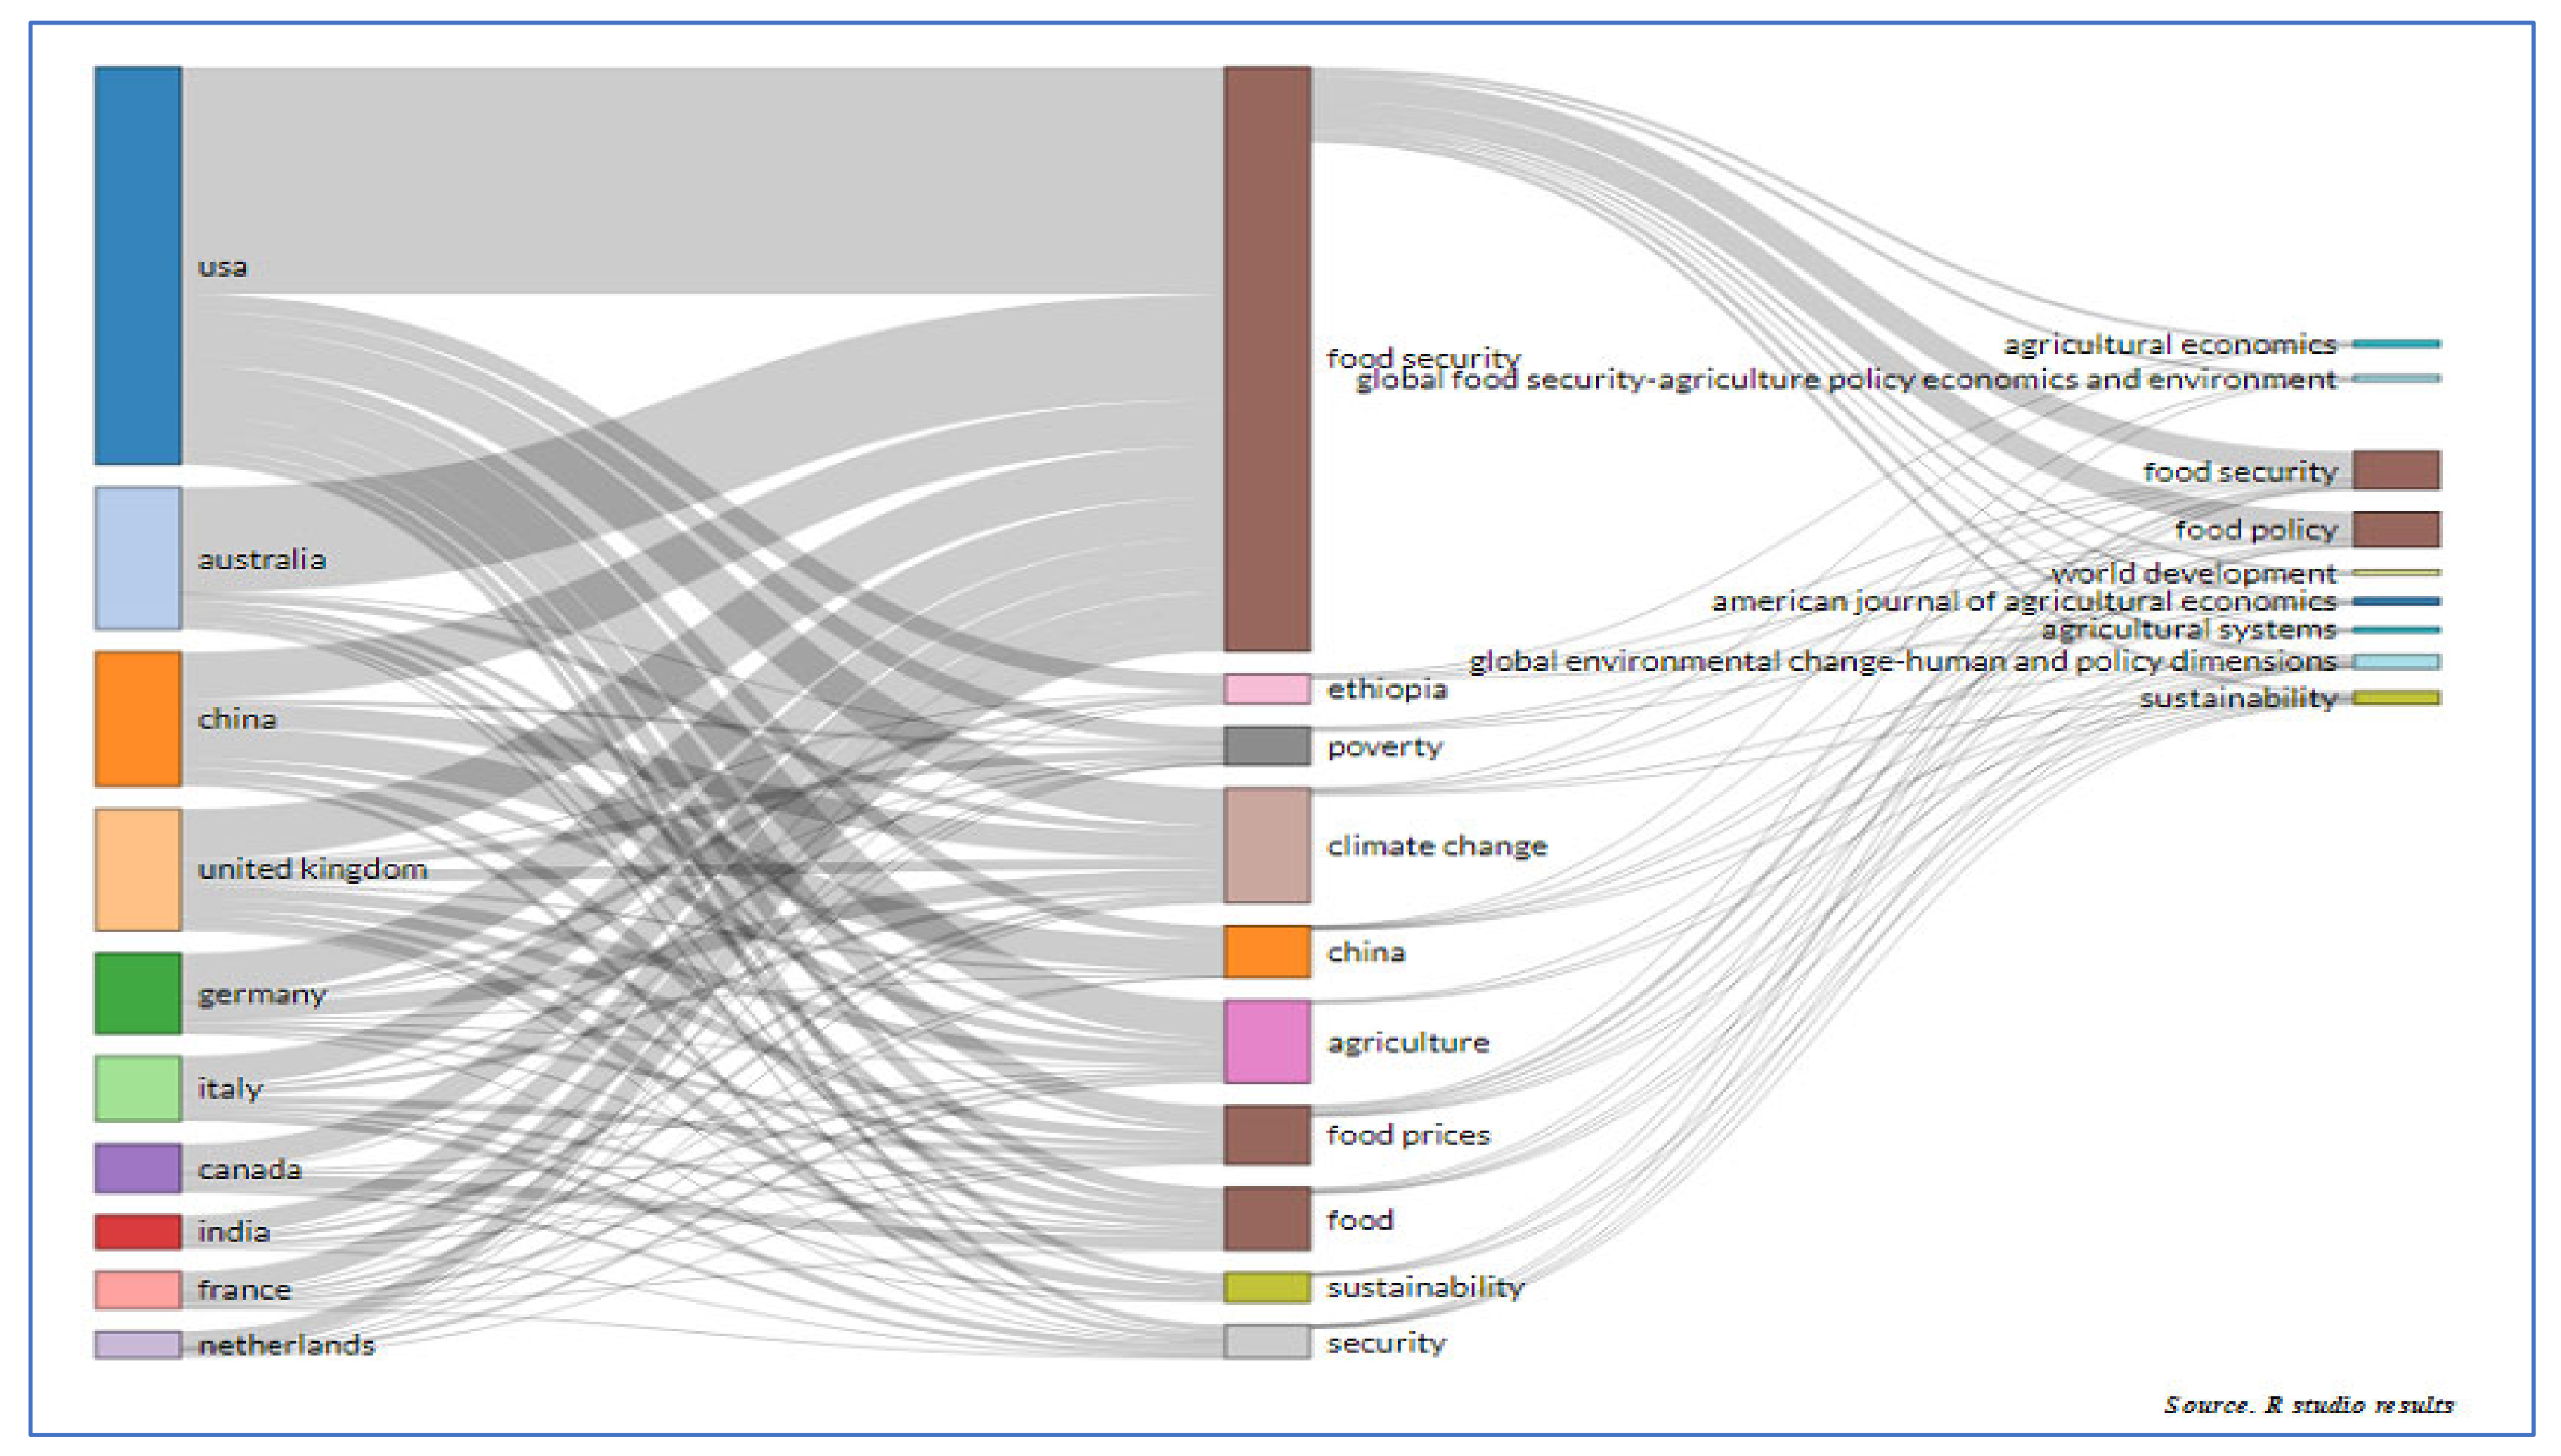
Figure 11 exhibits the link between countries, keywords, and sources. The rectangle’s size describes the importance of the word: the bigger the rectangle, the more important the country, keyword, and journal.
This supports what was analyzed in the previous sections. The USA has published more articles on food security. Food security is the most prominent topic that the authors’ keywords have mentioned. The analysis of the top countries, sources, and keywords shows that there were four main countries (i.e., the USA, Australia, and the UK) and four main sources (i.e., food security, food policy, sustainability, and global environmental change-human and policy dimensions) highlighting solid links with the literature’s main research topics (i.e., food security and food prices).
This shows the relations between the countries, the principal authors’ keywords, and sources. This diagram demonstrated which countries treat the food security and food price change of publications, the core author keywords used in these publications, and the sources they have published. As presented in the figure, the USA headed the country list, which focuses on food security as a keyword; their publications are mainly in food security and food policy journals. Climate change was the second important keyword used mainly by American authors.

4. Conclusions

This study is considered the first bibliometric study which joined food security and price change. We presented a statistical analysis of the global scientific literature on food security and price dynamics based on these words. It analyzed the main characteristics of journals, authors, countries, and keywords. It investigated the relationship between them. Developed countries highly participate in developing research in this field, showing essential multinational cooperation. Food policy and food security are the two sources gaining the most citations.
It is highlighted that price, food security, and impact are growing over time in the research keywords. It has been highlighted that not only developing countries are interested in food security and price analysis. It has been found that when maintaining the same income, an increase of 50% in food prices leads to a decrease of 30% in iron intake [49].
Further research is needed to investigate and measure the empirical impact of food price volatility on food security. It is noticeable that climate change, health, and income appeared as merging keywords. This gives the attention to associate the food security assessment with people’s health status, food nutritive values, and the capability of earned income to ensure stable nutritious food. With the spread of COVID-19, it is crucial to develop empirical studies examining the income, price changes, and climate change effects on nutritious food access and agricultural products and food availability (local production and import) during the crisis (e.g., the pandemic).The emerging direction consists of developing research that focuses on the dietary pattern and how the price could reduce the nutrient intake (e.g., zinc, iron, vitamins), which harms health.
Two main limitations are noticed: first, not all papers of 2020 are covered, only six months were considered, and only the Web of Science database was employed to retrieve the publications on food security and the price dynamic. Future analyses could encompass recent years and other databases (e.g., Scopus) to capture the newly emerged scientific article deviations.

Author Contributions

Conceptualization, M.B.A. and M.F.-F.; methodology, M.B.A.; software, M.B.A. and Z.L.; validation, M.B.A., M.F.-F. and Z.L.; formal analysis, M.B.A.; investigation, M.B.A.; resources, M.F.-F.; data curation, M.F.-F.; writing—original draft preparation, M.B.A.; writing—review and editing, M.B.A., M.F.-F., Z.L.; visualization, M.B.A.; supervision, M.F.-F. and Z.L.; All authors have read and agreed to the published version of the manuscript.

Funding

This research received no external funding.

Institutional Review Board Statement

Not applicable

Informed Consent Statement

Not applicable.

Data Availability Statement

Data were taken from the Web of Science (WoS), using the keywords defined in the methodology section.

Conflicts of Interest

The authors declare no conflict of interest.

References

  1. Food and Agriculture Organization of the United Nations. The State of Food Insecurity in the World: How does International Price Volatility Affect Domestic Economies and Food Security? Food and Agriculture Organization of the United Nations, International Fund for Agricultural Development, World Food Programme: Rome, Italy, 2011. [Google Scholar]
  2. De Paulo Farias, D.; de Araújo, F.F. Will COVID-19 affect food supply in distribution centers of Brazilian regions affected by the pandemic? Trends Food Sci. Technol. 2020, 103, 361–366. [Google Scholar] [CrossRef] [PubMed]
  3. Sen, A. Poverty and Famines: An Essay on Entitlement and Deprivation; Labour, Capital & Society, Clarendon Press: Oxford, UK, 1982. [Google Scholar]
  4. Gouel, C. Agricultural price instability: A survey of competing explanations and remedies. J. Econ. Surv. 2010, 26, 129–156. [Google Scholar] [CrossRef] [Green Version]
  5. Galtier, F. Managing food price instability: Critical assessment of the dominant doctrine. Glob. Food Secur. 2013, 2, 72–81. [Google Scholar] [CrossRef]
  6. FOA. Rome Declaration on World Food Security and World Food Summit Plan of Action: World Food Summit; FOA: Rome, Italy, 1996. [Google Scholar]
  7. McGuire, S.; FAO; IFAD; WFP. The State of Food Insecurity in the World 2015: Meeting the 2015 International Hunger Targets: Taking Stock of Uneven Progress. Rome: FAO, 2015. Adv. Nutr. 2015, 6, 623–624. [Google Scholar] [CrossRef] [Green Version]
  8. HLPE. Price Volatility and Food Security; A Report by the High Level Panel of Experts on Food Security and Nutrition of the Committee on World Food Security; HLPE: Rome, Italy, 2011. [Google Scholar]
  9. Ivanic, M.; Martin, W. Implications of higher global food prices for poverty in low-income countries. Agric. Econ. 2008, 39, 405–416. [Google Scholar] [CrossRef] [Green Version]
  10. Rezitis, A.N.; Stavropoulos, K.S. Modeling Pork Supply Response and Price Volatility: The Case of Greece. J. Agric. Appl. Econ. 2009, 41, 145–162. [Google Scholar] [CrossRef] [Green Version]
  11. Piot-Lepetit, I.; M’Barek, R. Methods to Analyse Agricultural Commodity Price Volatility. Methods Anal. Agric. Commod. Price Volatility 2011, 2011, 1–11. [Google Scholar]
  12. Taya, S. Stochastic Model Development and Price Volatility Analysis; OECD Food, Agriculture and Fisheries Papers, No. 57; OECD Publishing: Paris, France, 2012. [Google Scholar] [CrossRef]
  13. Sjauw-Koen-Fa, A. Framework for an Inclusive Food Strategy: Co-Operatives-A Key for Smallholder Inclusion into Value Chains; Economic Research Department of Rabobank Nederland: Utrecht, The Netherlands, 2012. [Google Scholar]
  14. Hernandez, M.A.; Ibarra, R.; Trupkin, D.R. How far do shocks move across borders? Examining volatility transmission in major agricultural futures markets. Eur. Rev. Agric. Econ. 2014, 41, 301–325. [Google Scholar] [CrossRef] [Green Version]
  15. Grace, K.; Brown, M.; McNally, A. Examining the link between food prices and food insecurity: A multi-level analysis of maize price and birthweight in Kenya. Food Policy 2014, 46, 56–65. [Google Scholar] [CrossRef]
  16. Fróna, D.; Szenderák, J.; Harangi-Rákos, M. The challenge of feeding the world. Sustainability 2019, 11, 5816. [Google Scholar] [CrossRef] [Green Version]
  17. The Economist Intelligence Unit. Global Food Security Index 2015. An Annual Measure of the State of Global Food Security; The Economist Intelligence Unit Limited: London, UK, 2015. [Google Scholar]
  18. Laborde, D.; Martin, W.; Swinnen, J.; Vos, R. COVID-19 risks to global food security. Science 2020, 369, 500–502. [Google Scholar] [CrossRef]
  19. Arndt, C.; Davies, R.; Gabriel, S.; Harris, L.; Makrelov, K.; Robinson, S.; Levy, S.; Simbanegavi, W.; van Seventer, D.; Anderson, L. Covid-19 lockdowns, income distribution, and food security: An analysis for South Africa. Glob. Food Secur. 2020, 26, 100410. [Google Scholar] [CrossRef]
  20. Mkhawani, K.; Motadi, S.; Mabapa, N.; Mbhenyane, X.; Blaauw, R. Effects of rising food prices on household food security on femaleheaded households in Runnymede Village, Mopani District, South Africa. S. Afr. J. Clin. Nutr. 2016, 29, 69–74. [Google Scholar] [CrossRef] [Green Version]
  21. Alem, Y.; Söderbom, M. Household-Level Consumption in Urban Ethiopia: The Effects of a Large Food Price Shock. World Dev. 2012, 40, 146–162. [Google Scholar] [CrossRef] [Green Version]
  22. Wossen, T.; Berger, T.; Haile, M.G.; Troost, C. Impacts of climate variability and food price volatility on household income and food security of farm households in East and West Africa. Agric. Syst. 2018, 163, 7–15. [Google Scholar] [CrossRef]
  23. United Nations. The Sustainable Development Goals Report; United Nations Publications: New York, NY, USA, 2018. [Google Scholar]
  24. Kalkuhl, M.; Von Braun, J.; Torero, M. Food Price Volatility and Its Implications for Food Security and Policy; Springer: Cham, Switzerland, 2016. [Google Scholar] [CrossRef] [Green Version]
  25. Huffaker, R.; Canavari, M.; Muñoz-Carpena, R. Distinguishing between endogenous and exogenous price volatility in food security assessment: An empirical nonlinear dynamics approach. Agric. Syst. 2018, 160, 98–109. [Google Scholar] [CrossRef]
  26. Novickytė, L. Risk in agriculture: An overview of the theoretical insights and recent development trends during last decade—A review. Agric. Econ. 2019, 65, 435–444. [Google Scholar] [CrossRef]
  27. Popp, J.; Balogh, P.; Oláh, J.; Kot, S.; Rákos, M.H.; Lengyel, P. Social Network Analysis of Scientific Articles Published by Food Policy. Sustainability 2018, 10, 577. [Google Scholar] [CrossRef] [Green Version]
  28. De Bakker, F.G.; Groenewegen, P.; Den Hond, F. A bibliometric analysis of 30 years of research and theory on corporate social responsibility and corporate social performance. Bus. Soc. 2005, 44, 283–317. [Google Scholar] [CrossRef] [Green Version]
  29. Van Eck, N.J.; Waltman, L. Visualizing bibliometric networks. In Measuring Scholarly Impact; Springer: Cham, Switzerland, 2014; pp. 285–320. [Google Scholar]
  30. Sarkodie, S.A.; Owusu, P.A. Bibliometric analysis of water–energy–food nexus: Sustainability assessment of renewable energy. Curr. Opin. Environ. Sci. Health 2020, 13, 29–34. [Google Scholar] [CrossRef]
  31. Bouzembrak, Y.; Klüche, M.; Gavai, A.; Marvin, H.J. Internet of Things in food safety: Literature review and a bibliometric analysis. Trends Food Sci. Technol. 2019, 94, 54–64. [Google Scholar] [CrossRef]
  32. Skaf, L.; Buonocore, E.; Dumontet, S.; Capone, R.; Franzese, P. Applying network analysis to explore the global scientific literature on food security. Ecol. Inform. 2020, 56, 101062. [Google Scholar] [CrossRef]
  33. Wahyuni, H.; Vanany, I.; Ciptomulyono, U. Food safety and halal food in the supply chain: Review and bibliometric analysis. J. Ind. Eng. Manag. 2019, 12, 373–391. [Google Scholar] [CrossRef]
  34. Sweileh, W.M. Bibliometric analysis of peer-reviewed literature on climate change and human health with an emphasis on infectious diseases. Glob. Health 2020, 16, 1–17. [Google Scholar] [CrossRef] [PubMed]
  35. Okumus, B.; Koseoglu, M.A.; Ma, F. Food and gastronomy research in tourism and hospitality: A bibliometric analysis. Int. J. Hosp. Manag. 2018, 73, 64–74. [Google Scholar] [CrossRef]
  36. Chen, D.; Zhang, P.; Luo, Z.; Zhang, D.; Bi, B.; Cao, X. Recent progress on the water–energy–food nexus using bibliometric analysis. Curr. Sci. 2019, 117, 577. [Google Scholar] [CrossRef]
  37. Pritchard, A. Statistical bibliography or bibliometrics. J. Doc. 1969, 25, 348–349. [Google Scholar]
  38. Kumar, B.; Sharma, A.; Vatavwala, S.; Kumar, P. Digital mediation in business-to-business marketing: A bibliometric analysis. Ind. Mark. Manag. 2020, 85, 126–140. [Google Scholar] [CrossRef]
  39. Monasterolo, I.; Pasqualino, R.; Janetos, A.C.; Jones, A. Sustainable and Inclusive Food Systems through the Lenses of a Complex System Thinking Approach—A Bibliometric Review. Agriculture 2016, 6, 44. [Google Scholar] [CrossRef] [Green Version]
  40. Gupta, B.; Bhattacharya, S. Bibliometric approach towards mapping the dynamics of science and technology. Bull. Inf. Technol. 2004, 24, 3–8. [Google Scholar] [CrossRef]
  41. Harzing, A.-W.; Alakangas, S. Google Scholar, Scopus and the Web of Science: A longitudinal and cross-disciplinary comparison. Scientometrics 2016, 106, 787–804. [Google Scholar] [CrossRef]
  42. Liu, W. Accuracy of funding information in Scopus: A comparative case study. Scientometrics 2020, 124, 803–811. [Google Scholar] [CrossRef]
  43. Aria, M.; Cuccurullo, C. bibliometrix: An R-tool for comprehensive science mapping analysis. J. Infometr. 2017, 11, 959–975. [Google Scholar] [CrossRef]
  44. Lotka, A.J. The frequency distribution of scientific productivity. J. Wash. Acad. Sci. 1926, 16, 317–323. [Google Scholar]
  45. Hirsch, J.E. An index to quantify an individual’s scientific research output. Proc. Natl. Acad. Sci. USA 2005, 102, 16569–16572. [Google Scholar] [CrossRef] [PubMed] [Green Version]
  46. Muñoz-Leiva, F.; Viedma-Del-Jesús, M.I.; Sánchez-Fernández, J.; López-Herrera, A.G. An application of co-word analysis and bibliometric maps for detecting the most highlighting themes in the consumer behaviour research from a longitudinal perspective. Qual. Quant. 2012, 46, 1077–1095. [Google Scholar] [CrossRef]
  47. Brown, M.T.; Ulgiati, S. Understanding the global economic crisis: A biophysical perspective. Ecol. Model. 2011, 223, 4–13. [Google Scholar] [CrossRef]
  48. Wang, L.; Zheng, J. China’s rise as a new paradigm in the world economy: Preliminaries. J. Chin. Econ. Bus. Stud. 2012, 10, 301–312. [Google Scholar] [CrossRef]
  49. Bouis, H. Rising Food Prices will Result in Severe Declines in Mineral and Vitamin Intakes of the Poor; Harvest Plus: Washington, DC, USA, 2008. [Google Scholar]
Figure 1. Distribution and cumulative publication over the years. Source. Own elaboration based on R studio output.
Agriculture 11 00263 g001
Figure 2. Lotka’s law curve. Source R studio results.
Agriculture 11 00263 g002
Figure 3. Classification of journals according to the publication number. Source R studio results.
Agriculture 11 00263 g003
Figure 4. Authors’ production over time. Source. R studio results.
Agriculture 11 00263 g004
Figure 5. Keywords co-occurrence analysis. Source R: studio results.
Agriculture 11 00263 g005
Figure 6. Keywords dendrogramusing a hierarchical clustering method. Source R studio results.
Agriculture 11 00263 g006
Figure 7. Change and evolution of keywords over time. Source R studio results.
Agriculture 11 00263 g007
Figure 8. Word map of keywords. Source R studio results.
Agriculture 11 00263 g008
Figure 9. Strategic map of publications up to 2008. Source R studio results.
Agriculture 11 00263 g009
Figure 10. The strategic map of topics between 2009 and 2021. Source R studio results.
Agriculture 11 00263 g010
Figure 11. Three fields plot: relations between countries (left), author keywords (middle), and sources (right). Source R studio results.
Agriculture 11 00263 g011
Table 1. Main information about retrieved data from the Web of Science.
DescriptionResults
Time1979–2020
Sources (Journals, Books, etc.)429
Documents899
Average years from publication6.2
Average citations per document14.19
Average citations per year per doc1.843
References33,244
Article815
Article; book chapter45
Article; data paper1
Article; early access13
Article; proceedings paper25
Keywords Plus 1489
Author’s Keywords 2505
Authors2566
Author Appearances2904
Authors of single-authored documents167
Authors of multi-authored documents2399
Single-authored documents182
Documents per Author0.35
Authors per Document2.85
Co-Authors per Document3.23
Collaboration Index3.35
Table 2. The number of articles published by the number of corresponding authors.
B = Number of ArticlesN. of AuthorsA = Frequency
123140.902
22030.079
3290.011
4120.005
530.001
630.001
820.001
Source R studio results.
Table 3. Journals’classification based on their impact.
Sourceh_IndexTotal CitationsStart Year
Food Policy2013251993
Food Security158332009
Global Environmental Change-Human and Policy Dimensions115842010
Agricultural and Forest Meteorology24492003
World Development104091988
American Journal of Agricultural Economics53001992
Agricultural Economics82982001
Proceedings of the National Academy of Sciences of the United States of America32562012
Journal of Nutrition62542010
Philosophical Transactions of the Royal Society a-mathematical physical and engineering sciences32452011
Source R studio results.
Table 4. Distribution of authors of single and multiple documents.
AuthorsNumber of Publications
Authors2566
Authors of single-authored documents167
Authors of multi-authored documents2399
Source R studio results.
Table 5. The dominance of authors.
AuthorDominance FactorMulti-AuthoredFirst Authored Rank by Articles Rank by DF
1Groshans G.R.1.0005531
2Brown M.E.0.7504382
3Dawe D.0.6663263
4Timmer C.P.0.5002114
5Huang J.0.5006334
6Anderson K.0.5002164
7Goetz L.0.5004284
8Hertel T.W.0.5004284
9Dorosh P.A.0.4005219
10Havlik P.0.16661310
Source R studio results.
Table 6. Authors’ productivity classificationby total h_index.
Authorh_Indexg_Indexm_IndexTCNPPY_Start
Dorosh P.A.780.35021682001
Timmer C.P.680.28615582000
Brown M.E.360.2005162006
Havlik P.660.54553062010
Huang J.460.5008262013
Anderson K.450.1906252000
Dawe D.450.2867352007
Obersteiner M.550.45541952010
Durand-morat A.240.3333642015
Glauben T.240.2504242013
Source R studio results.
Table 7. Classification of corresponding author’s country and scientific production.
Countries Total Articles (SCP + MCP)Single Country Publication (SCP)Multiple Country Publication (MCP)MCP Frequency
1USA238171670.2683
2Australia6450140.0722
3United Kingdom5430240.0609
4China5130210.0575
5Italy3822160.0428
6Germany3720170.0417
7India343040.0383
8Canada251960.0282
9France2312110.0259
10South Africa231940.0259
Source R studio results.
Table 8. Top ten author keywords and their co-occurrence.
KeywordsCo-Occurrences
food security77
security56
agriculture55
impact53
climate-change49
impacts48
price44
health39
poverty39
management38
insecurity35
Source R studio results.
Publisher’s Note: MDPI stays neutral with regard to jurisdictional claims in published maps and institutional affiliations.

