Article

Papaya (Carica papaya L.) Phenology under Different Agronomic Conditions in the Subtropics

1
Producción Vegetal en Zonas Tropicales y Subtropicales, Instituto Canario de Investigaciones Agrarias, Carretera del Boquerón s/n, Valle de Guerra, 38270 San Cristóbal de La Laguna, Tenerife, Spain
2
Área de Ingeniería Agroforestal, Universidad de La Laguna, Ctra. General de Geneto, 2, 38200 San Cristóbal de La Laguna, Tenerife, Spain
3
Oficina de Extensión Agraria y Desarrollo Rural de Tejina, Cabildo Insular de Tenerife, Camino Palermo, 2, 38260 San Cristóbal de La Laguna, Tenerife, Spain
*
Author to whom correspondence should be addressed.
Agriculture 2021, 11(2), 173; https://doi.org/10.3390/agriculture11020173
Submission received: 28 December 2020 / Revised: 12 February 2021 / Accepted: 17 February 2021 / Published: 20 February 2021
(This article belongs to the Section Agricultural Technology)

Abstract

:
European consumers have perceived that papaya fruits produced in subtropical areas (the Canary Islands and Mediterranean regions) do not have the desired quality at certain periods of the year. Thus, the development of technical and management strategies to optimize the yield and the quality of the fruit requires crop phenology studies. Meteorological variables (air temperature, relative humidity, and photosynthetically active radiation) and morphological characteristics (plant height, leaf emission rate, and leaf area) were recorded throughout the crop cycle. All the leaves and fruits were labeled in their anthesis week to calculate the source–sink ratio and to study the development and quality of the fruits. Data were collected in three commercial orchards representing two different types of systems, greenhouse and screenhouse, and two different regions: two plastic cover greenhouses located in the south (SP) and in the north (NP) of Tenerife, and one 40-mesh net screenhouse in the north of the island (NN). The selection of these cultivation systems and locations was made deliberately, so that the ambient variables within these crop protection structures were different throughout the cultivation cycle in order to better fit the model construction. The results suggested that in order to maintain good fruit quality, better environmental control is necessary inside the greenhouses and the screenhouse. Monitoring variables such as the growing degree days, the photosynthetically active radiation, and the number of fruits per plant leaf area ratio provided useful information for papaya production management in the Canary Islands and other subtropical areas, allowing farmers to predict harvest and fruit quality.

1. Introduction

In recent years, papaya (Carica papaya L.) cultivation has increased rapidly, even in subtropical areas, due to its beneficial properties: nutraceutical (i.e., contains considerable concentrations of proteolytic enzymes such as papain and chymopapain); antiviral, antifungal, and antibacterial properties; it contains vitamins, bioactive compounds, and a lipidic composition that reduces inflammatory markers and anti-platelet aggregation, protects against thrombogenesis and oxidative stress, and prevents hypercholesterolemia [1,2]. Spain is the largest papaya producer in Europe (350 ha, with an annual production of around 15,000 tons), the Canary Islands being the largest producer (farms totalizing 300 ha). In the South-East of Spain, Sicily, or Turkey, the cultivation of papaya is growing as an economic opportunity, due to its proximity to the European market, and to diversify agricultural production.
In the subtropics, papaya must be produced inside environment modification structures, such as greenhouses or screenhouses, in order to adjust the meteorological conditions to the crop requirements to obtain optimal fruit production and quality. The papaya cultivar and the cultural techniques for its production are also important aspects to consider. Poor quality can lead to consumer rejection, with consequent economic losses and mistrust in papaya of subtropical origin. In addition, greenhouses reduce water consumption and provide protection to prevent foliage damage due to the effects of wind and the Papaya ringspot virus (PRV) [3].
In the Canary Islands, the structures that are currently used for papaya cultivation are mostly derived from those over 4-m-high and made of galvanized steel tubes that were previously dedicated to other crops such as tomatoes and, to a lesser extent, bananas. The covering material selected (a net or a combination of polyethylene film with screen vents in the roof and side walls) is aimed at increasing light transmittance, night temperatures, or ventilation rates during the day, depending on the ambient conditions of the site. On islands with pronounced relief, such as Tenerife, the northern slope is windward oriented and, therefore, is exposed to the humid north-eastern trade winds. The trade winds’ moist air masses contribute, in certain seasons, to higher ambient humidity, cloud formation, reduction of solar radiation, and temperatures compared to the conditions at the southern slope of the island. Typically, simple structures are used without any climate control system such as forced ventilation, heating, or cooling. This lack of controlled environment often causes extreme conditions inside the greenhouses: high temperatures at midday, especially in hot summers, and large thermal amplitude in winter. These conditions have an important impact on plant development and yield since the photosynthetic response of papaya is strongly linked to them [4].
Nevertheless, papaya cultivation under plastic-covered greenhouses can have negative effects on production. Flowering can be affected by plastic covers that can reduce solar radiation transmission inside the greenhouse below the optimum level, especially in winter (when days are cloudier and shorter than in the other seasons), but also cause excessive increase in temperature during summer [5]. Additionally, suboptimal micrometeorological conditions inside the greenhouse can promote the development of pests and diseases.
Nakasone and Paull [6] reported that environmental variables such as light, temperature, ambient humidity, wind speed, edaphic characteristics, and biotic factors such as mycorrhizal fungi and genotype, significantly affect the physiology and productivity of papaya crop. Knowledge of how the papaya crop responds to these environmental conditions provides a scientific basis for the development of management strategies to optimize fruit yield and quality. This is especially useful in subtropical areas with suboptimal conditions for growing papaya. In the Canary Islands, the yield and quality of papaya fruits is not continuous throughout the year, with low-quality fruit in spring and reduced production in summer due to alterations in the fruit maturation and in the flowering capability during the winter.
Factors affecting fruit sugar content are complex and include genotype, crop deterioration, foliage damage (from winds, pests, or diseases), soil nutrition deficiency, and environmental factors. Generally, once a genotype is selected, the environmental conditions and foliage damage influence the photosynthetic capacity of the plant and, consequently, fruit carbohydrate accumulation [7]. Therefore, it is necessary to improve the knowledge about papaya crop phenology under the specific meteorological conditions associated with the specific characteristics of the greenhouses, the altitude, the orientation, etc. This can contribute to developing new management strategies oriented to maintain a steady marketable fruit supply all year round. The consequences of COVID-19 have highlighted the need to promote the prioritization of the consumption of zero-kilometer products, or those with a low carbon and water footprint, which favors local rural development.
Thus, the objective of this study is to obtain a model using ambient conditions (temperature, relative humidity, and photosynthetically active radiation) and growth parameters (plant height, leaf emission rate, leaf number, and leaf area) to predict the yield and fruit quality of papaya. For this purpose, data were collected on crops grown inside two types of protection structures, a greenhouse and a screenhouse, located in two different agroclimatic regions in Tenerife.

2. Materials and Methods

2.1. Plant Material and Experimental Conditions

The experiments were conducted in Tenerife, Canary Islands (Spain), in three papaya commercial orchards under different types of structures over two cropping seasons (2015–2016 and 2016–2017). One of the greenhouses, denoted as SP and located in the south of the island (28°10′21″ N; 16°48′19″ W; 32.13 m a.s.l.), used polyethylene film cover. The other two were located in the north, but while the one denoted as NP (28°32′32″ N; 16°22′60″ W; 51.75 m a.s.l.) also used polyethylene film cover, the other one, a screenhouse named as NN (28°32′25″ N; 16°22′56″ W; 67.63 m a.s.l.), utilized a 40-mesh net cover. The surface areas were approximately 0.76, 1.10, and 0.23 ha for SP, NP, and NN, respectively. Their orientations were NW-SE, N-S, and N-S, respectively. The structure of the selected greenhouses was similar, with a frame made of galvanized steel pipe (5 to 10 cm in diameter and 7 to 10 m in length) placed embedded in concrete bases at a 6 × 3 m spacing scheme. The cover was sandwiched between a double-weave wire network. The SP and NP greenhouses had a height of 7 m at the gutter and 8 m at the ridges and were covered with a 200-µm-thick single-layer polyethylene film on the roof with 1-m-wide insect-proof screens, ventilation strips every 6 m, and 40-mesh insect-proof screens on the sidewalls. The NN greenhouse had a lower height (5 m at the gutter and 6 m at the ridge) and was totally covered with a 40-mesh insect-proof screen. These greenhouses and the screenhouse had a small roof slope (<1%) and no active climate control equipment was installed.
The plant material was the cultivar “Sweet Mary”, provided by the company Cuplamol S.L. (Tenerife, Spain). This hybrid is characterized by its orange pulp, with an average weight of 1.35 kg and a total soluble solids content (TSS) ranging from 11 to 13 °Brix. The expected productivity, under good technical management, is approximately 90 t per ha during its commercial lifespan of 18 to 24 months. The plants from the commercial nursery were transplanted into the greenhouses SP and NP on 23 April and 2 May 2015, respectively. The plantation in the NN screenhouse was made on 6 July 2015. Leaf area differences in the NP and NN crops during the first months after transplantation and at the start of harvest could be associated with the 2-month difference in the transplanting dates. However, since the crops were monitored during a 2-year period, the influence of this initial difference on the overall results was not considered relevant. Initially, four plants were transplanted per hole, but only one hermaphroditic plant was left at the beginning of flowering, removing the remaining ones. The plantation frame was 1.5 m between plants and 4.0 m between rows, with a density of 1666 plants per hectare. Drip fertigation was applied according to the common fertilization practices in commercial orchards: 1 (N): 0.4–0.6 (P2O5): 1.5–3 (K2O), with the EC of the nutrient solution ranging between 1.2 and 1.8 dS/m, depending on the crop phenological stage, weather conditions, and the irrigation water and soil solution EC. Irrigation requirements were calculated considering the recommended values given by agrometeorological stations located in each area. Crop management practices were common in all greenhouses and the screenhouse: mineral sulfur applications and biological pest control systems to control mites and fungi disease to maintain good leaf health; flower thinning in all the trial plants, keeping two flowers per leaf axil; removal of dry leaves, etc. Inside each orchard, 10 plants (replicates) were selected for monitoring plant parameters.

2.2. Meteorological Data

Inside each greenhouse, placed in the middle of the trial crop area, a weather station (HOBO H21-002 Micro Station, Onset Computer Corporation, Bourne, MA, USA) was installed to monitor ambient variables: temperature (T), relative humidity (RH), and photosynthetically active radiation (PAR) expressed as photosynthetic photon flux density (PPFD). Data were measured at 1-min intervals and averaged at 15-min intervals. One of the most frequently used methods to relate temperature and plant development is the thermal sum, or total growing degree days (GDD), defined as the sum of mean daily temperature above a lower base temperature and below a maximum threshold temperature, for the plant to complete its total cycle or to reach a phenological stage. This variable may be useful for predicting phenological sub-periods, staggering production, genetic breeding programming, harvest season planning, and climatic zoning [8]. The GDD was used to estimate the vegetative growth and productivity [9], to evaluate the growth rate of papaya fruits [10], to establish the relationship between early softening and ambient conditions [11], and to evaluate the performance of papaya varieties in subtropical climate [12]. The relationship between GDD during the fruit development and its TSS has been investigated in other crops such as orange [8], wine grapes [13], or kiwi [14], but not in papaya.
GDD was calculated using the following formulas suggested by Ometto [15] in the three locations studied:
GDD = T max + T min 2 T b   ;   T min > T b   and   T max < T B
GDD = ( T max T b ) 2 2 ( T max T min ) T b   ;   T min < T b   and   T max < T B  
GDD = 2 ( T max T min ) ( T m T b ) + ( T max T min ) 2 ( T max T B ) 2 2 ( T max T min ) T b   ;   T min T b   and   T max T B  
GDD = 0   ;   T max < T b  
where Tm, Tmin, and Tmax are the average, minimum, and maximum air temperatures, respectively. A lower base temperature (Tb) of 15 °C [16] and an upper threshold temperature (TB) of 35 °C were considered.
The vapor pressure deficit (VPD) in kPa was calculated as:
VPD = e s ( 1 RH / 100 )
where RH is the relative humidity (%) and es is the vapor pressure at saturation (kPa) obtained from the air temperature (T in °C) by:
e s = 0.6108 exp ( 17.27 T 237.3 + T )
In order to quantify the possible negative effect of the high VPD values on the plant phenology, the cumulated time with VPD values above 2 kPa (tVPD > 2kPa) was calculated. According to Hoffman [17], an increase in VPD from 1 to 1.8 kPa determines the major reduction in plant growth in various crops, probably due to the photosynthesis depression as a consequence of the reduction in stomatal conductance. A strong negative relationship between VPD and stomatal conductance has been reported in papaya, affecting directly the net carbon assimilation [18,19].

2.3. Morphological Features

Growth parameters (plant height, leaf emission rate, leaf number, and leaf area) were measured monthly from April 2015 to March 2017. The yield parameters (height at first flowering and first available fruit, days from flowering to harvest, and individual weight of all fruits) were measured as well.
The pre-anthesis and post-anthesis phases during the fruit development and growth until harvest were studied separately. The pre-anthesis period was the time lapse between the leaf emission and the anthesis of the bud flower formed in that leaf axil, while the post-anthesis was defined as the time between the anthesis week and the harvesting week. In order to determine the duration for the development of each fruit and the number of fruits per leaf area ratio (NF/LA) during the crop cycle, the anthesis (by tagging the fruit) and the harvesting date of all fruits in the sampled plants were registered. This ratio was adopted, rather than the source–sink ratio, because it is more practical for the farmers. At any time, papaya plants hold many fruits in different development stages, as it is difficult to calculate the sink in weight units. Therefore, the sink was established as the number of fruits produced by the plant. The number of fruits in each plant was calculated by subtracting the number of fruits harvested up to that moment from the total number of labeled fruits. Fruit abortion was considered when no fruit in a leaf axil was observed.

2.4. Total Soluble Solids Content (TSS) Determination

On each harvesting day, all fruits with more than 20% of yellow–orange peel color were collected. After weighing them individually, groups of three fruits were selected randomly to measure TSS. Two samples from opposite sides of the equatorial pulp perimeter of each fruit were used for TSS determination using a hand refractometer ATAGO (model ATC-1 Atago Co., Tokyo, Japan).

2.5. Statistical Analysis

Statistical analysis was carried out with the Statgraphics Plus software version 5.1 (Statistical Graphics, Rockville, USA). Grubbs’ test was applied to detect outliers in the dataset. Analysis of variance (ANOVA) and Fisher’s Least Significant Difference (LSD) test at 5% significance level were applied to assess significant differences between locations and seasons. The relationship between the different morphological and ambient variables was determined by multilinear regression using half of the dataset available. The remaining data were used for verification of the multilinear regression models obtained. This verification was carried out graphically with the scatterplot of observations vs. model predicted values, and based on two goodness-of-fit indicators: the Nash and Sutcliffe coefficient of efficiency, NSE (a dimensionless index), and the root mean squared error, RMSE (in units of the predicted variable). The NSE takes values from −∞ to 1 and the RMSE ranges from 0 to ∞, such that NSE = 1 and RMSE = 0 indicate a perfect fit [20]. The FITEVAL tool, proposed by these authors, was used for assessing the goodness-of-fit statistical significance. This software allows for quantifying model performance into four classes (unsatisfactory, acceptable, good, or very good) according to the NSE. In addition, it provides information for statistically accepting the goodness-of-fit at a significance level α. Here, we have adopted the significance level of α = 0.05, such that the p-value here indicates the probability of wrongly accepting the fit, while it is unsatisfactory.

3. Results

3.1. Meteorological Conditions

Figure 1 shows the boxplots of the daily average meteorological variables registered inside the greenhouses and the screenhouse for each season (spring, summer, autumn, and winter). As expected, the winter was the coolest season (with the minimum values of GDD and T, Figure 1a,b). Significant differences in the thermal conditions between the different locations were identified, in agreement with their outdoor values (results not shown). The GDD was significantly higher during autumn and winter in SP and during spring in NP than in the other seasons. In summer, no significant difference was found between both plastic-covered greenhouses. NN showed lower GDD in spring and summer, probably as a consequence of its lower thermic capacity. Furthermore, NN showed significantly lower values for Tmax and Tmin in all seasons (Figure 1c,d) than those observed in both plastic-covered greenhouses.
The total daily time with VPD > 2kPa (tVPD > 2kPa) (Figure 1e) exhibits variations between the environment modification structures and seasons studied. The tVPD > 2kPa was significantly higher in NP during spring and summer and in SP during autumn, while no significant difference was found in winter between greenhouses and screenhouse. Better air ventilation rates and lower temperature may explain the reduced tVPD > 2kPa values in NN in the warmest seasons (spring and summer). It is worth noting that large coefficient of variation values were obtained for the tVPD > 2kPa in all locations, likely due to the large relative humidity gradient between midday and night, or to the incidence of extreme weather events (values near to 0 h during cloudy and fresh days up to a maximum value of 23 h in the south side when dry dusty winds from the Sahara were present).
Finally, the results showed that, as in other subtropical areas, the photosynthetically active radiation (PAR) decreased during autumn and winter (Figure 1f). Furthermore, transmittance inside the greenhouses was around 60–70%, reducing incident PAR above the canopies. The total daily PAR (DPAR) was higher in SP in autumn and winter than in the other greenhouses studied, consistent with its outdoor values (results not shown). No significant difference was found during summer between greenhouses, or in spring between both plastic-covered greenhouses. Nevertheless, the screenhouse showed its maximum DPAR in spring, higher than in NP, related to the screen washout caused by the rainfall during the late winter–early spring that cleaned up the dust accumulation between the net filaments (PAR transmission ranged from 62% in autumn to 73% in spring). Autumn was the season with lower radiation exposure in both locations, with minimum/maximum values of 8.45/28.52 mol m−2 day−1 in the south of the island, and 2.38/27.91 mol m−2 day−1 in the north.

3.2. Morphological Features

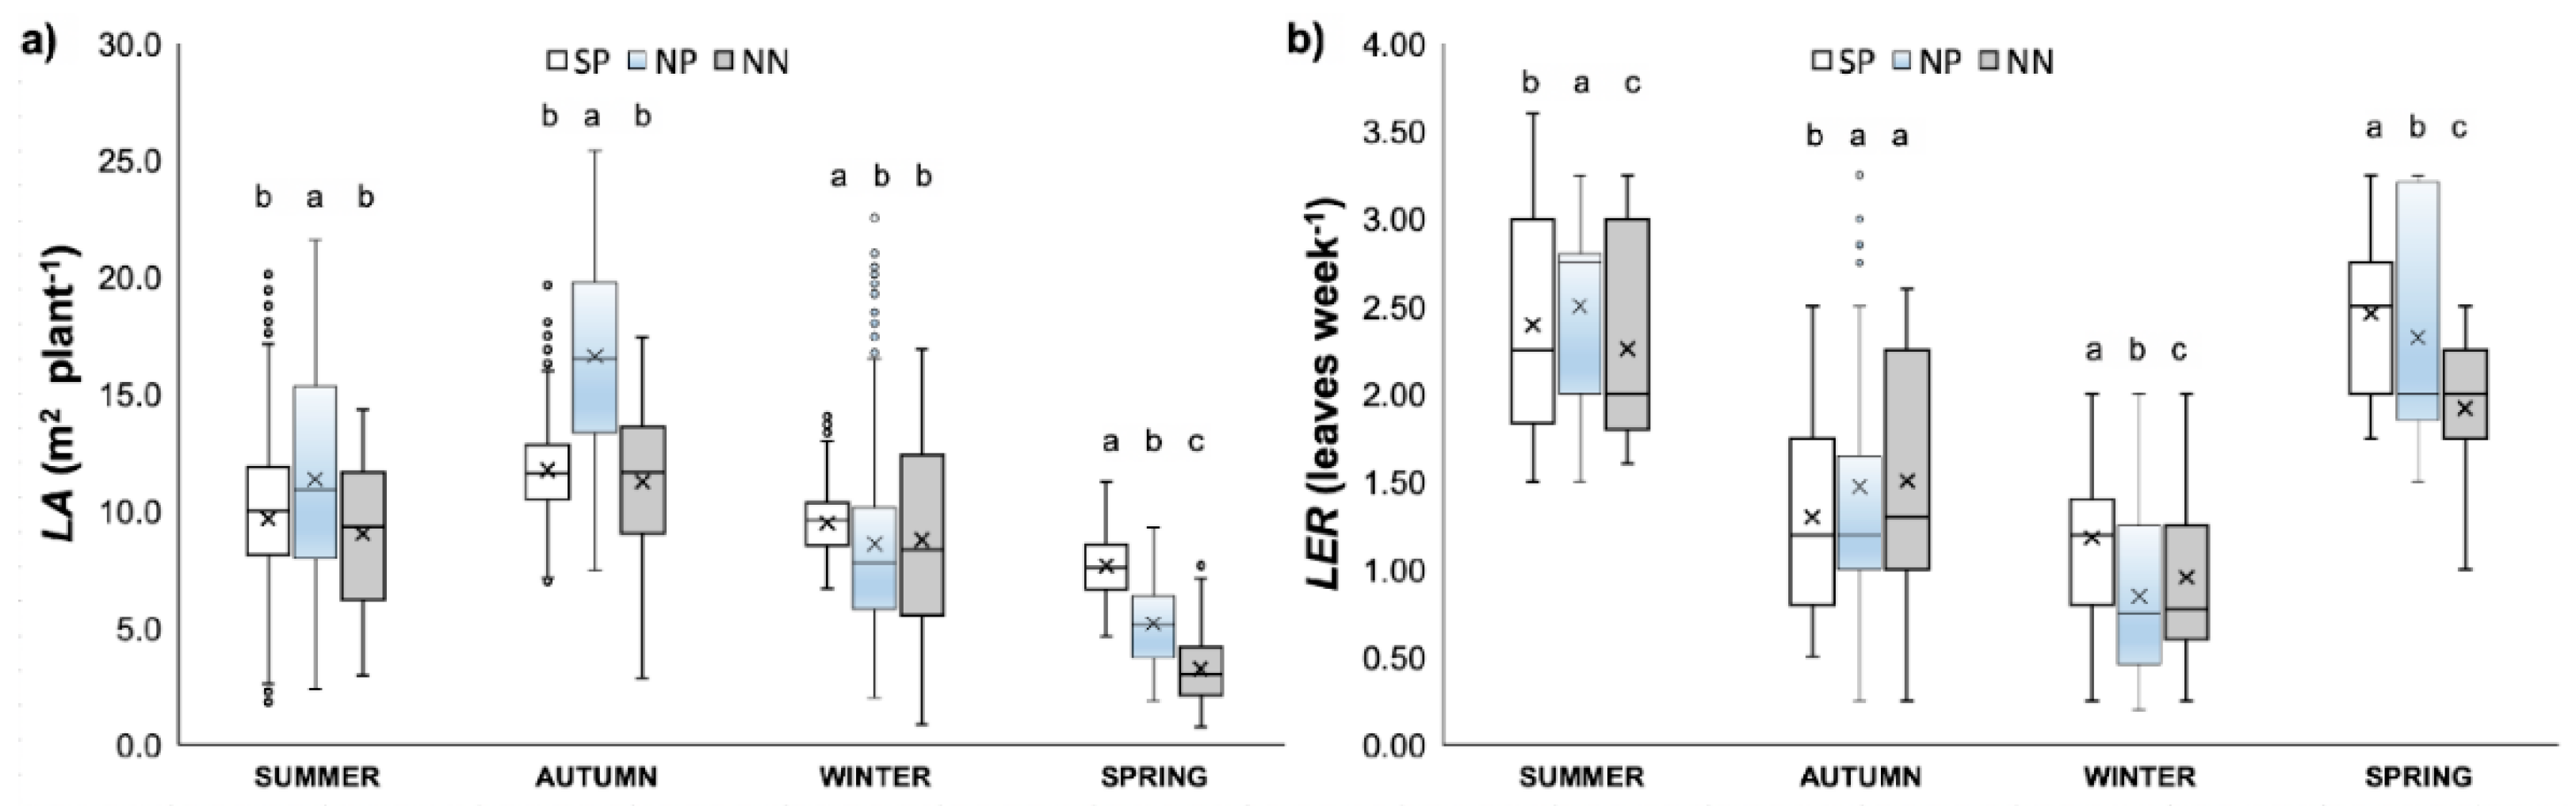
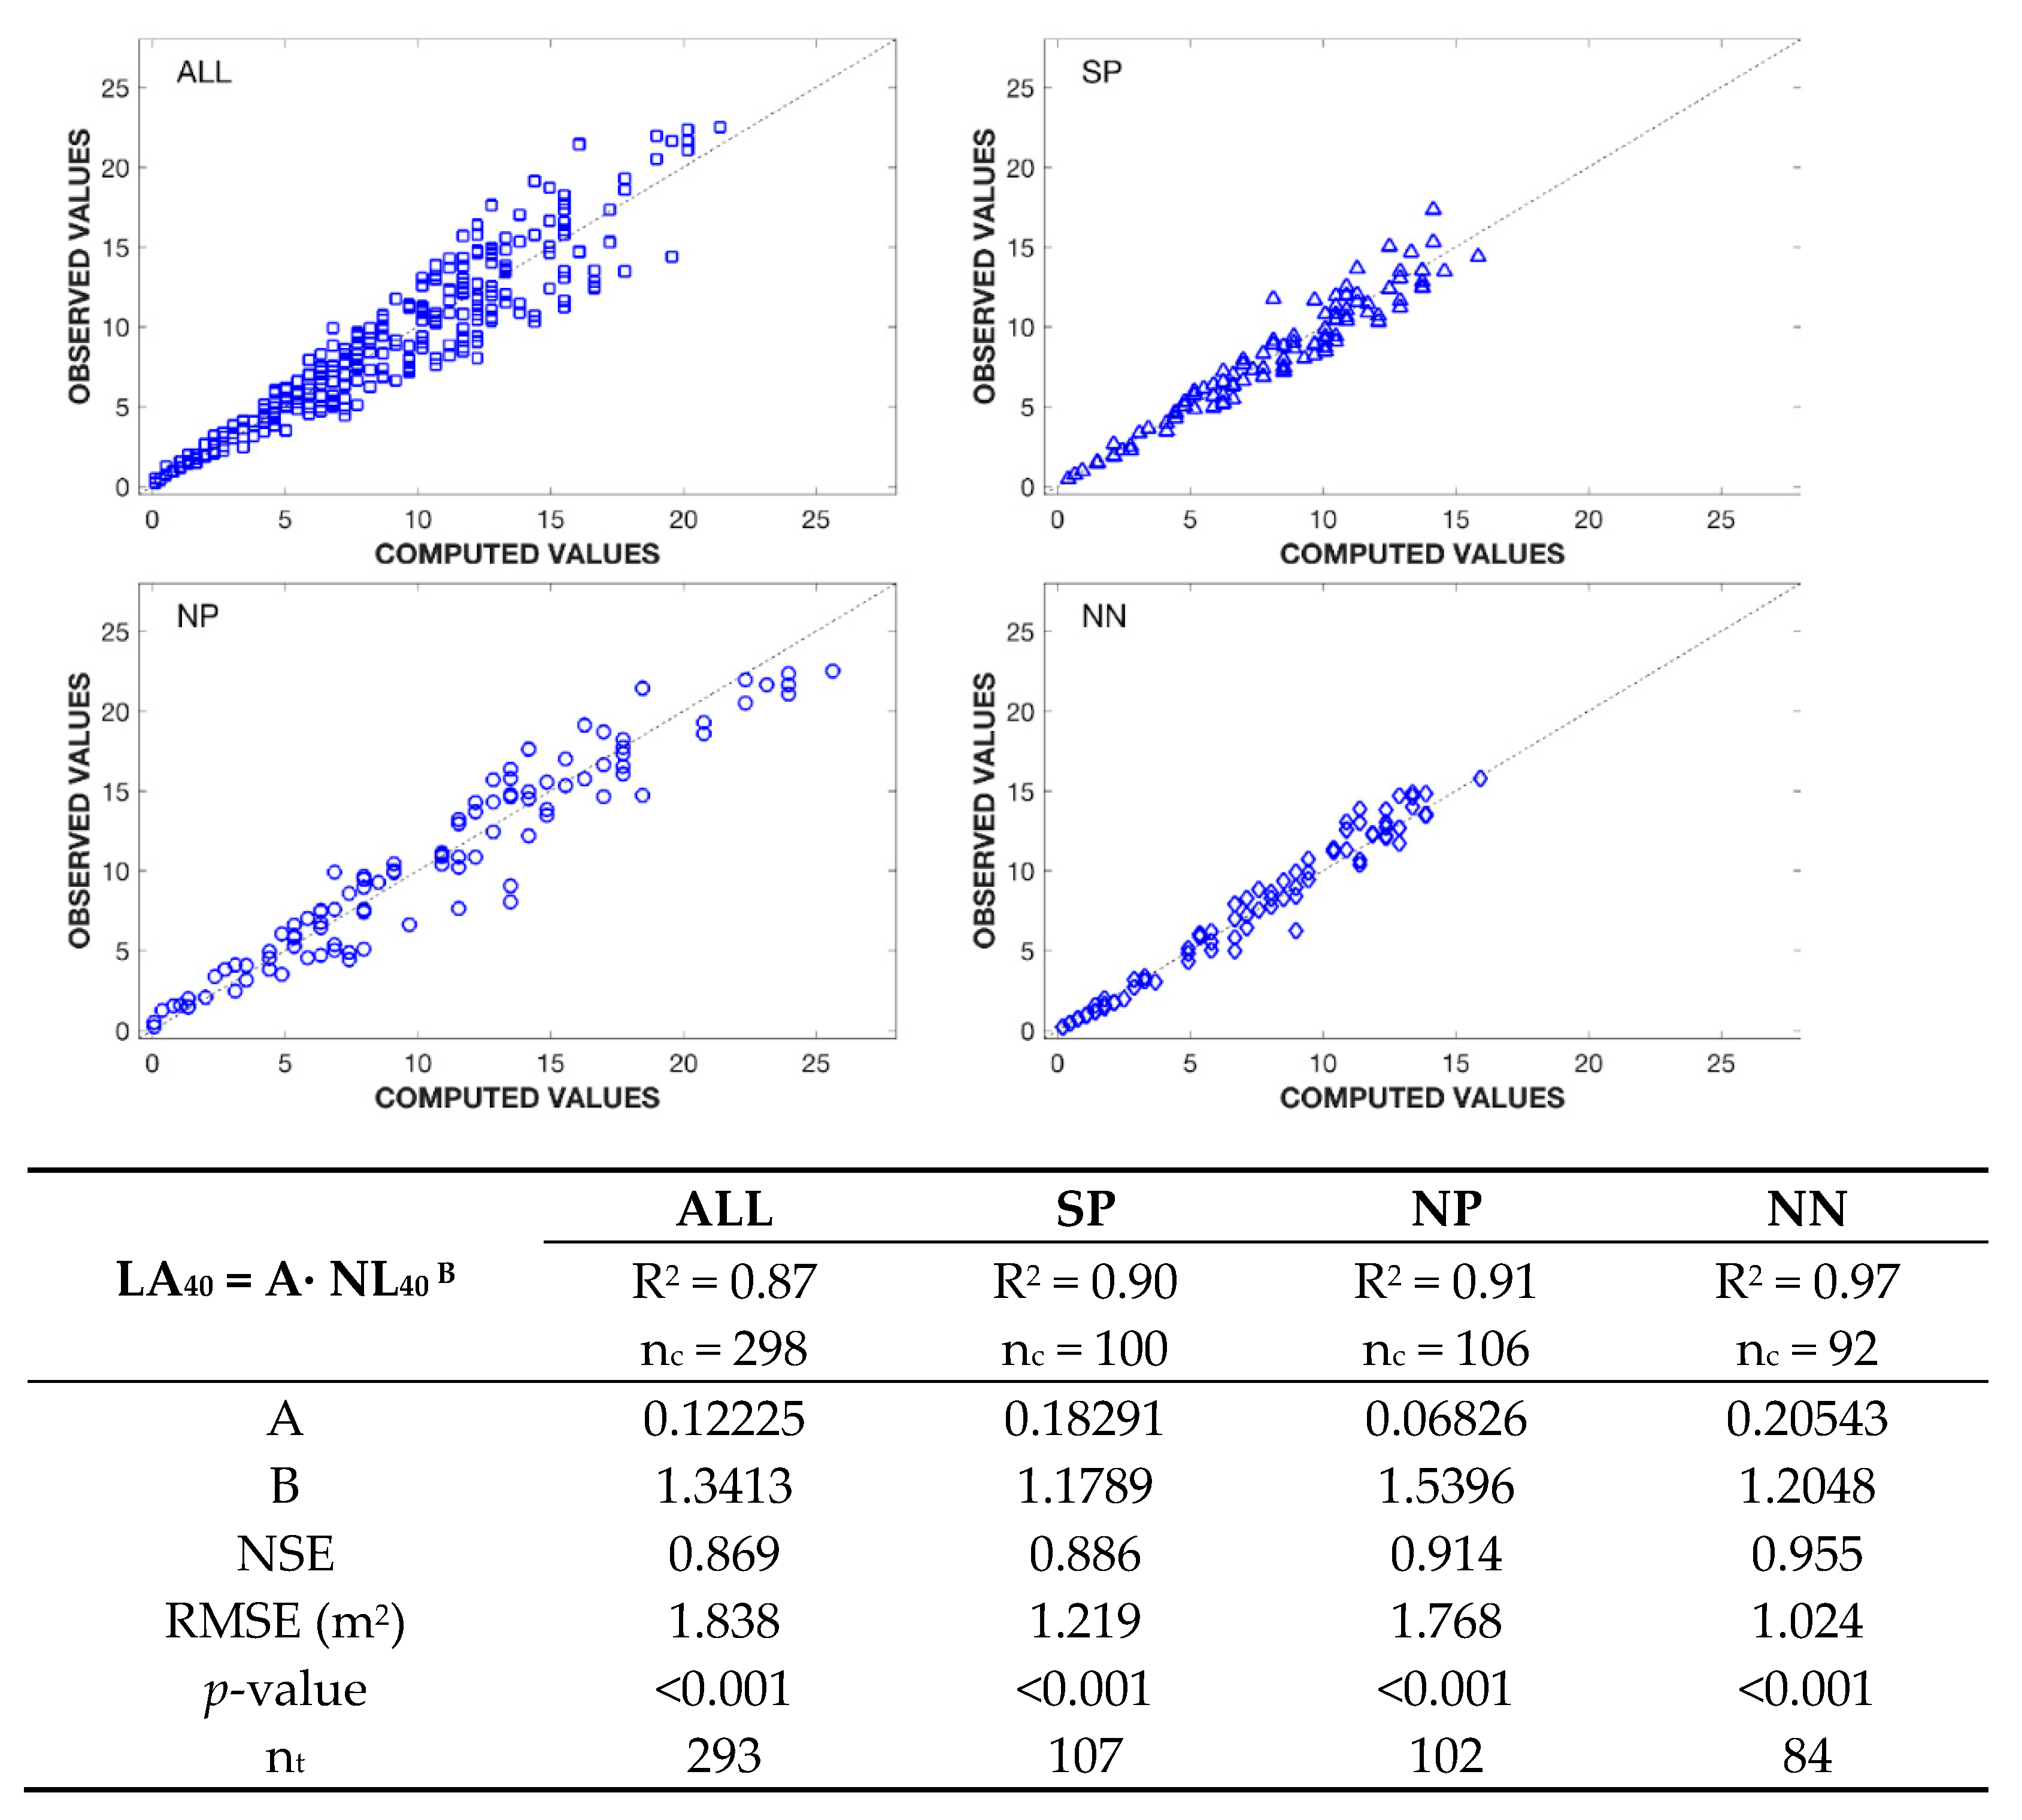
3.2.1. Phenology of the Canopy Development

A mathematical regression model was obtained to compute the leaf surface of each leaf, measuring the length of the leaf midrib. The regression between the single leaf area (sLA in cm2) and the length of the leaf midrib (LLM in cm) was obtained by sampling leaves (n = 75) destructively from other similar plants in the same orchard. The leaf area was determined by digital image analysis using the software ImageJ (National Institutes of Health, Bethesda, MD, USA). The resulting equation for predicting single leaf area from the length of the leaf midrib obtained by regression (R2 = 0.975) is given by:
sLA = (1.41·LLM − 10.07)2
The plant leaf area (LA) was determined as the sum of each single leaf area (sLA), and its statistical analysis indicates that, in general, LA first increased during the summer, then reached a peak in autumn, and finally declined during winter. The lowest LA values were observed in NN during the spring (3.25 ± 1.44 m2) and the highest in NP during the autumn (16.63 ± 4.00 m2). The LA in SP showed average values significantly higher in winter and spring than the average values in the other greenhouse or the screenhouse, while during summer and autumn, larger average LA values were observed in NP (Figure 2a).
The average values of leaf emission rate (LER) were lowest in NP during winter (0.85 ± 0.45 leaves emitted per week) and highest in the same orchard in summer (2.50 ± 0.44 leaves emitted per week). Similar values were observed in the greenhouses and the screenhouse, with lower values in winter and the highest values in summer (Figure 2b).

3.2.2. Phenology of the Pre-Anthesis Flower Development

The season with lower fruit set was autumn (81.50% aborted nodes) in SP, while in the northern greenhouse and screenhouse, it was winter (94.67% and 93.13% aborted nodes in NP and NN, respectively). The highest fruit set season was spring in SP (17.15% aborted nodes), while in NP and NN, it was summer (19.54% and 22.13%, respectively).

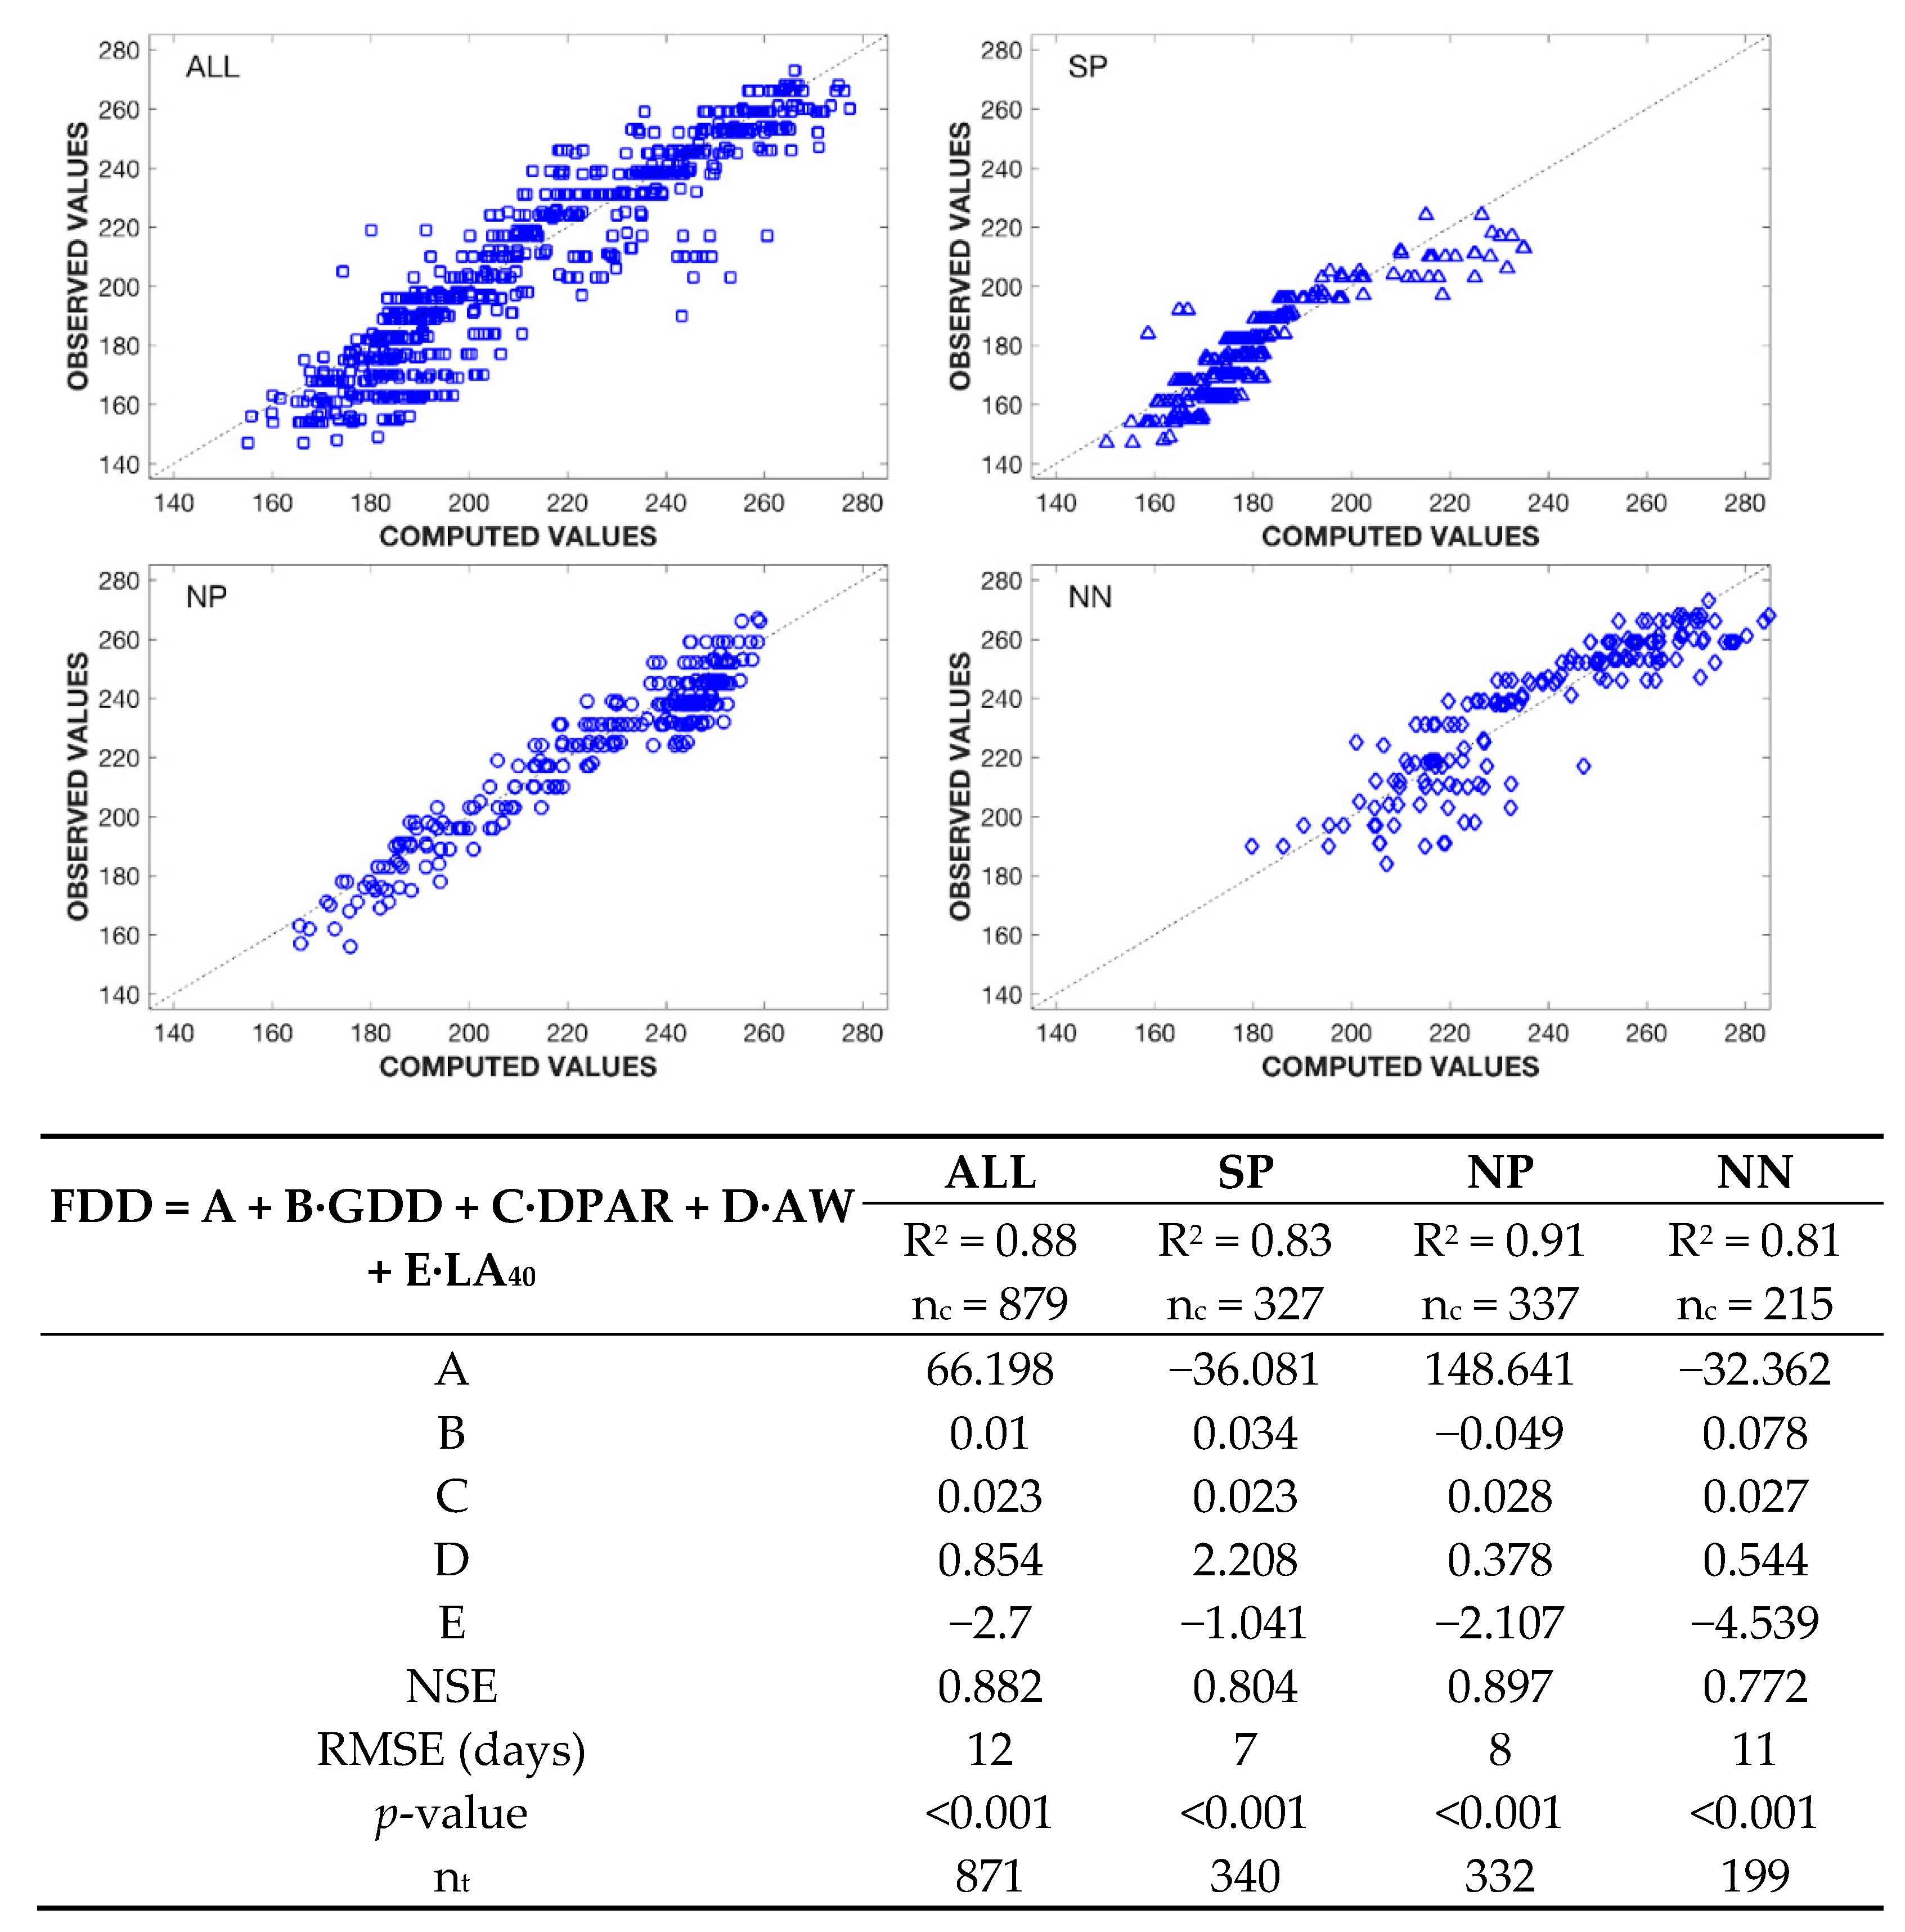
3.2.3. Phenology of the Post-Anthesis Fruit Development

The parameters registered during the fruit post-anthesis development showed significant differences between the greenhouses and screenhouse (Table 1), confirming their influence on the fruit development and their final quality in the environment modification structures studied. The number of fruit development days (FDD) was, in general, lower in the SP due to the higher GDD and lower FN/LA ratio, in relation to the other greenhouses.
A strong multivariable correlation was found between FDD and the anthesis week (AW), GDD, DPAR, and LA. For this purpose, plant leaf area was calculated by a simpler mathematical regression model (R2 ≥ 0.870), which allows for computing leaf surface (denoted as LA40), taking into account only those leaves with a central nerve length longer than 40 cm (NL40). The model coefficients (A and B) obtained for each case and the corresponding scatterplots of observed and predicted values are indicated in Figure 3. The match of the points on the line of perfect agreement is satisfactory when each location is considered separately. This match is not as good with the model common to all locations. This is also supported by the values of the goodness-of-fit indicators (NSE ≥ 0.869; RMSE ≤ 1.838 m2) that are also shown in Figure 3. In addition, the fits can be statistically accepted with p-values < 0.001.
Figure 4 shows the scatterplots of observed and predicted values for the model coefficients (A to E) corresponding to each location and considering all sites together. The goodness-of-fit indicators provided by the FITEVAL tool are also shown and indicate acceptable fits (NSE ≥ 0.772; RMSE ≤ 12 days; p-values < 0.001). The model common to all locations has a higher RMSE (around 12 days) in comparison with the specific models for each location (RMSE = 7 days in SP, 8 days in NP, and 11 days in NN). These results suggest that, in order to achieve an FDD prediction with ± one-week error, the use of the location-specific models should be considered. Moreover, the difficulty involved in measuring LA40 reduces the practical application of these models to forecast yields or harvesting time. A second model, excluding the parameter LA40, exhibited lower prediction ability in all environment modification structures studied (Figure 5), with lower NSE (0.765 vs. 0.804 in SP, 0.843 vs. 0.897 in NP, 0.640 vs. 0.772 in NN) and higher RMSE (8 vs. 7 in SP, 10 vs. 8 days in NP, 14 vs. 11 days in NN) compared to the first model with the LA40. These results highlight the influence of leaf area on fruit development, especially in the northern locations.

3.3. Number of Fruits—Leaf Area Ratio and Total Soluble Solids Content

The NF/LA ratio and the total soluble solids content (TSS) were significantly different in SP in relation to NP in winter and spring, and for all seasons in NN (Table 2). In general, the higher values for TSS were associated with the lower values for NF/LA. The plants in SP maintained, over the whole year, an NF/LA value of around 2–4 fruits per square meter of leaf and a fruit TSS content above 12 °Brix. Similarly, in the NP location, the highest values for TSS were found during summer and autumn (12.76 ± 0.55 °Brix and 12.71 ± 0.58 °Brix, respectively) when NF/LA values were below 4 fruits per square meter of leaf (2.30 ± 0.81 fruits m−2 leaf and 2.74 ± 0.27 fruits m−2 leaf, respectively).
A model relating TSS with NF/LA and FDD was found, but showed a low R2 and a high p-value. The inclusion of other variables such as the harvest week (HW) or the VPD did not improve the prediction ability of the model.

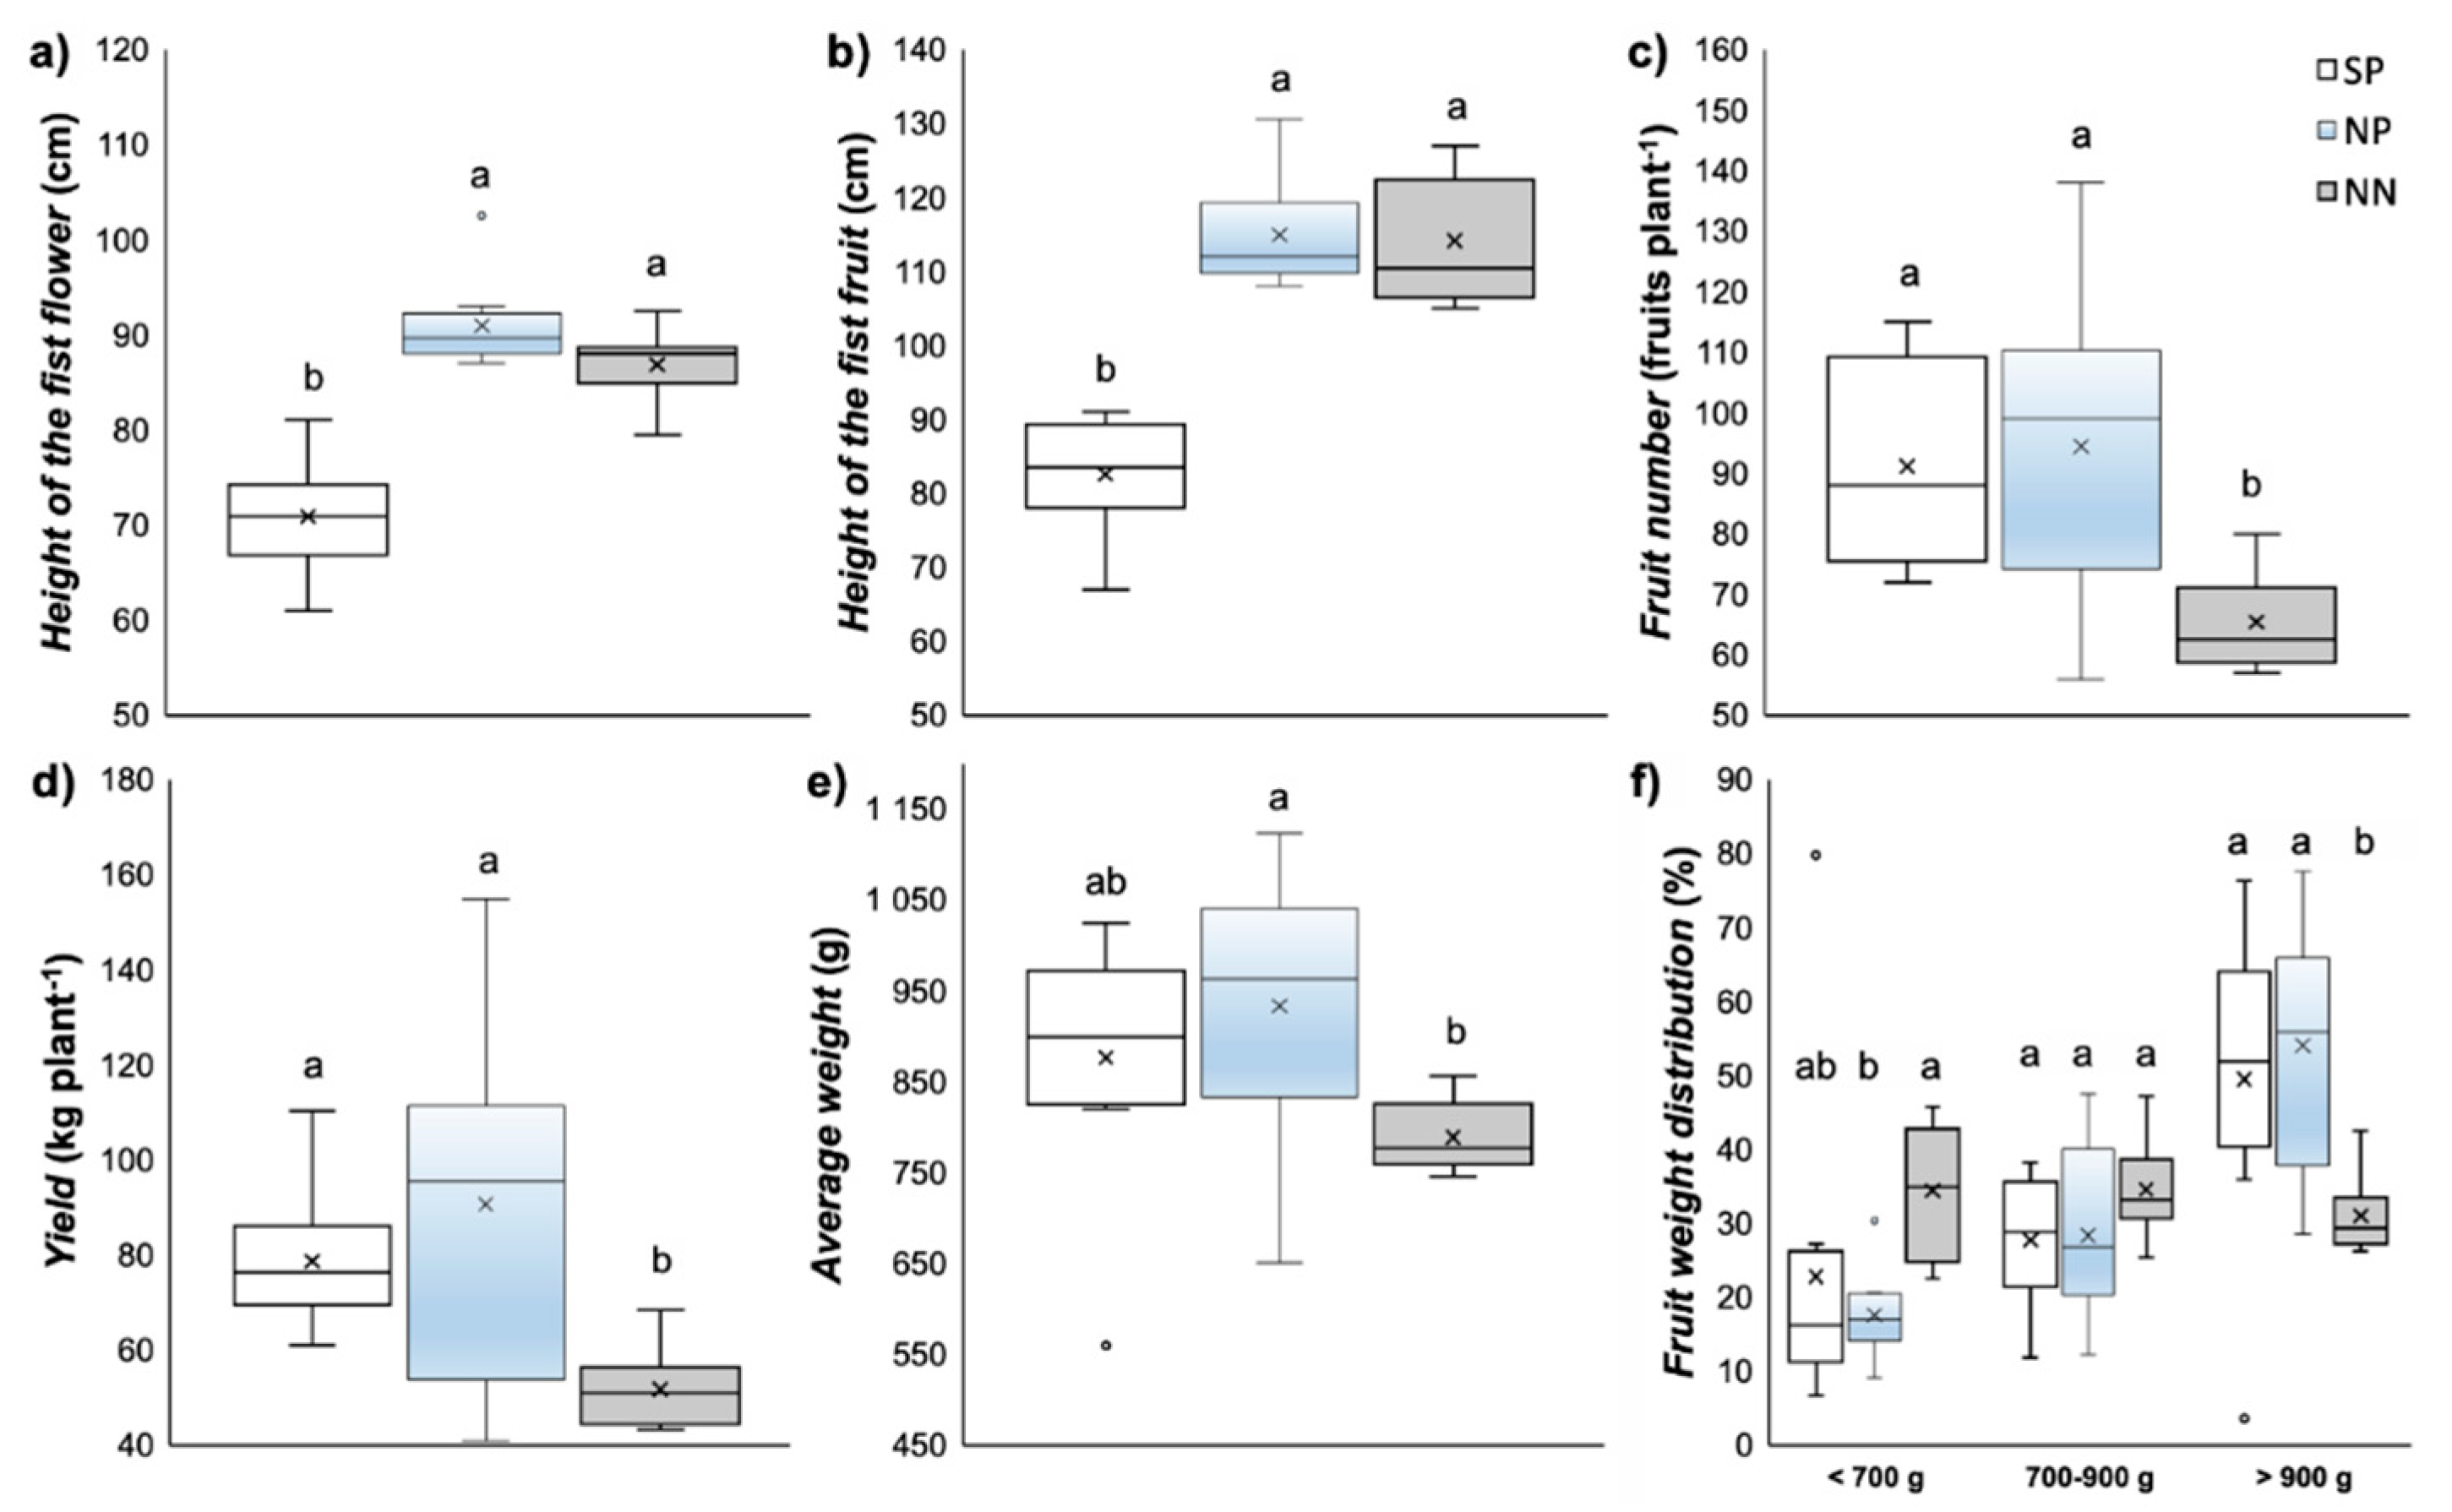
3.4. Production Parameters

Although significant differences in the first flower height and fruit setting were found (lower in the SP greenhouse than in the NP and NN) (Figure 6a,b), there were no differences in the final total plant height. The difference of more than 30 cm in the first fruit set between the SP and the other greenhouse and screenhouse (82.55 ± 3.63 cm in SP vs. 114.95 ± 7.24 cm and 114.15 ± 8.63 cm in NP and NN, respectively) might have improved the production parameters in the SP location, thanks to the earlier beginning of the harvest. The total number of fruits per plant (Figure 6c) and the production (Figure 6d) was similar between SP and NP (78.72 ± 14.13 kg plant−1 vs. 90.70 ± 35.43 kg plant−1, respectively). NN showed significantly lower production (51.75 kg plant−1). No significant differences were observed in the distribution of individual fruit weights between SP and NP locations (Figure 6e). In the NN greenhouse, the proportion of fruits with a weight below 700 g was higher and that above 900 g was lower, related to both plastic-covered greenhouses (SP and NP) (Figure 6f).
Due to the differences observed in the ambient variables and morphological parameters between greenhouses and screenhouse (with the same transplanting date), the production periods were different in each case: from October to March in SP, from February to August in NP, and from May to September in NN. Figure 7 shows the monthly average yield and total soluble solids content in the three papaya environment modification structures studied (Figure 7).

4. Discussion

Papaya is a tropical plant with optimal growth and development at air temperatures between 21 and 33 °C [21]. According to Manica [22], papaya fields located in regions with mean temperatures of around 25 °C promote fast vegetative growth, fruit with excellent quality, high soluble solids content, precocity, and high productivity. Temperatures below 20 °C have a very negative effect, causing, among other problems, carpelloidy, sex change, reduced pollen viability, and low sugar content of the fruit [3].

4.1. Leaf Area and Leaf Emission Rate

Under subtropical conditions, such as those in the Canary Islands, the winter can be too cold for the papaya plants, severely affecting plant growth and production when temperatures below 12–14 °C are maintained for several hours, particularly in dioecious cultivars [6], and ceasing its growth at temperatures below 11 °C [23,24]. Minimum temperatures registered inside traditional greenhouses used in the Canary Islands showed limiting values for papaya growth during the winter (especially inside the screenhouse at the northern location), so the use of a heating system could be recommendable. Passive systems such as thermal screens could be both thermally beneficial and cost-efficient for improving greenhouse night temperatures in our conditions. Under the conditions studied, LER showed a seasonal trend throughout the year in all locations, with the minimum values in winter (2–3 leaves per month) and a maximum in summer (14–16 leaves per month), as stated in previous works by Cabrera [25], showing an important influence of temperature and radiation on this variable. Higher PAR values and minimum temperatures, maintained above the limiting level for crop growth in winter inside the SP greenhouse, led to higher LER (and consequently plant leaf area) compared to both northern environment modification structures. This fact was also observed in other subtropical regions [23].
On the other hand, maximum temperatures above the optimum were observed in summer, and maximum VDP values above 2 kPa were registered in the SP location in summer and autumn, as well as in summer in the NP greenhouse, particularly at midday during hot and dry days. This situation likely increases the phenomenon known as the midday depression of photosynthesis (MDP), which could have an important impact on the net carbon assimilation in this species [26]. The average ± standard deviation VPD values reported by Reis and Campostrini [27] were 2.2 kPa ± 0.7 and 1.4 kPa ± 0.7 for the dry and wet seasons, respectively. Under these conditions, the stomatal conductance (gs) values were between 0.1 and 0.3 mol m−2 s−1 and 0.4 and 0.7 mol m−2 s−1, corresponding to values of net carbon assimilation (A) of 6 and 12 µmol m−2 s−1 and 14 and 20 µmol m−2 s−1, respectively. Other authors found similar results reporting a strong negative relationship between the VPD and gs in this crop, thus affecting A [18,19,28] and, consequently, the papaya fruit quality [29]. Moreover, the decrease in gs disturbs the leaves’ cooling systems [30] and the nutrient absorption [31]. As a consequence of these limiting meteorological conditions, but also due to phytosanitary factors, leaf emission rate and plant leaf area showed lower values in summer and autumn in SP compared to NP. In the SP location, problems with mite infestation occurred between summer and autumn, with a maximum cumulative defoliation registered of 36.06 ± 13.79%, between October 2015 and January 2016. Meanwhile, in the NP and NN locations, higher proportions of defoliation were observed between December 2015 and May 2016 (80.31 ± 3.94% and 89.06 ± 3.09%, respectively), due to the powdery mildew infestation, having an impact on the reduction of LA and LER in spring and summer in the northern greenhouse and screenhouse in relation to SP.
The powdery mildew (Oidium caricae-papayae) infestation was likely promoted by the ambient conditions inside the crop protection structures, thriving during late autumn and early winter. Low light level, high relative humidity, moderate temperatures (18 to 32 °C), and moderate rainfall enhance disease development [32]. As temperature falls at night, relative humidity (RH) increases, thus stimulating conidia for germinating and encouraging the production of chains of conidia in existing infections. In the mornings, after sunrise, temperature rises and RH diminishes, thus helping in drying the chains of conidia. The time lapse between conidia land and the production of new conidia can be as short as 72 h, but it usually lasts 5–7 days [33].
In winter, in the NP location, daily PAR levels were the lowest, with an average of 21.9 ± 7.50 mol m−2 day−1, with warm days (tVPD>2kPa of 0.35 ± 1.82 kPa and Tmax of 25.95 ± 2.63 °C) and cool nights (Tmin of 14.98 ± 1.37 °C). Under these conditions, infections began to develop, affecting the oldest and youngest leaves. During the next few months, the plants suffered an important loss of their LA, and in the early spring, the plants started to recover their canopy, with a reduction in fungus infection coinciding with the improvement of the ambient conditions. In spring, the days were longer (the PAR levels rose considerably up to an average of 34.33 ± 8.54 mol m−2 day−1) and warmer (VPD of 2.15 ± 2.44 kPa and Tmin of 18.84 ± 1.82 °C).
Incident crop radiation is affected by greenhouse cover material properties (transmissivity to solar radiation), orientation, and dust deposited, among other factors. The radiation transmittance in the greenhouses of this study was around 60–70% in relation to the outside radiation. This is particularly problematic during autumn and winter, when days are cloudier and shorter than in other seasons. With an optimum daily PAR integral for papaya of around 30 mol m−2 day−1 (equivalent to 6–7 h with PPFD = 1400 μmol m−2 s−1 [18]), average daily values lower than the crop light saturation level were obtained in all seasons. The use of new cover material with high transmittance or the installation of a retractable roof in the greenhouses could be an alternative for increasing solar radiation transmissivity inside the greenhouses on days with lower solar radiation. However, although papaya plants can achieve maximum A rates of 25 to 30 μmol m−2 s−1 at PPFD = 2000 μmol m−2 s−1 [18,34], under field conditions, A is limited due to other meteorological variables such as leaf temperature and air relative humidity. Jeyakumar et al. [35] demonstrated that in field-cultivated papaya, PPFD light saturation was 1250 μmol m−2 s−1 with A = 12 μmol m−2 s−1. However, A rates sharply fell to 5 μmol m−2 s−1 at 2000 μmol m−2 s−1. This decrease in A that begins at light saturation is due, in part, to the decrease in gs through the direct action of radiant energy on leaf heating. Thus, on clear days, with PPFD above 2000 μmol m−2 s−1 outside, the greenhouse cover shade on the plants may have a positive effect on the carbon gain of papaya plants [36].

4.2. Floral Abnormalities

Floral abnormalities were observed in all environment modification structures, which reduced crop yields and increased seasonality in fruit yield. The sex reversal occurs mainly at high temperatures, water stress, and low soil nitrogen, while carpelloid variations are related to mild or low temperatures and high moisture and soil nitrogen levels [5,37,38,39]. Therefore, flower alterations could be observed in different proportions depending on the planting date, with higher frequency in summer transplanting plants compared to autumn or spring ones [40].
Meanwhile, in SP, it seems that fruit abortion was associated with a high thermal and relative humidity gradient between midday and night; in NP and NN, the lower temperatures seemed to be the main factors leading to fruit abortion. These facts are in agreement with the field observations, where sex reversal problems in SP during the warmest weeks, and carpelloid fruit in NP and NN after the winter, were detected.

4.3. Fruit Set and Total Soluble Solids Content

The mentioned loss of leaves after the winter, especially in NP and NN, altered the source–sink ratio, especially when the plant had a high load of fruit, which was setting after the summer and autumn and did not ripen during the winter, resulting in high values of the NF/LA ratio (>4). Consequently, the new flower and fruit set decreased during the following months (spring), along with a TSS fall in the ripe fruit, which caused fruit quality problems and important economic losses. This is in agreement with Zhou et al. [41], who found that a defoliation of around 75% significantly reduced new flower production and fruit set, and decreased TSS, in the ripe fruit, whereas 50% defoliation did not reduce new fruit set or ripe fruit TSS. Moreover, continuous removal of old leaves reduced new fruit set, fruit weight, and TSS, while fruit thinning increased new fruit set and ripe fruit TSS. These differences may explain the lower TSS content in the fruit collected in NP and, particularly, in NN after these periods of time. In SP, on the other hand, the NF/LA ratio was similar all year round, between 3 and 4, including during winter and spring, due to favorable ambient conditions that can help to maintain an adequate leaf area and fruit set. In general, in papaya, each mature leaf can provide photoassimilation for around three fruits [7]. Defoliation that occurred in winter (LA < 3 m2 per plant), together with the low radiation level in that season (mean total daily PAR of 10.8 mol m−2), was associated with TSS in papaya below 10 °Brix [42]. This study confirms that TSS is correlated with the NF/LA ratio and the FDD, suggesting that for maintaining good fruit quality (a minimum of 12 °Brix for the export market, similar to Hawaii’s minimum of 11.5 °Brix, [43]), it should be kept at around 3–4 fruits per square meter of leaf surface for the variety studied in this experiment. In order to maintain this ratio during the whole year, it could be necessary to improve the greenhouse ambient conditions by using better structures, to adopt appropriate phytosanitary control techniques and to remove fruits, leaving a maximum of 3–4 fruit per leaf.

4.4. Fruit Production

Environmental variables such as temperature, solar radiation, and relative humidity; agronomic factors such as irrigation and nutrition; and genetic factors associated with the vegetal material highly affect the development of the fruit [10]. Otherwise, during daylight hours, the relative fruit growth rate can be significantly reduced on plants growing under high VPD conditions [44,45]. By studying the phenology during the fruit development, the critical periods can be identified and technical or management strategies can be applied to improve the quality of the fruit. The results of this study suggested that monitoring GDD, daily PAR integral, and LA inside the greenhouses or the screenhouse could be a useful tool for predicting harvests by determining the FDD. The use of VPD in the regression models did not improve their ability to estimate the FDD. However, location-specific models should be necessary for each specific location and greenhouse type in order to obtain better predictions. The difference of more than 30 cm in the first fruit set between the SP and NP and NN (82.55 ± 3.63 cm in SP vs. 114.95 ± 7.24 cm and 114.15 ± 8.63 cm in NP and NN, respectively) might have improved the production parameters due to earlier harvesting. However, the subsequent problems in the flower set led to a similar total number of fruits per plant and production between SP and NP. Nevertheless, in NN, the strong plant defoliation that occurred during the winter negatively affected both the fruit quality and the production (number and fruit size).
In order to determine the phenology status in commercial papaya orchards, it is recommended to monitor the growth and production parameters in a sampled group of plants as well as the ambient variables. These data would allow for reliable harvest predictions, providing useful information for the management of the production and commercialization of papaya fruits.

5. Conclusions

The analysis of factors affecting flower and fruit setting and yield pattern in papaya crops growing under different agronomic conditions could provide useful information for harvest planning and prediction in papaya commercial crops. In this sense, a model to predict the period of fruit development was established based on data from anthesis week, total growing degree days, total daily photosynthetically active radiation, and plant leaf area.
Under the conditions studied and without using climate control equipment, the same greenhouse structure located in two different agroclimatic areas (SP and NP) gave rise to different ambient conditions that affected leaf area (influenced by the leaf emission rate and the phytosanitary factors) and, consequently, the number of fruit development days and the duration of the production period. In addition, according to the results obtained in the location in the north of the island (NP), the use of a greenhouse with a polyethylene film cover is recommended instead of a screenhouse (NN), which provides less suitable ambient conditions for papaya cultivation and therefore produces worse yields.
The ratio between the number of fruits per plant leaf area and the period of fruit development was found to be the main factor influencing papaya fruit total soluble solids content (TSS) in the agronomic conditions studied, although the predicted equation did not show a good correlation level. Maintaining around 3–4 fruits per square meter of leaf area seems to be necessary to guarantee good commercial quality (with TSS above 12 °Brix). Therefore, it is desirable to maintain an adequate plant leaf area all year round, preferably above 8–10 m2, and even to apply management practices such as fruit thinning to reduce the number of fruits per leaf area when necessary. Further studies are still required to establish a good prediction model to estimate fruit TSS content from growth and fruit development parameters together with climate data. This would provide useful information for optimal crop management of papaya and commercialization practices.

Author Contributions

Conceptualization, M.G.L., V.R., and J.A.C.; methodology, M.G.L., V.R. and E.P.; software, A.R. and J.A.C.; validation, A.R. and J.A.C.; formal analysis, J.A.C.; investigation, M.G.L., V.R., and J.A.C.; resources and funding acquisition, V.R. and M.G.L.; data curation, A.R. and J.A.C.; writing—original draft preparation, J.A.C.; writing—review and editing, A.R., V.R. and M.G.L.; visualization, J.A.C., V.R., E.P., and M.G.L.; supervision, M.G.L.; project administration, V.R. All authors have read and agreed to the published version of the manuscript.

Funding

This research was funded by the I + D + i project RTA2012-00107. The authors would like to thank the “Instituto Nacional de Investigación y Tecnología Agraria y Alimentaria (INIA)” for awarding the contract within the framework of the “Plan Estatal de Investigación Científica y Técnica y de Innovación 2013–2016”.

Institutional Review Board Statement

Not applicable.

Informed Consent Statement

Not applicable.

Data Availability Statement

Not applicable.

Acknowledgments

The authors would like to acknowledge the support and collaboration given by the orchard farmers.

Conflicts of Interest

The authors declare no conflict of interest. The funders had no role in the design of the study; in the collection, analyses, or interpretation of data; in the writing of the manuscript, or in the decision to publish the results.

References

  1. Teixeira, L.G.; Lages, P.C.; Jascolka, T.L.; Aguilar, E.C.; Soares, F.L.P.; Pereira, S.S.; Beltrão, N.R.M.; de Oliveira Matoso, R.; do Nascimento, A.M.; de Castilho, R.O.; et al. White tea (Camellia sinensis) extract reduces oxidative stress and triacylglycerols in obese mice. Food Sci. Technol. 2012, 32, 733–741. [Google Scholar] [CrossRef] [Green Version]
  2. Vij, T.; Prashar, Y. A review on medicinal properties of Carica papaya Linn. Asian Pac. J. Trop. Dis. 2015, 5, 1–6. [Google Scholar] [CrossRef]
  3. Galán Sauco, V.; Rodríguez Pastor, M.C. Greenhouse cultivation of papaya. Acta Hortic. 2007, 740, 191–195. [Google Scholar] [CrossRef]
  4. Campostrini, E.; Glenn, D.M. Ecophysiology of papaya: A review. Braz. J. Plant Physiol. 2007, 19, 413–424. [Google Scholar] [CrossRef] [Green Version]
  5. Martelleto, L.A.P.; Ribeiro, R.D.L.D.; Sudo-Martelleto, M.; Vasconcellos, M.A.D.S.; Pereira, M.B. Expression of female sterility and carpelloidy on papaya tree under different environments of protected cultivation. Rev. Bras. Frutic. 2011, 33, 1185–1193. [Google Scholar] [CrossRef] [Green Version]
  6. Nakasone, H.Y.; Paul, R.E. Tropical Fruits; CAB Int.: Wallingford, UK, 1998; 432p. [Google Scholar]
  7. Zhou, L. Source-sink Relationship during Papaya Fruit Development and Ripening. Ph.D. Thesis, University of Hawaii at Manoa, Honolulu, HI, USA, 1999. [Google Scholar]
  8. Stenzel, N.M.C.; Neves, C.S.V.J.; Marur, C.J.; Scholz, M.B.S.; Gomes, J.C. Maturation curves and degree-days accumulation for fruits of ‘Folha Murcha’ orange trees. Sci. Agric. 2006, 63, 219–225. [Google Scholar] [CrossRef] [Green Version]
  9. de Almeida, F.T.; Bernardo, S.; Sousa, E.F.; Marin, S.L.D.; Grippa, S. Growth and yield of papaya under irrigation. Sci. Agric. 2003, 60, 419–424. [Google Scholar] [CrossRef] [Green Version]
  10. Berilli, S.S.; Oliveira, J.G.; Marinho, A.B.; Lyra, G.B.; Sousa, E.F.; Viana, A.P.; Bernardo, S.; Pereira, M.G. Avaliação da taxa de crescimento de frutos de mamão (Carica papaya L.) em função das épocas do ano e graus-dias acumulados. Rev. Bras. Frutic. 2007, 29, 11–14. [Google Scholar] [CrossRef]
  11. Caron, V.C. Estudo da Relação entre o Amolecimento Precoce de Mamões ‘Golden’e Aspectos Climáticos, Nutricionais e Hormonais. Ph.D. Thesis, Escola Superior de Agricultura Luiz de Queiroz, University of São Paulo, São Paulo, Brazil, 2014. [Google Scholar]
  12. Silva, M.D.S. Desempenho de Variedades de Mamoeiro em Clima Subtropical do Estado de São Paulo. Ph.D. Thesis, Faculdade de Ciências Agronômicas Universidade Estadual Paulista “Júlio de Mesquita Filho”, São Paulo, Brazil, 2016. [Google Scholar]
  13. Ortega-Farías, S.O.; Lozano, P.; Moreno, Y.; León, L. Desarrollo de modelos predictivos de fenología y evolución de madurez en vid para vino cv. Cabernet Sauvignon y Chardonnay. Agric. Técnica 2002, 62, 27–37. [Google Scholar] [CrossRef]
  14. Pailly, O.; Habib, R.; Delecolle, R. Effect of soil and climate conditions on soluble solids evolution during maturation of kiwifruit. N. Z. J. Crop. Hortic. Sci. 1995, 23, 145–153. [Google Scholar] [CrossRef]
  15. Ometto, J.C. Bioclimatologia Vegetal; Editora Agronômica Ceres LTDA: São Paulo, Brazil, 1981; 400p. [Google Scholar]
  16. Nakasone, H.Y. Produção de Mamão nos Trópicos e Subtrópicos. In Mamão; Ruggiero, C., Ed.; FCAV-UNESP: Jaboticabal, Brazil, 1988; pp. 19–42. [Google Scholar]
  17. Hoffman, G.J. Humidity. In Controlled Environment Guidelines for Plant Research; Tibbits, T.W., Kozlowski, T.T., Eds.; Academic Press: London, UK, 1979; pp. 141–172. [Google Scholar] [CrossRef]
  18. Marler, T.E.; Mickelbart, M.V. Drought. leaf gas exchange. and chlorophyll fluorescence of field-grown papaya. J. Am. Soc. Hortic. Sci. 1998, 123, 714–718. [Google Scholar] [CrossRef] [Green Version]
  19. Machado Filho, J.A.; Campostrini, E.; Yamanishi, O.K.; Fagundes, G.R. Variação sazonal das trocas gasosas em folhas de mamoeiro cultivado em condições de campo. Bragantia 2006, 65, 185–196. [Google Scholar] [CrossRef]
  20. Ritter, A.; Muñoz-Carpena, R. Predictive ability of hydrological models: Objective assessment of goodness-of-fit with statistical significance. J. Hydrol. 2013, 480, 33–45. [Google Scholar] [CrossRef]
  21. Knight, R.J. Origin and world importance of tropical and subtropical fruit crops. In Tropical and Subtropical Fruits: Composition, Properties, and Uses; Nagy, S., Shaw, P.E., Eds.; AVI Publishing: Westport, CT, USA, 1980; pp. 1–120. [Google Scholar] [CrossRef]
  22. Manica, I. Fruticultura Tropical: Mamão; Editora Agronômica Ceres LTDA: São Paulo, Brazil, 1982; 276p. [Google Scholar]
  23. Allan, P. Carica papaya responses under cool subtropical growth conditions. Acta Hortic. 2002, 575, 757–763. [Google Scholar] [CrossRef]
  24. Allan, P. Phenology and production of Carica papaya ‘honey gold’ under cool subtropical conditions. Acta Hortic. 2007, 740, 217–223. [Google Scholar] [CrossRef]
  25. Cabrera, J.A. Bases Tecnológicas para una Producción Eficiente y Sostenible de la Papaya (Carica papaya L.) en Climas Subtropicales. Ph.D. Thesis, Universidad de La Laguna, Tenerife, Spain, 2019. [Google Scholar]
  26. Reis, F.O. Microaspersão Sobrecopa em Mamoeiro ‘Golden’: Um Estudo Relacionado às Trocas Gasosas. à Eficiência Fotoquímica e ao Fluxo de Seiva Xilemática. Ph.D. Thesis, Campos do Goytacazes. Universidade Estadual do Norte Fluminense, Campos dos Goytacazes, RJ, Brazil, 2007. [Google Scholar]
  27. Reis, F.O.; Campostrini, E. Trocas gasosas e eficiência fotoquímica potencial em mamoeiro do grupo ‘Formosa’ cultivado em condição de campo. Bragantia 2008, 67, 815–822. [Google Scholar] [CrossRef]
  28. El-Sharkawy, M.A.; Cock, M.J.H.; Hernandez, A.D.P. Stomatal response to air humidity and its relation to stomatal density in a wide range of warm climate species. Photosynth. Res. 1985, 7, 137–149. [Google Scholar] [CrossRef]
  29. Salazar, R. Determination of photosynthesis in commercial varieties of papaw (Carica papaya L.) and its possible relationship with the production and quality of the fruits. Rev. ICA 1978, 13, 291–295. [Google Scholar]
  30. Nobel, P.S. Physicochemical and Environmental Plant Physiology; Academic Press: San Diego, CA, USA, 1991; 635p. [Google Scholar] [CrossRef]
  31. Marschner, H. Mineral Nutrition of Higher Plants; Academic Press: San Diego, CA, USA, 1995; 889p. [Google Scholar] [CrossRef]
  32. Ooka, J. Oidium Caricae. Crop Knowledge Master, University of Hawai’i at Mānoa, College of Tropical Agriculture and Human Resources, 1993. Available online: http://www.extento.hawaii.edu/Kbase/crop/Type/o_caric.htm (accessed on 21 December 2020).
  33. Douglas, S.M. Powdery Mildew in the Greenhouse. Department of Plant Pathology and Ecology. The Connecticut Agricultural Experiment Station: New Haven, CT, USA. Available online: https://portal.ct.gov/CAES/Fact-Sheets/Plant-Pathology/Powdery-Mildew (accessed on 21 December 2020).
  34. Campostrini, E.; Yamanishi, O.K. Influence of mechanical root restriction on gas-exchange of four papaya genotypes. Braz. J. Plant Physiol. 2001, 13, 129–138. [Google Scholar] [CrossRef] [Green Version]
  35. Jeyakumar, P.; Kavino, M.; Kumar, N. Physiological performance of papaya cultivars under abiotic stress conditions. Acta Hortic. 2007, 740, 209–214. [Google Scholar] [CrossRef]
  36. Deng, X.; Ye, W.; Yang, Q.; Cai, C.; Liu, S. Effects of network-shaded planting model on photosynthetic. J. Beijing For. Univ. 2003, 26, 57–61. [Google Scholar]
  37. Arkle Junior, T.D.; Nakasone, H.Y. Floral differentiation in the hermaphroditic papaya. HortScience 1984, 19, 832–834. [Google Scholar]
  38. Ramos, H.C.C.; Pereira, M.G.; Silva, F.F.; Viana, A.P.; Ferreguetti, G.A. Seasonal and genetic influences on sex expression in a backcrossed segregating papaya population. Crop Breed. Appl. Biotechnol. 2011, 11, 97–105. [Google Scholar] [CrossRef] [Green Version]
  39. Tamaki, M.; Urasaki, N.; Sunakawa, Y.; Motomura, K.; Adaniya, S. Seasonal variations in pollen germination ability. reproductive function of pistils. and seeds and fruit yield in papaya (Carica papaya L.) in Okinawa. J. Jpn. Soc. Hortic. Sci. 2011, 80, 156–163. [Google Scholar] [CrossRef] [Green Version]
  40. Salinas, I.; Hueso, J.J.; Cuevas, J. Flower development in ‘BH-65’ papaya grown in plastic greenhouses in south-east Spain. Acta Hortic. 2019, 1250, 187–192. [Google Scholar] [CrossRef]
  41. Zhou, L.; Christopher, D.A.; Paull, R. Defoliation and fruit removal effects on papaya fruit production. sugar accumulation. and sucrose metabolism. J. Am. Soc. Hortic. Sci. 2000, 125, 644–652. [Google Scholar] [CrossRef] [Green Version]
  42. Cabrera, J.A.; Raya, V.; Lobo, M.G.; Ritter, A. Effect of climate conditions on growth and production of hydroponic papaya crops in the Canary Islands. Acta Hortic. 2020, 1268, 77–84. [Google Scholar] [CrossRef]
  43. Jung Chen, N.; Manenoi, A.; Paull, R.E. Papaya postharvest physiology and handling problems and solutions. Acta Hortic. 2007, 740, 285–293. [Google Scholar] [CrossRef]
  44. McFadyen, L.M.; Hutton, R.J.; Barlow, W.R. Effects of crop load on fruit water relations and fruit growth in peach. J. Hortic. Sci. 1996, 71, 469–480. [Google Scholar] [CrossRef]
  45. Leonardi, C.; Guichard, S.; Bertin, N. High vapour pressure deficit influences growth. transpiration and quality of tomato fruits. Sci. Hortic. 2000, 84, 285–296. [Google Scholar] [CrossRef]
Figure 1. Meteorological variables from April 2015 to March 2017 inside the papaya (Carica papaya L. cv. Sweet Mary) greenhouses (SP and NP) and the screenhouse (NN): (a) GDD (growing degree days); (b) T (air temperature); (c) Tmax (maximum air temperature); (d) Tmin (minimum air temperature); (e) tVPD > 2kPa (daily total time (h) with vapor pressure deficit conditions above 2 kPa); and (f) DPAR (total daily photosynthetically active radiation). The boxes are bounded on the top by the third quartile, and on the bottom by the first quartile. The median divides the box and the (x) represents the mean. The whiskers are error bars: one extends to the maximum and the other to the minimum. Any point outside (○) these whiskers is considered an outlier. Boxplots followed by the same letter are not significantly different according to the LSD test at a significance level of 0.05.
Agriculture 11 00173 g001
Figure 2. Seasonal trend of weekly leaf area (LA) (a) and leaf emission rate (LER) (b) in the papaya (Carica papaya L. cv. Sweet Mary) greenhouses and the screenhouse: south and north with plastic cover (SP and NP) and north with net cover (NN). Winter (nSP = 230; nNP = 230; nNN = 200), spring (nSP = 130; nNP = 130; nNN = 130), summer (nSP = 184; nNP = 184; nNN = 172), and autumn (nSP = 184; nNP = 184; nNN = 184). The boxes are bounded on the top by the third quartile, and on the bottom by the first quartile. The median divides the box and the (x) represents the mean. The whiskers are error bars: one extends to the maximum and the other to the minimum. Any point outside (○) those whiskers is considered an outlier. Boxplots followed by the same letter are not significantly different according to the LSD test at a significance level of 0.05.
Agriculture 11 00173 g002
Figure 3. Performance of the regression model for estimating leaf area (LA40) from those leaves with a central nerve length longer than 40 cm (NL40). The model with coefficients A and B was fitted individually for each location studied (SP, NP, and NN), but also using all data of the three locations (ALL). The nc and nt indicate the number of data used for the model calibration and testing, respectively.
Agriculture 11 00173 g003
Figure 4. Performance of the multilinear regression (MLR) models for estimating fruit development days (FDD) from total growing degree days (GDD), total daily photosynthetically active radiation (DPAR), anthesis week (AW, expressed as the number of the week), and leaf area (LA40) estimated from those leaves with a central nerve length longer than 40 cm. The evaluated MLR models with coefficients A to E were obtained individually for each location studied (SP, NP, and NN), but also an MLR model common to all locations (ALL) was fitted. The nc and nt indicate the number of data used for the model calibration and testing, respectively.
Agriculture 11 00173 g004
Figure 5. Performance of the multilinear regression (MLR) models for estimating fruit development days (FDD) from cumulative growing degree days (GDD), total daily photosynthetically active radiation (DPAR), and anthesis week (AW, expressed as number of the week). The evaluated MLR models with coefficients A to D were obtained individually for each location studied (SP, NP, and NN), but also an MLR model common to all locations (ALL) was fitted. The nc and nt indicate the number of data used for the model calibration and testing, respectively.
Agriculture 11 00173 g005
Figure 6. Crop production parameters (SP: south and plastic cover, NP: north and plastic cover, and NN: north and 40-mesh net cover): (a) height of the first flower (a) and fruit set (b); (c) number of fruits per plant; (d) yield; (e) average fruit weight; and (f) the relative contribution (%) of fruits according to weight classes (<700 g; 700–900 g; and > 900 g). The boxes are bounded on the top by the third quartile, and on the bottom by the first quartile. The median divides the box and the (x) represents the mean. The whiskers are error bars: one extends to the maximum and the other to the minimum. Any point outside (○) these whiskers is considered an outlier. Boxplots followed by the same letter are not significantly different according to the LSD test, at a significance level of 0.05.
Agriculture 11 00173 g006
Figure 7. Monthly average yield (kg plant−1) and total soluble solids content (°Brix) in the greenhouses (SP: south and plastic cover, NP: north and plastic cover) and the screenhouse (NN: north and 40-mesh net cover) (n = 10).
Agriculture 11 00173 g007
Table 1. Average value of plant parameters and DPAR during the fruit development period, from the anthesis until harvest: FDD (fruit development days); TSS (total soluble solids); GDD (growing degree days); DPAR (daily photosynthetically active radiation integral); NF/LA ratio (number of fruits per leaf square meter) in papaya orchards in different locations and environment modification structures (SP: south and plastic cover, NP: north and plastic cover, and NN: north and 40 mesh net cover).
Location
VariableSPNPNN
FDD (days)180.42 ± 17.71 a219.09 ± 27.76 b244.14 ± 20.09 c
TSS (%)13.29 ± 0.60 c11.92 ± 0.94 b10.74 ± 1.41 a
GDD1368.36 ± 140.78 c1286.01 ± 117.92 b1196.51 ± 106.05 a
DPAR (mol m−2)4420.86 ± 592.99 a5450.63 ± 989.36 b6230.40 ± 1307.78 c
NF/LA (fruits m−2)3.07 ± 0.98 a5.75 ± 3.38 b8.61 ± 6.75 c
Values are the average ± standard deviation. Means followed by the same letter are not significantly different according to the LSD test at a significance level of 0.05. Sample size at each location was: nSP = 90; nNP = 69, and nNN = 51.
Table 2. Seasonal means for TSS (°Brix) and NF/LA (number of fruits per leaf area square meter) in the different orchards studied (SP: south and plastic cover, NP: north and plastic cover, and NN: north and net cover).
Season
VariableLocationWinterSpringSummerAutumn
TSSSP13.27 ± 0.70 b13.18 ± 0.56 c13.44 ± 0.33 b13.36 ± 0.51 a
NP11.09 ± 0.63 a11.45 ± 0.54 b12.76 ± 0.55 b12.71 ± 0.58 a
NN11.30 ± 0.71 a8.41 ± 0.56 a11.33 ± 0.72 a12.30 ± 0.04 b
NF/LASP2.95 ± 1.20 a3.00 ± 0.80 a4.06 ± 0.15 ab3.19 ± 0.76 a
NP7.29 ± 1.77 b9.33 ± 1.79 b2.30 ± 0.81 a2.74 ± 0.27 a
NN9.90 ± 2.83 c19.48 ± 5.03 c4.64 ± 2.30 b5.78 ± 0.92 b
Values are the average ± standard deviation. Means followed by the same letter are not significantly different according to the LSD test at a significance level of 0.05. Sample size was, in each location and season, n = 38 in SP, 19 in NP, 7 in NN in winter; n = 19 in SP, 20 in NP, 11 in NN in spring; n = 2 in SP, 25 in NP, 31 in NN in Summer; and n = 31 in SP, 5 in NP, 2 in NN in Autumn.
Publisher’s Note: MDPI stays neutral with regard to jurisdictional claims in published maps and institutional affiliations.

