Article

The World Vegetable Center Okra (Abelmoschus esculentus) Core Collection as a Source for Flooding Stress Tolerance Traits for Breeding

1
The World Vegetable Center, Shanhua, Tainan 741, Taiwan
2
Branch Station of Kaohsiung District Agricultural Research and Extension Station, Council of Agriculture, Executive Yuan, 2-6 Dehe Rd., Dehe Village, Changjhih Township, Pingtung County 90846, Taiwan
*
Author to whom correspondence should be addressed.
Agriculture 2021, 11(2), 165; https://doi.org/10.3390/agriculture11020165
Submission received: 28 December 2020 / Revised: 19 January 2021 / Accepted: 16 February 2021 / Published: 18 February 2021
(This article belongs to the Special Issue Conservation and Characterization of Vegetable Crop Biodiversity)

Abstract

:
Okra (Abelmoschus esculentus) is a heat tolerant vegetable crop with high economic and nutritional importance in parts of Asia, Africa, and America. The okra biodiversity held in gene bank collections could be mined for traits for breeding more stress tolerant and nutritional cultivars. An okra core collection of 166 accessions comprising A. esculentus, A. moschatus, A. caillei, and A. manihot has been assembled from the World Vegetable Center germplasm collection (840 accessions) based on diversity analysis with 20 microsatellite markers. A selection of A. esculentus accessions of the core collection (75 accessions) and 20 breeder-selected genotypes have been screened for variation of their response to flooding stress under field conditions using a high throughput phenotyping system. Growth increment per day and changes of physiological indices were measured before, during, and after application of 9 days of flooding stress. Several accessions showed only a small reduction in daily growth increment during flooding. Across the germplasm panel, maintained growth was correlated with maintained normalized differential vegetation index and was negatively correlated with plant senescence index. Accessions with maintained growth and health under flooding were selected for future further analysis and use in breeding.

1. Introduction

The genus Abelmoschus (Malvaceae) comprises several species with global or local importance as a vegetable crop. Okra (A. esculentus (L) Moench) is an allopolyploid species with a variable chromosome number [1] and unclear origin. It was suggested that okra originated in Africa [2], while [3,4] hypothesized Asian origin. As no truly wild A. esculentus is known, okra is assumed to be a cultigen, whose cultivation has been documented since 1200 B.C. in Egypt and Arabia [5,6]. Other Abelmoschus vegetable crop species that can be hybridized with A. esculentus are A. caillei (A. Chev.) Stevels, A. moschatus Medik, and A. manihot (L.) Medik [7,8]. A. caillei is grown in West Africa for its edible pods [9] and the leaves and unripe pods of A. moschatus are consumed as a vegetable, while the roasted seeds with their sesame-like taste are used for flavoring foods and drinks [10]. A manihot is a popular leafy vegetable in Oceania and is grown in parts of Asia for its pharmacological value [11].
The okra crop (A. esculentus) is grown on about 2 million hectares producing almost 10 million tons of pods worldwide. The largest producer is India with about 6 million tons of fresh pods harvested, followed by Nigeria with about 2 million tons [12]. The economic importance of okra is growing due to the rising local and international demand for fresh vegetables, but also for use as an alternative source of oil for human consumption, or as biofuel [13,14] and for medicinal products [15]. Breeding aims for okra are cultivars with improved pod quality and yield stability, resistance to abiotic and biotic stresses, and exploiting heterosis for hybrid development [16].
Breeding requires access to crop biodiversity, which has been conserved in gene bank collections. The largest public sector Abelmoschus germplasm collections are held by the Plant Genetic Resources Conservation Unit, Southern Regional Plant Introduction Station, University of Georgia, USDA-ARS (2971 accessions), the World Vegetable Center at its headquarters in Taiwan (WorldVeg, currently 1873 accessions), followed by the Agricultural Plant Genetic Resources Conservation and Research Centre, Sudan (http://seed.worldveg.org/search/passport (accessed on 8 December 2020)). Assembly of a core collection that represents the diversity of okra conserved in gene banks in a smaller germplasm set would facilitate screening for traits of interest for breeding [17].
Okra is a heat tolerant crop and therefore suitable for being cultivated during the hot season in tropical regions [18]. In the humid tropics and in tropical monsoon regions, the hot season brings about episodes of heavy rain leading to flooding and waterlogging. Heat and heavy rain events may increase under climate change scenarios, causing additional stress for crops [19]. Waterlogging inhibits aerobic respiration in roots, and plants respond to this stress with changes in metabolism, photosynthesis, growth, and development (reviewed by [20]). Plants can adapt to waterlogging by developing adventitious roots or hypertrophied stem bases with lenticels and aerenchyma cells, which enhance root aeration [21]. Few reports investigated the response of okra to water logging and came to contrasting results: [22] reported that 30 days of flooding of two pot-grown okra accessions reduced net photosynthesis, but not shoot fresh or dry biomass in two okra accessions. In contrast, [23] found that waterlogging reduced growth and yield of okra plants.
Measuring flooding stress responses of plants other than biomass or yield reduction at final harvest is laborious. Therefore, physiological investigations during waterlogging such as measuring net photosynthesis or water relations are generally conducted on a relatively small number of plants at a few time points, limiting the data availability for larger germplasm panels over time. Changes in plant growth over time would provide an integrated measurement for photosynthetic and metabolic processes in plants. Automatic field phenotyping devices can provide accurate plant growth data in a non-destructive manner also for large germplasm panels [24]. Based on these data, germplasm with contrasting tolerance phenotypes can be identified for in-depth investigation of tolerance traits and selection of tolerant donor materials for breeding. The present study assessed the variation of the response to water logging in a biodiverse okra core collection using an automatized field phenotyping system and identified germplasm with maintained growth and health under flooding conditions.

2. Materials and Methods

2.1. Plant Material, Genotyping, Core Collection Selection

In total, 840 okra accessions available in the WorldVeg gene bank in 2015 (Supplementary Materials Table S1) were genotyped with 20 SSR markers developed by [25] (Supplementary Materials Table S2). DNA extraction, genotyping, and allele calling were performed as described in [25].
To ensure comparability of the fragment lengths of the microsatellite DNA fragments across all accessions, 61 accessions displaying in total 155 DNA fragments of 20 microsatellite markers were included as standards for genotyping the whole collection. The microsatellite bands were scored as present (1) and absent (0) in MS Excel and the 0/1 matrix was submitted to similarity analysis using Jaccard’s co-efficient in the Darwin package [26]. Dendrograms were produced by the Unweighted Pair Group Method Average (UPGMA). An okra core collection was selected based on SSR genotypic data in Core Hunter software [27] using the default Mixed Replica Algorithm optimizing the Modified Rogers’ distance (weight 0.7) and Shannon’s diversity index (weight 0.3) to define a core comprising about 20% of the entries of the entire collection.
Morphological descriptor data of 32 traits (Abe01-Abe32), including seedling, plant, inflorescence, fruit, and seed traits were collected according to http://seed.worldveg.org/download (accessed on 8 December 2020) (Supplementary Materials Table S3) on plants grown in experimental fields at WorldVeg, Shanhua, Tainan, Taiwan between 2012 and 2015. Diversity analysis by Principal Component Analysis (PCA) was performed with R package PCAmixdata [28]. The percentage of principal component variance between the core collection and the whole collection was calculated by weighting the variance of each principal component by the proportion of eigenvalue. The representativeness of the core set for the morphological diversity of the whole collection was analyzed comparing results of the Principal Component Analyses between the whole and the core collection.

2.2. Phenotyping Flooding Stress Tolerance

A selection of A. esculentus genotypes of the core collection (75 accessions), 3 variants of core collection accessions, 15 breeder-preferred materials, and two commercial varieties (“Lucky Five” and “Ever Lucky”, Known You Seed, Taiwan) were submitted to flooding stress tolerance screening. Only A. esculentus accessions were included in this experiment, as A. caillei, A. manihot, and A. moschatus accessions showed different phenology, making comparison with the faster developing A. esculentus germplasm difficult. The experimental field (20 × 100 m) was flattened, laser-levelled, and evenly covered with black plastic mulch. One plot was 7 m long and 1 m large and accommodated 2 accessions with 4 plants each in a single row. The plants were spaced 60 cm from each other, the plots were separated by 1.6 m and rows by 1.3 m (center from center), except the two central rows were 2 m distant from each other. The soil pH was 8.2 and the organic matter proportion in the soil was 1.2%.
Seeds were sown on 13 July 2020 in seedling trays in a greenhouse, and seedlings were transplanted to the field on 14 August 2020. For each accession, 3 replicated blocks with 4 plants each were planted in complete randomized block design. Before transplanting, the soil in the field was mixed with 400 kg/ha complex fertilizer No.1 (N-P2O5-K2O- organic matter 20-5-10-60%) and 200 kg/ha complex fertilizer No.39 (N-P2O5-K2O- organic matter 12-18-12-50%). One day before flooding (3 September 2020), 200 kg/ha complex fertilizer No.1 was applied to the soil near the plant roots. Pesticide treatment (125 cm3/ha Abamectin 2%, 45 cm3/ha Calypso 40.4% SC, and 125 cm3/ha Alert 10% EC) was applied 14 days after transplanting on 28 August 2020. A second pesticide spray (125 cm3/ha chlorpyrifos 40.8% EC, 125 cm3/ha Pyriproxyfen 11% EC and 150 cm3 Bromopropylate 25% EC) was applied just before flooding, on 4 September 2020. During and after flooding, no pesticides or fertilizers were applied.
Cultivation before flooding was done under rain-fed conditions, as precipitation was sufficient to water the plot to field capacity. Three weeks after transplanting, the field was flooded for 9 days (4 September to 12 September) with ground water and the water level was kept at least 3 cm above the mulch surface. Subsequently, the field was allowed to drain and the plants were observed until final harvest on 28 September 2020, on day 77 after sowing/day 45 after transplanting.
From transplanting to final harvest, the plants were scanned at least two times per day with a Phenospex field scan device (Heerlen, The Netherlands) equipped with two sensor heads, each consisting of a PlantEye F500 high-resolution 3D laser dual scan unit (=2 scanners per unit) mounted on a gantry that moved automatically on rails over the field with a speed of 25 mm/s. The PlantEye sensors acquired 3D point clouds of the plants by simultaneously capturing the reflection of the near-infrared (NIR: 720–750 nm) laser line and from a multispectral flash light (RED: 620–645 nm, GREEN: 530–540 nm and BLUE 460–585 nm). Automated image analysis was performed using the PHENA analytics platform (Phenospex) and data were visualized and analyzed by HortControl 3.0 (Phenospex). Morphological plant parameters such as plant height, leaf area, digital biomass (DBM), and physiological indices such as normalized difference vegetation index (NDVI = (NIR − RED)/(NIR + RED)) and plant senescence reflectance index (PSRI = ((RED − GREEN) / NIR) were automatically obtained. DBM calculated by the Phenospex system as total leaf area * plant height was correlated to plant biomass at r2 = 0.96 (p < 0.01) and plant volume (r2 = 0.97, p < 0.01). Days to first flowering, percentage flowering, and days to harvest of the first fruits were determined visually, and the data were analyzed in R.
For the analysis of biomass and height increment per day and average NDVI and PSRI the weekly averages were taken as follows: Before flooding: Data from day −7 to 0 before flooding onset, during flooding: Data from day 3–9 after flooding onset, early recovery: Data from day 10–16 after flooding onset = from day 1 of drainage on, later recovery day 17–25 after flooding onset (from day 7 of drainage on).

3. Results

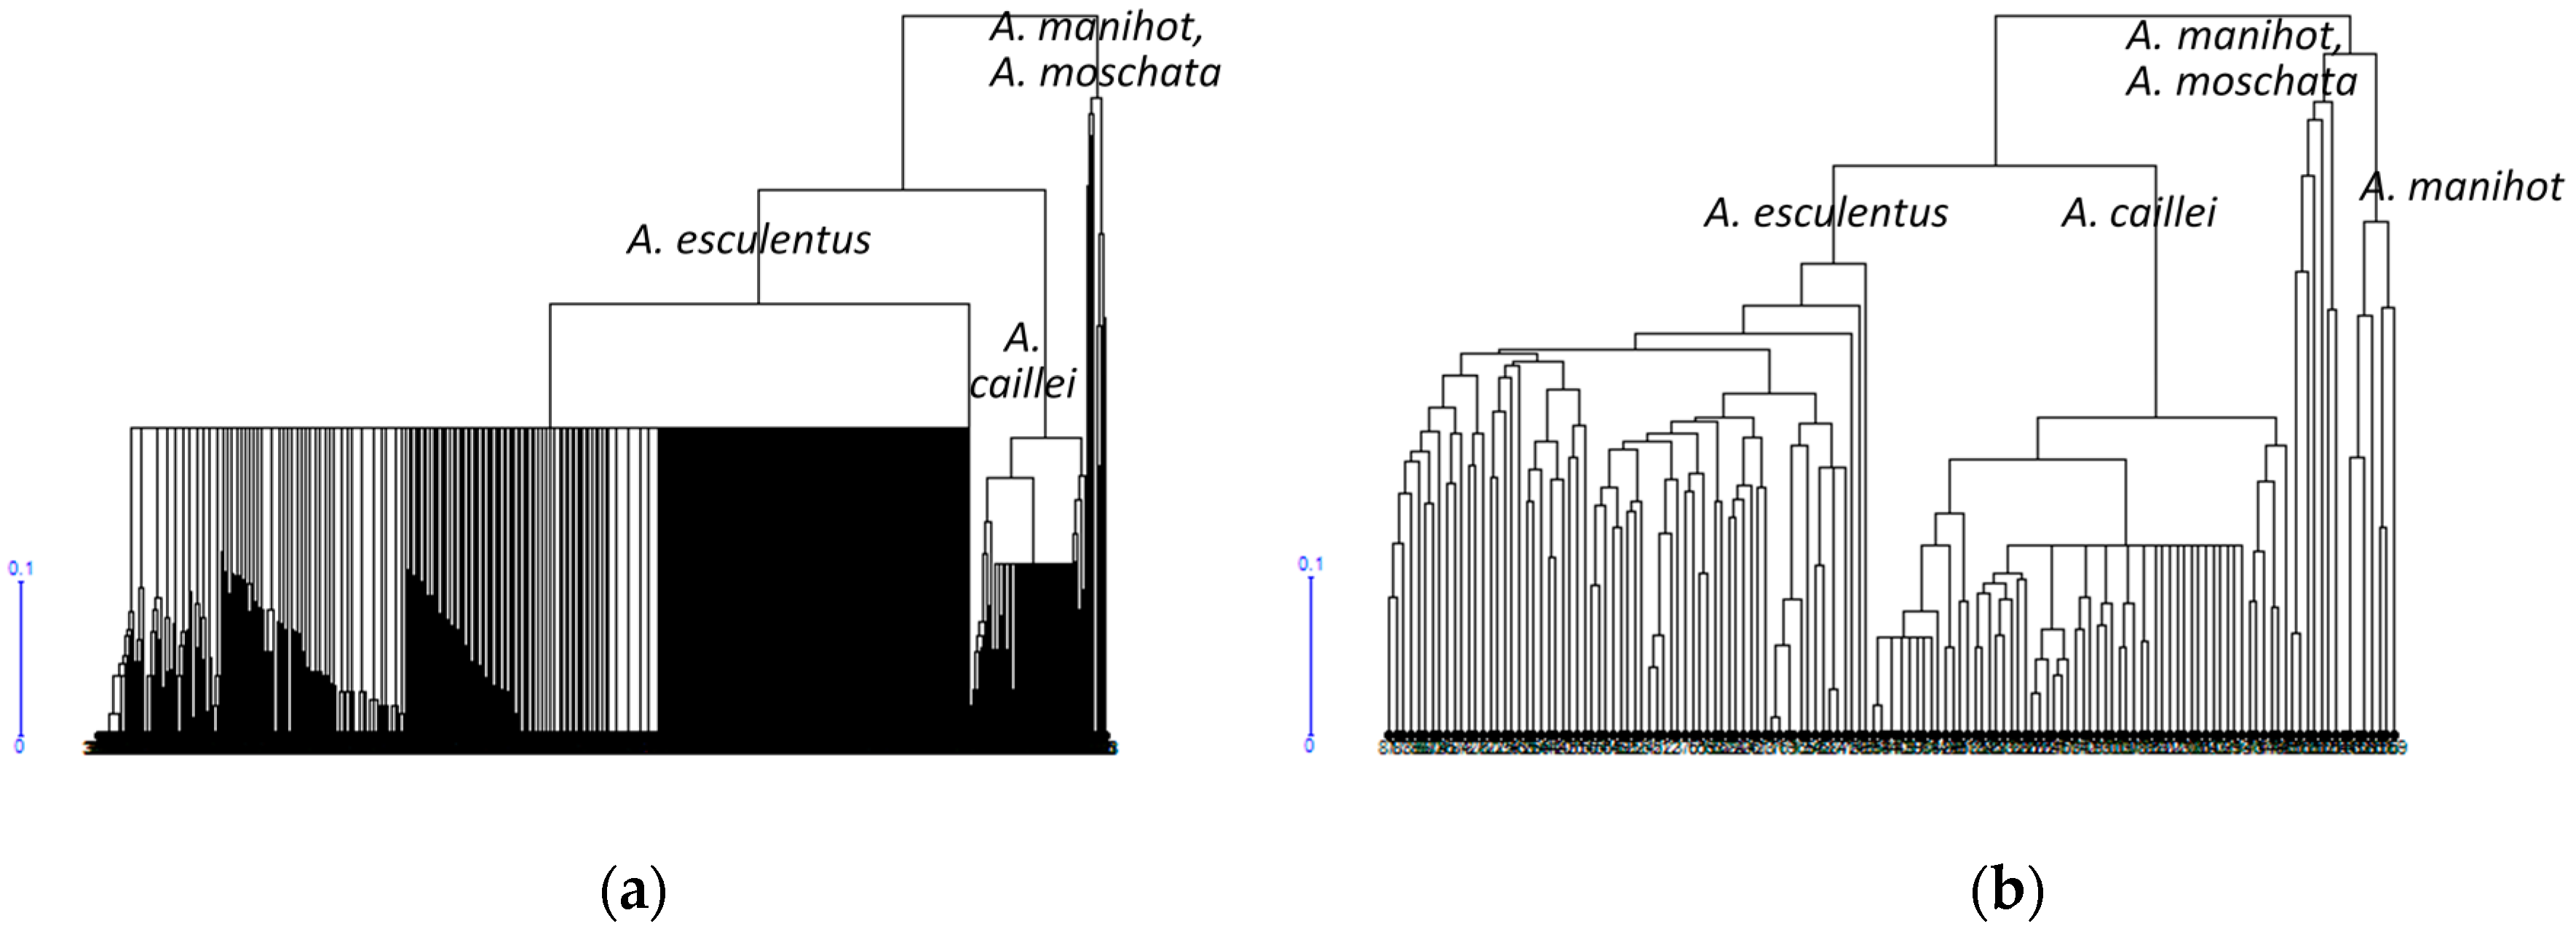
3.1. Diversity of the Okra Genebank Collection

In total, 173 bands have been discovered for 20 microsatellite markers in 840 okra germplasm accessions (Supplementary Materials Table S2). A phylogenetic tree has been constructed for the collection based on marker polymorphisms (Figure 1a). The tree separated A. esculentus and A. caillei accessions from each other, while A. manihot and A. moschatus accessions appeared in two branches separated from the other accessions. A set of 5 markers (AVRDC-Okra1, AVRDC-Okra8, AVRDC-Okra9, AVRDC-Okra17, AVRDC-Okra21) was sufficient to discriminate between A. esculentus, A. caillei, and A. manihot/moschata species of the gene bank collection.

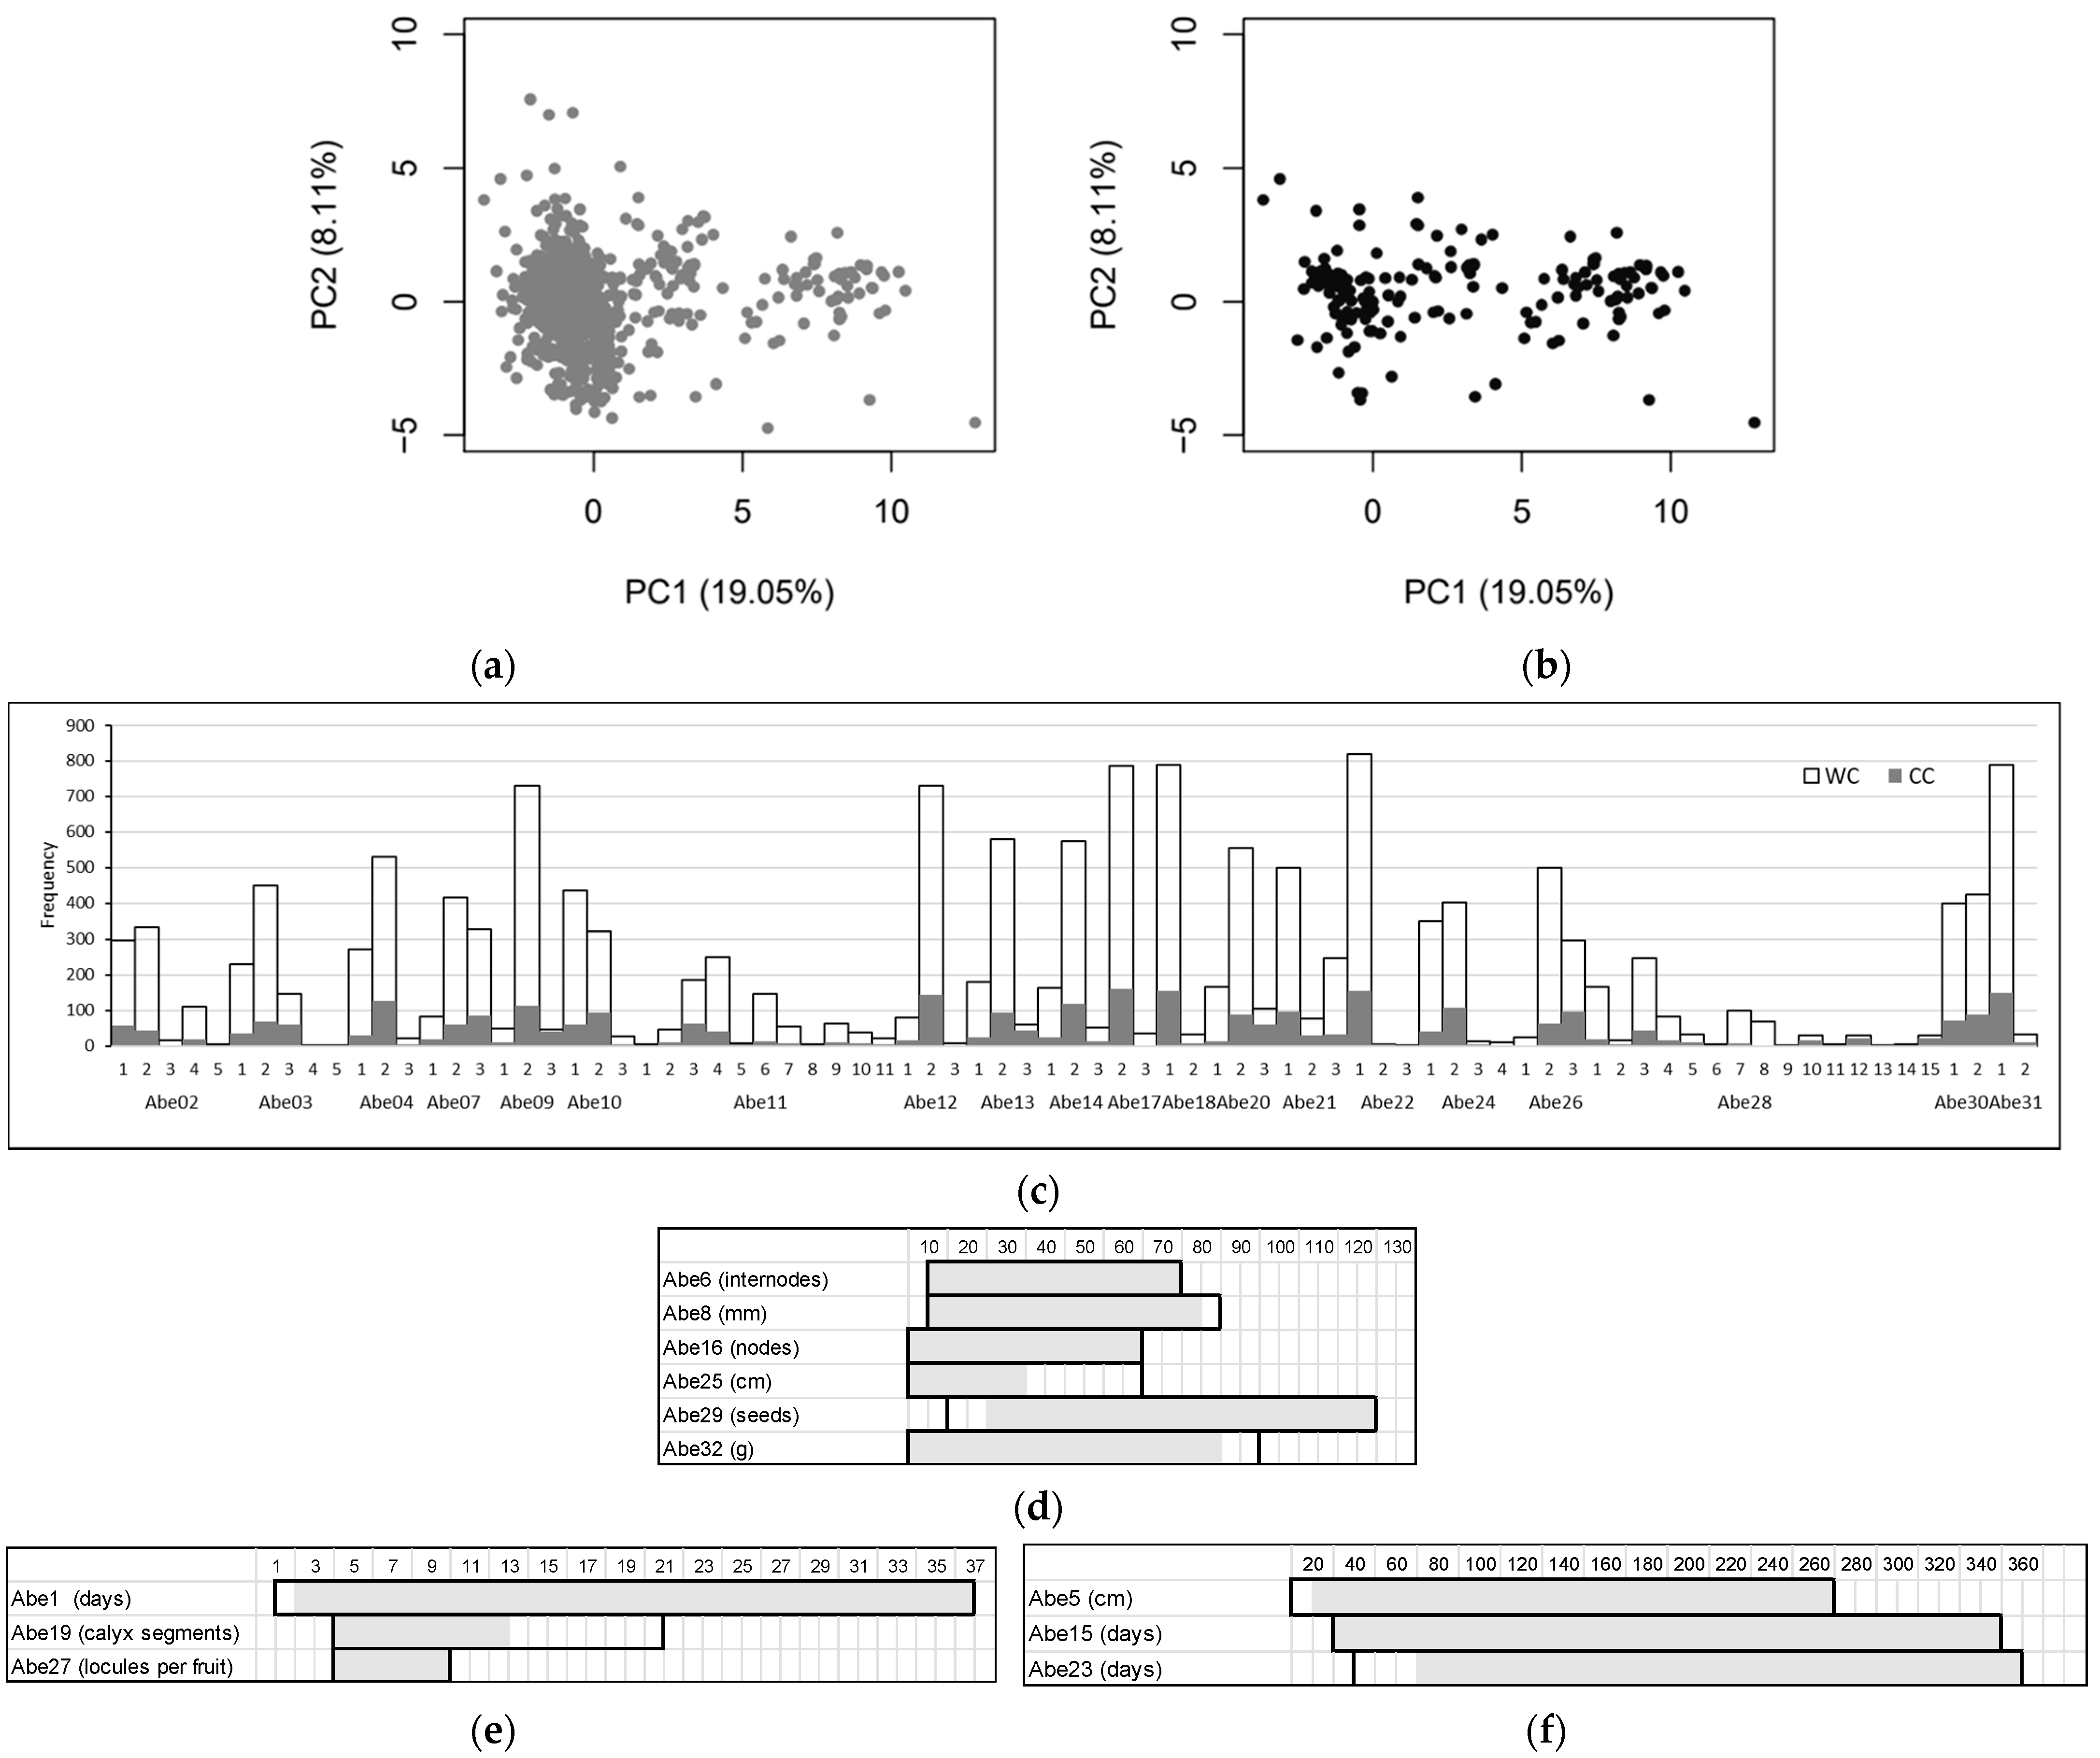
3.2. Okra Core Collection

A core collection comprising about 20% of the total collection (166 accessions) was constructed that displayed 172 of the 173 microsatellite bands present in the whole collection. The phylogenetic tree of the core collection showed a similar structure as the tree for the whole collection (Figure 1b), with the A. caillei accessions well separated from the A. esculentus accessions, and the A. manihot and A. moschata clustering together, with an additional A. manihot clade separated from the joint cluster. The proportion of A. esculentus in the core collection decreased (from 87 to 51%), while the proportion of A. caillei increased (from 10 to 38%), reflecting the larger diversity found in this species. The representation of the geographical diversity was reduced; while the whole collection contained accessions from 40 countries, in the core collection, accessions from 28 countries were retained. A PCA of the phenotypic diversity for 32 traits (Abe01-Abe32) showed that the core collection represented 53% of the principal component variance of the whole collection (Figure 2a,b). Some extreme genotypes in the upper left quadrant in (a) were not represented in (b). A detailed analysis of 22 categorical and 10 quantitative descriptors was performed. For the categorical data, of 81 categories present in the whole collection, 74 (91%) were represented in the core collection (Figure 2c), indicating good representation of the diversity in the core collection. The non-represented categories comprised red fruit color as well as purple cotyledon and hypocotyl color.
An average 87% of the range of the quantitative descriptors present in the whole collection was also found in the core collection (Figure 2d–f). The number of calyx segments and the fruit length were the least represented parameters in the core collection, with about 50% of the range of the whole collection present in the core collection.

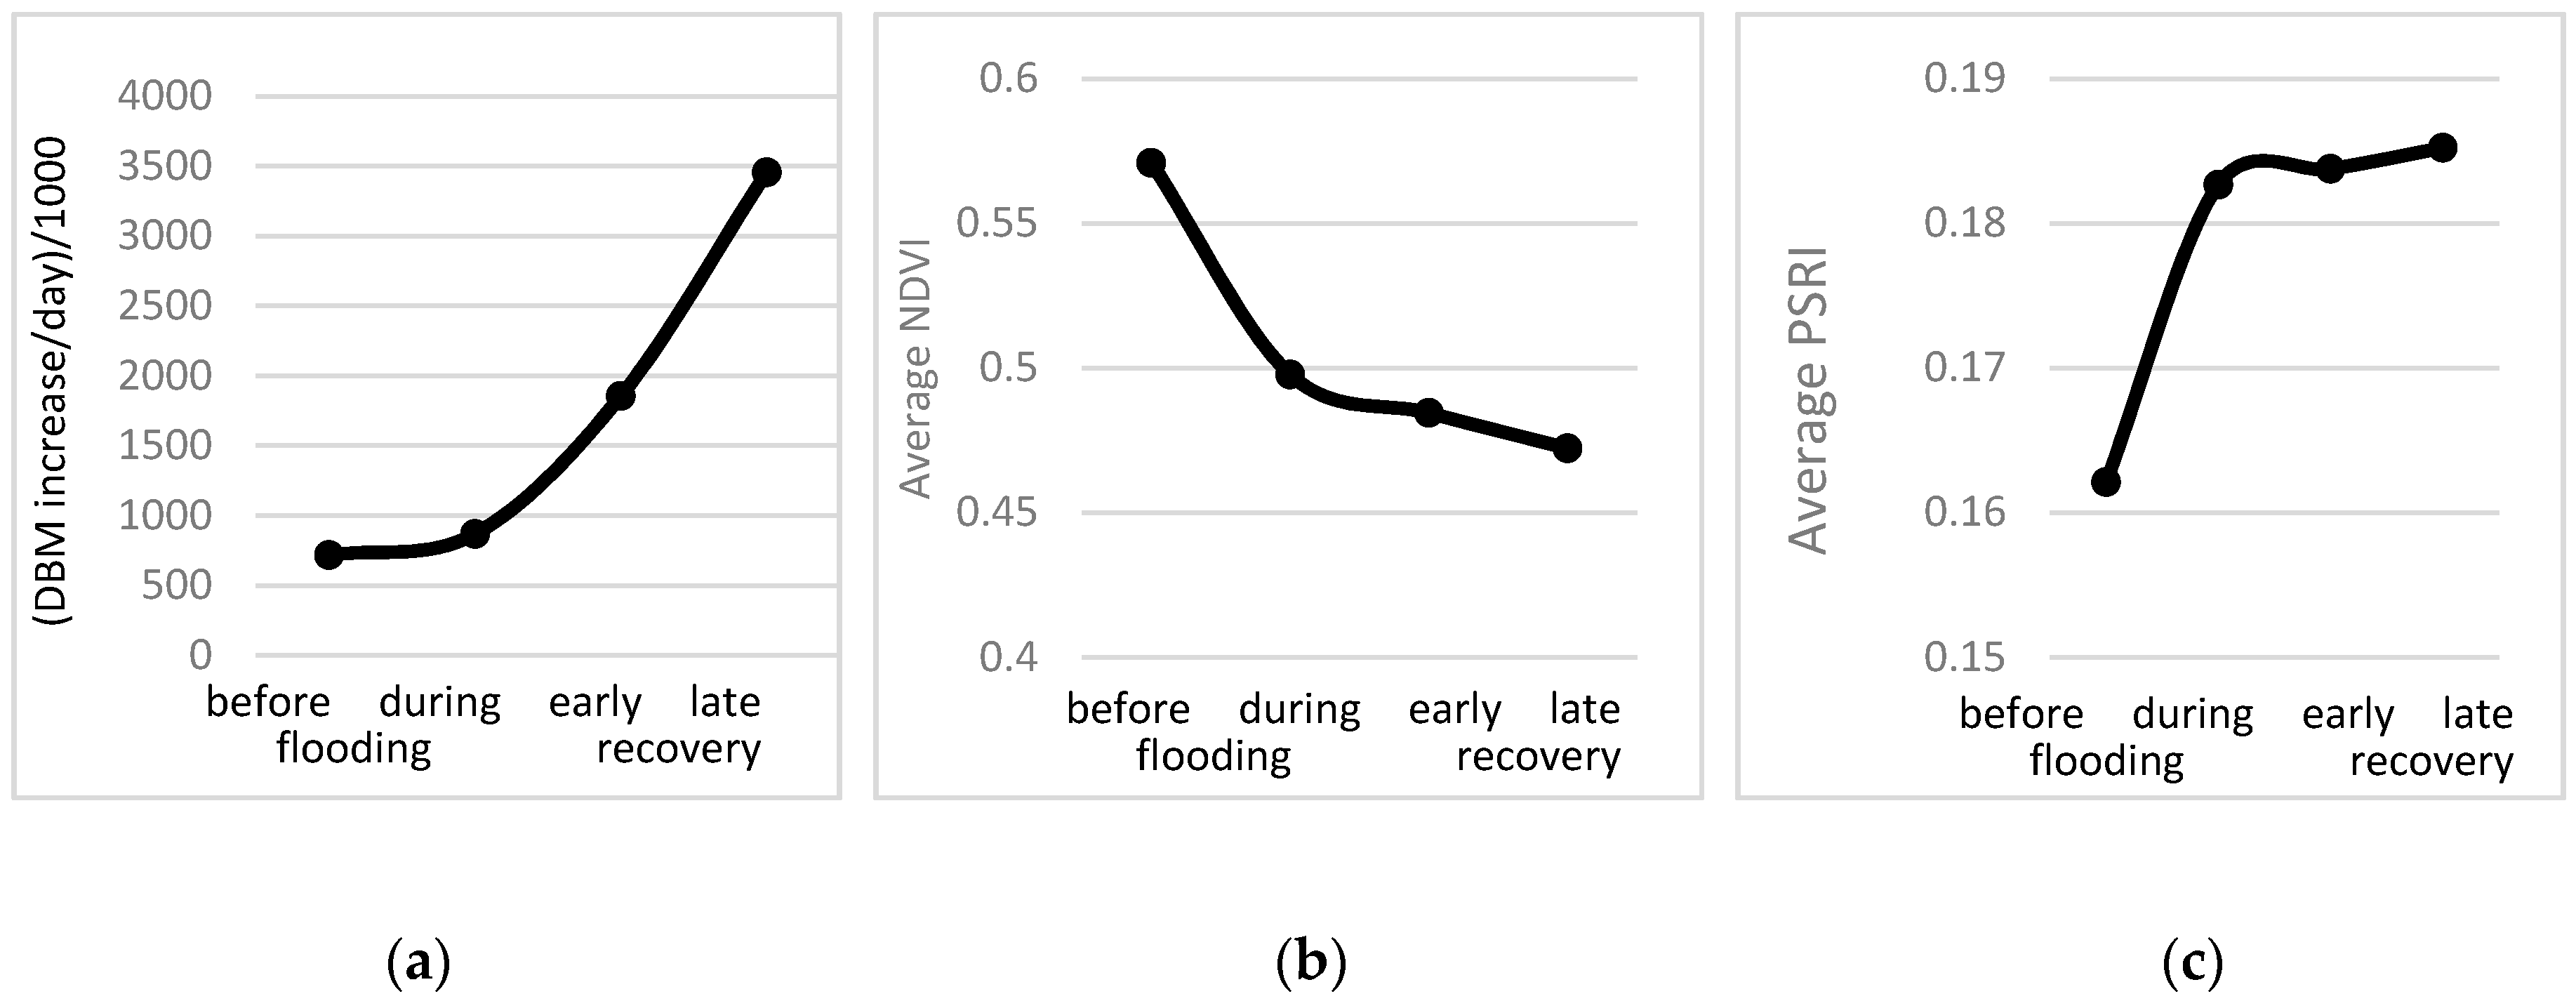
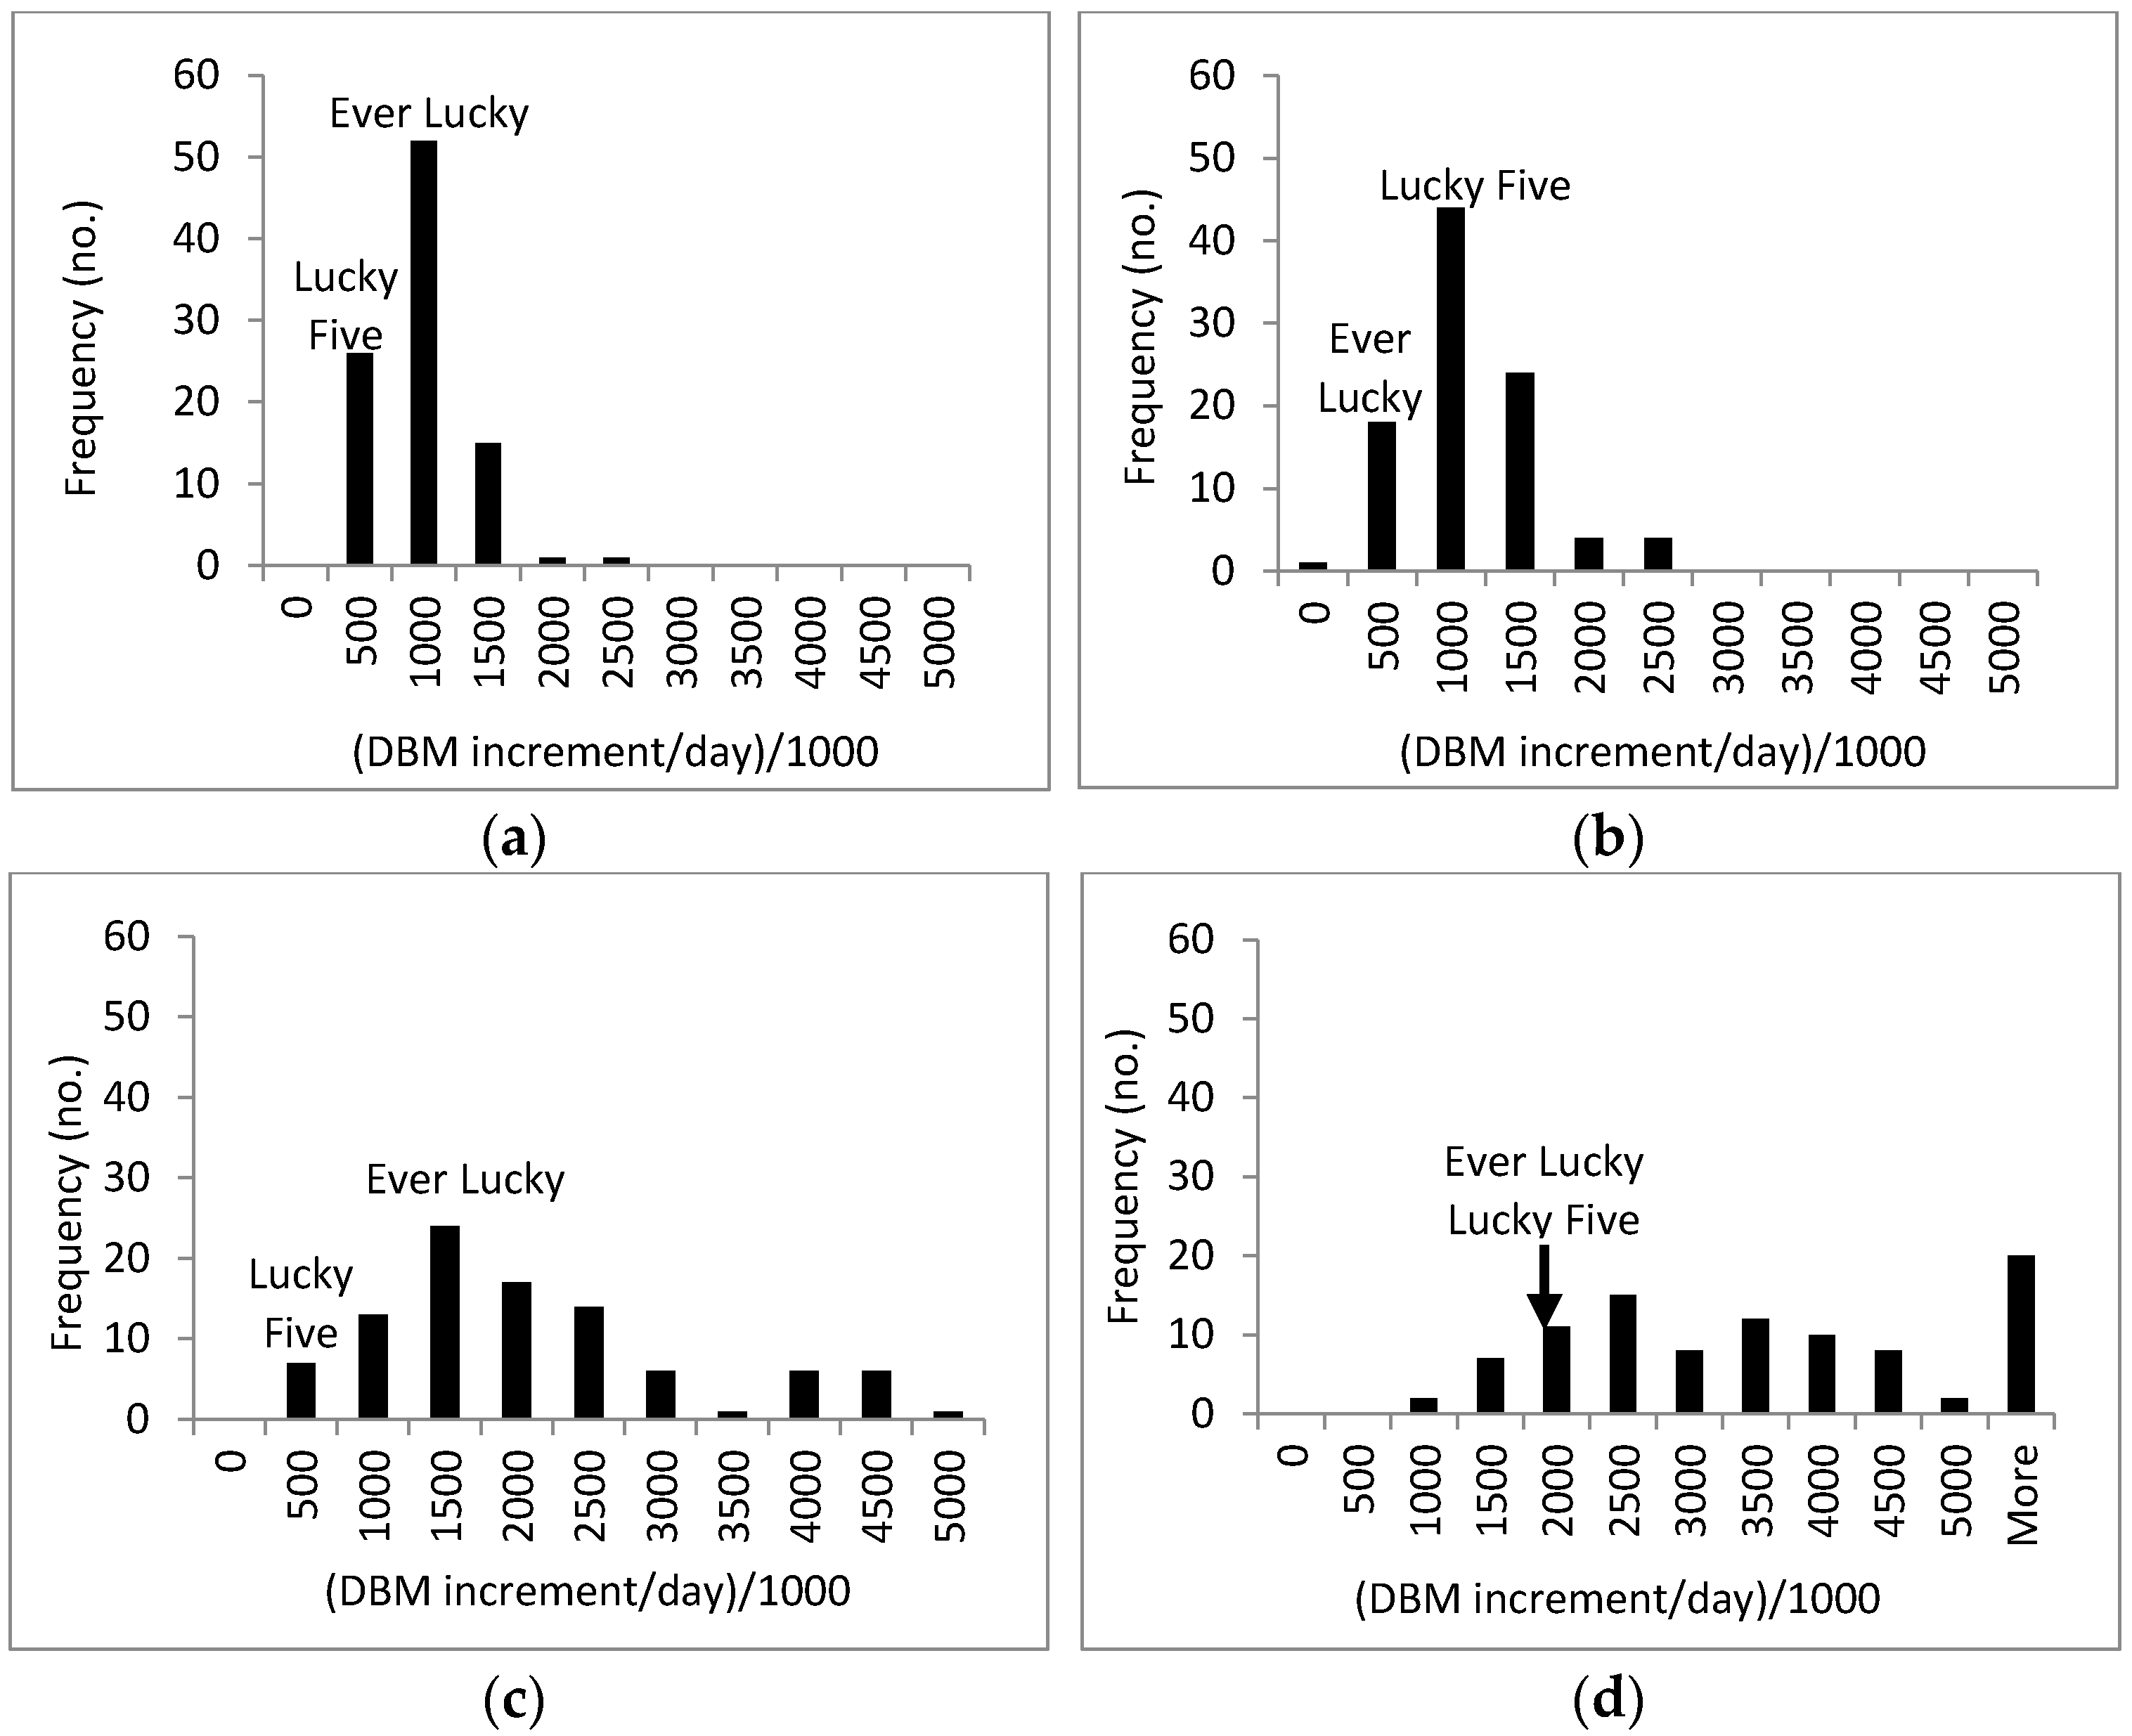
3.3. Response of A. Esculentus to Flooding

Analysis of variance suggested significant differences for DBM and average NDVI between before, during and after flooding across accessions (Table 1). The average increase of DBM per day across the whole duration of the experiment was significantly correlated with NDVI (r = 0.3, p < 0.01) and negatively correlated with PSRI (r = −0.38, p < 0.01).
Average growth per day of the germplasm remained stable from transplanting to flooding and increased once the flooding stress was relieved (Figure 3). As suggested by ANOVA, the okra germplasm showed significant differences in biomass accumulation before, during and after flooding and the differences among the germplasm increased during recovery. Once the flooding stress was released, most accessions recovered and showed strong biomass accumulation (Figure 4a–d). Commercial varieties showed lower biomass increments during all stages than the average of the germplasm accessions. Comparison of biomass increments per day before, during, and after flooding identified accessions that were relatively tolerant to flooding, with good growth increments during flooding and good recovery after stress (Figure 5, Table 2).
Average NDVI decreased during flooding and did not increase again during recovery (Figure 3b). The degree of NDVI reduction under flooding stress and recovery after flooding varied among the germplasm (Figure 6a–d). Commercial variety “Ever Lucky” had above average NDVI during all stages, including flooding. Genotypes with maintained NDVI during flooding and increasing NDVI during recovery were considered to be more tolerant to flooding stress (Table 2).
Average PSRI showed an inverse pattern to NDVI and increased distinctively during flooding, decreased only slightly during early recovery and remained elevated during prolonged recovery (Figure 3c). In all but one accession (VI050170, which had elevated PSRI compared to other accessions also before flooding) PSRI increased under flooding stress conditions (Figure 7a–d). For about one fourth of the germplasm panel the increase was lower than average (Figure 7b). During the recovery phase, PSRI remained elevated compared to before flooding in all accessions. Variety “Ever Lucky” had lower PSRI than the average of the accessions. It is assumed that plants with overall low PSRI and low increase of this parameter compared to pre-flooding conditions have increased tolerance to flooding stress (Table 2).
Investigation of flowering and fruit set was not the aim of the study; the research focused on vegetative traits and the experimental design was not appropriate to measure yield. However, during the observation period, flowers and fruits were observed on about 80% of all entries, but about 45% of the flooding tolerant candidate accessions failed to flower or set fruit during the observation period.

4. Discussion

The largest public sector Abelmoschus germplasm collection comprising 2971 accessions of seven species (A. caillei, A. crinitus, A. esculentus, A. ficulneus, A. manihot, A. moschatus, and A. tuberculatus collected in 55 countries (https://www.genesys-pgr.org/ (accessed on 8 December 2020)) is held by USDA-ARS. The WorldVeg core collection used in this study was to be about a third of the size, and contained accessions of four species (A. caillei, A. esculentus, A. manihot, and A. moschata) collected from 40 countries. The USDA-ARS collection contains more accessions from Europe and Latin America than the WorldVeg collection. The representation of the species was maintained in the core collection, but the geographical diversity was reduced from 40 countries of the whole collection to 29 countries. In total, 30 accessions of the whole collection were derived from the 12 countries that were not represented in the core collection.
In spite of the reduction of the geographical diversity, the Abelmoschus core collection developed in this study contained a large part of the variation of categorical and quantitative descriptors found in the WorldVeg okra collection. In previous studies, a core collection of 50 okra accessions drawn from 260 accessions retained 55% of the principal component variance of 10 descriptors [29]. The present core collection maintains a similar percentage of the principal component variance from 32 descriptors. The PCA showed that some extreme phenotypes (located in the upper left quadrant in Figure 2a) were not represented in the core collection. Nevertheless, the representation of morphological categories and quantitative descriptors in the core collection of 91 and 87%, respectively, suggested good representation of the diversity in the whole collection in the core.
Plants under flooding stress face inadequate oxygen supply of flooded plant parts and are affected by nutrient deficiencies and micronutrient toxicities [30]. In susceptible plants, growth is stalled and shoots are wilting and leaves undergo premature senescence. Okra produces lenticels during flooding or water logging, therefore it is considered to be a waterlogging sensitive plant [23]. However, it was also reported that it can survive water logging after ethylene priming for 15 weeks and produce fruits [23], and suffers no reduction of growth under flooding for 30 days [22]. Instructions for okra production, however, indicate to avoid flooding the plants during irrigation [31]. Due to increasing production during the wet season and due to climate change, okra may become more exposed to flooding or waterlogging at many locations, therefore identifying variation in flooding sensitivity could support the development of more resilient cultivars. The biodiverse okra core collection reported here could be a good source of variation for flooding tolerance.
Tolerance to flooding implicates the ability to maintain photosynthesis and to avoid oxygen shortage in roots [32]. Measuring photosynthetic efficiency on large germplasm panels over time is costly and practically challenging, and therefore difficult to implement for screening large germplasm panels for variation of flooding stress responses. Variation in photosynthetic efficiency translates into variation in growth rate and productivity [33]. Biomass increment per unit of time integrates the effects of many plant processes and therefore is a representative measurement for the plant response to environmental factors. Automatized phenotyping through 3D laser scanning provides accurate measurements for DBM increment at relatively low cost and with minimum labor requirement [34,35]. Multispectral data obtained in addition to the 3D scans from the Phenospex S500 plant eye can be used to determine physiological indices such as NDVI and PSRI. All these measurements were taken in a non-destructive manner over time and thus allowed the observation of the same plants during the whole experiment, before, during, and after flooding, yielding data for plant parameters over time.
NDVI is increasingly used in precision agriculture, as it correlates with plant growth, health, and often with yield [36]. NDVI data can be obtained by various ways, ranging from remote sensing using satellites to data capture through hand-held sensors. NDVI during crop development generally follows a bell-shaped curve and increases during the vegetative phase and decreases during crop maturation [37]. NDVI has been used to estimate the damage of flooding to corn [38], for indirect selection for yield [39] and to measure plant vigor and plant stress [40], including at very early plant developmental stages [41]. In the present study we tested variation of NDVI during okra development, before, during and after flooding. Besides a general decline of NDVI during flooding, we observed genotypic differences in the degree of this decline, leading to the hypothesis that plants with less decline are less stressed. Correlation between NDVI and the amount of biomass accumulation support this hypothesis. In parallel, PSRI was assessed. PSRI generally decreases during the growing phases of a crop, plateaus during the green phase at very low values, and rapidly increases during the senescent phase [37]. A strong increase of PSRI during flooding compared to pre-flooding conditions indicates that the plants in average were affected by flooding. Differences in PSRI increase during flooding varied among the germplasm, suggesting variation of tolerance in the core collection. During recovery, PSRI ceased to increase in average, but remained elevated, probably because the duration of the experiment was not long enough to develop new canopy layers that completely mask the leaves that were affected by flooding stress.
Overall, screening of the core collection showed that gene bank accessions had in average higher DBM increment than the two commercial varieties included in the test set, while in variety “Ever Lucky” NDVI remained higher, and PSRI remained lower than in the average of the germplasm panel. The screening resulted in a set of genotypes with high average daily biomass increment, low decrease of NDVI, and low increase of PSRI under flooding stress, as well as genotypes that showed good recovery after the stress treatment. Interestingly, a large proportion of the candidate genotypes for flooding tolerance did not flower during the experiment. A longer vegetative phase may contribute to the maintained biomass increase in some of the genotypes that showed well maintained growth increment during flooding. Further investigations of the interactions between phenology responses to flooding are required to assess the interaction between apparent flooding tolerance on the level of DBM increment and delayed flowering. In future experiments, the candidate genotypes for flooding tolerance will be tested in a split plot design, comparing the performance of putatively tolerant and susceptible genotypes under flooded and control conditions to verify the flooding tolerance of the material and select the most tolerant genotypes for breeding. These materials will also be submitted to yield trials to assess the yield potential and pod quality of the tolerant materials.

5. Conclusions

A core collection representing the diversity of the WorldVeg okra collection was established by selecting a genotype set comprising 20% of the whole collection based on microsatellite genotypes. Quality assessment of the core collection revealed that 91% of the categories found in the whole collection were also present in the core. Overall, 53% of the principal component variance of, in total, 32 traits of the whole collection were also present in the core collection. Variation in terms of biomass increment per day, NDVI and PSRI under flooding and during recovery measured by high throughput phenotyping under field conditions facilitated the selection of flooding tolerant candidate germplasm to be submitted to more detailed studies.

Supplementary Materials

The following are available online at https://www.mdpi.com/2077-0472/11/2/165/s1, Table S1: List of the germplasm used in the study (WorldVeg okra collection, core collection, germplasm set for the flooding study) and microsatellite genotypes of the entries. Table S2: Microsatellite markers used for diversity analysis and core collection establishment, Table S3: Morphological descriptor data of Abelmoschus sp.

Author Contributions

Conceptualization, R.S. and C.-Y.L.; methodology, R.S. and Y.-P.L.; investigation, C.-Y.L., Y.-P.L., T.-H.W., C.-H.H., C.-L.P., S.-H.C., Y.-C.J., Y.-Y.H.; genetic resources T.-H.W., Y.-Y.H.; writing—original draft preparation R.S., C.-H.H.; writing—review and editing: All. All authors have read and agreed to the published version of the manuscript.

Funding

This research was funded by the Council of Agriculture, Executive Yuan, Taiwan. Additional funding was received by long-term strategic donors to the World Vegetable Center: Taiwan (Council of Agriculture and Ministry of Foreign Affairs), UK aid of the United Kingdom, United States Agency for International Development, Australian Centre for International Agricultural Research, BMZ of Germany, Thailand, the Philippines, Korea, and Japan.

Institutional Review Board Statement

This study did not include human or animal subjects.

Informed Consent Statement

This study did not include research on human subjects.

Data Availability Statement

The genotypic data are available in the supplemental files. The phenotypic data are available under https://worldveg.tind.io/ (accessed on 8 December 2020). or directly from the authors upon request.

Acknowledgments

We thank the WorldVeg field team and laboratory staff for their support of this work. The support of the phenotyping trial through Hsu Ching-yuan and Wu Chung Sung is particularly appreciated. We also thank the Phenospex Customer Service Team for their continuous and very efficient support.

Conflicts of Interest

The authors declare no conflict of interest. The funders had no role in the design of the study; in the collection, analyses, or interpretation of data; in the writing of the manuscript, or in the decision to publish the results.

References

  1. Joshi, A.B.; Gadwal, V.R.; Hardas, M.W. Okra. In Evolutionary Studies in World Crops, Diversity and Change in the Indian Subcontinent; Hutchinson, J.B., Ed.; Cambridge University Press: Cambridge, UK, 1974; pp. 99–105. [Google Scholar]
  2. Vavilov, N.I. Studies on the Origin of Cultivated Plants; L’Institut de Botanique Appliquee Amélioration Plantes: Leningrad, Russian, 1926. [Google Scholar]
  3. Van Borssum Waalkes, J. Malesian Malvaceae revised. Blumea 1966, 14, 1–213. [Google Scholar]
  4. Bates, D.M. Notes on the cultivated Malvaceae 2. Abelmoschus. Baileya 1968, 26, 99–112. [Google Scholar]
  5. Chheda, H.R.; Fatokun, C.A. Numerical analysis of variation patterns in okra (Abelmoschus esculentus L. Moench). Bot. Gaz. 1982, 143, 253–261. [Google Scholar] [CrossRef]
  6. Lamont, W.J. Okra—A versatile vegetable crop. Horttechnology 1999, 9, 179–184. [Google Scholar] [CrossRef] [Green Version]
  7. Reddy, M.T. Crossability behaviour and fertility restoration through colchiploidy in interspecific hybrids of Abelmoschus esculentus × Abelmoschus manihot subsp. Tetraphyllus. Int. J. Plant Sci. Ecol. 2015, 1, 172–181. [Google Scholar]
  8. Amitaaba, T. Hybidization Studies in Okra (Abelmoschus spp. (L.) Moench). Ph.D. Thesis, University of Ghana, Accra, Ghana, July 2016. [Google Scholar]
  9. Chevalier, A. L’origin, la culture et les usage de cinq Hibiscus de la section Abelmoschus. Rev. Bot. Appl. Agric. Trop. 1940, 20, 319–328. [Google Scholar] [CrossRef]
  10. Cornucopia, F.S. A Source Book of Edible Plants; Kampong Publications: Vista, CA, USA, 1990. [Google Scholar]
  11. Luan, F.; Wu, Q.; Zeng, N.; Lv, H.; Liu, D.; Gan, Z. Traditional uses, chemical constituents, and biological properties, clinical settings, and toxicities of Abelmoschus manihot L.: A comprehensive review. Front. Pharmacol. 2020, 11, 1068. [Google Scholar] [CrossRef] [PubMed]
  12. FAOSTAT. 2018. Available online: http://www.fao.org/faostat/en/#data/QC (accessed on 18 November 2020).
  13. Moosavi, S.A.; Aghaalikhani, M.; Ghobadian, B.; Fayyazi, E. Okra: A potential future bioenergy crop in Iran. Renew. Sust. Energy Rev. 2018, 93, 517–524. [Google Scholar] [CrossRef]
  14. Anwar, F.; Qadir, R.; Ahmad, N. Cold pressed okra (Abelmoschus esculentus) seed oil. In Cold Pressed Oils; Ramadan, M.F., Ed.; Academic Press: Cambridge, MA, USA, 2020; pp. 309–314. [Google Scholar] [CrossRef]
  15. Das, S.; Nandi, G.; Ghosh, L.K. Okra and its various applications in drug delivery, food technology, health care and pharmacological aspects-a review. Int. J. Pharm. Sci. Res. 2019, 11, 2139–2147. [Google Scholar]
  16. Chowdhury, S.; Kumar, S. Okra breeding: Recent approaches and constraints. Ann. Biol. 2019, 35, 55–60. [Google Scholar]
  17. Van Hintum, T.J.; Brown, A.H.; Spillane, C. Core Collections of Plant Genetic Resources; IPGRI Technical Bulletin No. 3; International Plant Genetic Resources Institute: Rome, Italy, 2000. [Google Scholar]
  18. Ahmad, J.; Balal, R.M.; Shahid, M.A.; Akhtar, G.; Akram, A.; Khan, M.W.; Zubair, M. Characterization of okra genotypes at reproductive stage under high temperature stress. Int. J. Chem. Biochem. Sci. 2016, 9, 44–48. [Google Scholar]
  19. Zhao, Y.; Wang, C.; Wang, S.; Tibig, L.V. Impacts of present and future climate variability on agriculture and forestry in the humid and sub-humid tropics. Clim. Chang. 2005, 70, 73–116. [Google Scholar] [CrossRef]
  20. Zhou, W.; Chen, F.; Meng, Y.; Chandrasekaran, U.; Luo, X.; Yang, W.; Shu, K. Plant waterlogging/flooding stress responses: From seed germination to maturation. Plant Physiol. Biochem. 2020, 148, 228–236. [Google Scholar] [CrossRef] [PubMed]
  21. Calvo-Polanco, M.; Senorans, J.; Zwiazek, J.J. Role of adventitious roots in water relations of tamarack (Larix laricina) seedlings exposed to flooding. BMC Plant Biol. 2012, 12, 99–107. [Google Scholar] [CrossRef] [PubMed] [Green Version]
  22. Ashraf, M.; Arfan, M. Gas exchange characteristics and water relations in two cultivars of Hibiscus esculentus under waterlogging. Biol. Plant. 2005, 49, 459–462. [Google Scholar] [CrossRef]
  23. Vwioko, E.D.; El-Esawi, M.A.; Imoni, M.E.; Al-Ghamdi, A.A.; Ali, H.M.; El-Sheekh, M.M.; Abdeldaym, E.A.; Al-Dosary, M.A. Sodium azide priming enhances waterlogging stress tolerance in okra (Abelmoschus esculentus L.). Agronomy 2019, 9, 679. [Google Scholar] [CrossRef] [Green Version]
  24. Pratap, A.; Gupta, S.; Nair, R.M.; Gupta, S.K.; Schafleitner, R.; Basu, P.S.; Singh, C.M.; Prajapati, U.; Gupta, A.K.; Nayyar, H.; et al. Using plant phenomics to exploit the gains of genomics. Agronomy 2019, 9, 126. [Google Scholar] [CrossRef] [Green Version]
  25. Schafleitner, R.; Kumar, S.; Lin, C.Y.; Hegde, S.G.; Ebert, A. The okra (Abelmoschus esculentus) transcriptome as a source for gene sequence information and molecular markers for diversity analysis. Gene 2013, 517, 27–36. [Google Scholar] [CrossRef]
  26. Perrier, X.; Jacquemoud-Collet, J.P. DARwin Software. 2006. Available online: http://darwin.cirad.fr/darwin (accessed on 2 November 2020).
  27. De Beukelaer, H.; Smýkal, P.; Davenport, G.F.; Fack, V. Core Hunter II: Fast core subset selection based on multiple genetic diversity measures using Mixed Replica search. BMC Bioinform. 2012, 13, 312. [Google Scholar] [CrossRef] [PubMed] [Green Version]
  28. Chavent, M.; Kuentz-Simonet, V.; Labenne, A.; Saracco, J. Multivariate analysis of mixed data: The PCAmixdata R package. arXiv 2014, arXiv:1411.4911, 132. [Google Scholar]
  29. Mahajan, R.K.; Bisht, I.S.; Agrawal, R.C.; Rana, R.S. Studies on South Asian okra collection: Methodology for establishing a representative core set using characterization data. Genet. Resour. Crop. Evol. 1996, 43, 249–255. [Google Scholar] [CrossRef]
  30. Setter, T.L.H.; Khabaz-Saberi, W.I.; Singh, K.N.; Kulshreshtha, N.; Sharma, S.K. Review of waterlogging tolerance in wheat in India: Involvement of element/microelement toxicities, relevant to yield plateau and opportunities for crop management. In International Symposium on Balanced Fertilization; Ludhiana Benbi, D.K., Brar, M.S., Bansal, S.K., Eds.; Punjab Agricultural University: Ludhiana, India, 2006; pp. 513–520. [Google Scholar]
  31. Chittora, A.; Singh, N. Production technology of okra. Marumegh 2016, 1, 48–51. [Google Scholar]
  32. Caudle, K.L.; Maricle, B.R. Effects of flooding on photosynthesis, chlorophyll fluorescence, and oxygen stress in plants of varying flooding tolerance. Trans. Kans. Acad. Sci. 2012, 115, 5–18. [Google Scholar] [CrossRef]
  33. Flood, P.J.; Harbinson, J.; Aarts, M.G. Natural genetic variation in plant photosynthesis. Trends Plant Sci. 2011, 16, 327–335. [Google Scholar] [CrossRef] [PubMed]
  34. Ehlert, D.; Horn, H.J.; Adamek, R. Measuring crop biomass density by laser triangulation. Comput. Electron. Agric. 2008, 61, 117–125. [Google Scholar] [CrossRef]
  35. Maphosa, L.; Thoday-Kennedy, E.; Vakani, J.; Phelan, A.; Badenhorst, P.; Slater, A.; Spangenberg, G.; Kant, S. Phenotyping wheat under salt stress conditions using a 3D laser scanner. Isr. J. Plant Sci. 2017, 64, 55–62. [Google Scholar] [CrossRef]
  36. Berger, A.; Ettlin, G.; Quincke, C.; Rodríguez-Bocca, P. Predicting the Normalized Difference Vegetation Index (NDVI) by training a crop growth model with historical data. Comput. Electron. Agric. 2019, 161, 305–311. [Google Scholar] [CrossRef]
  37. Holtgrave, A.K.; Röder, N.; Ackermann, A.; Erasmi, S.; Kleinschmit, B. Comparing Sentinel-1 and-2 Data and indices for agricultural land use monitoring. Remote Sens. 2020, 12, 2919. [Google Scholar] [CrossRef]
  38. Shrestha, R.; Di, L.; Eugene, G.Y.; Kang, L.; Shao, Y.Z.; Bai, Y.Q. Regression model to estimate flood impact on corn yield using MODIS NDVI and USDA cropland data layer. J. Integr. Agric. 2017, 16, 398–407. [Google Scholar] [CrossRef] [Green Version]
  39. Phyu, P.; Islam, M.R.; Sta Cruz, P.C.; Collard, B.C.Y.; Kato, Y. Use of NDVI for indirect selection of high yield in tropical rice breeding. Euphytica 2020, 216, 74. [Google Scholar] [CrossRef]
  40. Rizk, H.; Habib, M.K. Robotized early plant health monitoring system. In Proceedings of the IECON 2018-44th Annual Conference of the IEEE Industrial Electronics Society, Washington, DC, USA, 21 October 2018; pp. 3795–3800. [Google Scholar]
  41. Beisel, N.S.; Callaham, J.B.; Sng, N.J.; Taylor, D.J.; Paul, A.L.; Ferl, R.J. Utilization of single-image normalized difference vegetation index (SI-NDVI) for early plant stress detection. Appl. Plant Sci. 2018, 6, e01186. [Google Scholar] [CrossRef] [PubMed]
Figure 1. (a) Phylogenetic tree of the WorldVeg Abelmoschus collection and (b) of the WorldVeg Abelmoschus core collection constructed based on 20 microsatellite markers. The species contained in each clade are indicated.
Agriculture 11 00165 g001
Figure 2. (a) Principal Component Analysis (PCA) of 32 quantitative and morphological descriptors in the whole collection and (b) in the core collection. (c) Analysis of categorical data in the whole collection (white bars) and the core collection (black bars). (df) Comparison of the range of quantitative data in the whole collection (boxes) and the core collection (shaded bars).
Agriculture 11 00165 g002
Figure 3. (a) Average DBM increments per day, (b) average NDVI, and (c) average PSRI of the germplasm and the control genotypes before and during flooding, as well as during early and late recovery.
Agriculture 11 00165 g003
Figure 4. Frequency distribution of average daily biomass increments (a) before flooding, (b) during flooding, (c) during early recovery, and (d) during late recovery. The commercial checks are attributed to their DBM increase bin.
Agriculture 11 00165 g004
Figure 5. (a) Biomass increase under flooding in relation to the increase before flooding. Relative tolerant accessions are circled; (b) biomass increase per day during recovery in relation to the increase during flooding. Accessions with good recovery are circled. The accessions with the highest biomass during flooding and recovery related to before flooding are listed in Table 2.
Agriculture 11 00165 g005
Figure 6. (a) Frequency distribution of average NDVI (a) before flooding, (b) during flooding, (c) during early recovery, and (d) during prolonged recovery. The commercial checks are attributed to their NDVI bin.
Agriculture 11 00165 g006
Figure 7. (a) Frequency distribution of average PSRI (a) before flooding, (b) during flooding, (c) during early recovery, and (d) during prolonged recovery. The commercial checks are attributed to their PSRI bin.
Agriculture 11 00165 g007
Table 1. Analysis of variance of growth and health related data measured by automatic phenotyping.
Period
(before, during and after Flooding)
GenotypeReplication
DBM (AUC)<0.001 *<0.001 *0.6330
NDVI average slope<0.001 *0.001 *0.6241
PSRI average slope0.12940.0353 *0.1453
DBM: Digital biomass. AUC: Area under the curve. NDVI: Normalized difference vegetation index. PSRI: Plant Senescence Reflectance Index *: significant at 99.9% confidence level.
Table 2. Flooding tolerant candidate accessions.
AccessionOriginFlowering and Fruit Setting before 65 Days after SowingMaintained Growth under FloodingGood Recovery after FloodingMaintained NDVI under FloodingLow Increase of PSRI under Flooding
VI033791Malaysia
VI047518Bangladesh
VI050170Taiwan
VI055884Laos
VI056451USA
VI059479Malawi
VI060132Mali
VI060690BBenin
VI060739AThailand
VI060748APhilippines
VI060784USA (heirloom variety “Burgundy”)
VI060801Turkey
VI060806Turkey (local variety “Amasya”)
VI060822Nigeria
VI060837BMali
VI060838BMali
VI060850Mali
VI061719Guinea
VI061723Senegal
VI061750Senegal
VI061803Senegal
VI062547Niger (local variety “Gaya”)
Publisher’s Note: MDPI stays neutral with regard to jurisdictional claims in published maps and institutional affiliations.

