Article

Diets, Food Choices and Environmental Impacts across an Urban-Rural Interface in Northern Vietnam

1
International Center for Tropical Agriculture (CIAT)-Asia Office, Hanoi 100000, Vietnam
2
Department of Mathematics and Statistics, Thuongmai University, Hanoi 100000, Vietnam
3
Wageningen Economic Research, Wageningen University and Research, Prinses Beatrixlaan 582, 2595 BM Den Haag, The Netherlands
4
Department of Global Development, College of Agriculture and Life Sciences, Cornell University, Ithaca, NY 14853, USA
5
Department of Epidemiology and Biostatistics, University of California, San Francisco, CA 95616, USA
6
School for Environment and Sustainability, University of Michigan, Ann Arbor, MI 48109, USA
7
School of Public Health, University of Michigan, Ann Arbor, MI 48109, USA
8
Division of Human Nutrition and Health, Wageningen University, P.O. Box 9101, 6700 HB Wageningen, The Netherlands
9
National Institute of Nutrition (NIN), Hanoi 100000, Vietnam
10
International Potato Center (CIP), Avenida La Molina 1895, Apartado 1558, 15023 Lima 12, Peru
*
Authors to whom correspondence should be addressed.
Agriculture 2021, 11(2), 137; https://doi.org/10.3390/agriculture11020137
Submission received: 31 December 2020 / Revised: 25 January 2021 / Accepted: 2 February 2021 / Published: 7 February 2021
(This article belongs to the Special Issue Agriculture and Food Systems – Global and Local Comparisons)

Abstract

:
Human diets and their associated environmental impacts differ across segments of the population. There is evidence that consumer choices of food intake can also affect the overall environmental impacts of a food system. This paper analyzes the environmental impact of diets and food choices across a rural–urban transect in Northern Vietnam by using mixed survey data from 619 adult respondents. The average greenhouse gas emissions (GHGE) resulting from producing the daily food intake of adults in the urban and peri-urban districts were similar, while the average in the rural district was lower. Although starchy staples contributed the most to energy intake, pork and beef were the largest contributors to GHGE. Metrics of blue water use were higher for diets of males than those of females in all three districts. Interestingly, the difference in mean diet diversity score between urban and rural households was significant, and females’ diets were more diverse than those of males. As expected, urban households were more likely to buy food, while rural households often produced their own foods. Urban households reported prioritizing personal health and the natural content of food and would increase seafood and fruits if their income were to increase. In rural regions, interventions aimed at reducing undernutrition should address improving diet quality without significant increases to diet-related environmental impacts.

1. Introduction

The modern food system faces the key challenge of adequately supplying nutrition for a growing population while also addressing the environmental impacts of the global food supply. The State of Food Security and Nutrition in the World 2020 [1] declared that the global population is not on track to achieve the UN’s Zero Hunger goals by 2030 and that the hidden costs related to diets, such as disease risks and climate emissions, will continue to increase. The diet-related health costs linked to mortality and non-communicable diseases (NCD) combined with the social cost of diet-related greenhouse gas emissions (GHGE) are projected to exceed USD 3 trillion per year by 2030 [2]. Agriculture, Forestry and Other Land Use (AFOLU) sectors are responsible for 25% of net anthropogenic GHGE [3].
Despite increased global food production, an estimated 690 million people (8.9% of the global population) were undernourished in 2020, an estimate projected to rise to 860 million by 2030 [1]. Many populations suffer from a nutritional triple burden—the presence of obesity, stunting, and micronutrient deficiencies—each of which increases chronic disease risk [4]. The Food and Agriculture Organization (FAO) defined a sustainable food system as “[delivering] food security and nutrition for all in such a way that the economic, social and environmental bases to generate food security and nutrition for future generations are not compromised” [5]. Achievement of a sustainable food system will require applying a holistic perspective to research and policy to identify potential synergies and trade-offs between three key dimensions of the food system—economic, social, and environmental outcomes—and overcome systemic challenges.
Vietnam’s recent rapid economic development has involved trade-offs between human health and nutrition, and environmental sustainability, livelihoods, and social equity. Like other low-and middle-income countries (LMICs), Vietnam is in the midst of a nutrition transition fostered by rapid economic growth [6,7]. After the 1986 Doi Moi (renovation) reforms triggered economic advances, the composition of Vietnamese diets gradually started to include more proteins and fats and less starchy staples [8,9,10]. This change in food expenditure increased average calorie intake, especially for poor households in Vietnam, and tended to diversify their diets [10]. A study on dietary-related GHGE (using a dataset from 1991 to 2011) found that the increased diet-related per-capita GHGE in Vietnam were associated with the increased per capita consumption of beef and pork [11]. Although high levels of meat consumption have been associated with adverse health outcomes [12], in contexts where undernutrition remains prevalent, increased meat consumption can contribute to essential micronutrient intake. Evidence suggests that Vietnam’s economic advancement has left behind rural poor communities, among which child malnutrition persists [13,14]. Poor and rural households consume proportionately less animal products and more cereals than high-income and urban households [8,15]. The shift to “healthy diets” (http://www.fao.org/nutrition/education/food-dietary-guidelines/regions/countries/vietnam/en/) associated with a reduction in health-related NCD and environmental costs remains a major challenge due to the inability of many households to afford healthy, diverse, and sustainably produced foods [1].
Many studies have analyzed the environmental impacts—including GHGE, water footprint, and land use—associated with various dietary patterns [16,17,18,19,20,21]. Two systematic reviews call for greater geographic specificity, as most such studies are on a global or national scale, usually in high-income countries [18,22]. Because the environmental impacts of food consumptions are heterogeneous not only between nations but also at sub-national, household, and individual levels, a higher resolution is necessary to understand the corresponding trade-offs across geographies and socio-demographic strata [11,17]. Furthermore, because many LMICs are undergoing rapid changes in diets with foreseeable nutritional and environmental consequences, more empirical evidence is needed to inform local policymakers on the emerging environmental and nutritional trade-offs associated with diet transitions [23]. Socio-demographic characteristics are known to be associated with food consumption patterns, which in turn contribute to the nutritional and environmental impacts of diets [24,25].
Other studies examined environmental impacts associated with diets on an individual level in China, India, and Peru [16,18,26]. A study from China analyzed the trade-offs between environmental impacts and diet quality across the rural–urban transect and by income category [16]. Another used individual-level data to model the environmental impact of a shift to dietary guidelines, stratified by socioeconomic subgroups [17]. Researchers in Peru modeled the environmental impacts of several dietary patterns using individual dietary data and explored heterogeneity by socioeconomic status and education level [19]. An improved understanding of the complex relationship between different geographies and socio-demographic strata is warranted to identify leverage points for promoting sustainable food programming and policy in LMICs. To the best of our knowledge, there has been no prior study using individual-level dietary data across different socioecological environments in Vietnam. In addition, there is a knowledge gap as to how consumer behavior (such as perceived motivation for food choices) influence the nutrition–environmental trade-offs associated with diets.
In this study, we investigate how the nutrition—food—environment nexus changes across a rural–urban transect and gender and affects diets, food choices, and consequent environmental impacts. The study aims to (1) characterize the dietary patterns and the GHGE and blue water use associated with the diets and (2) to examine the associations between food sourcing, perceived food choices, and diet-related environmental impacts in three contrasting urban, peri-urban, and rural districts in Northern Vietnam.

2. Materials and Methods

2.1. Survey

Data were derived from cross-sectional surveys conducted among individuals in the Northern part of Vietnam from July to September 2018, as part of the Partial Food Systems Baseline Assessment at the Vietnam Benchmark Sites project [27]. There were 619 respondents, including males and females. The study sites included three districts: Moc Chau, a rural district in the Son La province; Dong Anh, a peri-urban district in the Hanoi province; and Cau Giay, an urban district also in the Hanoi province (Figure 1). These districts were selected for a baseline assessment based on complementary criteria, including territorial categorization, economic activity, representativeness, and interactions among the sites (e.g., through migration, rural–urban linkages) [28]. The surveys were conducted by the International Center for Tropical Agriculture (CIAT) in collaboration with the National Institute of Nutrition of Vietnam (NIN). The surveys included three main components: anthropometry (this component is not included in this study), 24 h recall (including food sources), and food acquisition behavior. This study only used the latter two components.
Using a probability-proportional-to-size (PPS) procedure, 30 communes were randomly selected as primary sampling units (PSUs) within each district, where higher-population communes had higher probabilities of being selected. Then, a rapid enumeration of households and household members was collected. The original surveys aimed to collect data of 3 members of each household: father, mother, and child under 5 years old. This study only used data from adult household members. The number of households and/or individuals selected was determined according to a sample size calculation that assumed population-level representativeness. Though the original aim was to survey 3 members per household as mentioned above, not every member was available at the time of the survey. Thus, there were difference in the share of households for the subsample for males and females from the same district.
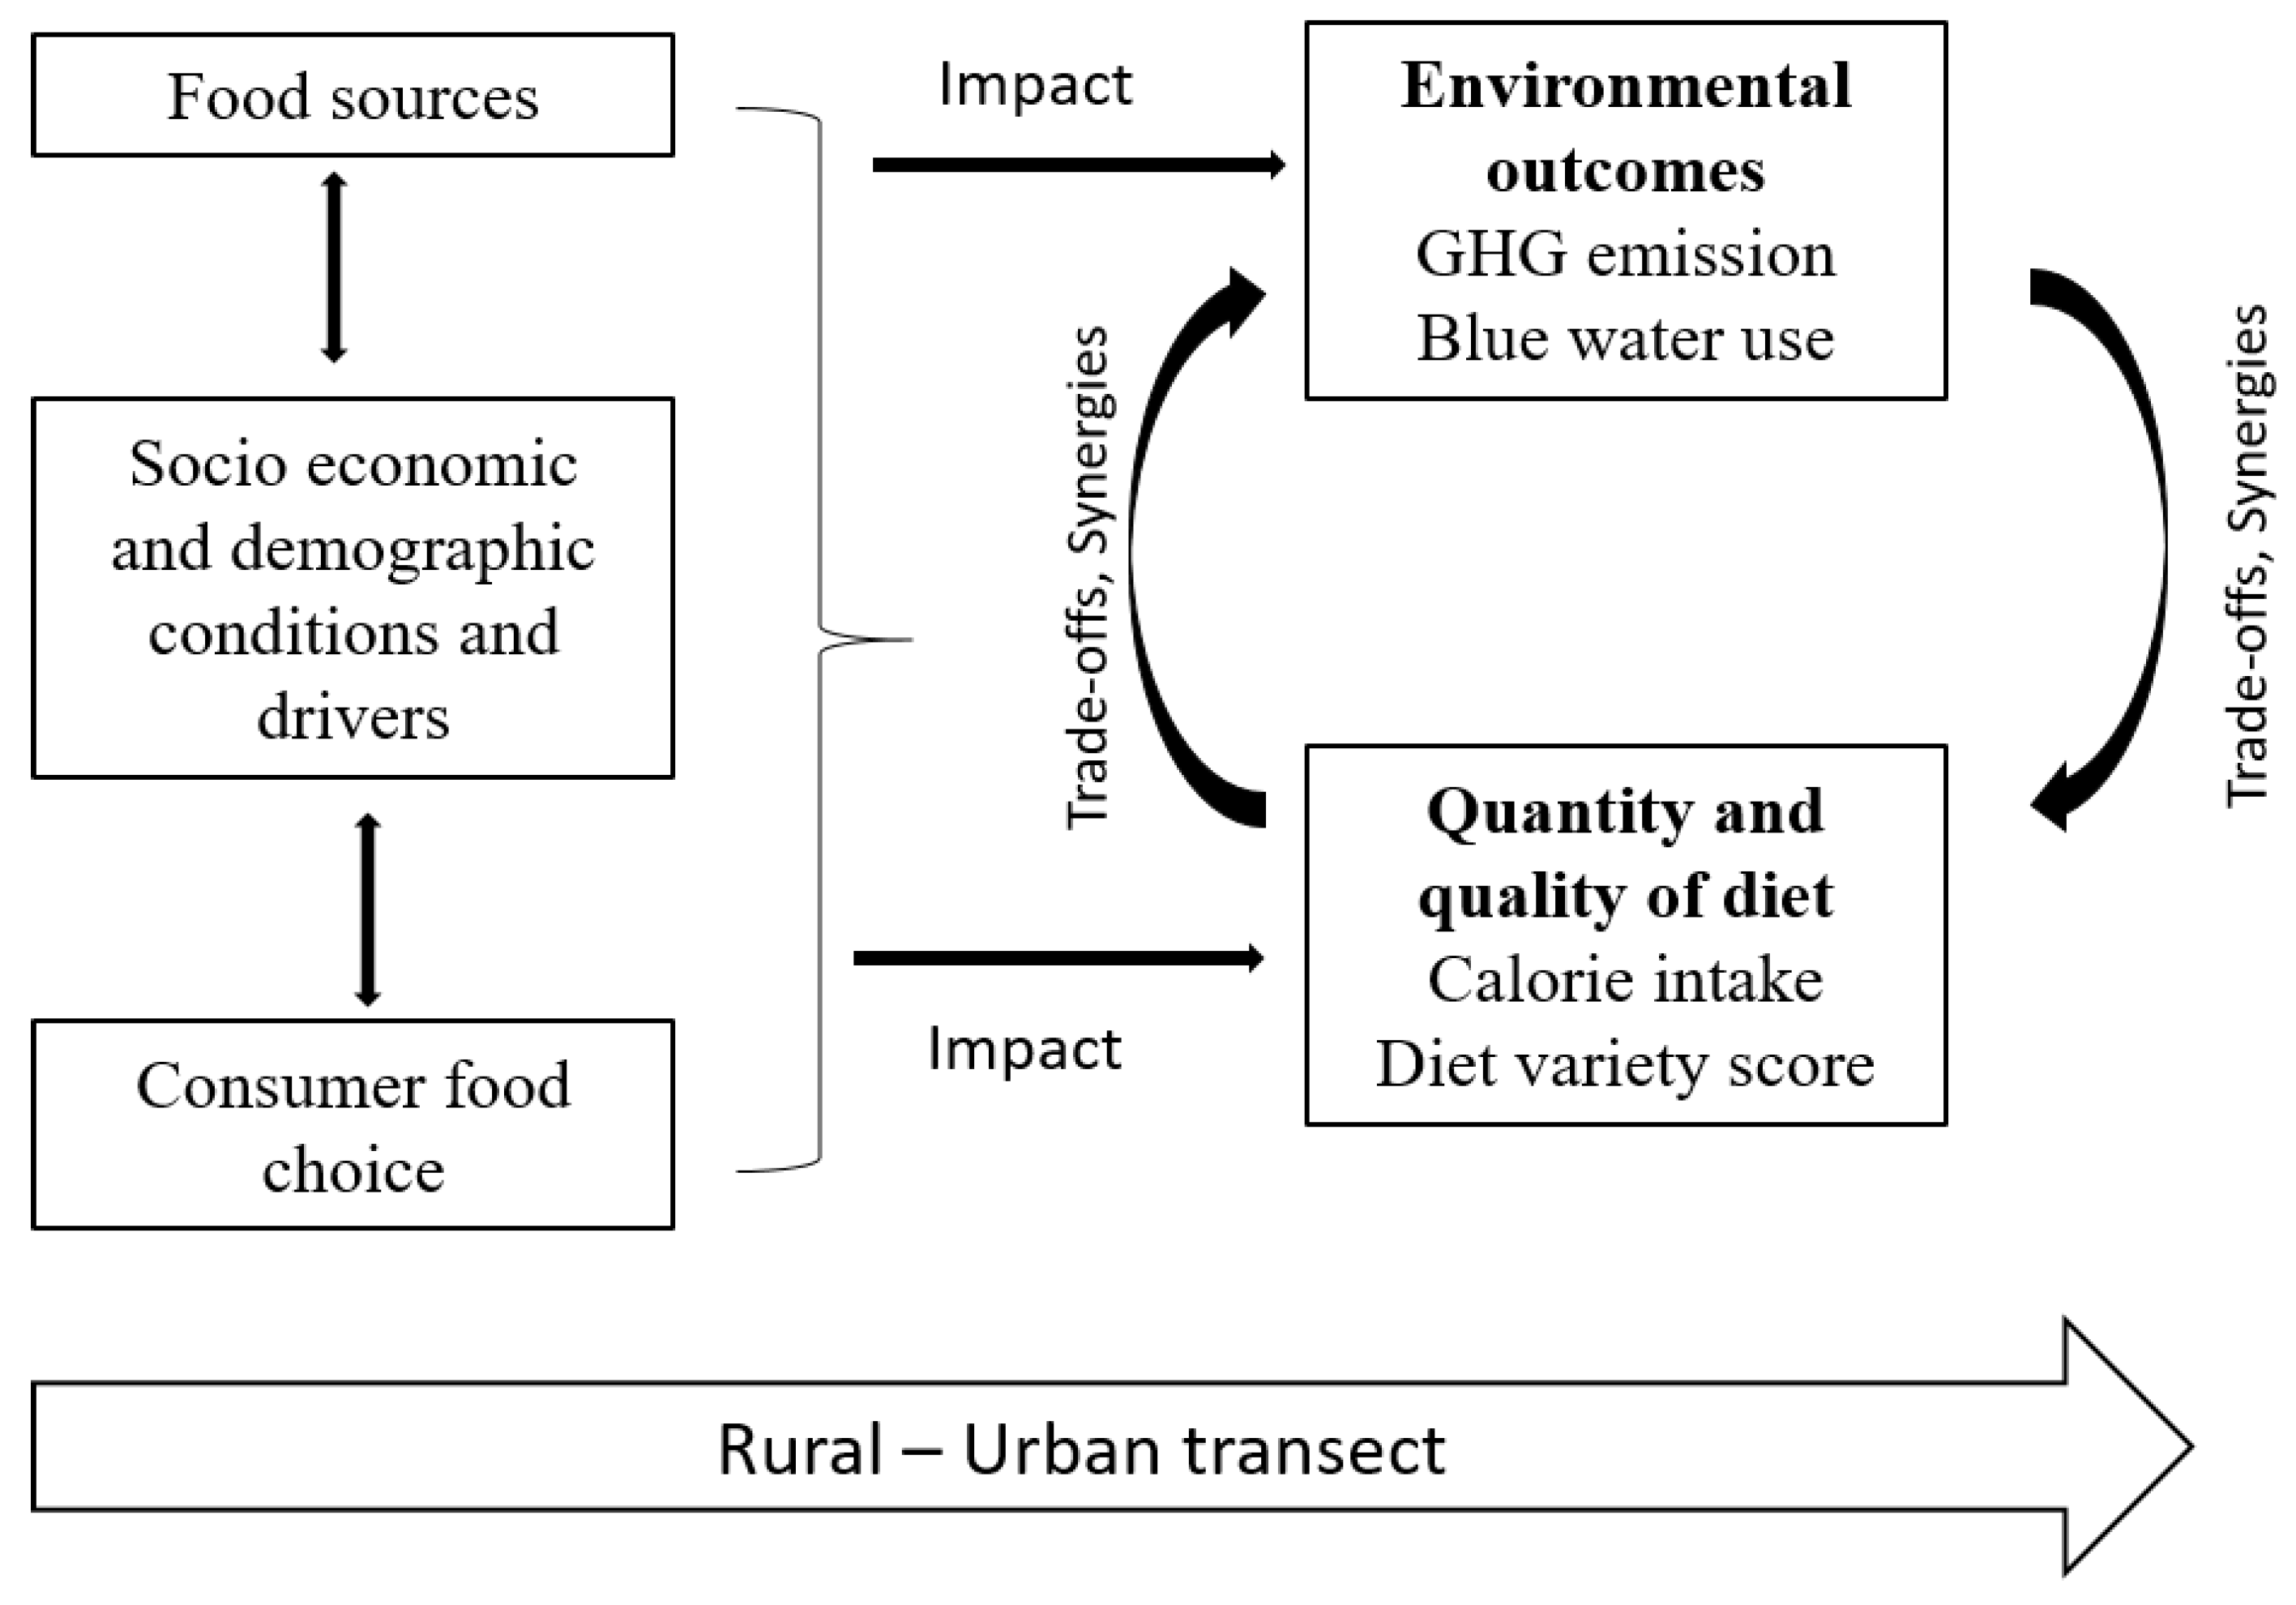
The aim of this survey was to elucidate specific components of place-based Vietnamese food systems along a rural-to-urban transect. A full explanation and description of this survey is described elsewhere [27]. Figure 2 summarizes the components and framework of this study under the conceptual framework of the food system for diet and nutrition outcome [29].

2.2. Individual Socio-Demographics

Our study considers the following socio-demographic characteristics: gender, age, occupation, education level, and household income level. The “occupation” characteristic was categorized by employed, self-employed, and other employment. Education levels were grouped into primary school, secondary–high school, and university and college. Household income was categorized as less than VND 7 million (=USD 300), from VND 7 to 11 million (=USD 300–475), and above VND 11 million (>USD 475) per month.

2.3. Dietary Assessment and Food Sources

Participants were interviewed twice by a trained professional to assess the dietary intake following two non-consecutive days, using the multiple-pass 24 h recall method. The first interview was on a weekday, and the second was done on either a weekday or a weekend. In this study, we used the average quantity of the two recall days. The 24 h recall questionnaire was developed by NIN with the addition of the questions about sources of ingredients used to prepare meals and frequency of food consumption. There were more than 300 single food items. In addition, for each ingredient, participants were asked to identify its source. Options included own production, supermarket, wet market, specialized shop, convenience store, and other.
Food consumption data (including beverages) were linked to Vietnam’s national food composition table, or FCT [30], to calculate energy intake (unit, Kcal) and the diet variety score (explained below). Food consumption data were categorized according to the following 13 food groups: (1) starchy staples, (2) fish and seafood, (3) pork, (4) beef, (5) poultry and other meats, (6) eggs, (7) dairy, (8) pulses and nuts, (9) vegetables, (10) fruits, (11) salt and sauce, (12) oil and fat, and (13) other foods. These food groups are divided based on the guidelines for the Diet Quality Index, a validated indicator of individual diet quality [31]. Individual daily calorie intake by food group were calculated from the sum of all single food items in each group to characterize the diet composition of each member (male and female) and by districts (urban, peri-urban and rural). Next, we summed the calorie intake from all food groups to get the total calorie intake per person per day. The Diet Variety Score (DVS), one of the components of the Diet Quality Index–International (DQI–I) [32], comprises two subcomponents: the overall variety from important food groups and the variety within protein sources. DQI–I provides an indicator on food intake from varied sources and focuses on protein sources (meat, poultry, fish, dairy, beans, and eggs), most of which are animal-derived food with relatively high environmental impacts. A detailed description of the variety score is given in Table A1. This score ranges from 0 to 20. The individual DVS was calculated based on the 2016 recommendations from the dietary guidelines for Vietnam (http://www.fao.org/nutrition/education/food-dietary-guidelines/regions/countries/vietnam/en/).
For each individual, the quantity of food intake (in kg) was aggregated by type of outlet where the foods were sourced. We derive a series of dummy variables, which are equal to 1 if it is the most important type of outlet (by quantity). We then obtained dummy variables for all outlets: own production, wet market, supermarket, specialized shop, convenience shop, and others. In the end, the supermarket variable was excluded because the surveyed households did not acquire foods from supermarkets. Individual daily calorie intake by food groups and diet variety scores were used to measure the nutritional quantity and variety of diet.

2.4. Environmental Impact Assessment

We based the estimates of GHGE factors of each food item on an open compiled database (database of Food Impacts on the Environment for Linking to Diets (dataFIELD) (http://css.umich.edu/page/datafield), which was an aggregation of results from the Life Cycle Assessment literature [33]. Note that these data are based on a global aggregate and are not specific to Vietnam production. Boundary conditions were limited to GHGE from agricultural production or, in the case of processed commodities such as oils and flours, include emissions from primary processing. Emission factors were provided as kg CO2-equivalents (unit: kg CO2eq) per kg (boneless, edible for flesh foods) of each food commodity. Each single food item from the dietary intake was linked to the food commodity in dataFIELD. The GHGE of an individual’s food intake was obtained by multiplying the quantity of food consumed (in kg) with its emission factor. Next, for each individual, we summed the total GHGE of their daily diet to get the total daily GHGE per person. In addition, we also distinguished an individual’s GHGE associations with 13 food groups as in the dietary assessment section.
The water footprint estimates were derived from the total water footprint of each food item as reported in the Water Footprint Network (WFN) database [34] (specific to Vietnam) and the study of M. Pahlow et al. [35]. This database includes the blue, green, and grey water footprint from the production of each food item. In this study, we focused only on blue water, which refers to the consumption and evaporation of surface and groundwater resources. Food items in the dietary assessment were matched to a single commodity in the WFN database, and we then calculated the blue water footprint use from the quantity of each food consumed that day. For each individual, we summed the total water footprint from each food to estimate the total footprint of their daily diet and the 13 food groups.
In addition, the density of GHGE and density of blue water per 2000 Kcal were calculated as in Mertens et al. [21]. Densities show the relative consumption quantities of food and food groups in the diet, which normalizes the diet to 2000 Kcal so the differences focus on dietary composition rather than caloric differences. By using these indicators, we observe differences in food intake by gender, and, separately, across the urban–rural transects, with similar dietary patterns. These normalized environmental indicators also were used in the regression models to analyze the trade-off between nutritional and environmental outcomes.

2.5. Perceptions of Food Choices

There are 25 questions on food choice to ask respondents about what factors motivated their food choices on a typical day, including a-5-point scale: 1 = Not at all important, 2 = Slightly important, 3 = Neither unimportant nor important, 4 = Fairly important, 5 = Very important. These questions were based on Steptoe et al. [36] and investigated 9 factors: health, mood, convenience, sensory appeal, natural content, price, weight control, familiarity, and ethnic concern. The detailed questionnaires of each factor are given in Table A2.
Finally, this study examined which food groups a household would prefer to buy more of if their food budget were to increase, a proxy for income elasticity. The choice options included: cereals, rice and starch products, meat (including chicken), vegetable and fruits, fish and seafood, dairy products, other food, and no change in food purchases.

2.6. Statistical Analysis

Regression models were estimated using Ordinary Least Squares (OLS) to determine potential factors influencing GHGE and blue water use by the following model:
l o g   F i   =   α 0 +   α 1 V a r i e t y   + j = 1 n b j X i j   + ε i  
where F i is the GHGE per 2000 Kcal and blue water per 2000 Kcal, i is the individual number. Variety is an individual diet variety score. The X j variables include all socio-demographic characteristics (gender, household income, education levels, and occupation), food choices, and food sources; ε i is the random error term. We stratified the sample by gender and districts, and we ran a model (1) for each of the 6 sub-samples (3 districts × 2 genders) for the 2 environmental impact indicators (GHGE and blue water footprint). We applied the backward stepwise method to select variables. Since we did not prioritize any specific subsample, we first targeted the subsample of males in the urban district to decide the selected variables. Then, these selected variables were used in other regressions. Software Rstudio version 4.0.2 was used for processing and analyzing data.

3. Results

3.1. Socio-Demographic Characteristics of Study Participants

Table 1 describes socio-demographic characteristics of men and female in the three districts. There were significant differences in household income along the rural–urban transect: around 70% of households in the urban district earned more than VND 11 million per month (compared to around 5% in the rural district), and approximately 72% of households in the rural district earned less than VND 7 million per month (about USD 300). The percentage of people in the urban district who attended university or college was 78.2% for males and 87.2% for females in the urban district. Graduation from only secondary or high schools was common in the peri-urban district and rural district. For the main occupation, nearly 70% of individuals in the urban site worked as employees, while those from the rural district were mostly self-employed, especially rural female. The average ages in the urban district were higher than those of the two other districts.

3.2. Food Group Intake across the Rural-Urban Transect in Vietnam

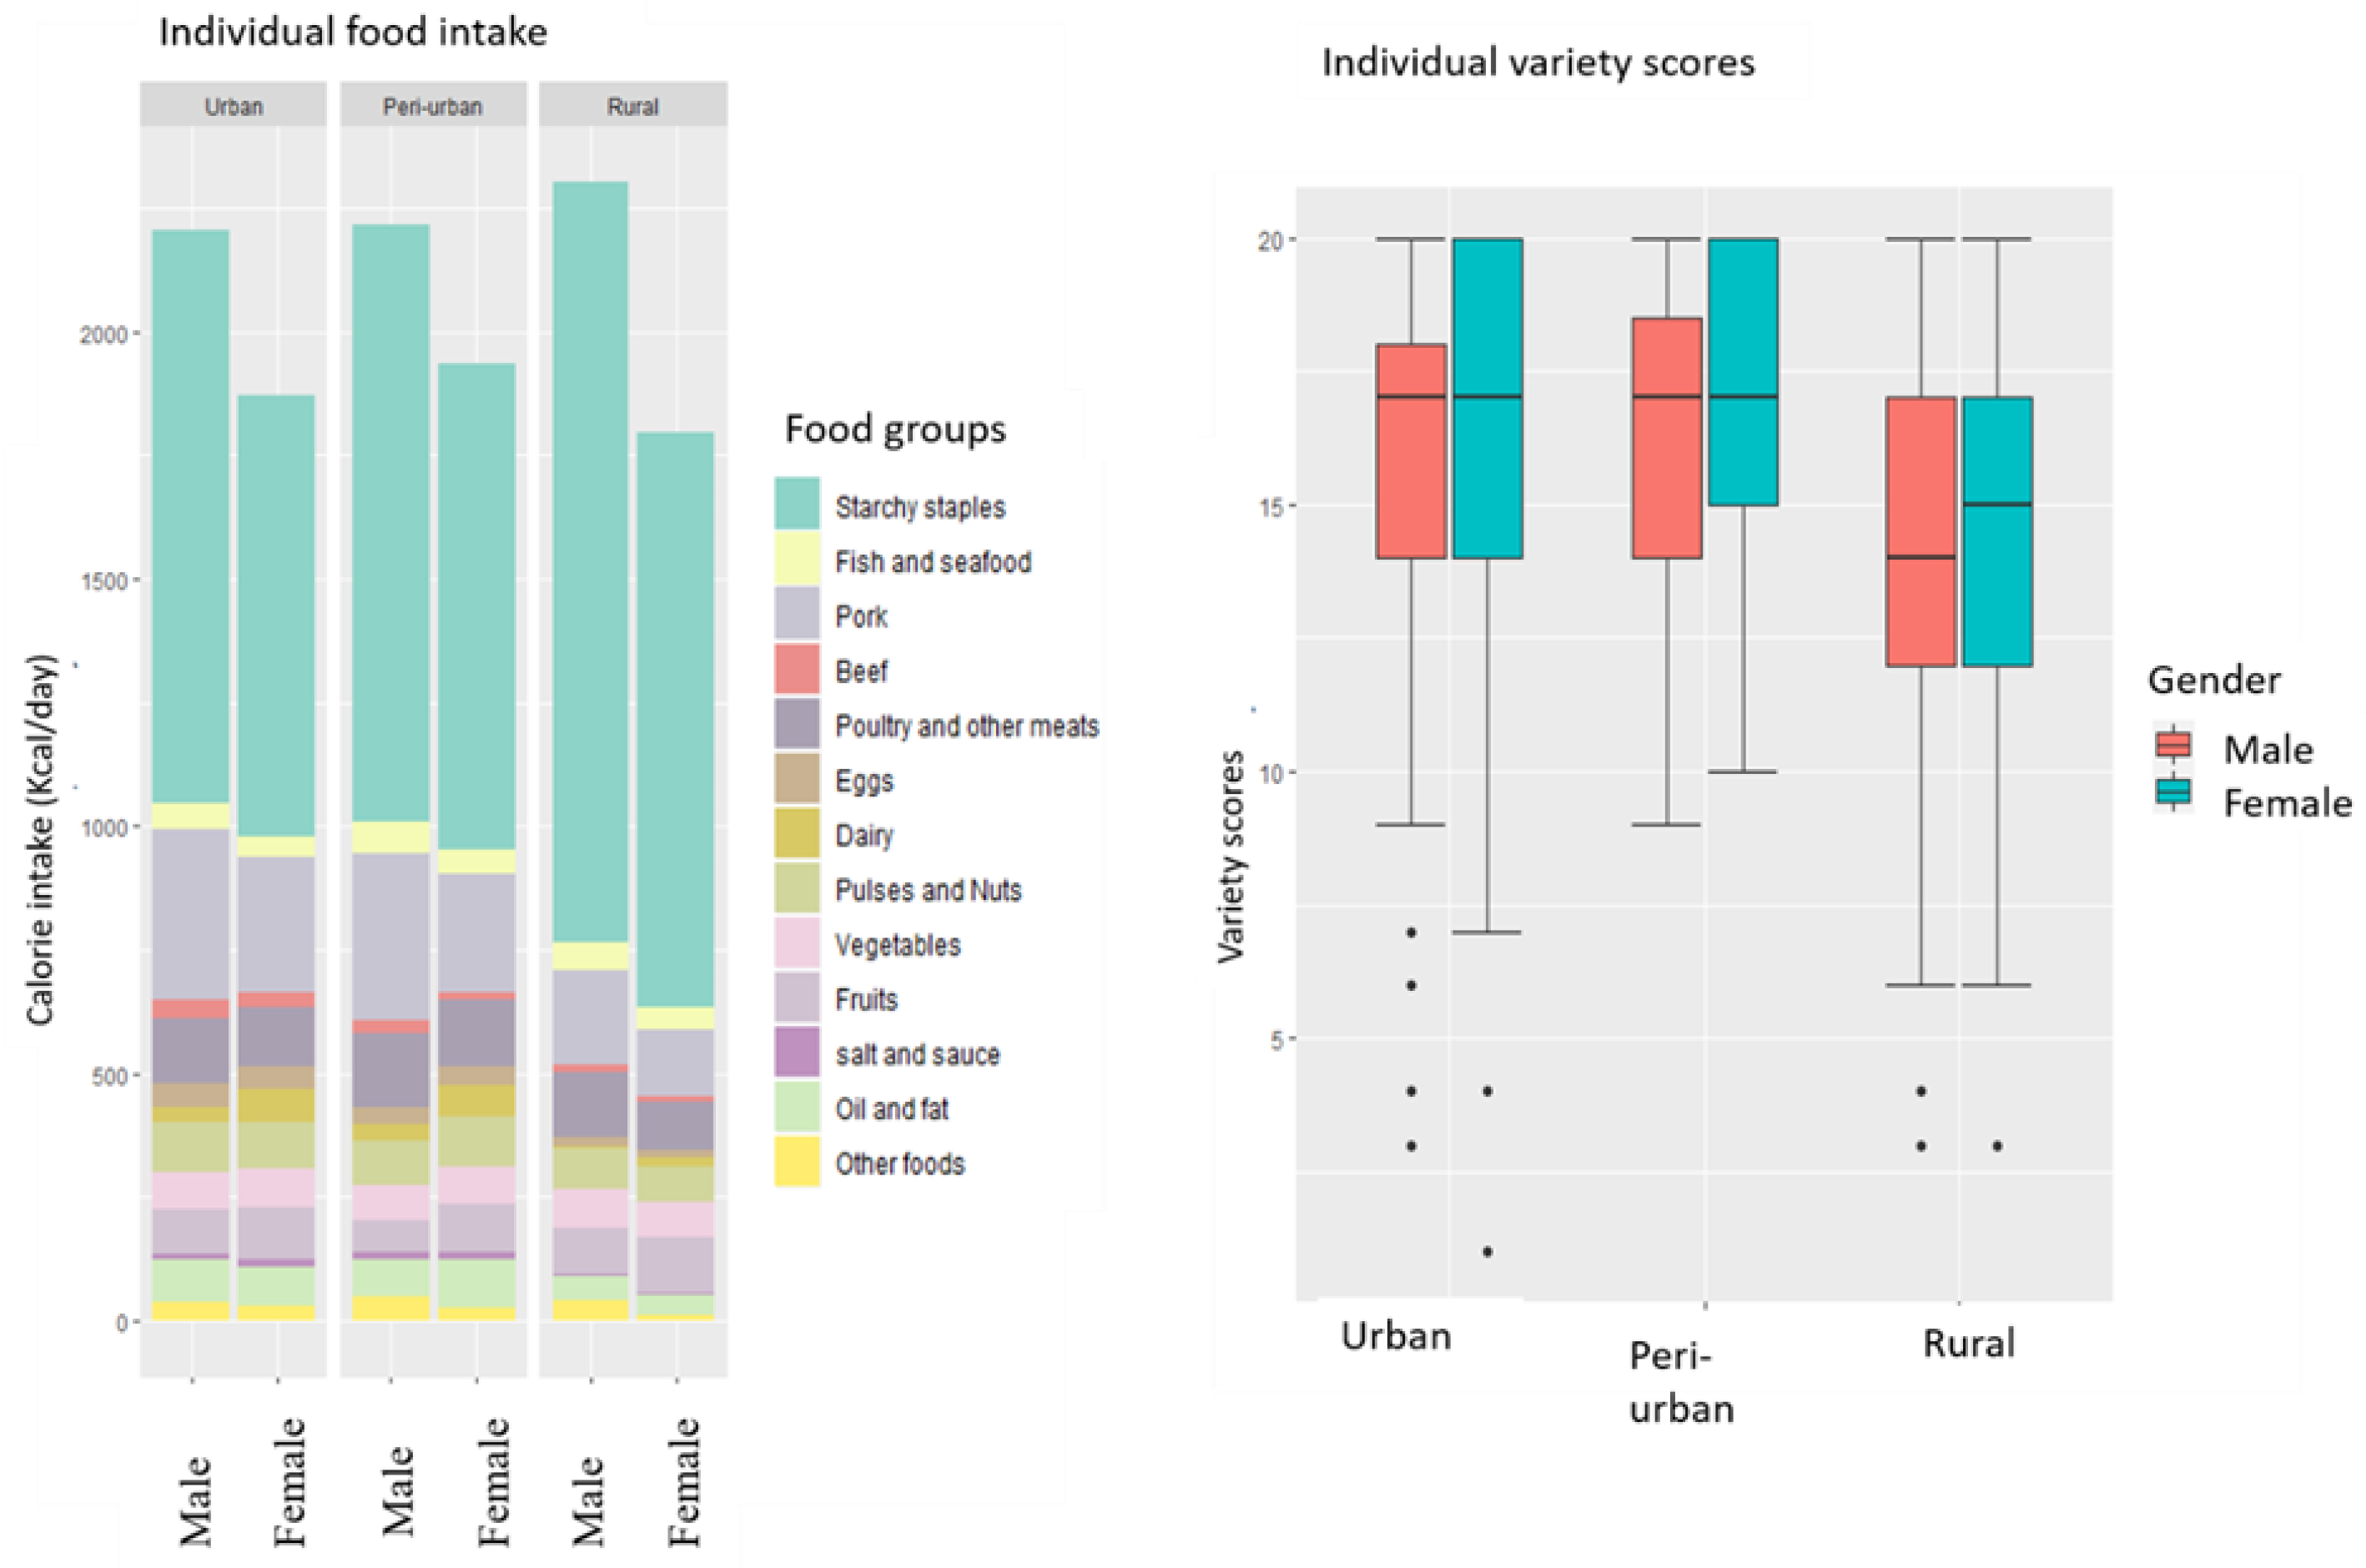
Figure 3 (left) shows the average individual daily energy intake by food group and by gender for each of the three districts. The corresponding values of Figure 3 (left) and their significant different levels for pairwise test comparison are given in Table A3. The average individual calorie intake of men was higher than that of females in all districts. For all members, starchy staples were the most important sources of calorie intake (from 893 Kcal to 1209 Kcal), followed by pork, the most popular meat in Vietnam. Table A3 also shows significant differences between average calorie intake per group for each member, especially between urban and rural districts. Differences in the contribution of caloric intake per food group, including starchy staples, pork, eggs, and dairy groups, between urban and rural districts were insignificant.
Figure 3 (right) shows mean individual diet variety scores by gender and by district. The one-way analysis of variance (ANOVA) and post-hoc Tukey’s range test showed that the DVS scores were significantly different (p-value < 0.05) between rural and (peri-) urban districts, while the difference between urban and peri-urban sites were not statistically significant. Females had a higher average variety score than males, especially in the rural district.
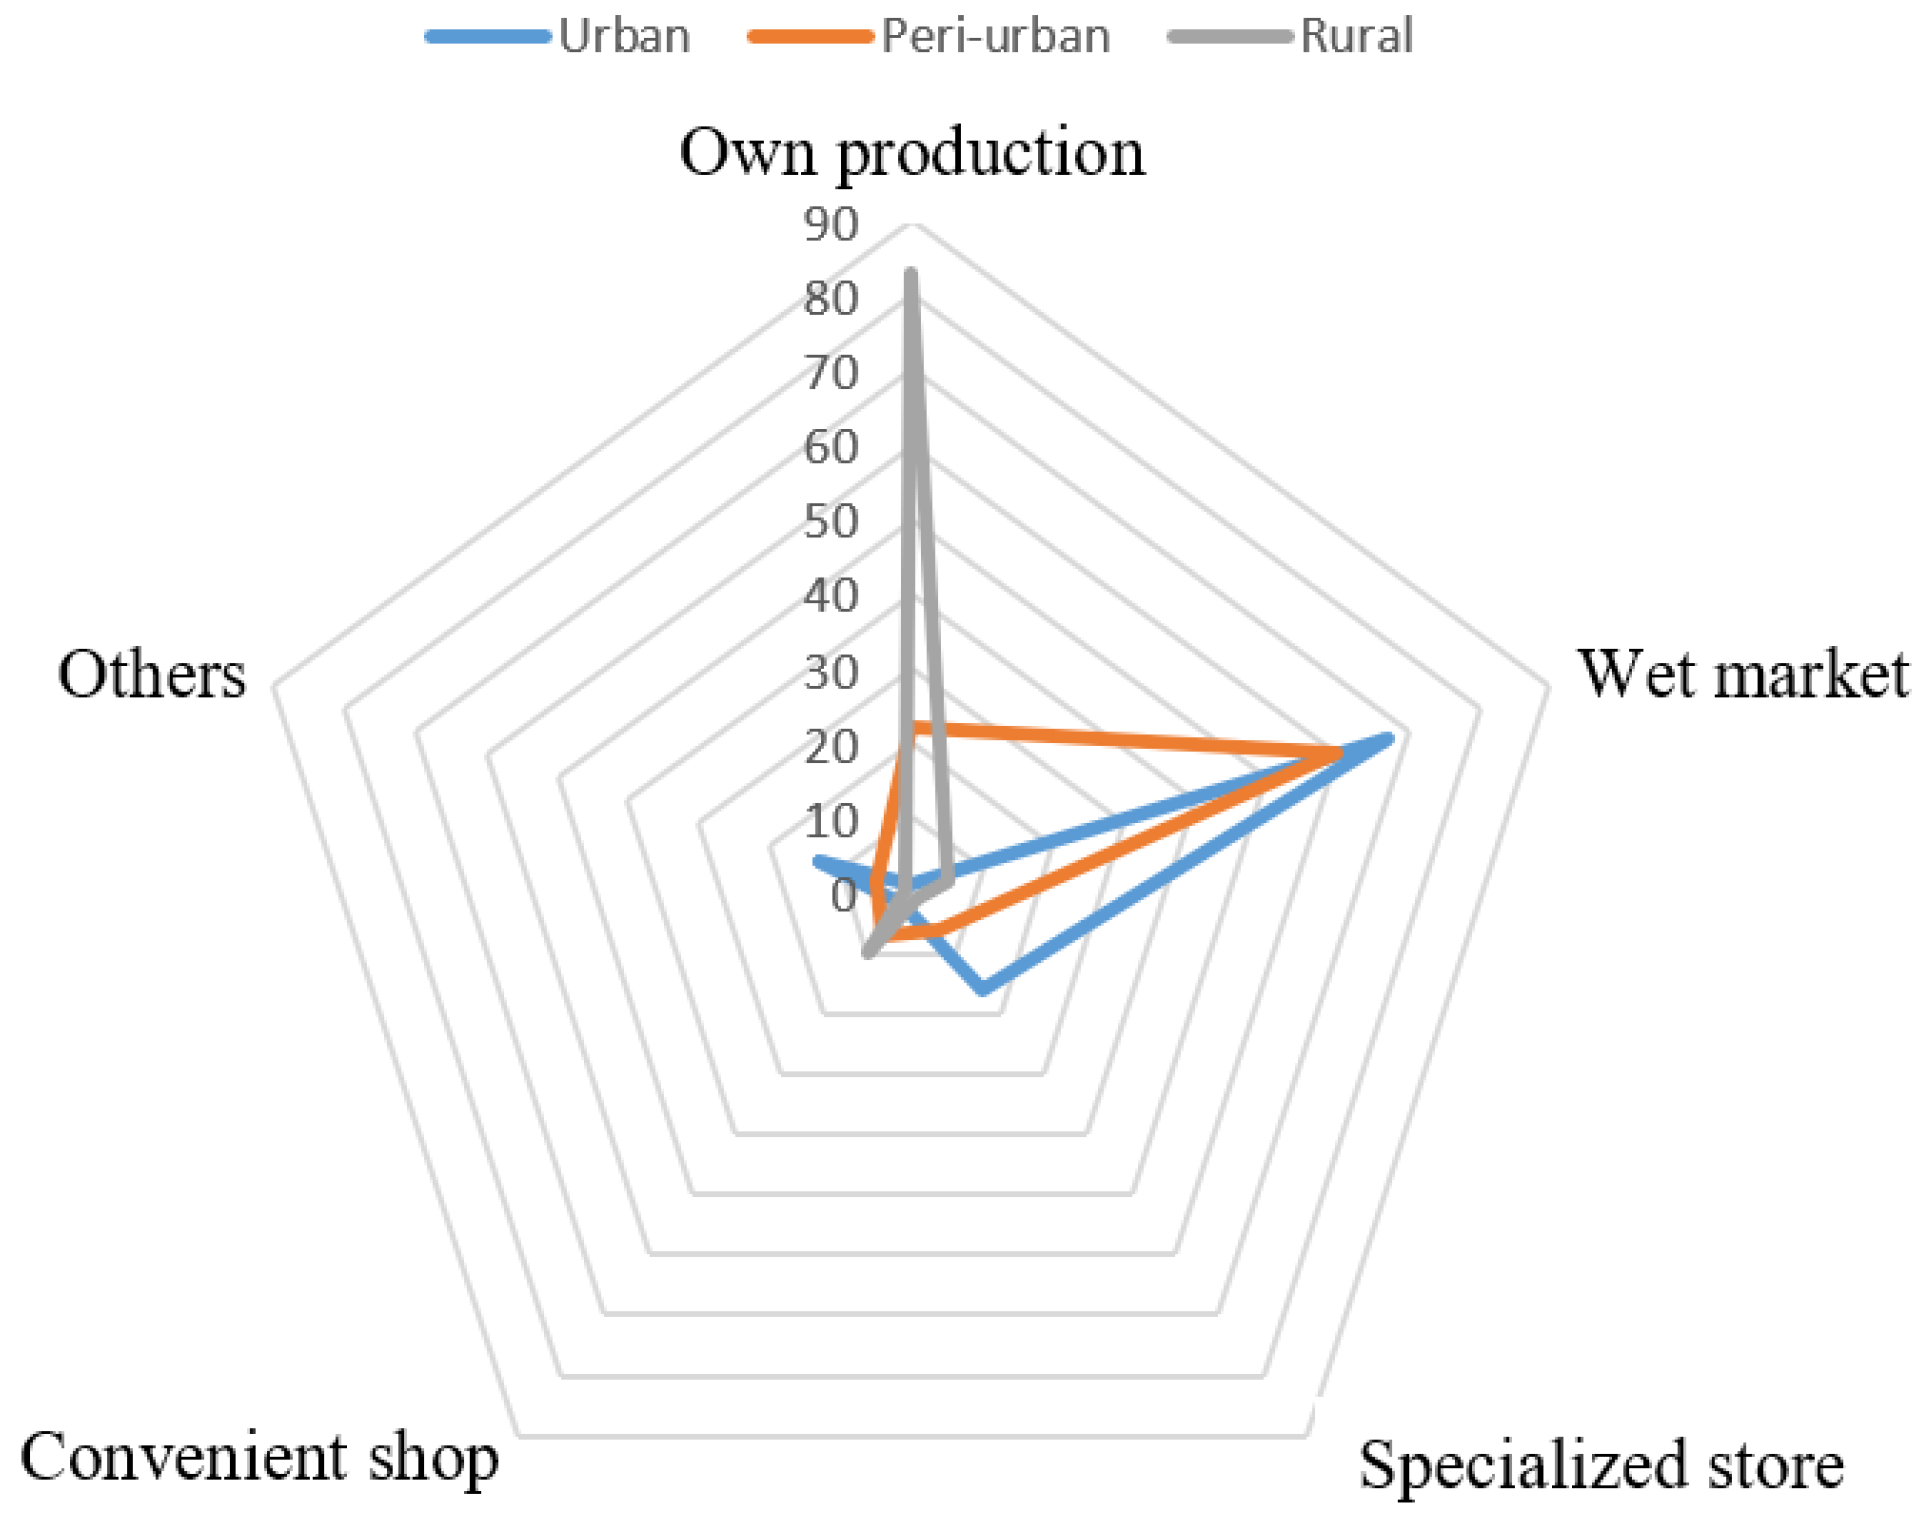
Food sources differed between districts (see Figure 4). Households from the urban district mainly purchased food, especially from wet markets and specialized shops. In the rural district, 80% of food came from their own production. Interestingly, in the peri-urban district, we see a transition in household’s food sourcing from their own production to purchases at the wet markets.

3.3. Environmental Impacts of Diets

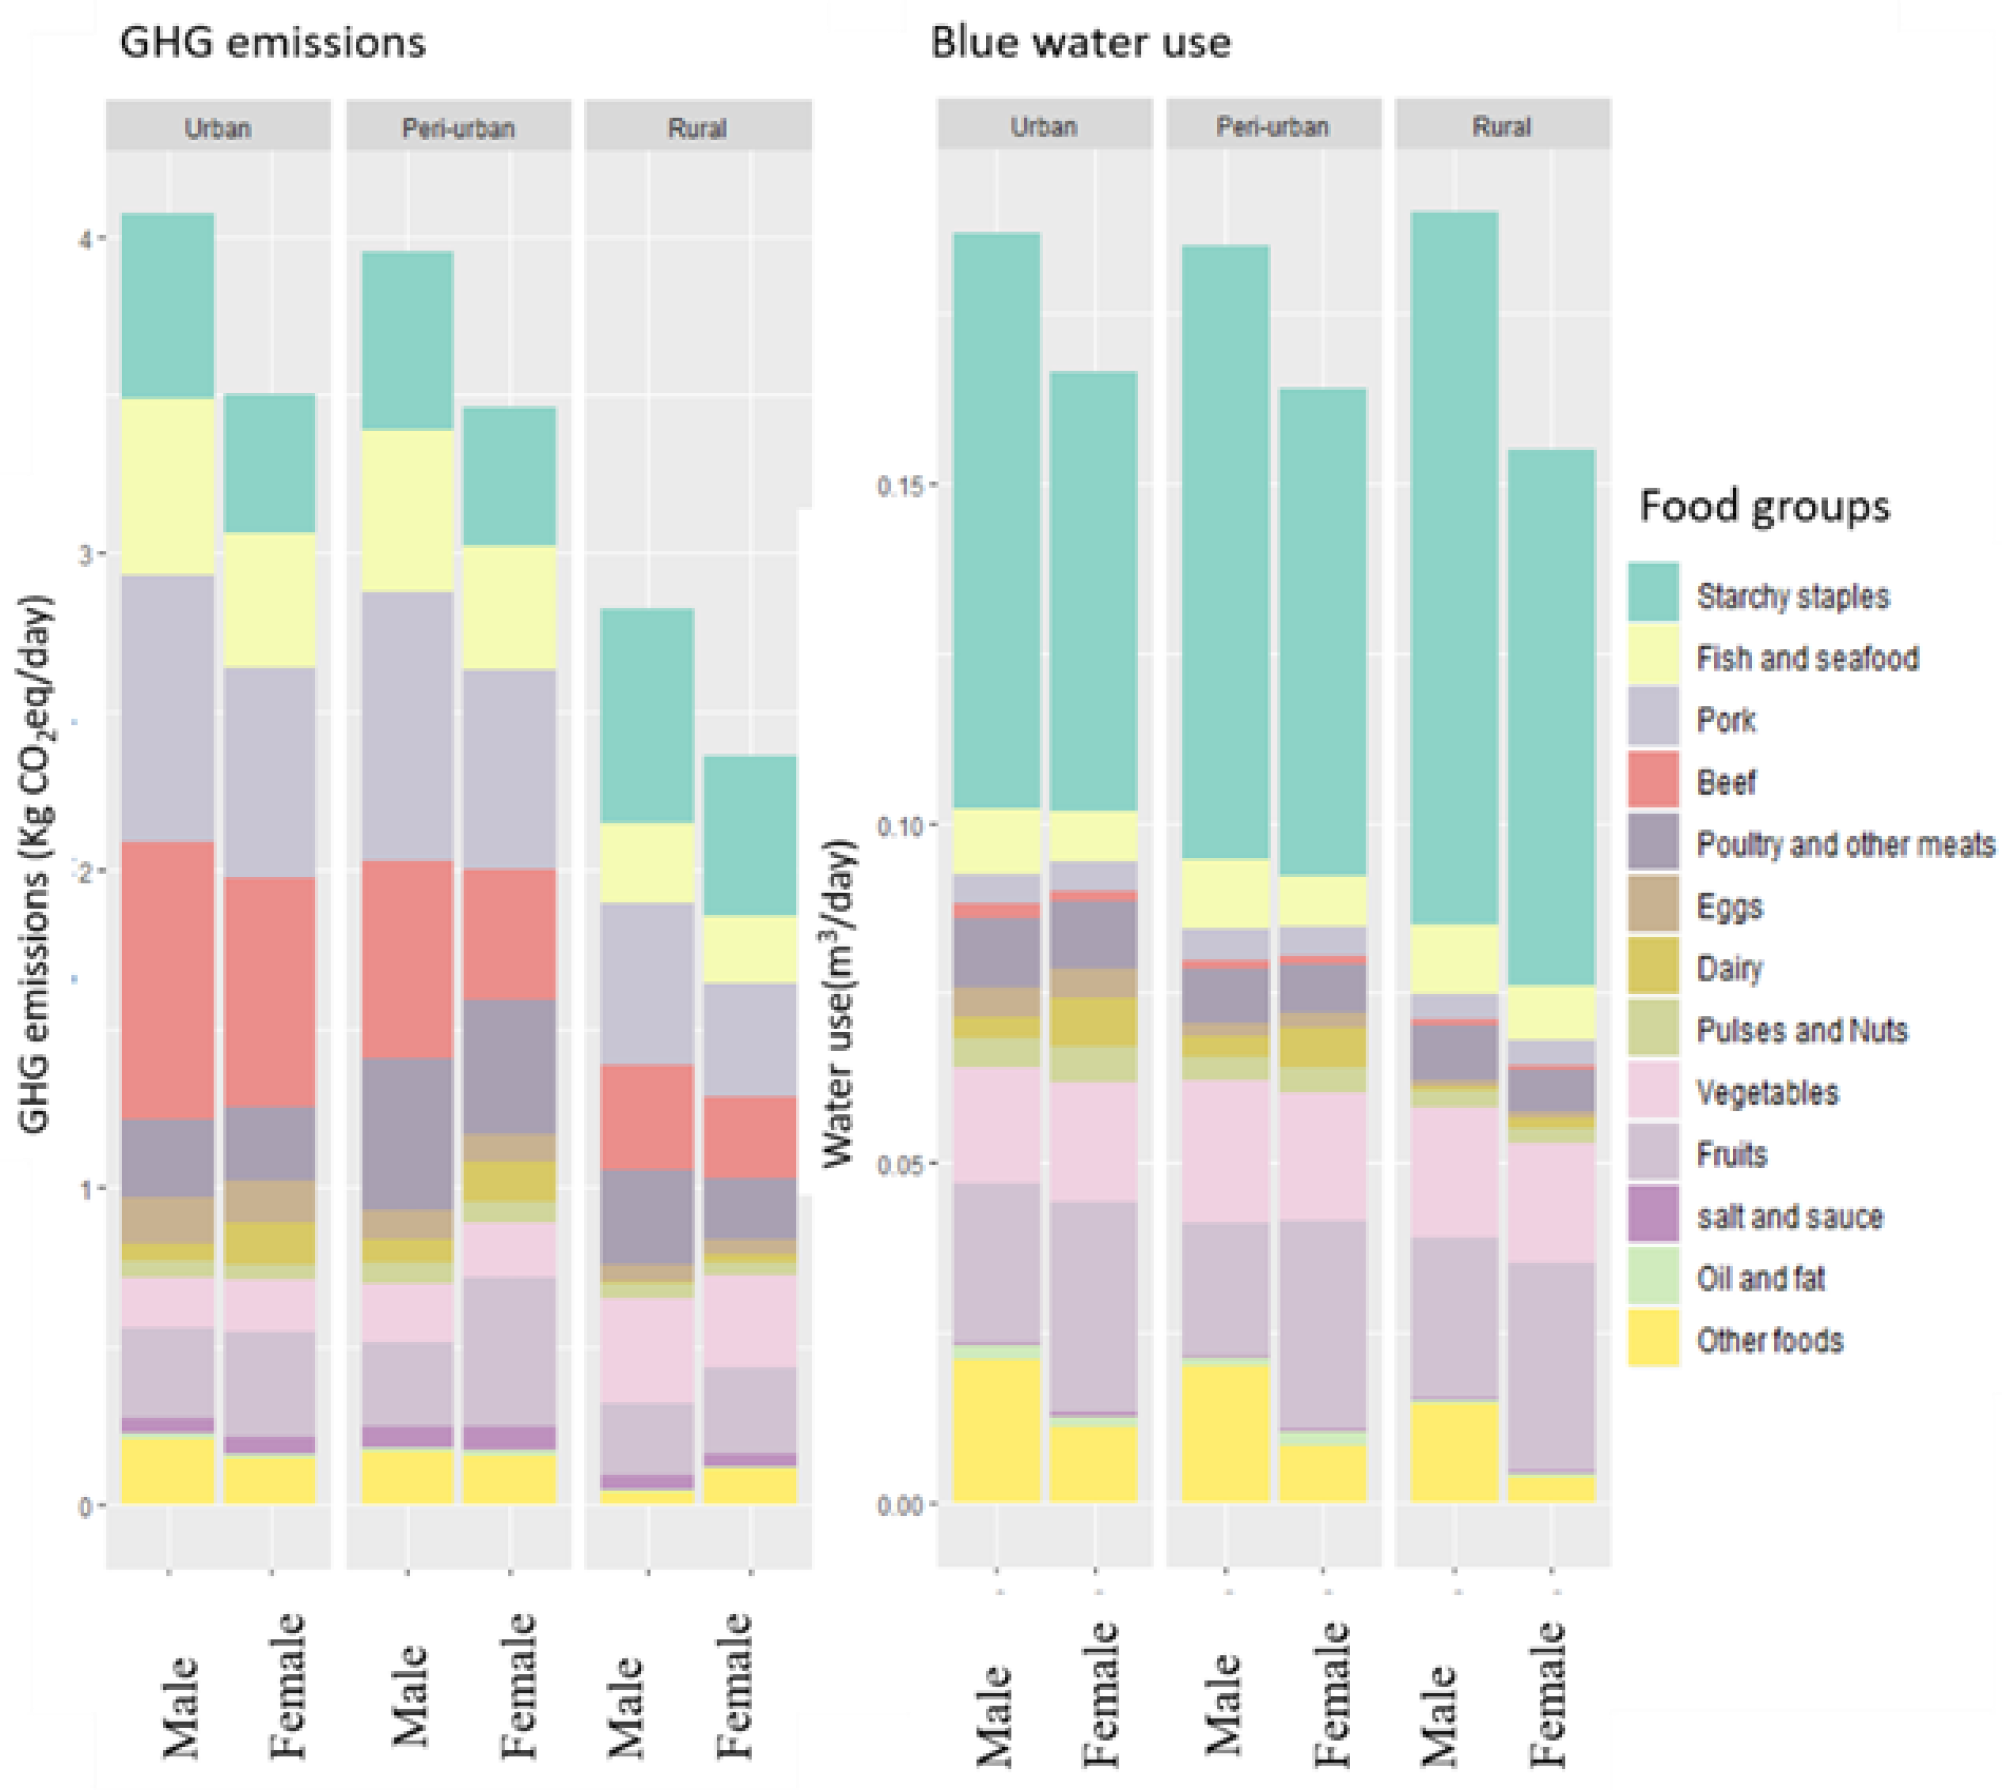
Figure 5 shows the average GHGE from daily food intake of males and females across the urban–rural transect (Table A4 and Table A5). The total GHGE between members in urban and peri-urban districts, regardless of gender, were quite similar. The total GHGE from diets in the urban and peri-urban district was much higher than those in the rural district. However, no significant difference between the total GHGE of female in peri-urban and rural districts was observed. These results for male and female adults in urban and peri-urban areas were close to the ones reported by Heller et al. [11] (3.175 kg CO2eq per person per day), while the averages for adults in the rural district were smaller. The overall trend in average blue water use associated with diets was similar to GHG emission patterns. However, while the pork and beef food groups generated the most GHGE from the diets of all members in three districts, the food group of starchy staples contributed the most to blue water use. The one-way analysis of variance (ANOVA) and post-hoc Tukey’s range test also showed significant differences in the average value per group between members in urban and rural areas.
Figure 6 shows environmental footprints per 2000 Kcal by gender and district (their detailed values are in Table A6 and Table A7). Interestingly, the average GHGE normalized per 2000 Kcal was lower than the dietary GHGE per day for both genders in three districts, except for males in the rural district, meaning that most diets averaged below 2000 Kcal/day. Similar to the per-day results, the average GHGE per 2000 Kcal from the rural district was much lower than that of urban and peri-urban districts. There was a similar trend for blue water use since the average blue water use normalized per 2000 Kcal was slightly higher than the dietary blue water use per day.

3.4. Perceptions of Food Choices

We explored two aspects of the perceptions of food choices: motivating and economic factors. The first reflects 10 specific motivating (cognitive, aspirational, and economic) factors by district. The later specifically reflects the food groups respondents would purchase if there was a hypothetical increase in their food expenditure budget. Table 2 shows average points for these food choice questions based on a 5-point scale. The results show significant differences in average scores for health and natural content motives among all districts. Other factors, such as mood, convenience, and weight control, have significant differences between the rural district and the other two districts, but no differences between urban and peri-urban areas.
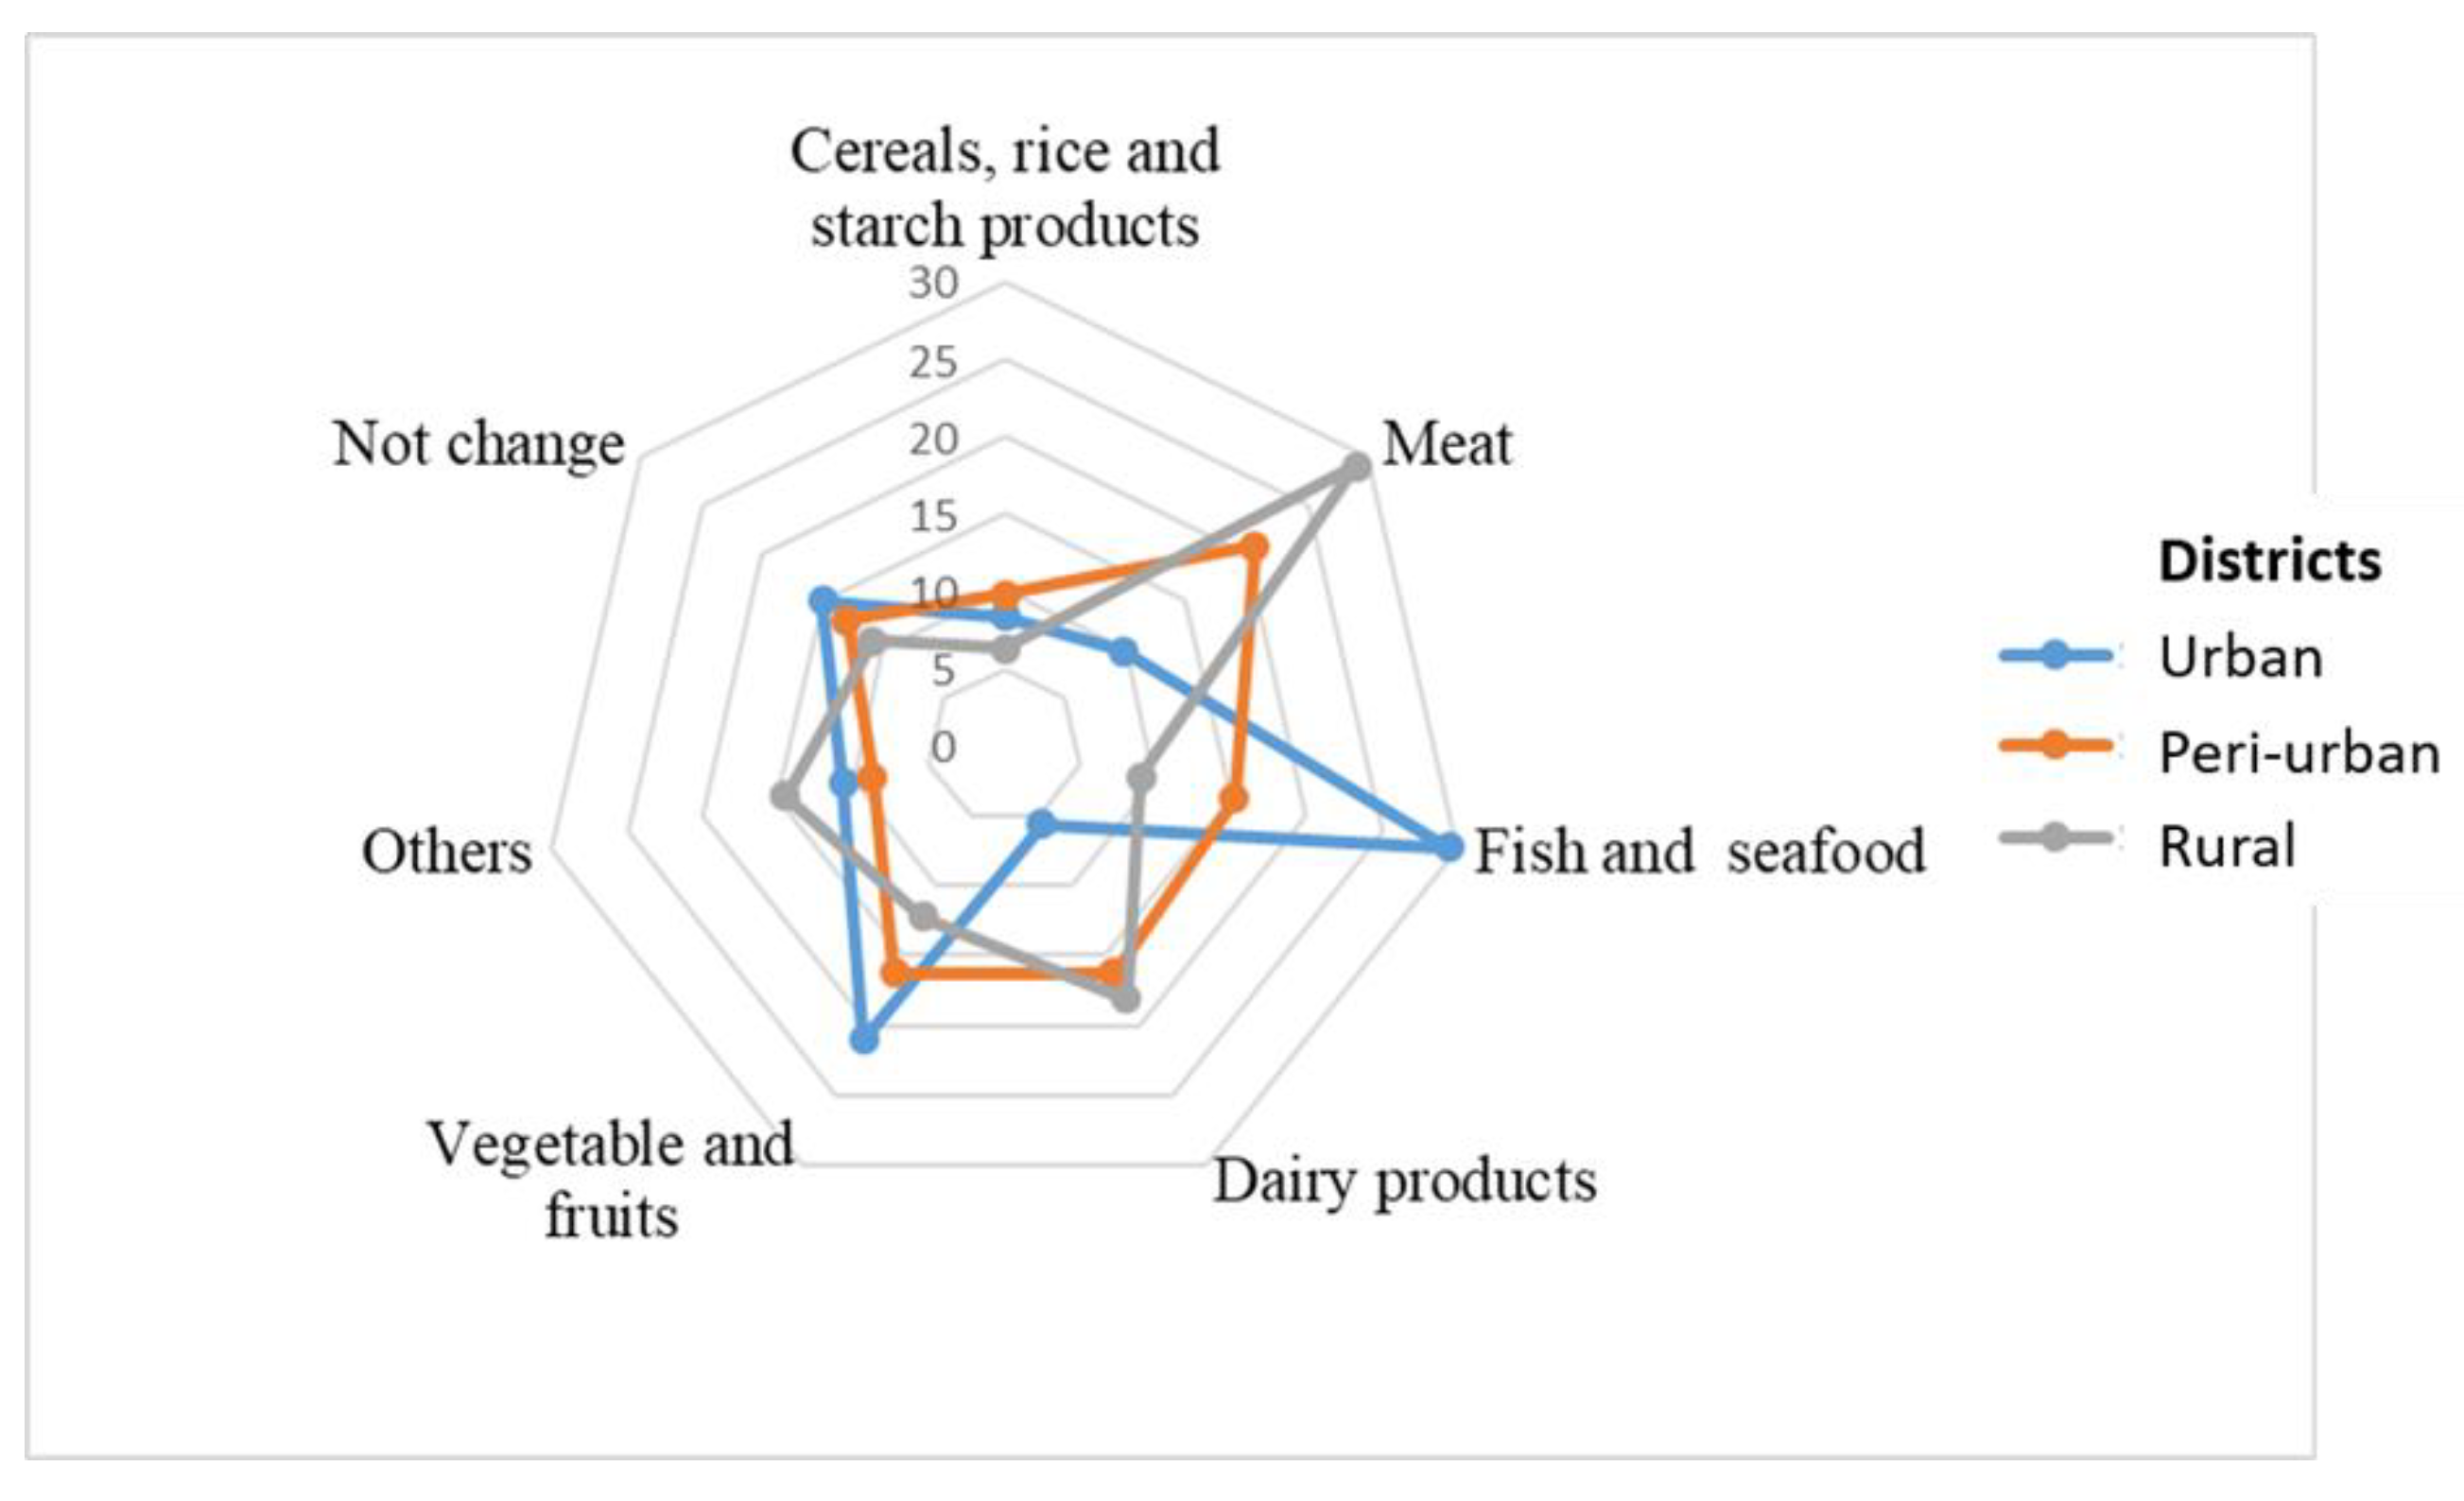
In the hypothetical scenario that household food budgets were to increase (Figure 7), households in urban and peri-urban districts would increase purchases of fish and seafood and vegetables and fruits, while rural households would purchase more meat. All households regardless of location would purchase more dairy products.

3.5. Trade-Offs and Synergies between Environmental and Nutritional Trends along the Urban–Rural Transect

The coefficients from the final model are shown in Table 3 by gender and district. Most of the variables related to food motives (such as mood, convenience, sensory appeal) were not retained because they were not statistically significant according to the backward selection technique. The final model included only the “own production” source among various sources of food acquisition. The R-squared showed that the models for participants in the rural district explained more of the variation in the dependent variable than the models for participants in urban and peri-urban districts.
The DVS score showed a significant positive association with two environmental indicators, GHGE and blue water use per 2000 Kcal, in all models except in the models for males in urban and peri-urban districts (models 7 and 8). DVS was positively associated with blue water use, except for males in urban and peri-urban areas. This implies that the more diverse the diet is, the larger environmental impact it creates for these sub-samples.
Several household characteristics were associated with GHGE and blue water use. Household income had no statistically significant effect on GHGE (in the logarithm form) among males. In the peri-urban district, compared to female at the lowest income level, females at the highest income level had a lower GHGE on average. Household income was not significantly associated with blue water use in all models. Education showed different associations with GHGE and water footprint. Males with a secondary or high school diploma or female with a university diploma in the rural district had a higher GHGE on average than those at a lower education level within each gender. In contrast, on average, males in the peri-urban site with education levels higher than primary school had a lower water footprint than those who completed primary education or had no formal education. In peri-urban areas, females involved in agricultural production on average had both lower GHGE and blue water use than females who did not have their own production activities.
With respect to food choice motives, concern over the natural content of food was positively correlated with GHGE per 2000 Kcal among males in urban areas. On the contrary, concern over the natural content of food was negatively associated with blue water use among males and females in peri-urban areas. Blue water use was positively associated with concern about food healthfulness among participants in peri-urban areas. Increased importance of ethical motives was associated with decreased blue water use among male in rural areas. Overall, we only found significant associations between blue water use and its determinants among peri-urban male and female, but not in other locations.

4. Discussion and Conclusions

Promoting a healthy and sustainable diet is important for human and environmental health globally and locally. Redesigning the food system to meet the nutritional demand of consumers and reducing the overall environmental impact in all countries regardless of their national economy (high-income, upper and lower middle-income countries) is necessary [37]. Vietnam is an LMIC with a particularly dynamic and unique food system. This study characterized the differences in the environmental impacts of diets along a rural–urban gradient in Northern Vietnam. In all three districts, starchy staples were the most important sources of calories. Starchy staples were also the largest contributor to blue water use, while pork and beef generated the most diet-related GHGE. The GHGE associated with diets in the rural district was significantly lower than that of consumers from peri-urban and urban districts. This is associated with lower levels of seafood and meat consumption. Significant differences in diet-related environmental impacts were observed among those who prioritized health and natural ingredients among food choice motives, a finding similar to that of a study from France [38]. These consumers are possibly characterized by higher levels of environmental awareness when it comes to food sourcing.
We used the DVS indicator to analyze the potential differences in diet variety between males and females as well as across the three districts. Females in all three districts had a higher average variety score than males, especially in the rural district. Higher DVS scores provide more micro- and macronutrients, but it also gives some risk for health and environment [39]. Our analysis confirmed this trade-off regarding environmental impacts. The DVS score was positively associated with both GHGE and blue water use per 2000 Kcal for most subsamples, indicating that varied diets in our samples were associated with higher environmental impacts. One of the two components of the DVS score assesses the diversity of protein sources (meat, poultry, fish, dairy, beans, and eggs). Higher DVS reflects higher nutritional quality. Nevertheless, we observed from the study that animal-derived protein sources, especially from beef and pork, contribute significantly to GHGE and water footprint. This implies that high nutritional quality does not necessarily exist together with lower environmental impact. This implication is consistent with the study by Perignon et al. [40], who found that a diet that satisfied the WHO nutritional recommendations was associated with an increase of approximately 30% for water deprivation and by nearly 50% for indicators of land use impact, particularly biodiversity loss.
In terms of GHGE from daily individual food intake, urban consumers had a significantly more varied diet compared to rural consumers. This is likely related to urban incomes and food access through monetary means. While rural households can have high levels of diversity on-farm, this may not always translate into varied diets because of a farm’s size, level of specialization, carrying capacity, seasonality, and other factors. While urban people had a significantly more diverse/varied diet than rural people, their diets generated more GHGE than rural diets. The dietary pattern can partially explain this disparity. People living in the urban district consumed more beef and pork (in terms of calories) than people living in the rural district, which was reflected in higher GHGE of urban diets than rural diets due to meat consumption. Moreover, the food acquisition scenarios revealed that rural households would purchase more meat instead of fruits and vegetables if their household income were to increase. This finding confirms the disparity in meat consumption between urban and rural people and may suggest a potential increase in GHGE—a negative environmental impact—once people’s economic prosperity improves. From an environmental perspective, meat consumption is a concern, but from a nutritional perspective, it can contribute significantly to the intake of essential nutrients not considered in this study. Regarding blue water use, while there were no significant differences between males and females, the result showed significant difference across the three districts.
Blue water footprint associated with daily food intake of people among three districts, with respect to each gender, were quite similar, despite the statistically significant differences. People in the rural district consumed more staple foods than people in the urban district, probably because they are the main source of energy and are cheaper than other food groups. On the other hand, staple foods’ contribution to blue water use was larger in rural diets than in urban diets. These trends also were confirmed with findings in other empirical studies from China and India [16,26]. This finding also highlights a need to incorporate nutritional considerations into national food security strategies in Vietnam to transition from an energy-sufficient diet using mainly starchy staple foods to a healthy diet that provides adequate calories and nutrients from a diverse intake of food groups [1].
Education and income showed different associations with the two environmental indicators within each gender and each district. Education can be a potential leverage point to gain a healthier diet with a lower environmental impact among adults in peri-urban and rural areas. Clearly, this is one of the drivers underlying gradual diets transitions, especially among young consumers.
For GHGE per 2000 Kcal, females from the highest income class household in peri-urban areas consumed diets with a lower environmental impact. Males in rural areas with secondary education and females in rural areas with college education had diets with significant higher GHGE. Similarly, with respect to the impact of blue water use per 2000 Kcal, gender showed some impacts on each district. Males in peri-urban areas with higher education, either secondary school or college, had diets with lower blue water use.
Females from households in peri-urban areas involved in agricultural production were associated with lower dietary-related environmental impacts than females without their own production activities. Most likely, peri-urban households involved in agricultural production gave higher priority to consuming self-produced foods rather than selling them. Food from their own production was unlikely to have an environmental impact in the rural district. However, as learned from the literature, addressing the technical efficiency, technology, awareness, and capacity of the production system can reduce environmental impacts [41]. The linkage between nutrition properties of animal-source-foods, the production system, and their environmental impacts have been discussed in many LMICs [39].
This paper has some limitations. First, the GHGE of each food intake were obtained by multiplying the quantity of food (in kg) with their emissions factors. This approach disregards the fate of crop residues/byproducts (which may be fed to the animals to produce animal food sources) and the multifunctionality of livestock in developing countries (e.g., insurance function of livestock in case of crop failure). Second, the environmental impacts for GHGE and blue water use were derived from the publicly available databases. As a result, the environmental impacts might be over- or underestimated for Vietnam, based on each food category. To the best of our knowledge, no validated measurements of GHGE from agricultural production stratified by food items currently exist in Vietnam, so we used dataFIELD estimates. dataFIELD emission estimates were recently used to measure diet-level environmental impacts for Vietnam [11]. Similarly, the blue water footprint factors were based on evapotranspiration modeling using “average” Vietnam condition and thus are not representative of the production practices in any specific regions, including urban, peri-urban, and rural districts, in Vietnam. More research is required to investigate the adequacy of the environmental impact data for the Vietnam circumstances and to find potential leverage points [42]. From a nutritional perspective, this study focused on calorie intake and diet variety scores only, but other macro- and micronutrients should be considered as well. However, the inclusion of micronutrients would require more detailed dietary intake data. Third, our sample has several characteristics that limit our findings’ external validity. Three sites in the north were selected as benchmarks to study the characteristics of the food system along a rural-peri-urban-urban transect [28]. Although this selection allows for a thorough analysis of the food environment in an LMIC in nutrition transition like Vietnam, the selected sites are not geographically and demographically representative of either the region or the country. Our findings therefore have to be interpreted with caution. In addition, as the collected data also served the purpose of nutritional assessment, the sampled households were limited to those with children under 5. Therefore, the male and female samples are in general younger than in a more representative dataset. Finally, future research on this topic should be conducted with a larger sample size to examine the comprehensive impact of socio-economic factors on diet-related environmental impacts.

Author Contributions

S.d.H. and T.T.T.H. conceived, designed, and coordinated the overall baseline study. T.T.T.H., S.d.H., T.M.N., R.H., T.T.D., T.M.N., and M.T.T. designed the survey and oversaw data collection. H.T.T., V.L., V.T.V., E.E.E., M.H., Y.D., V.T.L., A.D.J., E.F.T., and T.A. designed the analysis. H.T.T., V.L., V.T.V., E.E.E., M.H., and V.T.L. performed the primarily statistical analysis. H.T.T., V.L., V.T.V., and E.E.E. wrote the original draft preparation. All authors contributed to and critically reviewed the manuscript. H.T.T. and V.L. had final responsibility for the final content. All authors have read and agreed to the published version of the manuscript.

Funding

This research was funded by the University of Michigan Graham Institute of Sustainability through the project Leveraging existing data and insights into the policy process to accelerate progress toward achieving sustainable diets in the Global South (EATS) and undertaken as part of the CGIAR Research Program on Agriculture for Nutrition and Health (A4NH) Research Flagship on Food Systems for Healthier Diets (https://a4nh.cgiar.org/our-research/flagship-1/).

Institutional Review Board Statement

The study protocol was approved by the Medical Research Ethics Committee of NIN in Vietnam (Number 233/VDD-QLKH, 2018).

Informed Consent Statement

Informed consent was obtained from all subjects involved in the study.

Acknowledgments

We are grateful to Phan Van Trong for providing us with Figure 1. We thank Hanoi Department of Health and Health Center of Cau Giay, Dong Anh, and Moc Chau districts for advice and support during data collection. We thank Şeyda Özkan and Roel Helmes from Wageningen University & Research for their critical comments on the role of livestock to achieve food security and environmental sustainability in developing countries. This research has been supported by the CGIAR Research Program “Agriculture for Nutrition and Health” (A4NH) through the programme “Food System for Healthier Diets” (https://a4nh.cgiar.org/our-research/flagship-1/); and the University of Michigan Graham Institute of Sustainability through the project Leveraging existing data and insights into the policy process to accelerate progress toward achieving sustainable diets in the Global South (EATS). Finally, we are grateful for the time and willingness of the households who participated in the surveys.

Conflicts of Interest

The authors declare no conflict of interest. The funders had no role in the design of the study; in the collection, analyses, or interpretation of data; in the writing of the manuscript; or in the decision to publish the results.

Appendix A

Table A1. Diet variety score.
DescriptionScoring CriteriaScoreScore Range
Food Groups: 5 food groups: meat/poultry/fish/egg, dairy/beans, grains, fruits, and vegetables≥1 serving from each food group/day 150–15
Any 1 food group missing/d12
Any 2 food group missing/d9
Any 3 food group missing/d6
Any 4 food group missing/d3
None from any food groups0
Protein sources: 6 sources: meat, poultry, fish, dairy, beans, eggs≥3 different sources/day 50–5
2 different sources/d3
From 1 source/d1
None0
TOTAL SCORE FOR VARIETY COMPONENT0–20
Table A2. Food choice questionnaires: “It is important to me that the food I eat on a typical day”. 1 = Not at all important, 2 = Slightly important, 3 = Neither unimportant nor important, 4 = Fairly important, 5 = Very important.
FactorDescriptionFactorDescription
HealthIs high in fiber and roughageSensory AppealTastes good
Is high in proteinSmells nice
Contains a lot of vitamins and mineralsLooks nice
Keeps me healthyHas a pleasant texture
MoodMakes me feel good emotionallyPriceIs not expensive/cheap/good value for money
Keeps me awake/alertWeight ControlIs low in fat
ConvenienceIs easy and/or fast to prepare and cookIs low in calories
Is easily available in shops and supermarketsFamiliarityIs familiar what I usually eat when I was a child
Can be bought in shops close to where I live or workEthical ConcernHas the country of origin clearly marked
Is not forbidden in my religion
Natural ContentContains no additivesComes from countries I approve of politically
Contains natural ingredientsIs packaged in an environmentally friendly way
Is produced without chemicalsProduced in a humane way
Table A3. Usual individual daily calorie intake by food group, gender, and district.
MaleFemale
Food GroupsUrbanPeri-UrbanRuralUrbanPeri-UrbanRural
Starchy staples1156.904 a1208.963 ab1535.1 bc893.577 a982.372 a1160.412 b
Fish and seafood52.62462.96357.34942.8249.55448.026
Pork347.609 a335.764 a189.662 b271.271 a237.727 a133.02 b
Beef37.73226.52514.81931.118 a16.701 ab13.455 bc
Poultry and other meats129.172149.115131.595119.759135.74797.118
Eggs49.393 a36.36 ab17.752 bc46.565 a36.881 ab15.618 bc
Dairy28.932 a33.028 a6.514 b64.77 a62.111 a18.775 b
Pulses and Nuts101.06889.43281.24194.622104.13768.514
Vegetables75.71371.17579.72178.84471.72972.598
Fruits89.15165.32892.167106.4698.508111.2
salt and sauce11.454 a13.181 a5.486 b12.684 a14.68 a5.383 b
Oil and fat87.354 a76.058 a47.768 b77.782 a98.771 ab40.023 bc
Other foods37.352 a48.068 a40.761 b31.91726.28311.941
Sum2204.4582215.962299.9351872.1891935.2011796.083
Significant different at 5% by one-way analysis of variance (ANOVA) and post-hoc Tukey’s range test. Values market with the same letter are not significantly different at p < 0.05.
Table A4. GHGE according to the daily individual daily calorie intake by food group, gender, and district.
MaleFemale
Food GroupsUrbanPeri-UrbanRuralUrbanPeri-UrbanRural
Starchy staples0.5790.5610.6770.4340.4430.507
Fish and seafood0.56 a0.513 a0.252 b0.429 a0.387 a0.206 b
Pork0.837a0.851 a0.513 b0.663 a0.631 a0.361 b
Beef0.8760.6190.3270.717 a0.413 ab0.255 bc
Poultry and other meats0.2490.4740.30.231 ab0.423 b0.198 ac
Eggs0.143a0.096 ab0.051 bc0.134 a0.087 ab0.044 bc
Dairy0.054ab0.072 b0.012 ac0.132 a0.128 a0.028 b
Pulses and Nuts0.053 ab0.07 b0.042 ac0.0490.0650.037
Vegetables0.161 a0.181 a0.332 b0.168 a0.171 a0.288 b
Fruits0.2820.2650.2290.331 ab0.472 b0.277 ac
salt and sauce0.049 a0.070 b0.043 b0.049 a0.072 b0.04 b
Oil and fat0.019 a0.015 a0.005 b0.016 a0.021 a0.005 b
Other foods0.205 a0.164 ab0.042 bc0.1460.1520.111
Sum4.0673.9512.8253.4993.4652.357
Significant difference at 5% by one-way analysis of variance (ANOVA) and post-hoc Tukey’s range test. Values marked with the same letter are not significantly different at p < 0.05.
Table A5. Blue water use according to the daily individual daily calorie intake by food group, gender, and districts.
MaleFemale
Food GroupsUrbanPeri-UrbanRuralUrbanPeri-UrbanRural
Starchy staples0.085 a0.09 a0.105 b0.065 a0.072 ab0.079 bc
Fish and seafood0.0090.010.010.0070.0070.008
Pork0.004 a0.005 a0.004 b0.004 a0.004 a0.004 b
Beef0.0020.0010.0010.002 a0.001 ab0.001 bc
Poultry and other meats0.010.0080.0080.010.0070.006
Eggs0.0050.0020.0010.0040.0020.001
Dairy0.003 a0.003 a0.000 b0.007 a0.006 a0.002 b
Pulses and Nuts0.0040.0030.0030.005 a0.004 ab0.002 bc
Vegetables0.0170.0210.0190.0180.0190.018
Fruits0.0240.0190.0240.0310.0310.031
salt and sauce0.0000.0000.0000.0010.0000.000
Oil and fat0.002 a0.001 ab0.001 bc0.001 ab0.002 b0.001 ac
Other foods0.021 a0.020 ab0.015 bc0.011 a0.009 a0.004b
Sum0.1860.1830.1910.1660.1640.157
Significant difference at 5% by one-way analysis of variance (ANOVA) and post-hoc Tukey’s range test. Values marked with the same letter are not significantly different at p < 0.05.
Table A6. GHGE per 2000 Kcal by food group, gender, and district.
MaleFemale
Food GroupsUrbanPeri-UrbanRuralUrbanPeri-UrbanRural
Starchy staples0.506 a0.511 a0.559 b0.442 a0.459 a0.562 b
Fish and seafood0.472 a0.4 a0.203 b0.455 a0.32 ab0.213 bc
Pork0.716 a0.725 a0.414 b0.681 a0.601 a0.385 b
Beef0.705 a0.531 ab0.254 bc0.6060.3960.261
Poultry and other meats0.182 ab0.376 c0.262 ac0.203 a0.392 b0.228 a
Eggs0.082 a0.08 a0.044 b0.101 a0.095 a0.048 b
Dairy0.044 a0.047 a0.004 b0.146 a0.100 a0.028 b
Pulses and Nuts0.05 ab0.064 b0.036 ac0.0510.0690.041
Vegetables0.120.130.1410.1270.1350.16
Fruits0.1380.1110.1050.2350.1870.18
salt and sauce0.053 a0.071 a0.027 b0.069 a0.078 a0.038 b
Oil and fat0.017 a0.014 a0.007 b0.015 ab0.022 b0.008 ac
Other foods0.104 a0.097 a0.068 b0.055 ab0.058 b0.036 ac
Sum3.1893.1572.1243.1862.9122.188
Significant difference at 5% by one-way analysis of variance (ANOVA) and post-hoc Tukey’s range test. Values marked with the same letter are not significantly different at p < 0.05.
Table A7. Blue water use per 2000 Kcal by food group, gender, and district.
MaleFemale
Food GroupsUrbanPeri-UrbanRuralUrbanPeri-UrbanRural
Starchy staples0.081 a0.082 ab0.088 bc0.072 a0.074 a0.088 b
Fish and seafood0.0090.0090.0090.0080.0080.009
Pork0.036 a0.034 a0.023b0.036 a0.028 b0.021 b
Beef0.005 a0.003 ab0.002 bc0.004 a0.003 ab0.002 bc
Poultry and other meats0.0050.0060.0070.0060.0070.007
Eggs0.0050.0060.0070.0060.0070.007
Dairy0.003 a0.003 a0.000 b0.009 a0.006 a0.002 b
Pulses and Nuts0.004 a0.003ab0.002bc0.006 a0.004 ab0.002 bc
Vegetables0.0160.020.0180.0190.020.021
Fruits0.0230.0180.0220.0350.0330.033
salt and sauce0.000 ab0.000 b0.000 ac0.0000.0000.000
Oil and fat0.002 a0.001 ab0.001 bc0.001 a0.002 a0.001 b
Other foods0.02 a0.019 ab0.014 bc0.012 a0.008 a0.004 b
Sum0.2090.2040.1930.2140.20.197
Significant difference at 5% by one-way analysis of variance (ANOVA) and post-hoc Tukey’s range test. Values marked with the same letter are not significantly different at p < 0.05.

References

  1. FAO; IFAD; UNICEF; WFP; WHO. The State of Food Security and Nutrition in the World 2020. Transforming Food Systems for Affordable Healthy Diets; FAO: Rome, Italy, 2020. [Google Scholar] [CrossRef]
  2. Allievi, L. Francesca and Antonelli, Marta and Dembska, Katarzyna and Principato, Understanding the Global Food System. In Achieving the Sustainable Development Goals through Sustainable Food Systems; Springer: Cham, Switzerland, 2019; pp. 3–23. [Google Scholar]
  3. IPCC. Climate Change 2007: Impacts, Adaptation and Vulnerability. In Contribution of Working Group II to the Fourth Assessment: Report of the Intergovernmental Panel on Climate Change; Cambridge University Press: Cambridge, UK, 2007. [Google Scholar]
  4. Gómez, M.I.; Barrett, C.B.; Raney, T.; Pinstrup-Andersen, P.; Meerman, J.; Croppenstedt, A.; Carisma, B.; Thompson, B. Post-green revolution food systems and the triple burden of malnutrition. Food Policy 2013, 42, 129–138. [Google Scholar] [CrossRef] [Green Version]
  5. FAO. Sustainable Food Systems. Concept and Framework. 2018, pp. 1–8. Available online: http://www.fao.org/3/ca2079en/CA2079EN.pdf (accessed on 4 February 2021).
  6. Trinh, H.T.; Simioni, M.; Thomas-Agnan, C. Decomposition of changes in the consumption of macronutrients in Vietnam between 2004 and 2014. Econ. Hum. Biol. 2018, 31, 259–275. [Google Scholar] [CrossRef] [Green Version]
  7. Nguyen, T.T.; Hoang, M.V. Non-communicable diseases, food and nutrition in Vietnam from 1975 to 2015: The burden and national response. Asia Pac. J. Clin. Nutr. 2018, 27, 19–28. [Google Scholar] [CrossRef]
  8. Thang, N.M.; Popkin, B.M. Patterns of food consumption in Vietnam: Effects on socioeconomic groups during an era of economic growth. Eur. J. Clin. Nutr. 2004, 58, 145–153. [Google Scholar] [CrossRef] [Green Version]
  9. Trinh, T.H.; Morais, J.; Thomas-Agnan, C.; Simioni, M. Relations between socio-economic factors and nutritional diet in Vietnam from 2004 to 2014: New insights using compositional data analysis. Stat. Methods Med. Res. 2019, 28, 2305–2325. [Google Scholar] [CrossRef] [Green Version]
  10. Harris, J.; Nguyen, P.H.; Tran, L.M.; Huynh, P.N. Nutrition transition in Vietnam: Changing food supply, food prices, household expenditure, diet and nutrition outcomes. Food Secur. 2020, 12, 1141–1155. [Google Scholar] [CrossRef]
  11. Heller, M.C.; Walchale, A.; Heard, B.R.; Hoey, L.; Khoury, C.K.; de Haan, S.; Burra, D.D.; Duong, T.T.; Osiemo, J.; Trinh, T.H.; et al. Environmental analyses to inform transitions to sustainable diets in developing countries: Case studies for Vietnam and Kenya. Int. J. Life Cycle Assess. 2020, 25, 1183–1196. [Google Scholar] [CrossRef]
  12. Vos, T.; Lim, S.S.; Abbafati, C.; Abbas, K.M.; Abbasi, M.; Abbasifard, M.; Abbasi-Kangevari, M.; Abbastabar, H.; Abd-Allah, F.; Abdelalim, A.; et al. Global burden of 369 diseases and injuries in 204 countries and territories, 1990–2019: A systematic analysis for the Global Burden of Disease Study 2019. Lancet 2020, 396, 1204–1222. [Google Scholar] [CrossRef]
  13. Beal, T.; Le, D.T.; Trinh, T.H.; Burra, D.D.; Huynh, T.; Duong, T.T.; Truong, T.M.; Nguyen, D.S.; Nguyen, K.T.; de Haan, S.; et al. Child stunting is associated with child, maternal, and environmental factors in Vietnam. Matern. Child Nutr. 2019, 15, e12826. [Google Scholar] [CrossRef] [Green Version]
  14. Beal, T.; Le, T.D.; Trinh, H.T.; Burra, D.D.; Béné, C.; Huynh, T.T.T.; Truong, M.T.; Nguyen, S.D.; Tran, D.T.; Nguyen, K.T.; et al. Child overweight or obesity is associated with modifiable and geographic factors in Vietnam: Implications for program design and targeting. Nutrients 2020, 12, 1286. [Google Scholar] [CrossRef]
  15. Trinh, T.H.; Simioni, M.; Thomas-Agnan, C. Assessing the nonlinearity of the calorie-income relationship: An estimation strategy—With new insights on nutritional transition in Vietnam. World Dev. 2018, 110, 192–204. [Google Scholar] [CrossRef] [Green Version]
  16. He, P.; Baiocchi, G.; Hubacek, K.; Feng, K.; Yu, Y. The environmental impacts of rapidly changing diets and their nutritional quality in China. Nat. Sustain. 2018, 1, 122–127. [Google Scholar] [CrossRef]
  17. He, P.; Baiocchi, G.; Feng, K.; Hubacek, K.; Yu, Y. Environmental impacts of dietary quality improvement in China. J. Environ. Manag. 2019, 240, 518–526. [Google Scholar] [CrossRef]
  18. Aleksandrowicz, L.; Green, R.; Joy, E.J.M.; Harris, F.; Hillier, J.; Vetter, S.H.; Smith, P.; Kulkarni, B.; Dangour, A.D.; Haines, A. Environmental impacts of dietary shifts in India: A modelling study using nationally-representative data. Environ. Int. 2019, 126, 207–215. [Google Scholar] [CrossRef]
  19. Vázquez-Rowe, I.; Larrea-Gallegos, G.; Villanueva-Rey, P.; Gilardino, A. Climate change mitigation opportunities based on carbon footprint estimates of dietary patterns in Peru. PLoS ONE 2017, 12, e0188182. [Google Scholar] [CrossRef]
  20. Kim, B.F.; Santo, R.E.; Scatterday, A.P.; Fry, J.P.; Synk, C.M.; Cebron, S.R.; Mekonnen, M.M.; Hoekstra, A.Y.; de Pee, S.; Bloem, M.W.; et al. Country-specific dietary shifts to mitigate climate and water crises. Glob. Environ. Chang. 2019, 62, 101926. [Google Scholar] [CrossRef]
  21. Mertens, E.; Kuijsten, A.; van Zanten, H.H.; Kaptijn, G.; Dofková, M.; Mistura, L.; D’Addezio, L.; Turrini, A.; Dubuisson, C.; Havard, S.; et al. Dietary choices and environmental impact in four European countries. J. Clean. Prod. 2019, 237, 117827. [Google Scholar] [CrossRef]
  22. Jones, A.D.; Hoey, L.; Blesh, J.; Miller, L.; Green, A.; Shapiro, L.F. A Systematic Review of the Measurement of Sustainable Diets. Adv. Nutr. 2016, 7, 641–664. [Google Scholar] [CrossRef]
  23. Popkin, B.M.; Adair, L.S.; Ng, S.W. Global nutrition transition and the pandemic of obesity in developing countries. Nutr. Rev. 2012, 70, 3–21. [Google Scholar] [CrossRef] [PubMed] [Green Version]
  24. Roos, E.; Lahelma, E.; Virtanen, M.; Prättälä, R.; Pietinen, P. Gender, socioeconomic status and family status as determinants of food behaviour. Soc. Sci. Med. 1998, 46, 1519–1529. [Google Scholar] [CrossRef]
  25. Ricciuto, L.; Tarasuk, V.; Yatchew, A. Socio-demographic influences on food purchasing among Canadian households. Eur. J. Clin. Nutr. 2006, 60, 778–790. [Google Scholar] [CrossRef] [PubMed] [Green Version]
  26. Green, R.F.; Joy, E.J.M.; Harris, F.; Agrawal, S.; Aleksandrowicz, L.; Hillier, J.; Macdiarmid, J.I.; Milner, J.; Vetter, S.H.; Smith, P.; et al. Greenhouse gas emissions and water footprints of typical dietary patterns in India. Sci. Total Environ. 2018, 643, 1411–1418. [Google Scholar] [CrossRef] [PubMed]
  27. Huynh, T.T.T.; Pham, T.M.H.; Trinh, T.H.; Duong, T.T.; Nguyen, R.; Hernandez, M.T.; Lundy, M.; Nguyen, T.K.; Nguyen, L.T.L.; Vuong, T.V.; et al. Partial Food Systems Baseline Assessment at the Vietnam Benchmark Sites; The CGIAR Research Program on Agriculture for Nutrition and Health (A4NH) in Vietnam: Hanoi, Vietnam, 2020. [Google Scholar]
  28. de Haan, S.; Huynh, T.T.T.; Duong, T.T.; Rubin, J. Defining the Benchmark Research Sites (Rural to Urban Transect) in vietnam Flagship 1—Food Systems for Healthier Diets. 2017. Available online: https://www.researchgate.net/publication/326095516_Defining_the_benchmark_research_sites_rural_to_urban_transect_in_Vietnam_Flagship_1_-_Food_systems_for_Healthier_Diets (accessed on 4 February 2021).
  29. HLPE. Nutrition and Food Systems. A Report by the High Level Panel of Experts on Food Security and Nutrition of the Committee on World Food Security; FAO: Rome, Italy, 2017. [Google Scholar]
  30. Vietnam National Institute of Nutrition. Vietnamese Food Composition Table; Medical Publishing House: Hanoi, Vietnam, 2017. [Google Scholar]
  31. FAO; FHI. Minimum Dietary Diversity for Women-A Guide to Measurement; FAO: Rome, Italy, 2016; Available online: http://www.fao.org/3/a-i5486e.pdf (accessed on 4 February 2021).
  32. Tur, J.A.; Romaguera, D.; Pons, A. The Diet Quality Index-International (DQI-I): Is it a useful tool to evaluate the quality of the Mediterranean diet? Br. J. Nutr. 2005, 93, 369–376. [Google Scholar] [CrossRef] [PubMed] [Green Version]
  33. Heller, M.C.; Willits-Smith, A.; Meyer, R.; Keoleian, G.A.; Rose, D. Greenhouse gas emissions and energy use associated with production of individual self-selected US diets. Environ. Res. Lett. 2018, 13, 044004. [Google Scholar] [CrossRef] [PubMed]
  34. Mekonnen, M.M.; Hoekstra, A.Y. The green, blue and grey water footprint of crops and derived crop products. Hydrol. Earth Syst. Sci. 2011, 15, 1577–1600. [Google Scholar] [CrossRef] [Green Version]
  35. Pahlow, M.; van Oel, P.R.; Mekonnen, M.M.; Hoekstra, A.Y. Increasing pressure on freshwater resources due to terrestrial feed ingredients for aquaculture production. Sci. Total Environ. 2015, 536, 847–857. [Google Scholar] [CrossRef] [Green Version]
  36. Steptoe, A.; Pollard, T.M.; Wardle, J. Development of a Measure of the Motives Underlying the Selection of Food: The Food Choice Questionnaire Department of Psychology, St George’s Hospital Medical School, London. Appetite 1995, 25, 267–284. [Google Scholar] [CrossRef] [Green Version]
  37. Batlle-Bayer, L.; Aldaco, R.; Bala, A.; Fullana-i-Palmer, P. Toward sustainable dietary patterns under a water–energy–food nexus life cycle thinking approach. Curr. Opin. Environ. Sci. Health 2020, 13, 61–67. [Google Scholar] [CrossRef]
  38. Allès, B.; Péneau, S.; Kesse-Guyot, E.; Baudry, J.; Hercberg, S.; Méjean, C. Food choice motives including sustainability during purchasing are associated with a healthy dietary pattern in French adults. Nutr. J. 2017, 16, 58. [Google Scholar] [CrossRef] [Green Version]
  39. Nordhagen, S.; Beal, T.; Lawrence, H. The Role of Animal Sources Foods in Healthy, Sustainable, and Equtable Food Systems; Global Alliance for Improved Nutrition (AGIN) discussion paper #5: Geneva, Switzeland, 2020. [Google Scholar] [CrossRef]
  40. Perignon, M.; Sinfort, C.; el Ati, J.; Traissac, P.; Drogué, S.; Darmon, N.; Amiot, M.J.; Amiot, M.J.; Achir, N.; Alouane, L.; et al. How to meet nutritional recommendations and reduce diet environmental impact in the Mediterranean region? An optimization study to identify more sustainable diets in Tunisia. Glob. Food Secur. 2019, 23, 227–235. [Google Scholar] [CrossRef]
  41. Gerber, P.J.; Henning, H.; Benjamin, S.; Mottet, J.D.A.; Carolyn Opio, F.; Allessandra, G.T. Tackling Climate Change through Livestock: A Global Assessment of Emissions and Mitigation Opportunities; Food and Agriculture Organization of the United Nations (FAO): Rome, Italy, 2013. [Google Scholar]
  42. Mayton, H.; Beal, T.; Rubin, J.; Sanchez, A.; Heller, M.; Hoey, L.; de Haan, S.; Duong, T.T.; Huynh, T.; Burra, D.D.; et al. Conceptualizing sustainable diets in Vietnam: Minimum metrics and potential leverage points. Food Policy 2020, 91, 101836. [Google Scholar] [CrossRef]
Figure 1. Maps of three districts surveyed and analyzed in this study.
Agriculture 11 00137 g001
Figure 2. Flow chart of all components and the conceptual framework of the study. Adopted by authors from [29].
Agriculture 11 00137 g002
Figure 3. Average individual caloric intake (left) and individual variety scores (right) by gender and by district. The bar chart shows an average value, and each boxplot shows the distribution of data based on quartiles (the minimum value, the first quartile, the median, the third quartile, and the maximum value and outliers (individual points below bars)).
Agriculture 11 00137 g003
Figure 4. Food sources of household-level diets (%).
Agriculture 11 00137 g004
Figure 5. Average environmental footprints for male and female household members by district.
Agriculture 11 00137 g005
Figure 6. Normalized environmental footprints (per 2000 Kcal) for male and female household members by district.
Agriculture 11 00137 g006
Figure 7. Food groups that households would prefer to buy more of if their food expenditure budget were to increase (%).
Agriculture 11 00137 g007
Table 1. Description of socio-demographic variables in the three districts.
VariablesUrbanPeri-UrbanRural
MaleFemaleMaleFemaleMaleFemale
Number of participants1051099292110111
Age in yearsMean35.231.632.428.931.028.3
Standard deviation6.24.76.15.37.06.3
Share of household in income classes (%)
<7 million VND per month9.55.520.732.672.772.1
7–11 million VND per month21.022.934.829.322.722.5
>11 million VND per month 69.571.644.638.04.55.4
Share of highest education levels of respondents (%)
Primary school or no formal education2.00.98.79.937.033.6
Secondary—high school19.811.956.550.657.461.8
University and college78.287.234.839.55.64.5
Main occupation (%)
Employee (public sector, private company, NGO)67.670.638.032.64.54.5
Self-employed (run family-owned businesses)23.815.644.635.979.186.5
Others8.614.017.432.016.49.0
Table 2. Average food choices scores (standard deviation) by factor and districts.
FactorUrbanPeri-UrbanRural
Health16.5 a (2.4)15.8 b (2.5)14.3 c (3.5)
Mood6.8 a (1.8)7.4 b (1.6)7.4 b (1.7)
Convenience10.8 a (2.2)10.8 a (2.0)9.8 b (2.5)
Sensory Appeal15.4 ab (2.8)15.0 b (2.5)15.7 ac (2.5)
Natural Content12.9 a (1.6)12.1 b (2.0)11.6 c (2.2)
Price3.3 (1.0)3.5 (0.9)3.4 (1.1)
Weight Control7.2 a (1.6)6.9 a (1.4)6.1 b (2.0)
Familiarity3.2 a (1.1)3.2 a (1.0)3.5 b (0.9)
Ethical Concern20.6 a (3.5)20.5 a (3.3)19.2 b (3.6)
Significant difference at 5% by one-way analysis of variance (ANOVA) and post-hoc Tukey’s range test. Values marked with the same letter are not significantly different at p < 0.05.
Table 3. Summary of regression results.
VariablesLogarithm of GHGE per 2000 KcalLogarithm of Blue Water Use per 2000 Kcal
MaleFemaleMaleFemale
Urban
(1)
Peri-Urban
(2)
Rural
(3)
Urban
(4)
Peri-Urban
(5)
Rural
(6)
Urban
(7)
Peri-Urban
(8)
Rural
(9)
Urban
(10)
Peri-Urban
(11)
Rural
(12)
(Intercept)0.0640.889 **0.116−0.3220.469−0.269−1.794 ***−1.644 ***−1.997 ***−1.681 ***−2.011 ***−2.104 ***
Variety scores (cont.)0.032 **0.025 *0.038 ***0.041 **0.029 **0.047 ***0.0080.0060.02 ***0.014 **0.016 **0.022 ***
Income: reference: Less than 7 millions VND
From 7 to 11 millions VND−0.0420.061−0.0010.050.078−0.170.0280.019−0.0140.0860.032−0.02
Greater than 11 millions VND0.1670.032−0.0340.14−0.146 **−0.1460.025−0.008−0.030.021−0.047−0.048
Education: Reference: Primary school or no formal education
Secondary—high school−0.4390.0390.141 *0.417−0.0680.113−0.124−0.138 **0.0330.131−0.0350.046
University and college−0.2880.030.0830.3710.0310.79 ***−0.12−0.157 **0.0040.0380.0020.061
Own production (reference: No Own production)−0.183−0.1210.017−0.24−0.204 **0.0880.185−0.049−0.0030.056−0.085 *0.018
Factor 1—Health−0.028−0.021−0.01−0.023−0.018−0.009−0.0070.021 **−0.001−0.0120.027 ***0.004
Factor 5—Natural Content0.092 *0.0050.030.0670.0260.0250.028 *−0.033 **0.0140.005−0.033 **0.002
Factor 9—Ethical Concern0.010.006−0.017−0.0070.009−0.005−0.0010.003−0.009 *−0.00100
R squared0.1150.0840.2690.1290.180.4170.0960.150.3130.1410.2350.325
Number of observations10592110109921111059211010992111
Note: *, **, and *** mean significant at 10%, 5%, and 1% respectively.
Publisher’s Note: MDPI stays neutral with regard to jurisdictional claims in published maps and institutional affiliations.