Article

Estimation of Starch Hydrolysis in Sweet Potato (Beni Haruka) Based on Storage Period Using Nondestructive Near-Infrared Spectrometry

1
Department of Chemical Engineering, Graduate School of Chosun University, Gwangju 61452, Korea
2
Department of Biochemical and Polymer Engineering, Chosun University, Gwangju 61452, Korea
*
Author to whom correspondence should be addressed.
Agriculture 2021, 11(2), 135; https://doi.org/10.3390/agriculture11020135
Submission received: 22 December 2020 / Revised: 25 January 2021 / Accepted: 4 February 2021 / Published: 6 February 2021
(This article belongs to the Special Issue Postharvest Physiology and Technology of Horticultural Crops)

Abstract

:
Sweet potatoes are a substantial source of nutrition and can be added to processed foods in the form of paste. The moisture and starch contents of these potatoes affect the physicochemical properties of sweet potato paste. In this study, the changes in the moisture, starch, and α-amylase content of sweet potatoes were measured for eight weeks after harvest. Using nondestructive near-infrared analyses and chemometric models, the moisture and starch contents were predicted. The partial least squares (PLS) method was used for prediction, while linear discriminant analysis (LDA) was used for discrimination. To increase the accuracy of the model, the near-infrared spectrum was preprocessed using the Savitzky–Golay derivative (S–G), standard normal variate (SNV), and multiplicative scattering correction methods. When applying PLS to the moisture content, the best calibration model accuracy was obtained using the S–G preprocessed spectrum. Furthermore, the best calibration model accuracy for starch content was obtained using the SNV preprocessed spectrum. The moisture and starch contents were categorized into five classes for LDA, with results indicating that the internal quality of sweet potatoes can be predicted and classified using chemometric models through nondestructive detection.

Graphical Abstract

1. Introduction

Sweet potatoes originate from Central and South America. Total worldwide production currently exceeds 105 million metric tons annually, with Asia producing approximately 82% of this yield [1]. Carbohydrates are the primary components of sweet potatoes, but they also contain other nutrients such as large amounts of vitamin C and potassium, dietary fiber, yalapin, and seraffin [2,3]. Beni Haruka is one of the most popular varieties of sweet potato in Asian countries, and can be prepared in a variety of styles, such as dried, roasted, boiled, steamed, baked, and fried [4]. The consumption of sweet potatoes has recently increased owing to their nutritional advantages and sweet taste. They are sold worldwide in the form of processed foods such as pastes, purees, jerky, chips, and fries [5,6]. Sweet potato paste, which is the most consumed sweet potato-based processed food owing to its ease of transportation and use [7], is obtained by steaming and baking sweet potatoes, followed by peeling, crushing, and removing their fibers using a sieve. More than 90% of the paste is composed of sweet potatoes, and the quality of the final product is determined by the moisture and starch content of the raw sweet potatoes used.
The quality of agricultural products can be classified as either external or internal based on a combination of various attributes, such as appearance, taste, physical qualities, and hardness [8]. External quality is evaluated based on visual appearance and hand feel, and is governed by factors such as color, softness, and hardness. In contrast, internal quality is evaluated using analytical instruments to determine the texture (hardness and crispness), nutrition (carbohydrates, proteins, and vitamins), and defects such as rot, pest invasion, and holes. Various processes, known as curing, are used in food science for preservation and flavoring. The external and internal quality of sweet potatoes can vary during storage. In particular, moisture regulation and starch conversion are two important factors that affect internal quality [9]. During storage and processing, starch is degraded into simpler sugars such as maltose and glucose owing to endogenous amylolytic enzymes, including α-amylase, β-amylase, and starch phosphorylase. Starch degradation, water absorption, and gelatinization occur through the action of these enzymes after harvesting. When α-amylase activity decreases due to growth and storage conditions, the inner portion of sweet potatoes remains intact. This phenomenon, which results in poor viscosity of the sweet potato paste, can be identified by the naked eye as white spots. The evaluation of sweet potato quality is based on external characteristics (such as size, shape, and color) and internal characteristics [10,11]. Characteristics such as moisture and starch content are important factors that determine internal quality, significantly affecting sugar content and viscosity, and thereby the overall taste and appearance [12]. To meet the internal quality standardization of raw sweet potatoes and processed foods, a fast and accurate evaluation of the moisture and starch content is necessary.
Nondestructive detection is a technique that measures quality without changing or destroying the shape or characteristics of an object. This method can reduce the time and labor required for quality evaluation [13]. Among the many spectroscopic methods, near-infrared (NIR) spectroscopy is most commonly used for assessing the quality of agricultural produce, owing to its short measurement time, low cost, simple operation, high efficiency, and repeatability [14,15]. Agricultural products with low tissue densities, such as apples, watermelons, and melons, have been subjected to nondestructive measurements [16]. However, sweet potatoes possess high tissue density, making it difficult to measure their internal characteristics in a nondestructive manner. Katayama et al. were able to predict the starch, moisture, and sugar contents in sweet potatoes through multiple regression analyses by measuring the NIR spectra of 5 mm thick slices [17]. Iwase et al. proposed an acoustic wave method for sweet potato detection in sandy soils [18]. A few studies have reported on the nondestructive analysis of the internal composition of potatoes, which are tuber crops with a similar appearance to sweet potatoes, using NIR spectroscopy. This includes analysis of water content, sugar content, and internal defects [19,20,21,22,23]. However, this species of potato possesses different qualities to those we wish to study, such as starch texture, density, and external characteristics. To the best of our knowledge, the internal quality of sweet potatoes has yet to be evaluated using this method. This study adopted NIR spectroscopy as a nondestructive method, owing to its short measurement time, high efficiency, and repeatability. The results were analyzed using chemometrics to guarantee the accuracy of the NIR spectral analyses. Chemometrics involve the extraction of analytical data information, such as spectra and chromatograms, from chemical systems based on applied mathematics, computer science, and multivariate statistics [24,25]. These analytical data comprise many sets, including samples, wavelengths, and dependent variables, necessitating a multivariate analysis of both independent and dependent variables, with classification and regression models applied based on the chemometric model used [26]. The classification models used in this study were linear discriminant analysis (LDA), principal component analysis, and regression analysis that applies prediction models such as partial least squares (PLS) and multiple linear regression [27,28].
In this study, the variation in moisture, starch, and α-amylase in cured sweet potatoes was measured over a storage period of eight weeks after harvesting. The internal quality was evaluated using nondestructive NIR spectrometry, after which the moisture and starch contents were predicted and discriminated using a chemometric model (i.e., PLS and LDA).

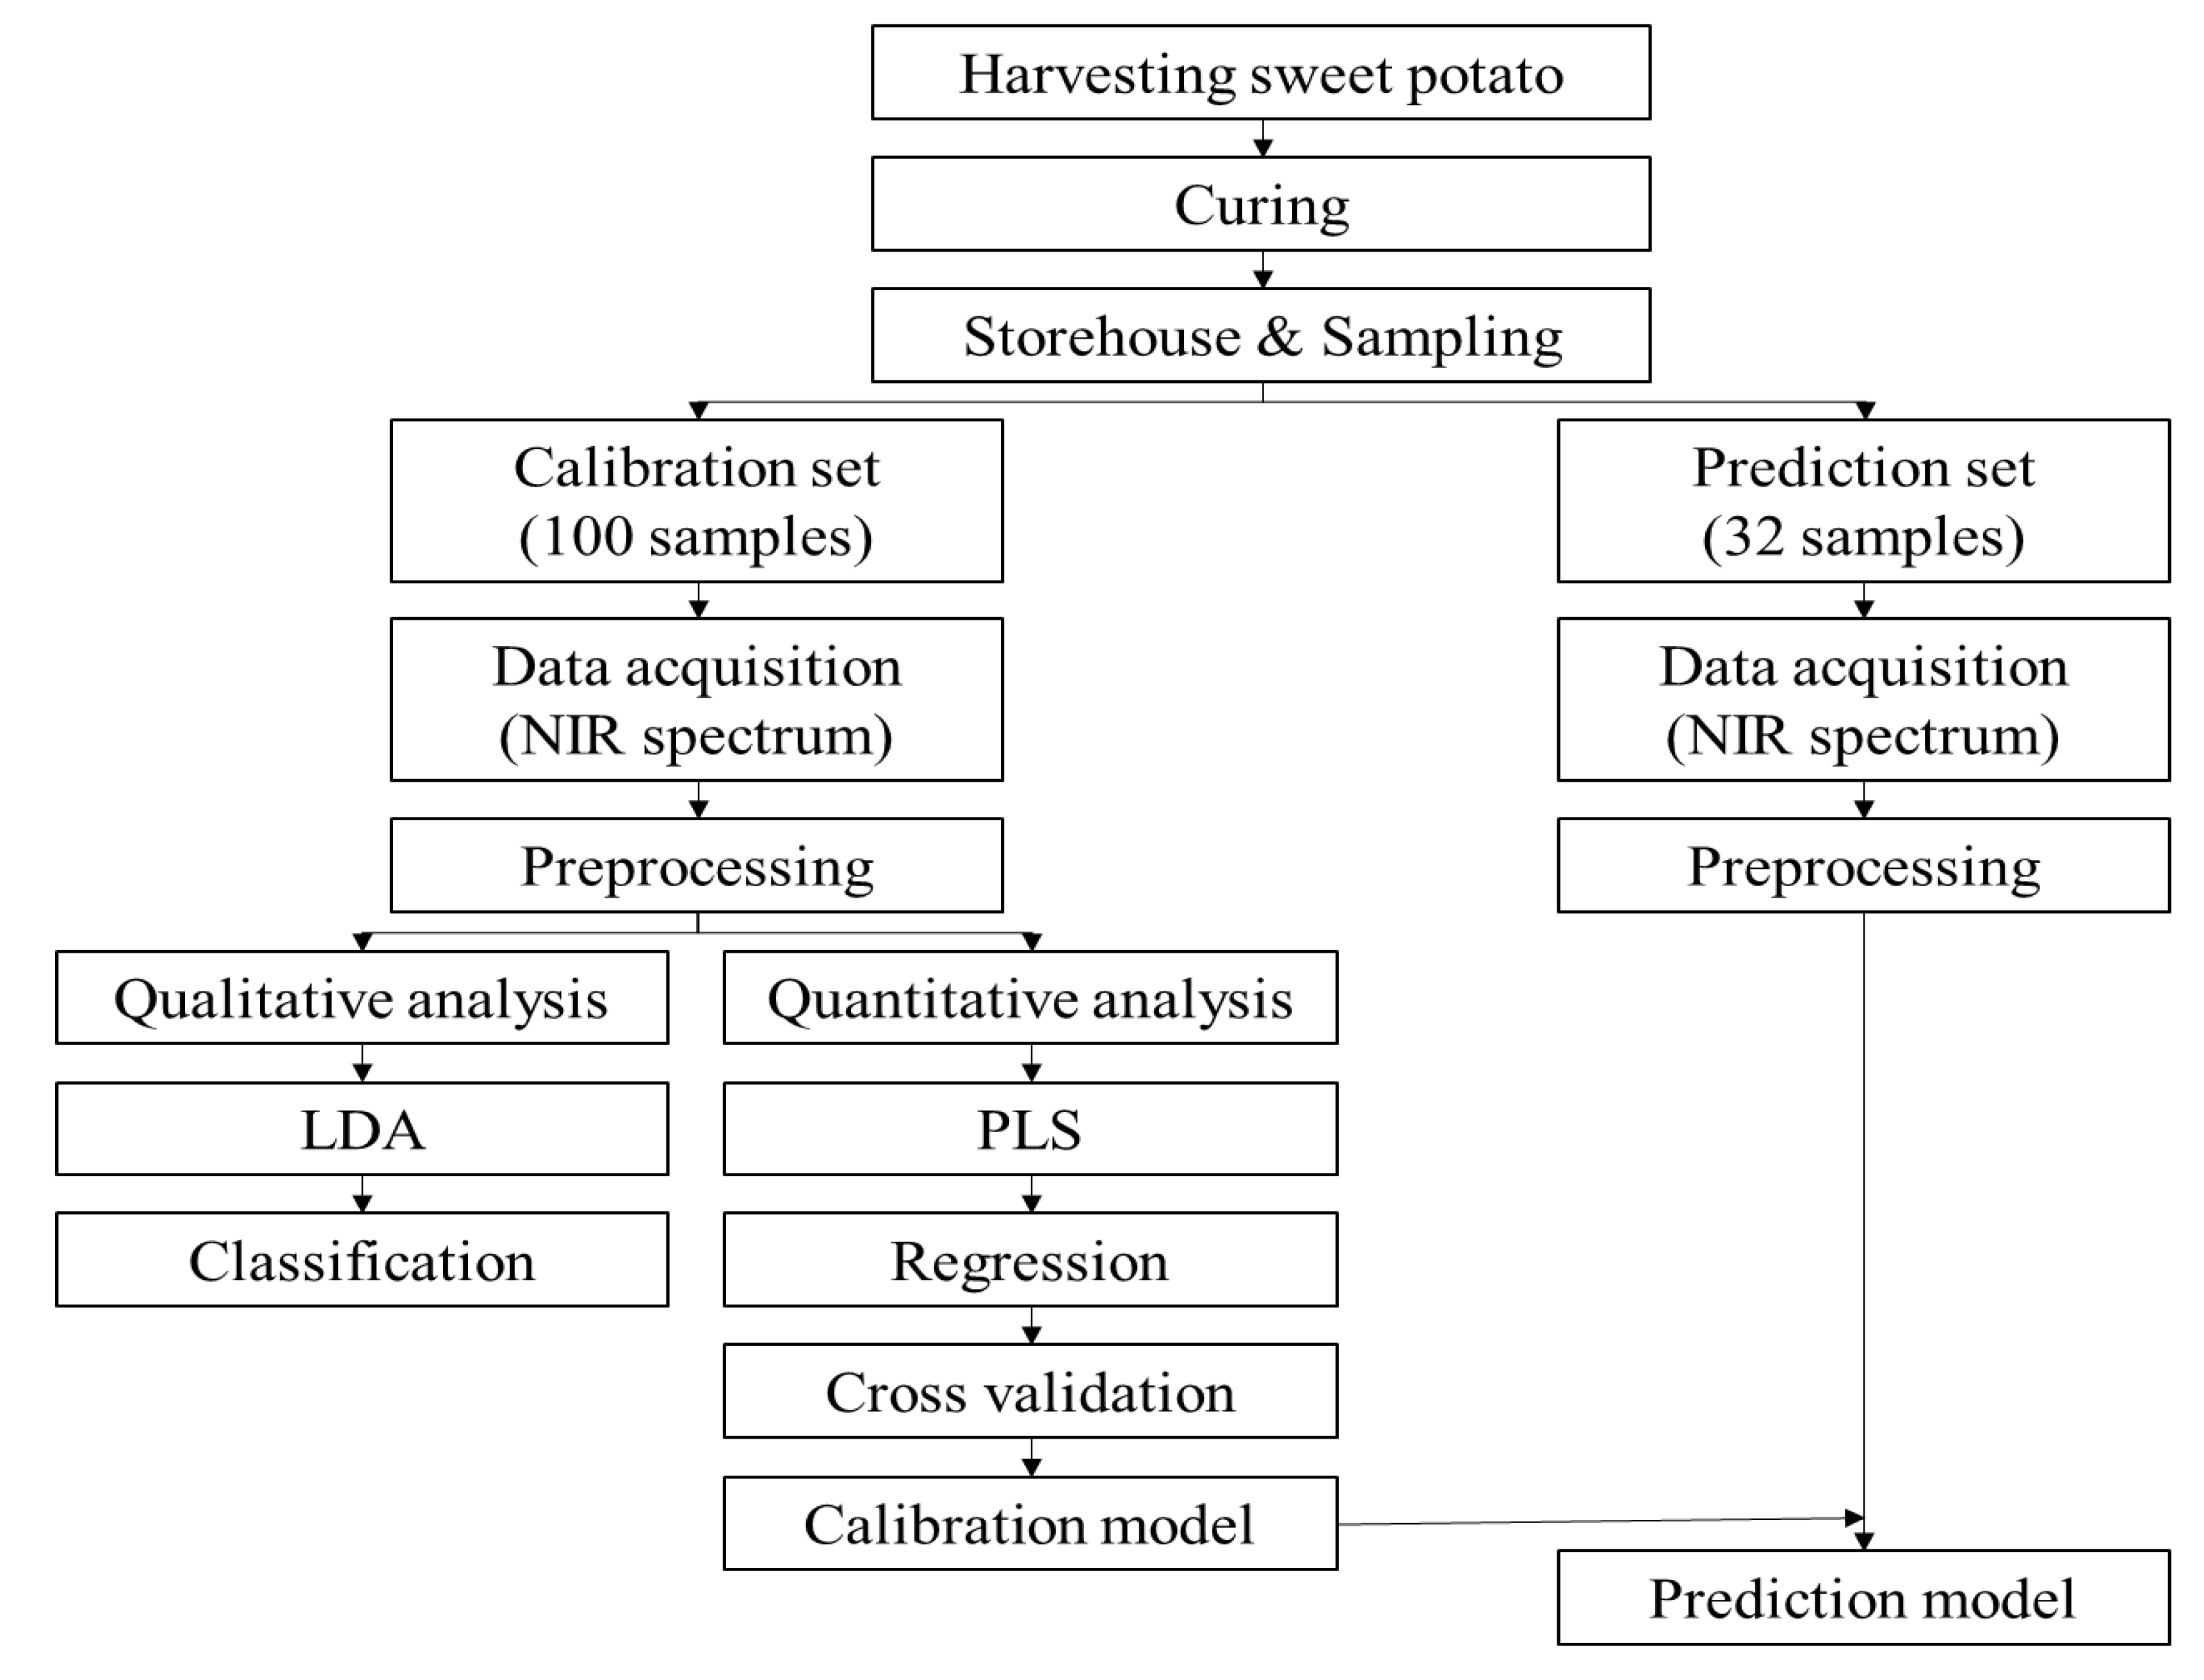
2. Materials and Methods

2.1. Sweet Potatoes

The sweet potatoes (Beni Haruka) in our study were grown and harvested in Gimje-si, Jeollabuk-do, South Korea (35°53′27.6″ N 126°54′45.7″ E). They were cured at 34 °C under 100% relative humidity for 3 days, and stored at 12 °C under 85% relative humidity in a storage warehouse at the Gongdeok Nonghyup Agricultural Products Processing Plant (Gongdeok 7-gil, Gongdeok-myeon, Gimje-si, Jeollabuk-do, Korea). A total of 144 sweet potatoes were stored, and 18 sweet potatoes were delivered to the laboratory in each of weeks 1–8, involving 2 h of transportation. The NIR spectra and internal qualities (moisture, starch, and α-amylase activity) of these sweet potatoes were analyzed.

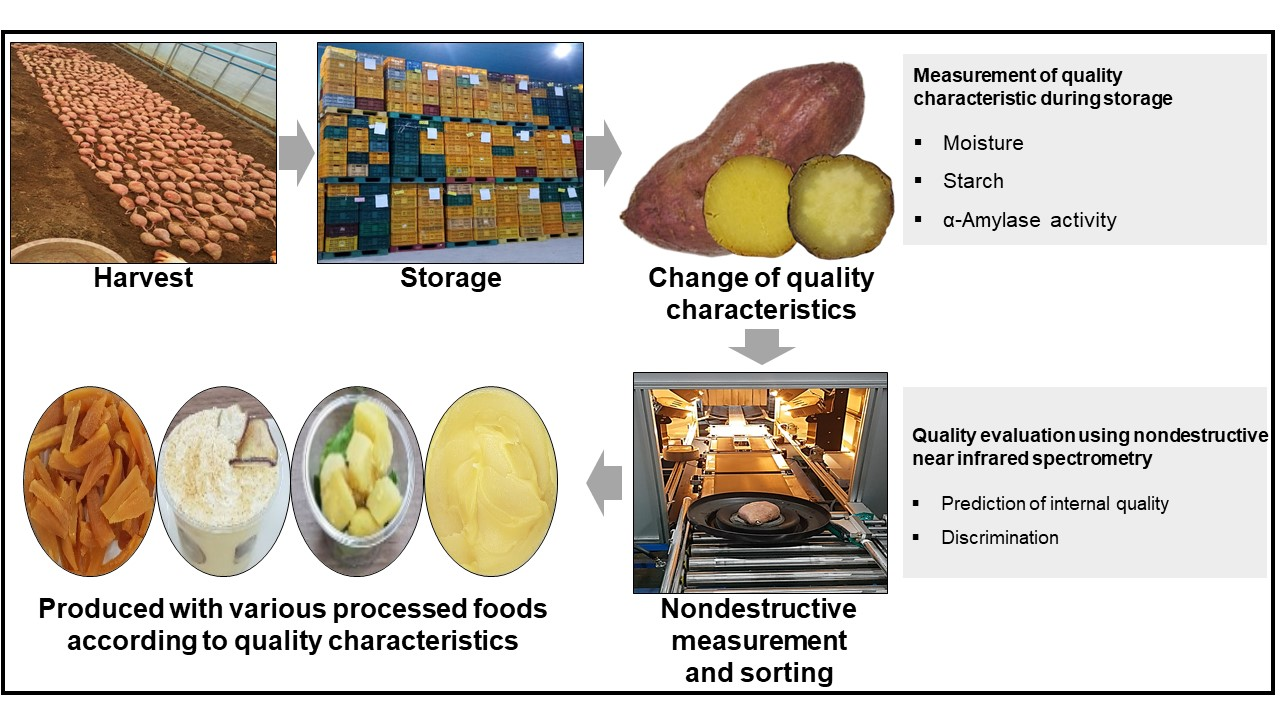
2.2. Measurement of Quality Characteristics During Storage
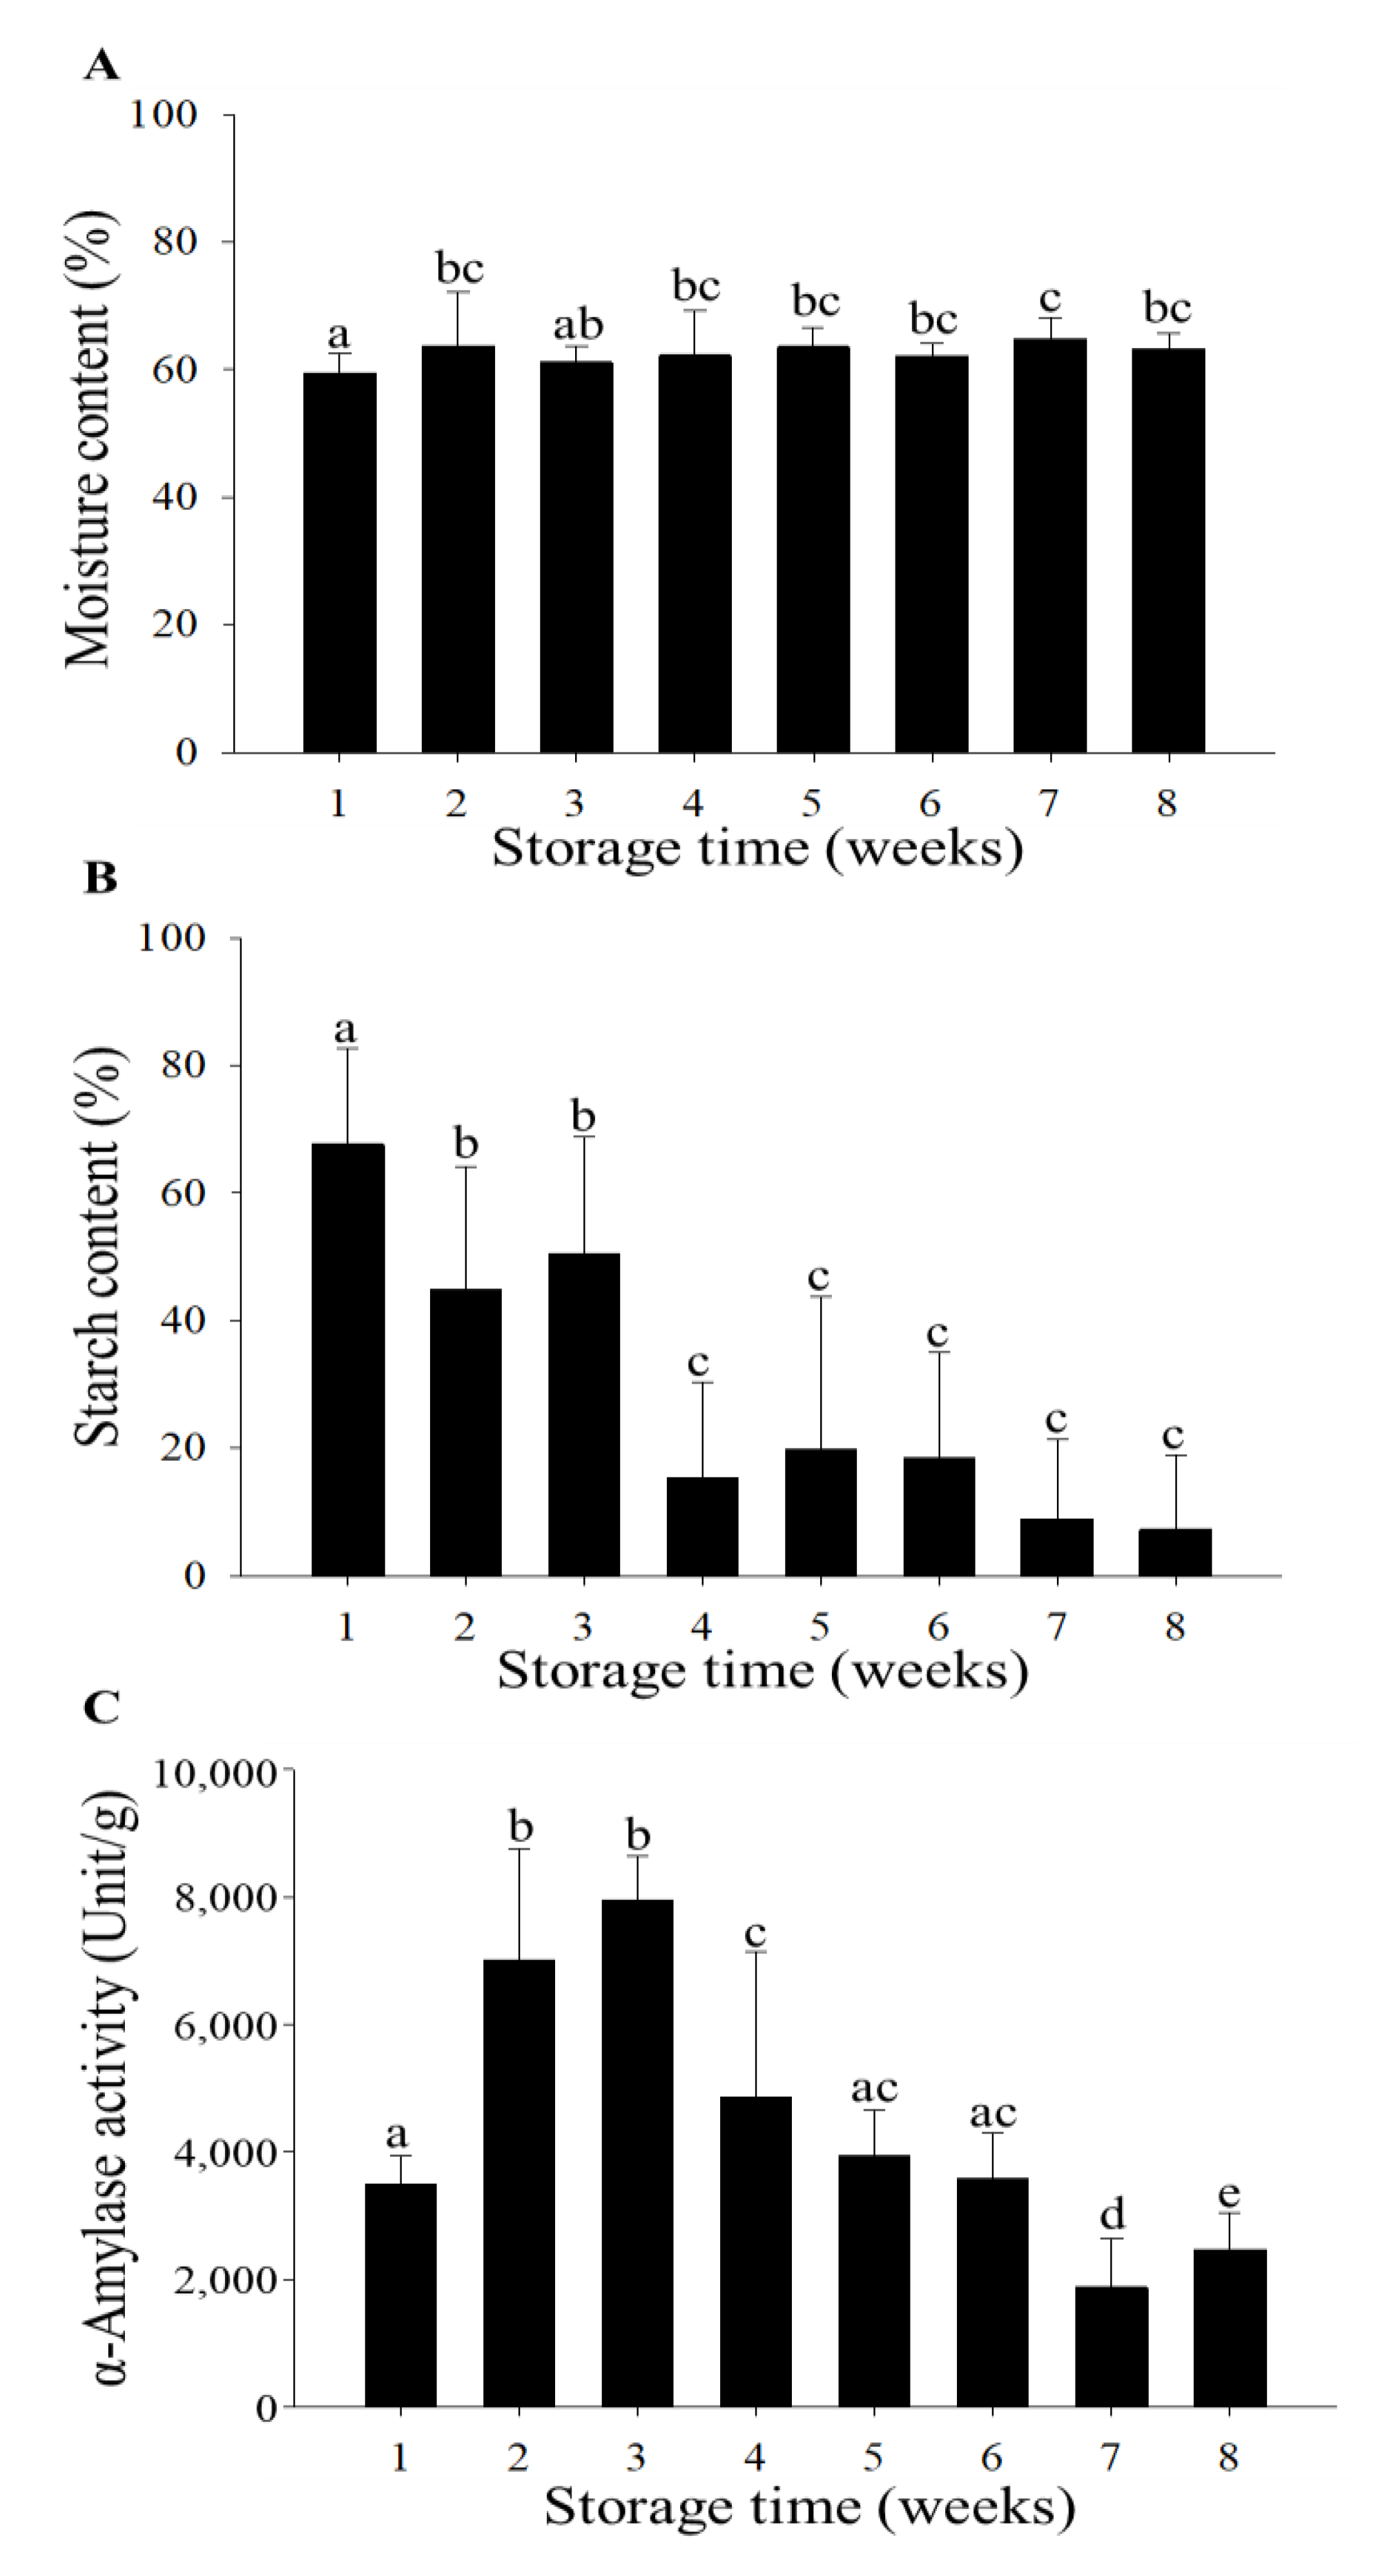
2.2.1. Moisture

After conducting nondestructive NIR spectroscopy, the sweet potatoes were cut into 1 mm thick slices, and the slices near the center were selected to verify the internal quality. The moisture content was determined using a modified Association of Official Analytical Chemists (AOAC) method [29]. A dish with a lid was left in an oven at 105 °C until it reached a constant weight, and was then cooled in a desiccator for 30 min. A sweet potato sample was added to the dish, the dish was covered with a lid, and the weight (W1) was measured. After placing the dish in the oven, the lid was opened slightly, and the sample was dried for 3 h. The sample in the cooled dish was stored in a desiccator for approximately 30 min, after which its mass was measured. The sample was then dried again for 1 to 2 h, and the same operation was repeated until a constant weight was attained (W2). The moisture content was calculated using the following equation: moisture (%) = [(W1-W2)/W1] × 100.

2.2.2. Starch

After conducting the NIR measurements and sampling for moisture and α-amylase assays, the remaining portion of the sweet potato was baked in an oven at 180 °C for 90 min. The baked sweet potatoes were cut near the center to obtain a cross-sectional slice. RGB images of the sample were captured in a white plastic box with dimensions of 30 cm × 30 cm × 30 cm, using a camera placed approximately 30 cm above the baked sweet potato. The amount of light entering the box was controlled by a black curtain. The white balance was set using a neutral gray card. The acquired images were processed using ImageJ software (NIH, Bethesda, MD, USA). An RGB image showing only the baked sweet potato cross-section and excluding the background was selected, and converted into a 256-level grayscale image with black corresponding to 0 and white to 255. The images were translated into a histogram with the gray intensity level (GIL) ranging from 0 to 255 on the x-axis and pixel count on the y-axis. The starch content was determined by the GIL, where the starch corresponded to the lighter area where GIL>100 (A1) and the hydrolyzed starch part corresponded to darker areas where GIL<100 (A2). The starch content was calculated using the following equation: starch content (%) = [A1/(A1 + A2)] × 100.

2.2.3. α-Amylase Assay

Sweet potato samples with a thickness of 1 mm were homogenized, and enzyme extract was obtained by adding a McIlvaine buffer (pH 7.0) solution in amounts that were 10 times the volume of the sweet potato sample. The substrate solution contained 1% (w/v) soluble starch. Five milliliters of a preincubated substrate solution, 4 mL of McIlvaine buffer, and 1 mL of 0.1% CaCl2 were incubated with 10 mL of the enzyme extract at 37 °C for 20 min. The reaction was terminated using ice to reduce the temperature to 0 °C for 10 min. The supernatant was collected after centrifugation at 10,000 rpm at 4 °C for 10 min. Next, 0.2 mL of the supernatant and 0.6 mL of dinitrosalicylic acid (DNS) solution were reacted at 100 °C for 5 min, and then cooled at room temperature. The absorbance was measured at 540 nm using a UV–Vis spectrophotometer (S-3100, SCINCO, Seoul, Korea) with a blank solution of 0.2 mL of McIlvaine buffer (pH 7.0) and 0.6 mL of DNS solution, comprising 1% dinitrosalicylic acid, 1% sodium hydroxide, 0.2% phenol, and 0.05% sodium sulfite [30].

2.3. Quality Evaluation Using Nondestructive Techniques

2.3.1. Measurement of NIR Spectrum

The NIR spectrum was obtained using halogen tungsten lamps (JCR12V-100WBAU, USHIO, Tokyo, Japan) and a detector (Ava Spec-UV/VIS/NIR, AVANTES, Apeldoorn, the Netherlands) controlled via software developed by Hansung Engineering (Cheonansi, Chungcheongnamdo, Korea). The spectral acquisition of uncut sweet potatoes was conducted within a spectral range of 500 to 2500 nm, using a sampling interval of 1.0 nm. The transmission mode was used, and transmittance (%T) was converted into absorbance value using the conversion equation absorbance = 2 − log(%T). The range of 760–1420 nm was used for the spectrum analysis, with the spectrum based on the average values of 16 scans collected three times for each sample. The measurement equipment included an NIR spectrophotometer, as shown in Figure 1A. The spectra were obtained and the chemometric model was applied via NIR penetration of the central portion of intact sweet potatoes during the transmission mode, which was then collected by the detector. It was confirmed that the NIR spectra could be obtained from sweet potatoes using an industrial device, and that the chemometric model could be applied (Figure 1B).

2.3.2. Chemometrics

Pretreatment of NIR Spectrum

To improve the accuracy of the model, the NIR spectra were preprocessed. The Savitzky–Golay derivative (S–G), standard normal variate (SNV), and multiplicative scattering correction (MSC) methods were employed as pretreatment methods using an Unscrambler (Camo Analytics, Oslo, Norway) [31]. When using the S–G method, a polynomial derivative was applied. In this study, a first-order derivation was used with a second-order polynomial and 11 smoothing points. The spectra were smoothed by reducing the signal-to-noise ratio of the existing finite difference before calculating the derivative [32]. The SNV and MSC performed Savizky-Golay smoothing to remove noise before pretreatment, and were used to correct the spectral data for scatter effects [33].

Prediction of Post-harvest Quality Using NIR

To apply the prediction model for internal quality, a calibration model was established using PLS and an Unscrambler (Figure 2). Outliers were evaluated using Q residuals and Hotelling’s T2 values. Twelve samples with high Q residuals and high Hotelling’s T2 values were removed. Sweet potatoes were randomly categorized into two groups: a calibration set (100 samples) for modeling and a prediction set (32 samples) for validating the model. PLS is a popular linear regression algorithm typically used to construct models for value prediction [34], and is widely used in spectral calibration analyses by creating latent variables (LVs) that correspond to the projection of independent and dependent variables. The relationship between the LVs and their target attributes is established mathematically. The cross-validation set was calculated from the calibration set to indicate the error of the proposed calibration models [35]. The prediction set was calculated from the prediction data to evaluate the prediction ability of the PLS models. The accuracy of the prediction model was evaluated based on the fitting correlation coefficients for the calibration (Rc2), cross-validation (Rcv2), and prediction datasets (Rp2), along with their corresponding root mean square errors (RMSEC, RMSECV, RMSEP). The RMSEP/RMSECV ratio and the residual prediction deviation (RPD) were adopted to evaluate the robustness of the model. The RPD value is the ratio of the standard error of prediction to the standard deviation; if the RMSEP/RMSECV value of the model was less than 1.2, it was assumed that the performance of the model was robust and accurate [36,37]. An RPD value of 2 or more indicates good prediction capability, a value in the range of 1.5–2 indicates intermediate prediction capability, and < 1.5 indicates poor prediction capability [38]. The squared correlation coefficient (R2) can be used to evaluate the goodness of fit between the actual and predicted values. The closer R2 is to 1, the better the model fits.

Discrimination of Sweet Potatoes Using NIR

LDA was performed using NIR data from the calibration set of PLS. The moisture and starch contents were categorized into five classes within the range, and then analyzed using LDA for classification using MATLAB code (2019a, MathWorks, Natick, MA, USA). LDA classified the raw and preprocessed NIR spectra by reducing the number of dimensions and maximizing the ratios between and within classes [39].

3. Results

3.1. Measurement of Quality Characteristics During Storage

Figure 3 and Table S1 show the changes in the internal quality of sweet potatoes during storage according to the moisture, starch, and α-amylase contents. The general range of moisture content was 59.44−64.83 wt%, which was maintained at an approximate constant through regulation of the humidity in the storage warehouse (Figure 3A). The starch content decreased as the storage period increased (Figure 3B). Figure 4 shows the cross-section of the baked sweet potatoes according to the degree of starch decomposition. As shown in Figure 3C, α-amylase activity increased during the first 3 weeks of the storage period, and decreased thereafter. In addition, α-amylase activity increased significantly during weeks 2 and 3 of the storage period. During a storage period of 3 weeks, the highest activity was measured at 7839 units/g. The α-amylase activity decreased significantly in weeks 7 and 8 during the storage period. After the amylase enzyme activity increased, the starch concentration rapidly decreased. This is a general observation of starch hydrolysis in sweet potatoes. A previous study reported the measured changes in the α-amylase activity of five sweet potato varieties grown in Uganda, and found that the α-amylase activity varied depending on whether the sweet potato flesh was cream, white, orange, or pale orange [40]. However, their results indicated that all varieties exhibited the highest levels of α-amylase activity at 3 weeks, comparable to our present study. Hagenimana et al. measured the distribution of α-amylase in the outer and inner portions of sweet potatoes using immunological detection and activity measurements [41]. Their immunological detection showed the presence of α-amylase in the outer portions of sweet potatoes, for example, laticifer, cambium, and parenchyma tissues, but not in the inner portion. The α-amylase activity was measured by mechanically separating the outer and inner portions. Furthermore, α-amylase activity was higher in the outer portion than in the inner portion. Sarikaya et al. measured the abilities of α-amylase and β-amylase from Bacillus amyloliquefaciens and B. cereus in degrading raw starch granules [42]. The two types of α-amylase showed different decomposition patterns, and the degradation ability of α-amylase was higher than that of β-amylase. Previous studies have shown that α-amylase is released from the outer portion of sweet potatoes after harvesting. Nabubuya et al. measured the changes in glucose and total starch content of cured sweet potatoes over a storage period of 8 weeks [12]. Their experimental results indicated that as the storage period increased, the glucose content also increased and total starch content decreased. In addition, a decrease in starch content was confirmed, which was considered to be responsible for the reduced paste viscosities of sweet potato flour.

3.2. Quality Evaluation Using Nondestructive Techniques

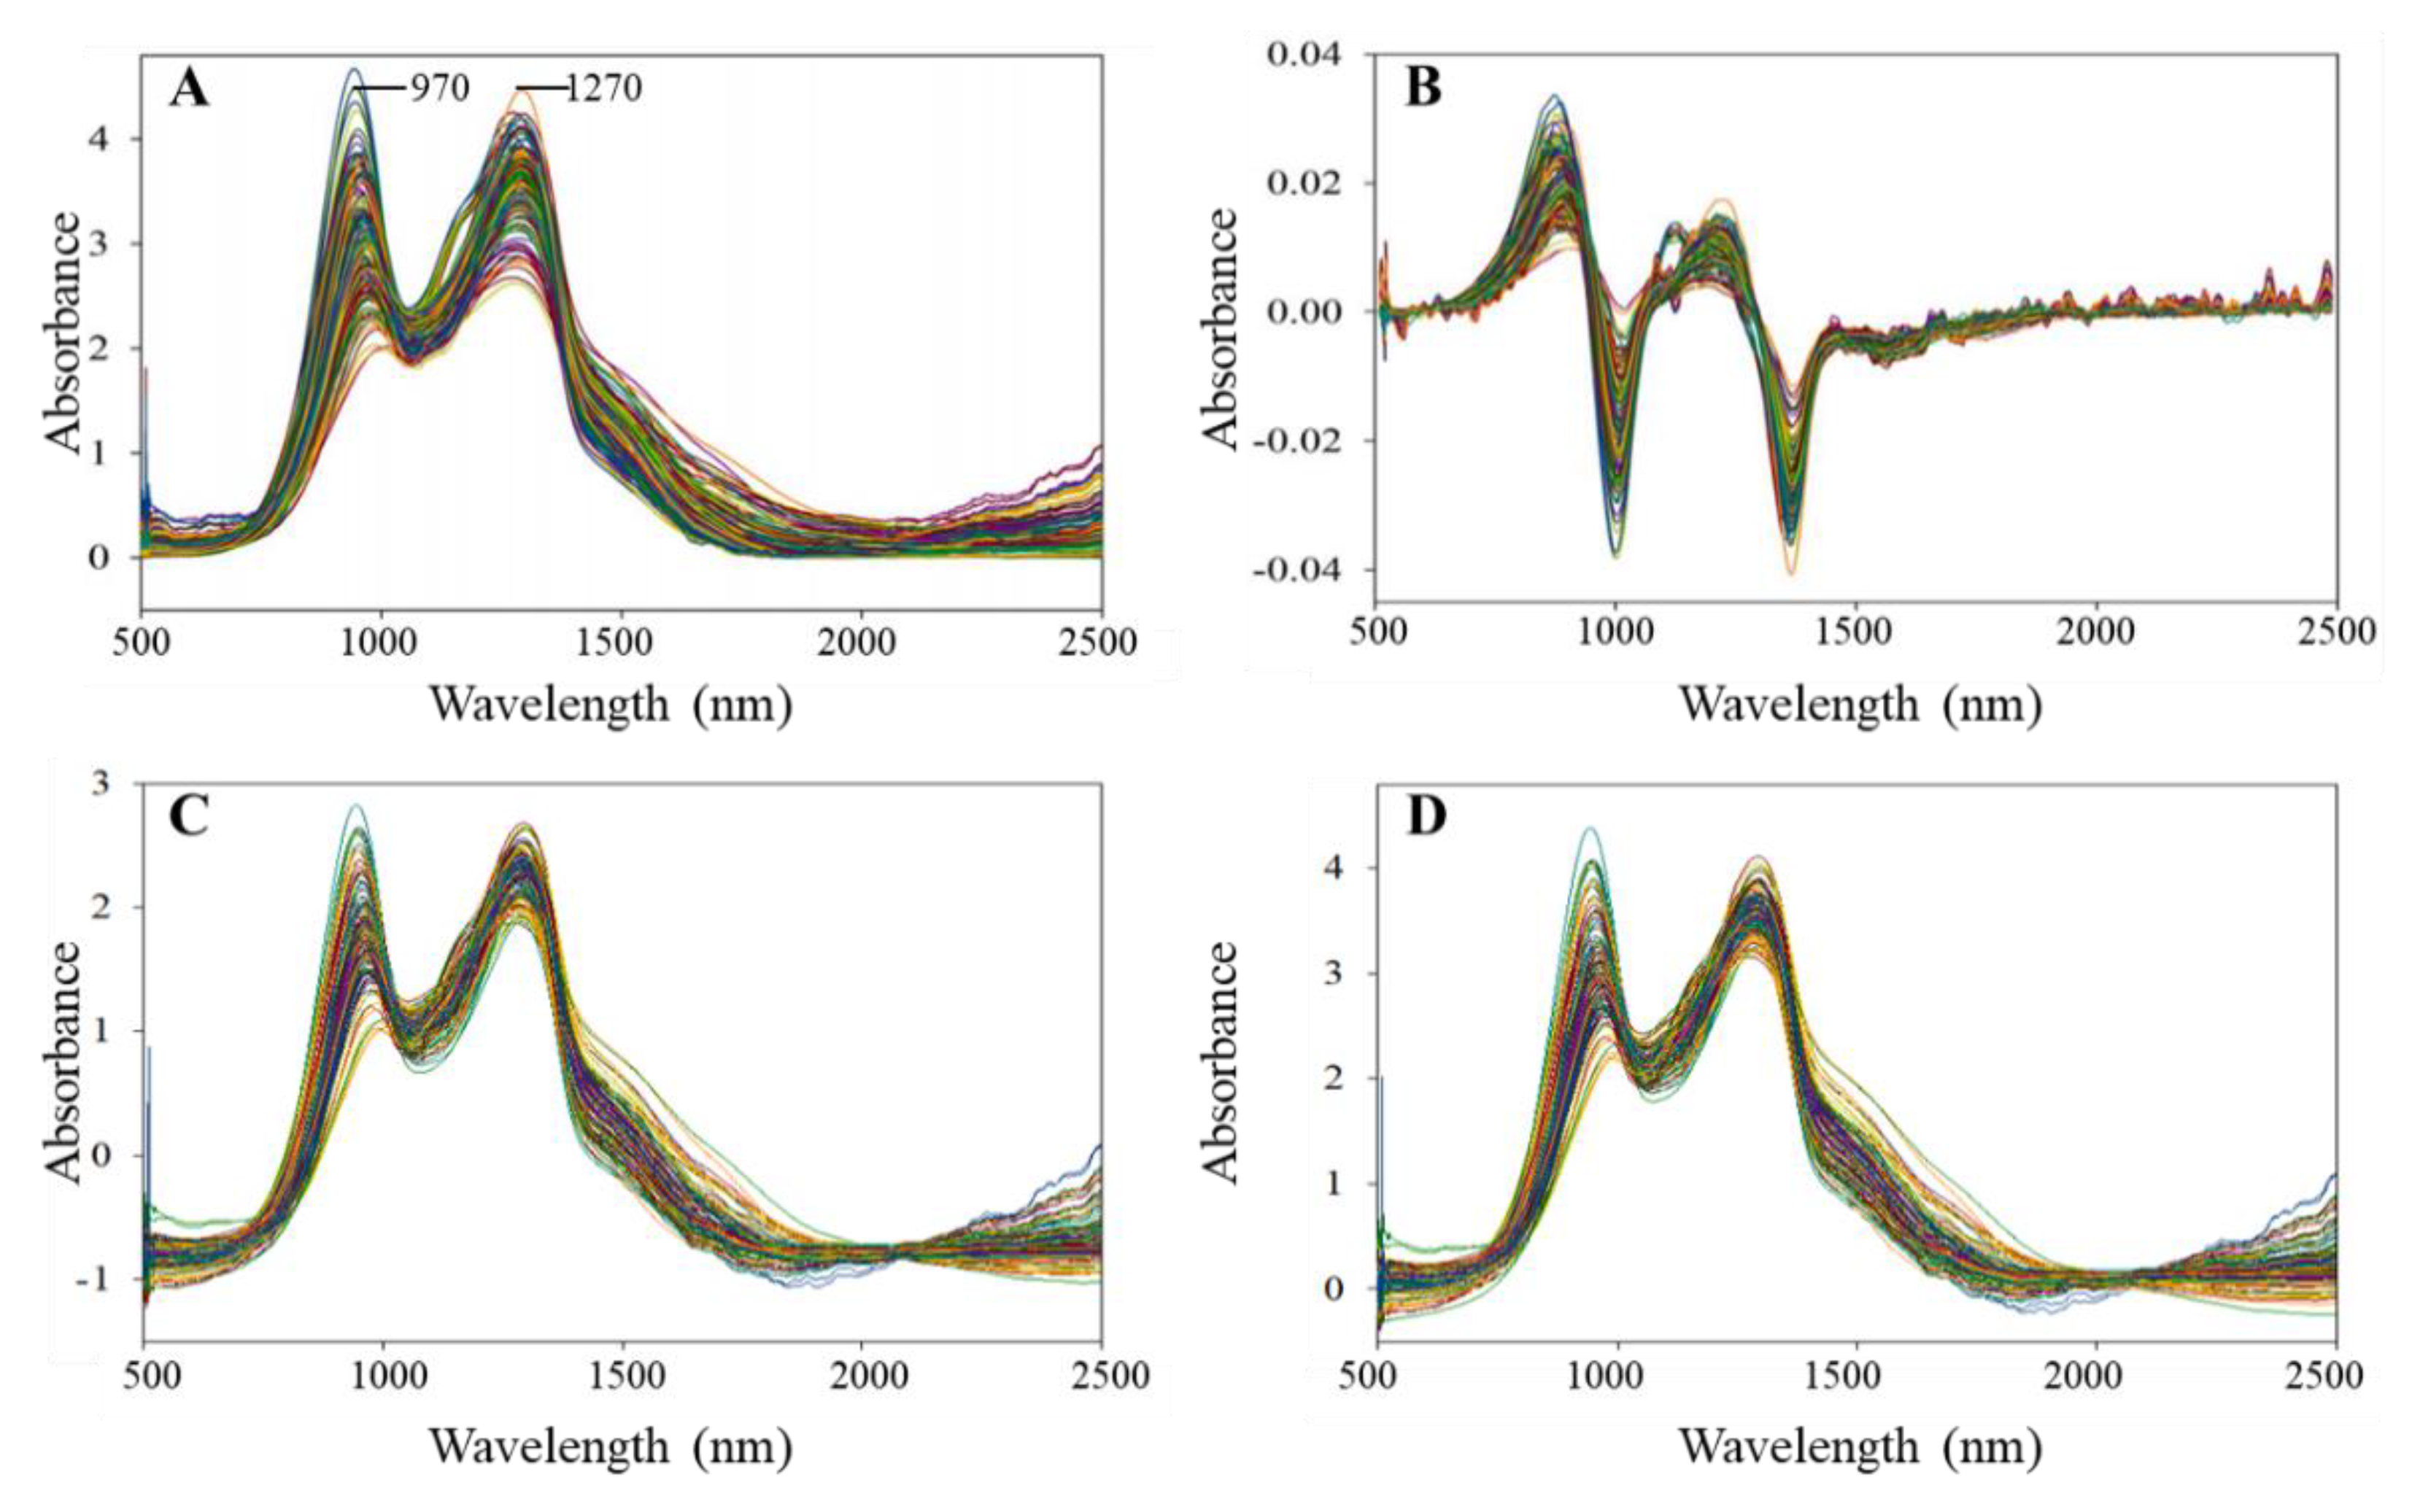
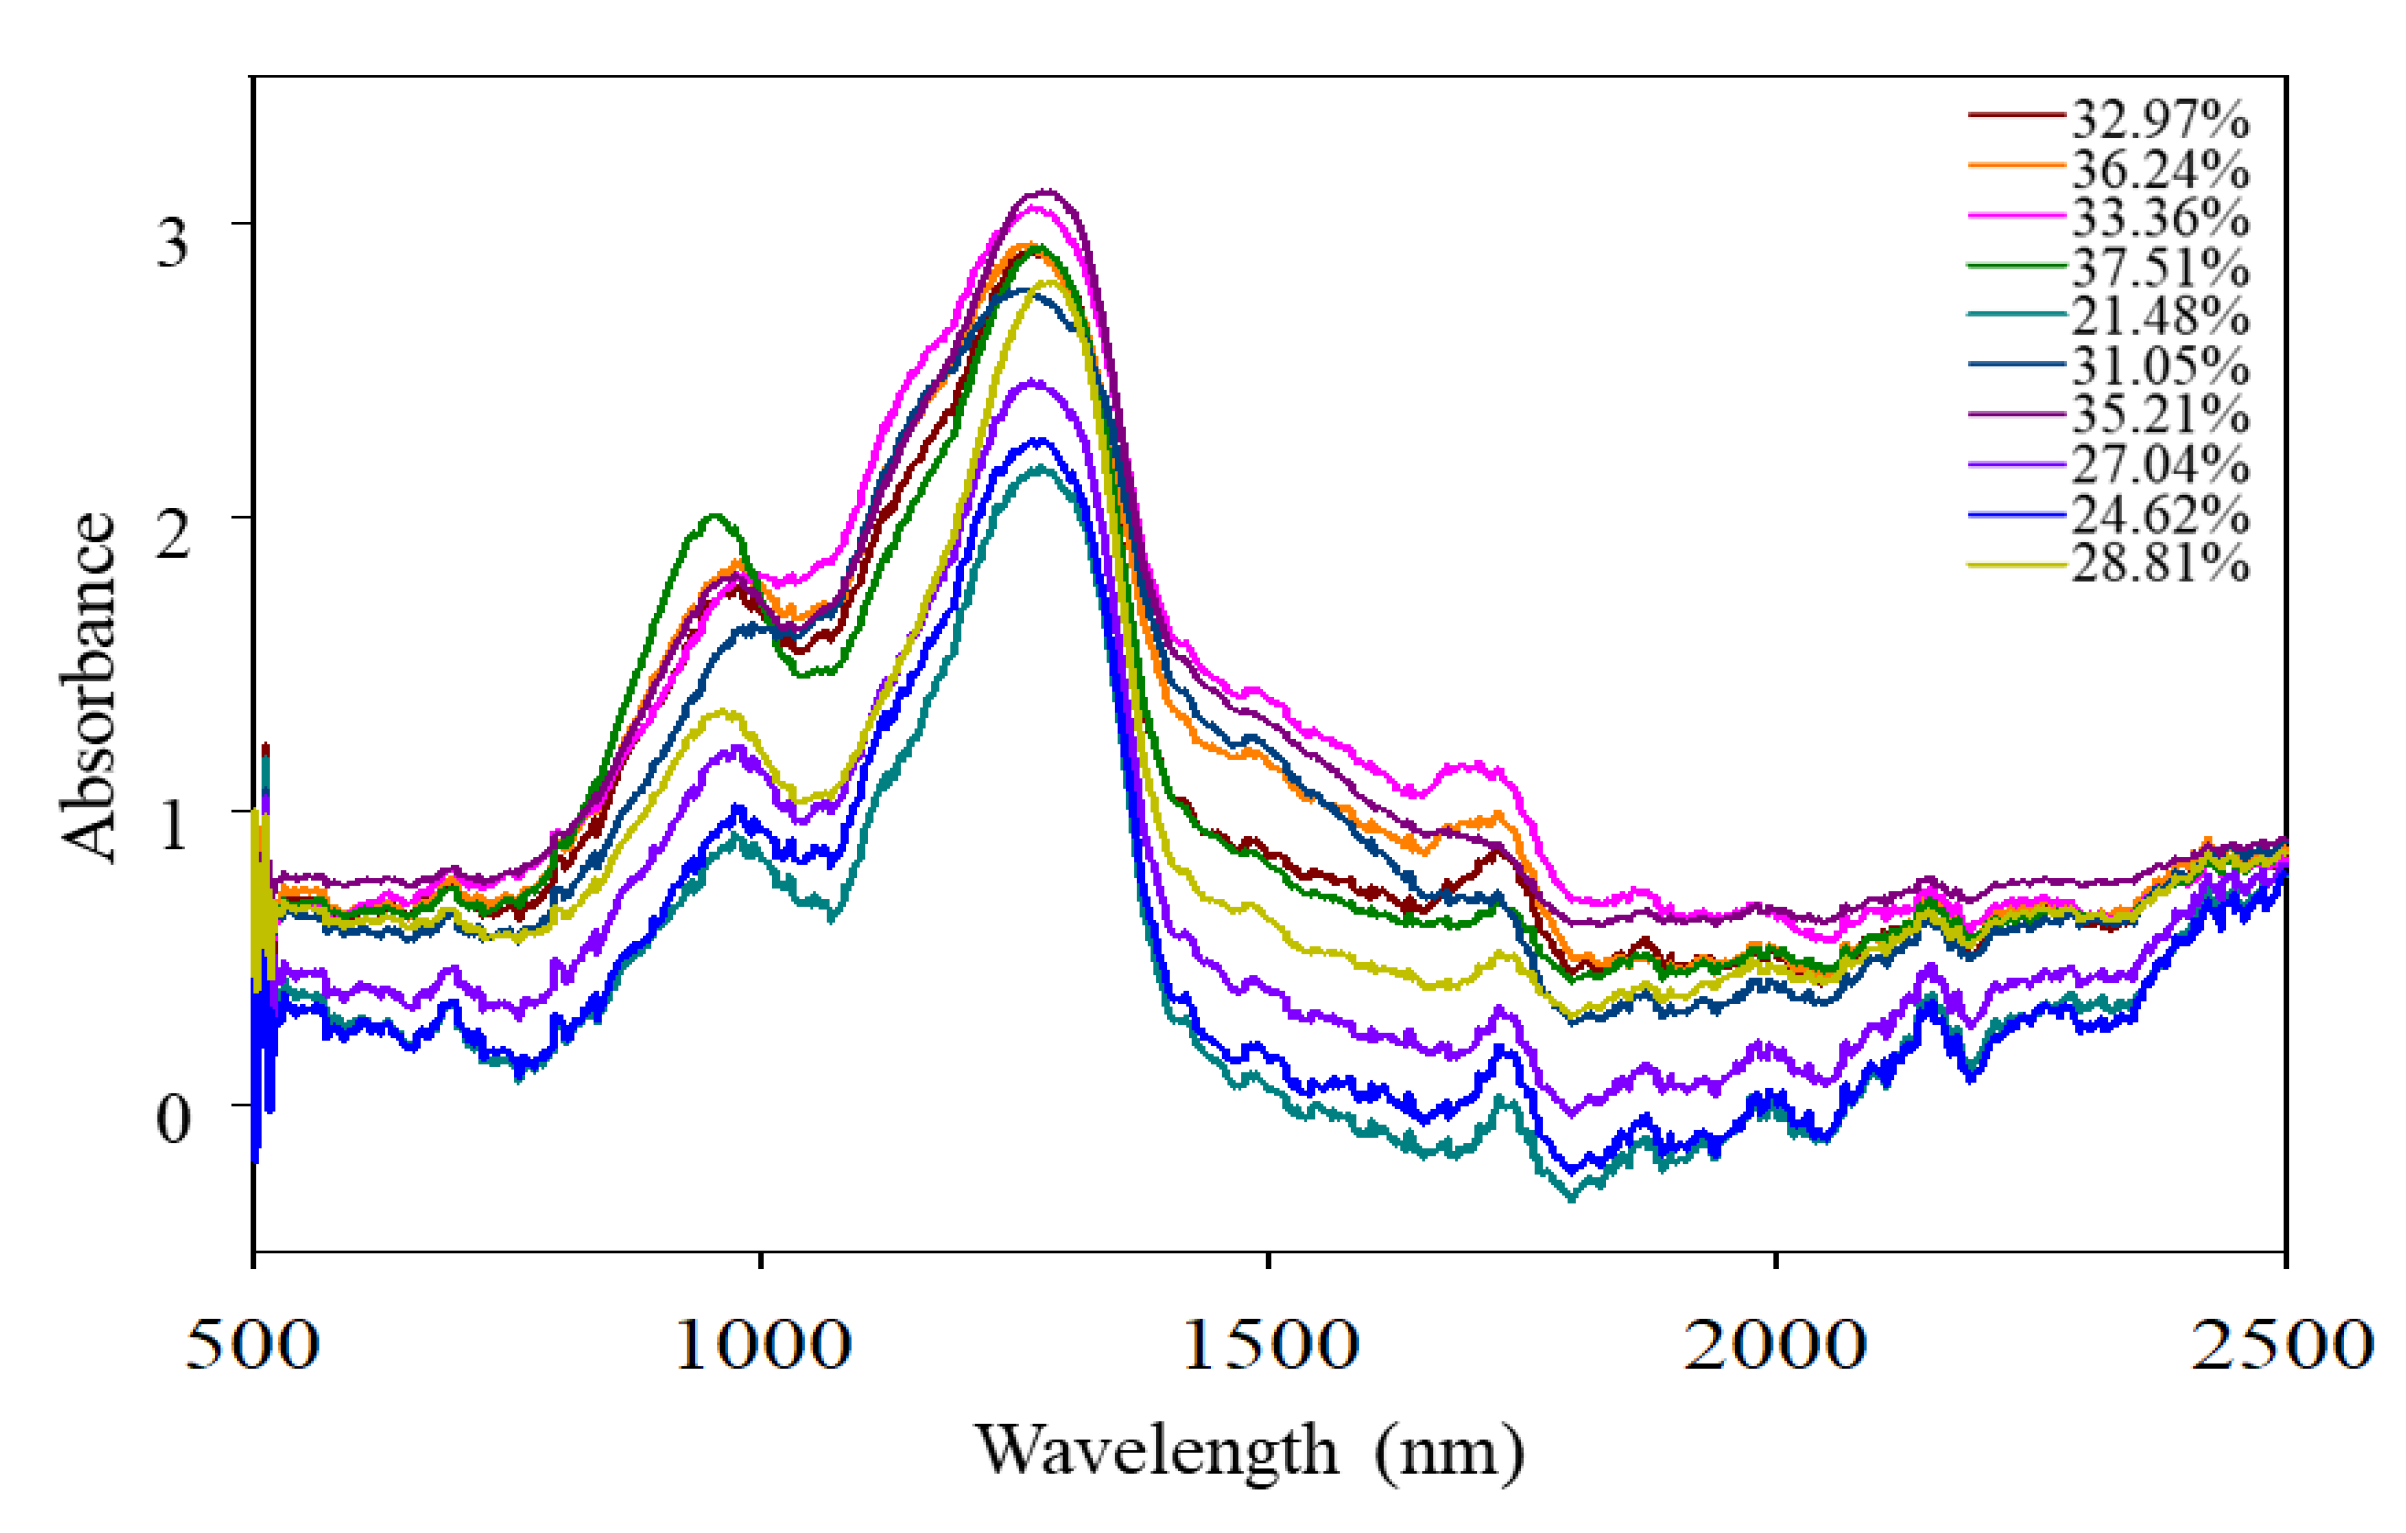
3.2.1. Spectral Characteristics of NIR Acquisition

The raw spectrum is shown in Figure 5A, with the transmission curves expressed as the absorbance. The spectrum comprises two main peaks located at approximately 970 and 1270 nm. The spectra preprocessed through S–G, SNV, and MSC are shown in Figure 5B–D. It should be noted that the NIR spectra can be affected by water in agricultural products. Luck et al. reported that the stretching and bending of O–H occurred at 970, 1190, 1450, and 1940 nm, as indicated by the NIR spectra [43]. Water can form bonds with various organic molecules, creating a shift in the absorption wavelength during bond formation [44]. Moreover, the NIR spectra are mainly observed as a broad band caused by the overlapping absorption, corresponding to the combinations and overtones of the vibrations of the C–H, N–H, and O–H chemical bonds [45]. In this study, it was observed that the NIR spectra were affected by moisture content. The NIR spectrum measurements after the dehydration of sweet potatoes indicated that the raw material contained approximately 30% water; although the 970 nm peak was weakened, the 1270 nm peak remained relatively strong (Figure 6). It was confirmed that the 970 and 1270 nm peaks were the second overtones of the O–H and C–H stretching, respectively, and the intensity of the peak was altered due to hydrogen bonding with water. Therefore, the O–H stretching of water contributed to the 970 nm peak, based on the prediction model of starch in Section 3.2.2, and the 1270 nm peak is related to the C–H stretching of starch.

3.2.2. Prediction of Internal Quality Using NIR

Table 1 presents the calibration, cross-validation, and prediction of PLS with raw, S–G, SNV, and MSC preprocessing spectra for the moisture and starch contents of sweet potatoes. The regression plots and regression coefficient plots of the PLS are shown in Figures S1–S8. The model performance for the moisture content was highest over the S–G preprocessed spectrum for calibration (RC2 = 0.7878, RMSEC = 1.1147), and the MSC preprocessed spectrum for prediction (RP2 = 0.8065, RMSEP = 1.2480). For the starch content, the calibration model performance was highest over the SNV preprocessed spectrum (RC2 = 0.8320, RMSEC = 10.5383), and the highest prediction model performance was over the MSC preprocessed spectrum (RP2 = 0.7811, RMSEP = 11.4115). The raw spectrum is affected by noise and scatter effects, but inaccurate information of the raw spectrum can be removed by preprocessing using S–G, SNV, and MSC. Noise is caused by the electronics and mechanical vibration of the instrument, and the scatter effect causes the diffuse reflectance. Therefore, the PLS model performances of the S–G, SNV, and MSC preprocessed spectra were improved compared to the raw spectrum. The RMSEP/RMSECV values of all measured models ranged from 0.7710 to 1.0424. Furthermore, the model accuracy was measured based on the RPD values. The RPD values of all measured models ranged from 1.0211 to 2.1749, indicating moderate to high prediction accuracy of the models. Furthermore, a PLS regression model analysis was performed for α-amylase. However, both the calibration and prediction models indicated R2 values of 0.2 or less, and were consequently not included in the experimental results. Farhadi et al. predicted the starch, sugar, and moisture contents, which were considered qualitative variables for potatoes, using PLS and Vis/NIR spectroscopy [46]. Rady and Guyer predicted and classified the glucose and sucrose contents of entire and sliced potatoes using NIR reflectance [23]. Guoquan et al. predicted the physiochemical quality (amylose content, total starch content, protein content, phosphorus content, solubility, crystallinity, and hot paste viscosity) of sweet potato starch using NIR reflectance spectroscopy and the PLS model [47]. The measurement results showed that the R2 value of the prediction model was 0.614–0.917, implying a high correlation between the NIR spectrum and the physiochemical quality of sweet potato starch. Thus, it was confirmed that sweet potato starch affects the NIR spectrum. As a result, it was assumed in this study that starch content could be predicted using the PLS model.

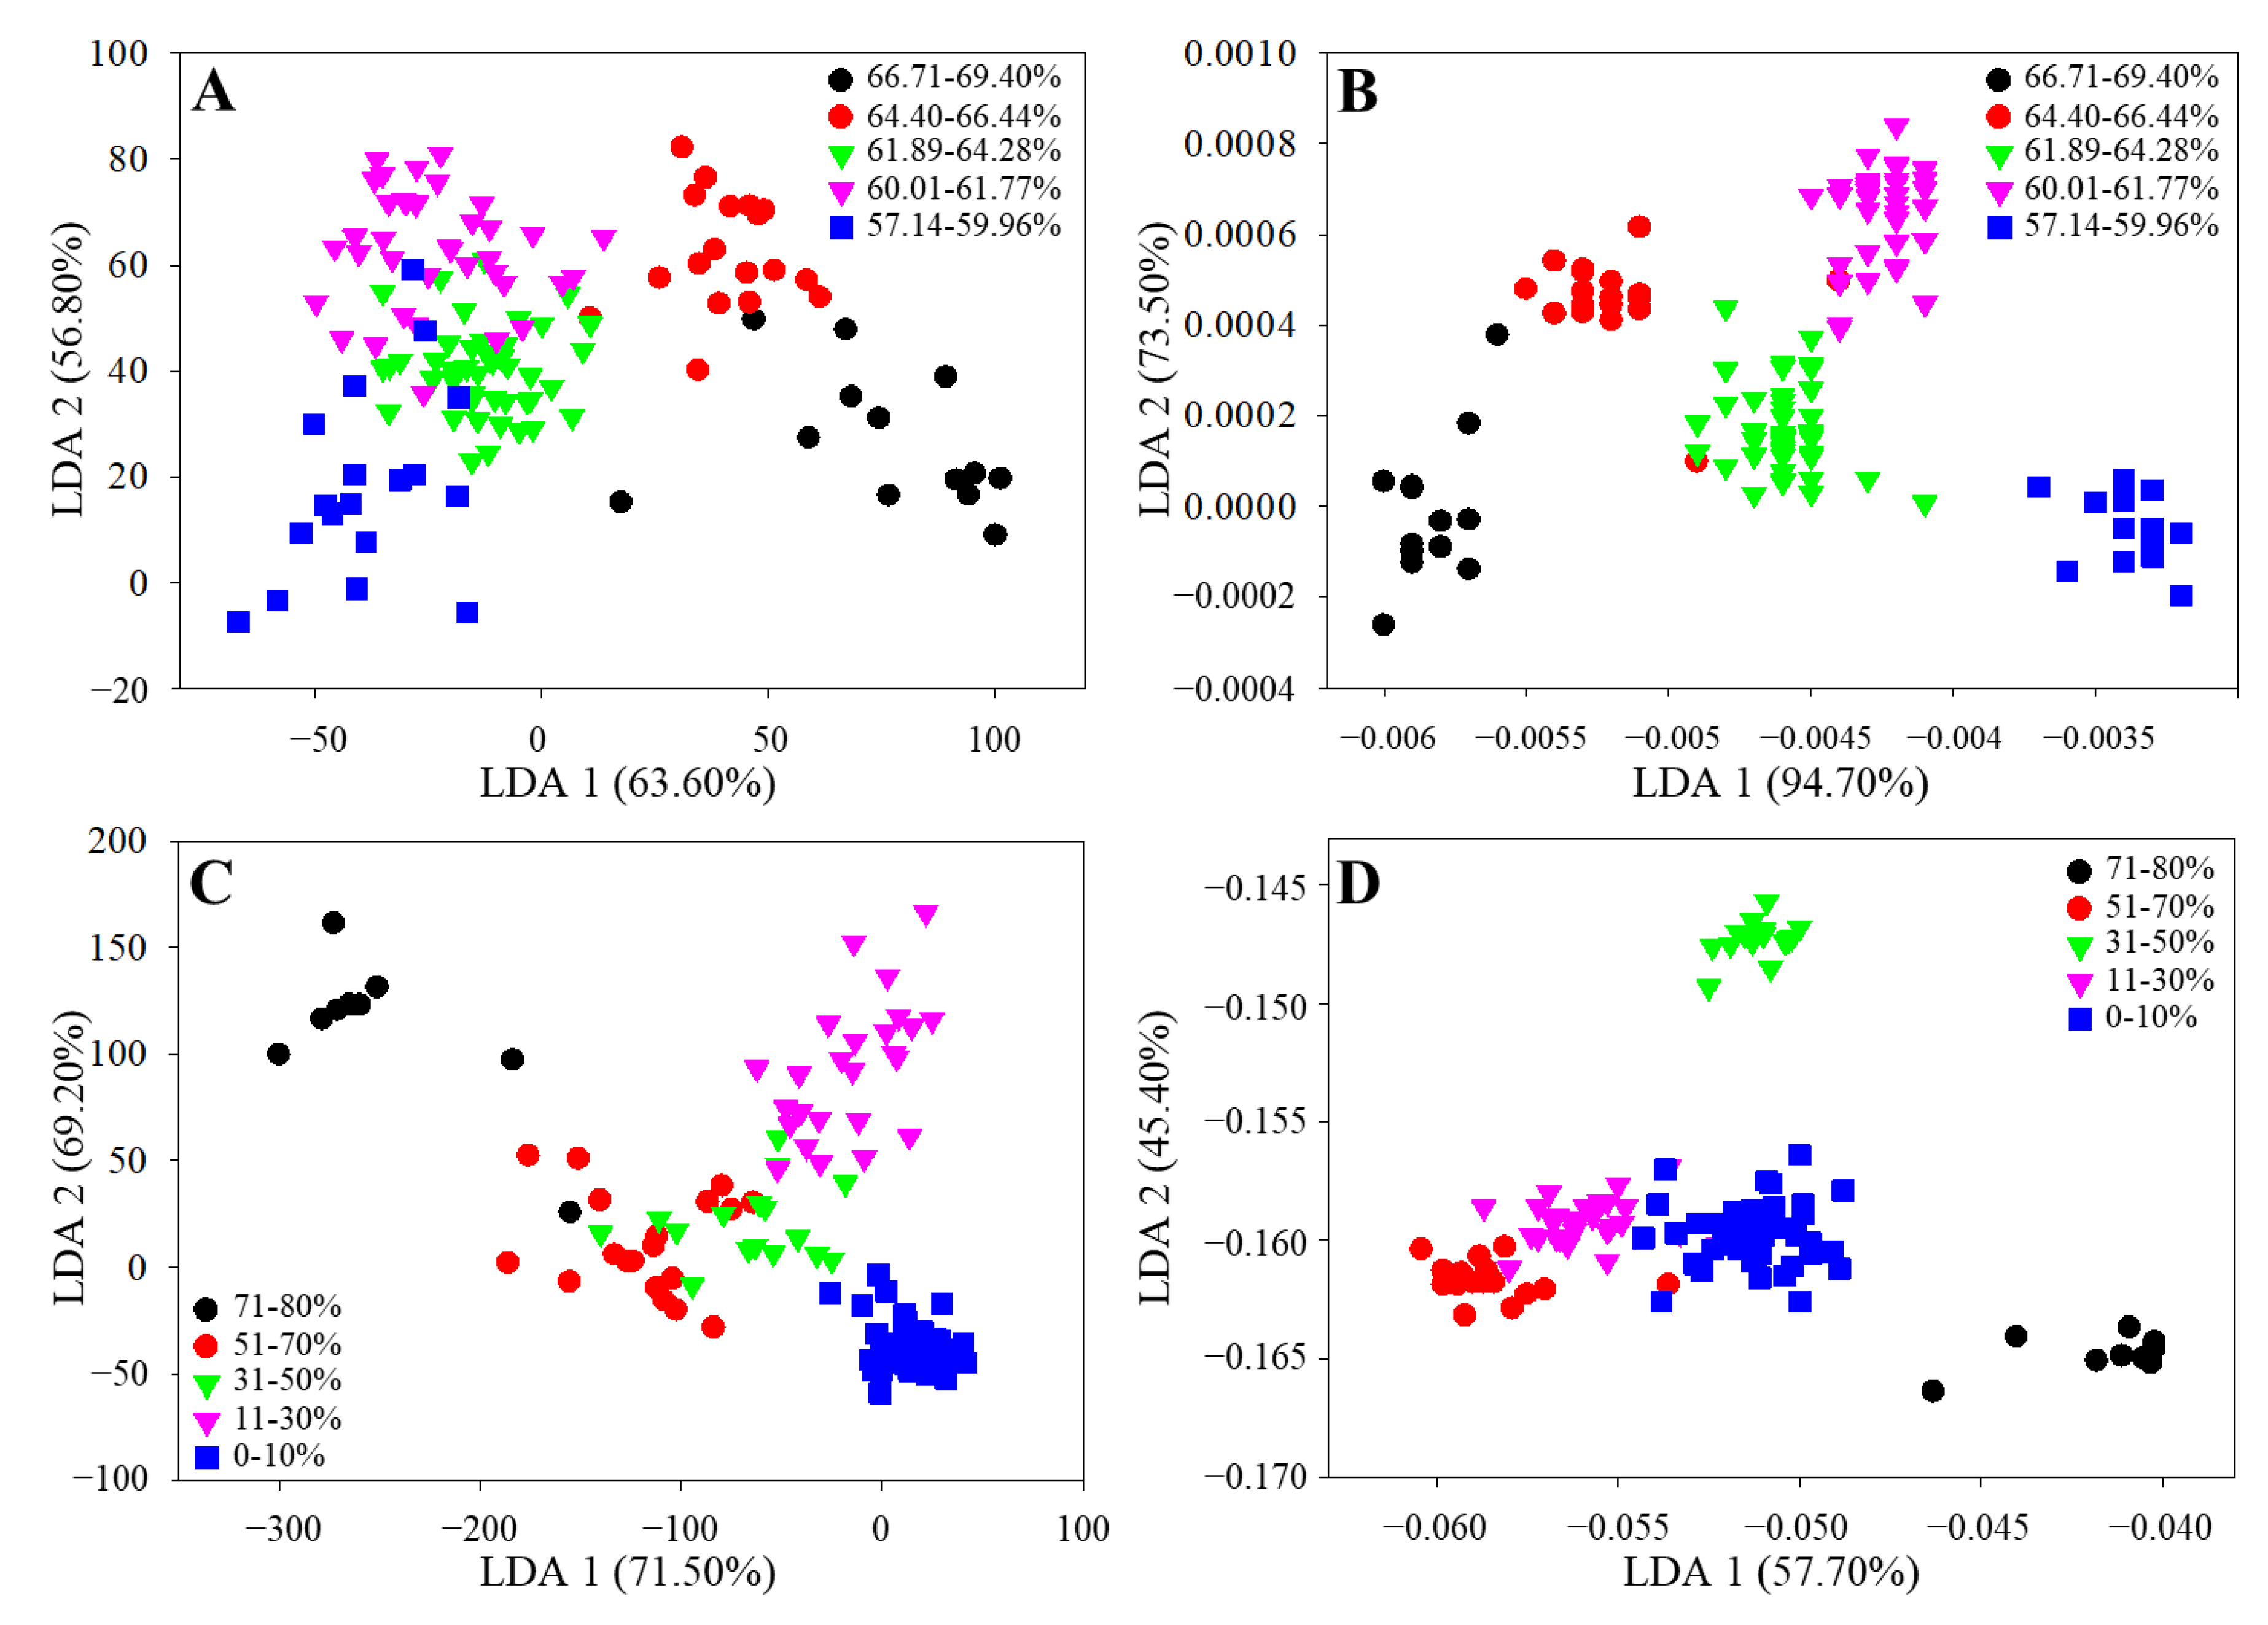
3.2.3. Discrimination of Sweet Potatoes by NIR

LDA was performed to classify the moisture and starch content of sweet potatoes into a qualitative discriminant model (Figure 7). For LDA, the S–G and SNV methods were used to preprocess the NIR spectra for the moisture and starch content, respectively; these were selected as the most robust prediction models. The LDA of the moisture content based on the raw NIR spectrum indicated content classification, but with ambiguous boundaries. After the S–G method was used to preprocess the raw NIR spectrum, it was confirmed through LDA that the content was accurately classified. Likewise, the results of starch content based on the raw NIR spectrum indicated content classification with ambiguous boundaries. The boundary between the 71–80% and 0–10% classes was accurate; however, it was subsequently concluded that these two categories can perform adequate classification. After SNV preprocessing, the LDA results showed that the classification boundaries of the 0–10%, 11–30%, and 51–70% categories were close, although the boundaries of the others were clearly classified. Ding et al. dried and pulverized purple sweet potatoes, and the resulting powder was mixed with white sweet potato flour at specific ratios [48]. The samples were evaluated using NIR spectroscopy, and the mixing ratios of the samples were classified using LDA. Carvalho et al. performed LDA with raw NIR spectra and preprocessed NIR spectra using MSC and S–G methods to distinguish the geographical origin of sugarcane [49]. The accuracy of LDA was higher for the preprocessed spectra compared to that of the raw spectrum. These observations agree with the results of this study.

4. Conclusions

For the industrial use of sweet potatoes, a suitable nondestructive NIR method was developed. The internal quality, including moisture content, starch content, and α-amylase activity, was measured during the storage period after harvesting. It was confirmed that, except for α-amylase activity, the internal quality can be predicted using PLS. The selection of suitable sweet potatoes for paste preparation was accomplished using LDA after acquiring the NIR spectra. This study confirms that the NIR spectra of sweet potatoes can be obtained inline. The NIR apparatus is already manufactured to be inline ready, and the technology for prediction and classification via PLS or LDA models can be applied inline after further study in the near future.

Supplementary Materials

The following are available online at https://www.mdpi.com/2077-0472/11/2/135/s1, Table S1: Changes in internal quality in terms of moisture, starch, and α-amylase content of sweet potatoes during storage; Figure S1: (A) Regression plot and (B) regression coefficient plot of partial least squares (PLS) modeling about calibration and prediction set for raw spectrum and moisture content of sweet potatoes; Figure S2: (A) Regression plot and (B) regression coefficient plot of PLS modeling about calibration and prediction set for raw spectrum and starch content of sweet potatoes; Figure S3: (A) Regression plot and (B) regression coefficient plot of PLS modeling about calibration and prediction set for Savitzky-Golay (S-G) preprocessed spectrum and moisture content of sweet potatoes; Figure S4: (A) Regression plot and (B) regression coefficient plot of PLS modeling about calibration and prediction set for S-G preprocessed spectrum and starch content of sweet potatoes; Figure S5: (A) Regression plot and (B) regression coefficient plot of PLS modeling about calibration and prediction set for standard normal variate (SNV) preprocessed spectrum and moisture content of sweet potatoes; Figure S6: (A) Regression plot and (B) regression coefficient plot of PLS modeling about calibration and prediction set for SNV preprocessed spectrum and starch content of sweet potatoes; Figure S7: (A) Regression plot and (B) regression coefficient plot of PLS modeling about calibration and prediction set for multiplicative scattering correction (MSC) preprocessed spectrum and moisture content of sweet potatoes; Figure S8: (A) Regression plot and (B) regression coefficient plot of PLS modeling about calibration and prediction set for MSC preprocessed spectrum and starch content of sweet potatoes.

Author Contributions

Conceptualization, D.-S.K. and H.-J.S.; methodology, D.-S.K. and M.-H.C.; software, D.-S.K.; validation, D.-S.K. and H.-J.S.; formal analysis, D.-S.K.; investigation, D.-S.K. and M.-H.C.; resources, D.-S.K. and M.-H.C.; data curation, D.-S.K.; writing—original draft preparation, D.-S.K.; writing—review and editing, D.-S.K. and H.-J.S.; visualization, D.-S.K.; supervision, H.-J.S.; project administration, H.-J.S.; funding acquisition, H.-J.S. All authors have read and agreed to the published version of the manuscript.

Funding

This research was funded by the Korea Institute of Planning and Evaluation for Technology in Food, Agriculture and Forestry (IPET) through the Livestock Products Safety Flow Management Technology Development Program, funded by the Ministry of Agriculture, Food, and Rural Affairs (MAFRA) (318101–2).

Institutional Review Board Statement

Not applicable.

Informed Consent Statement

Not applicable.

Data Availability Statement

The data presented in this study are available on request from the corresponding author.

Acknowledgments

The authors are grateful to Hansung Engineering for providing the equipment.

Conflicts of Interest

The authors declare no conflict of interest.

References

  1. Mohanraj, R.; Sivasankar, S. Sweet Potato (Ipomoea batatas [L.] Lam)-A valuable medicinal food: A review. J. Med. Food 2014, 17, 733–741. [Google Scholar] [CrossRef]
  2. Antial, B.S.; Akpanz, E.J.; Okonl, P.A.; Umorenl, I.U. Nutritive and anti-nutritive evaluation of sweet potatoes. Pak. J. Nutr. 2006, 5, 166–168. [Google Scholar] [CrossRef]
  3. Cartier, A.; Woods, J.; Sismour, E.; Allen, J.; Ford, E.; Githinji, L.; Xu, Y. Physiochemical, nutritional and antioxidant proper-ties of fourteen Virginia-grown sweet potato varieties. J. Food Meas. Charact. 2017, 11, 1333–1341. [Google Scholar] [CrossRef]
  4. Truong, V.D.; Avula, R.Y.; Pecota, K.V.; Yencho, G.C. Sweetpotato production, processing, and nutritional quality. In Handbook of Vegetables and Vegetable Processing, 2nd ed.; Siddiq, M., Uebersax, M.A., Eds.; Wiley: New York, NY, USA, 2018; Volume 2, pp. 811–838. [Google Scholar]
  5. Bovell-Benjamin, A.C. Sweet Potato: A Review of its Past, Present, and Future Role in Human Nutrition. Adv. Food Nutr. Res. 2007, 52, 1–59. [Google Scholar] [CrossRef]
  6. Zhang, H.; Patel, J.; Bhunia, K.; Al-Ghamdi, S.; Sonar, C.R.; Ross, C.F.; Tang, J.; Sablani, S. Color, vitamin C, β-carotene and sensory quality retention in microwave-assisted thermally sterilized sweet potato puree: Effects of polymeric package gas barrier during storage. Food Packag. Shelf Life 2019, 21, 100324. [Google Scholar] [CrossRef]
  7. Nath, P.; Kale, S.J.; Chauhan, O.P.; Gupta, R.K. High Pressure Processing Induced Changes in Bioactive Compounds, Antioxidant Activity, Microbial Safety and Color Attributes of Coriander Paste. Agric. Res. 2016, 5, 182–192. [Google Scholar] [CrossRef]
  8. Renu, R.; Chidanand, D.V. Internal quality classification of agricultural produce using non-destructive image processing technologies (soft X-ray). Int. J. Latest Trends Eng. Technol. 2013, 2, 535–543. [Google Scholar]
  9. Kushman, L.J.; Wright, F.S. Sweetpotato storage. In Agriculture Handbook; Agricultural Research Service, US Department of Agriculture: Washington, DC, USA, 1969; Volume 358, pp. 1–12. [Google Scholar]
  10. Jeong, B.C.; Ahn, Y.S.; Chung, M.N.; Lee, J.S.; Oh, Y.H. Current status and prospect of quality evaluation in sweetpotato. Korean J. Crop Sci. 2002, 47, 124–134. [Google Scholar]
  11. Tomlins, K.; Ndunguru, G.; Rwiza, E.; Westby, J. Influence of pre-harvest curing and mechanical injury on the quality and shelf-life of sweet potato (Ipomoea batatas (L.) Lam) in East Africa. J. Hortic. Sci. Biotechnol. 2002, 77, 399–403. [Google Scholar] [CrossRef]
  12. Nabubuya, A.; Namutebi, A.; Byaruhanga, Y.; Narvhus, J.; Wicklund, T. Influence of development, postharvest handling, and storage conditions on the carbohydrate components of sweetpotato (Ipomea batatas Lam.) roots. Food Sci. Nutr. 2017, 5, 1088–1097. [Google Scholar] [CrossRef] [Green Version]
  13. Aranguren, M.; Castellón, A.; Aizpurua, A. Crop sensor based non-destructive estimation of nitrogen nutritional status, yield, and grain protein content in wheat. Agriculture 2020, 10, 148. [Google Scholar] [CrossRef]
  14. Nicolaï, B.M.; Beullens, K.; Bobelyn, E.; Peirs, A.; Saeys, W.; Theron, K.I.; Lammertyn, J. Nondestructive measurement of fruit and vegetable quality by means of NIR spectroscopy: A review. Postharvest Biol. Technol. 2007, 46, 99–118. [Google Scholar] [CrossRef]
  15. Cozzolino, D.; Porker, K.; Laws, M. An Overview on the Use of Infrared Sensors for in Field, Proximal and at Harvest Monitoring of Cereal Crops. Agriculture 2015, 5, 713–722. [Google Scholar] [CrossRef] [Green Version]
  16. Xie, L.; Wang, A.; Xu, H.; Fu, X.; Ying, Y. Applications of Near-Infrared Systems for Quality Evaluation of Fruits: A Review. Trans. ASABE 2016, 59, 399–419. [Google Scholar] [CrossRef]
  17. Katayama, K.; Komaki, K.; Tamiya, S. Prediction of starch, moisture, and sugar in sweet potato by near infrared transmittance. HortScience 1996, 31, 1003–1006. [Google Scholar] [CrossRef] [Green Version]
  18. Iwase, J.; Sato, Y.; Comparini, D.; Masi, E.; Mancuso, S.; Kawano, T. Non-invasive acoustic sensing of tuberous roots of sweet potato (Ipomoea batatas) growing belowground. Hortscience 2015, 29, 176–180. [Google Scholar]
  19. Chen, J.Y.; Zhang, H.; Miao, Y.; Asakura, M. Nondestructive Determination of Sugar Content in Potato Tubers Using Visible and Near Infrared Spectroscopy. Jpn. J. Food Eng. 2010, 11, 59–64. [Google Scholar] [CrossRef]
  20. Camps, C.; Camps, Z.-N. Optimized Prediction of Reducing Sugars and Dry Matter of Potato Frying by FT-NIR Spectroscopy on Peeled Tubers. Molculers 2019, 24, 967. [Google Scholar] [CrossRef] [Green Version]
  21. Han, Y.-F.; Lv, C.-X.; Yuan, Y.-W.; Yang, B.-N.; Zhao, Q.-L.; Cao, Y.-F. Non-destructive Detection of Blackheart Potatoes Based on Energy Spectrum of VIS/NIR Transmittance. IOP Conf. Ser. Earth Environ. Sci. 2020, 512, 012060. [Google Scholar] [CrossRef]
  22. Rady, A.M.; Guyer, D.E. Rapid and/or nondestructive quality evaluation methods for potatoes: A review. Comput. Electron. Agric. 2015, 117, 31–48. [Google Scholar] [CrossRef]
  23. Rady, A.M.; Guyer, D.E. Evaluation of sugar content in potatoes using NIR reflectance and wavelength selection techniques. Postharvest Biol. Technol. 2015, 103, 17–26. [Google Scholar] [CrossRef]
  24. Roggo, Y.; Chalus, P.; Maurer, L.; Lema-Martinez, C.; Edmond, A.; Jent, N. A review of near infrared spectroscopy and chemometrics in pharmaceutical technologies. J. Pharm. Biomed. Anal. 2007, 44, 683–700. [Google Scholar] [CrossRef] [PubMed]
  25. Ali, M.M.; Hashim, N.; Aziz, S.A.; Lasekan, O. Emerging non-destructive thermal imaging technique coupled with chemometrics on quality and safety inspection in food and agriculture. Trends Food Sci. Technol. 2020, 105, 176–185. [Google Scholar] [CrossRef]
  26. Gislum, R.; Nikneshan, P.; Shrestha, S.; Tadayyon, A.; Deleuran, L.C.; Boelt, B. Characterisation of Castor (Ricinus communis L.) Seed Quality Using Fourier Transform Near-Infrared Spectroscopy in Combination with Multivariate Data Analysis. Agriculture 2018, 8, 59. [Google Scholar] [CrossRef] [Green Version]
  27. Liang, Y.Z.; Kvalheim, O.M. Robust methods for multivariate analysis—A tutorial review. Chemom. Intell. Lab. Syst. 1996, 32, 1–10. [Google Scholar] [CrossRef]
  28. Jiménez-Carvelo, A.M.; González-Casado, A.; Bagur-González, M.G.; Cuadros-Rodríguez, L. Alternative data min-ing/machine learning methods for the analytical evaluation of food quality and authenticity–A review. Food Res. Int. 2019, 122, 25–39. [Google Scholar] [CrossRef]
  29. Ai, J.; Witt, T.; Cowin, G.; Dhital, S.; Turner, M.S.; Stokes, J.R.; Gidley, M.J. Anti-staling of high-moisture starchy food: Effect of hydrocolloids, emulsifiers and enzymes on mechanics of steamed-rice cakes. Food Hydrocoll. 2018, 83, 454–464. [Google Scholar] [CrossRef] [Green Version]
  30. Miller, G.L. Use of Dinitrosalicylic Acid Reagent for Determination of Reducing Sugar. Anal. Chem. 1959, 31, 426–428. [Google Scholar] [CrossRef]
  31. Rinnan, Å.; Van Den Berg, F.; Engelsen, S.B. Review of the most common pre-processing techniques for near-infrared spectra. Trac-Trends Anal. Chem. 2009, 28, 1201–1222. [Google Scholar] [CrossRef]
  32. Zimmermann, B.; Kohler, A. Optimizing Savitzky–Golay Parameters for Improving Spectral Resolution and Quantification in Infrared Spectroscopy. Appl. Spectrosc. 2013, 67, 892–902. [Google Scholar] [CrossRef] [Green Version]
  33. Chen, L.J.; Xing, L.; Han, L.J. Influence of data preprocessing on the quantitative determination of nutrient content in poultry manure by near infrared spectroscopy. J. Environ. Qual. 2010, 39, 1841–1847. [Google Scholar] [CrossRef]
  34. Wold, S.; Sjöström, M.; Eriksson, L. PLS-regression: A basic tool of chemometrics. Chemom. Intell. Lab. Syst. 2001, 58, 109–130. [Google Scholar] [CrossRef]
  35. da Costa, N.L.; da Costa, M.S.; Barbosa, R. A Review on the application of chemometrics and machine learning algorithms to evaluate beer authentication. Food Anal. Meth. 2021, 14, 136–155. [Google Scholar] [CrossRef]
  36. Coûteaux, M.M.; Sarmiento, L.; Herve´, D.; Acevedo, D. Determination of water-soluble and total extractable polyphenolics in biomass, necromass and decomposing plant material using near-infrared reflectance spectroscopy (NIRS). Soil Biol. Biochem. 2005, 37, 795–799. [Google Scholar] [CrossRef] [Green Version]
  37. Alves, A.; Santos, A.; Rozenberg, P.; Pâques, L.E.; Charpentier, J.P.; Schwanninger, M.; Rodrigues, J. A common near infra-red—based partial least squares regression model for the prediction of wood density of Pinus pinaster and Larix × eurolepis. Wood Sci. Technol. 2012, 46, 157–175. [Google Scholar] [CrossRef]
  38. D’Acqui, L.P.; Pucci, A.; Janik, L.J. Soil properties prediction of western Mediterranean islands with similar climatic environments by means of mid-infrared diffuse reflectance spectroscopy. Eur. J. Soil Sci. 2010, 61, 865–876. [Google Scholar] [CrossRef]
  39. Gad, H.; El-Ahmady, S.H.; Abou-Shoer, M.I.; Al-Azizi, M.M. Application of Chemometrics in Authentication of Herbal Medicines: A Review. Phytochem. Anal. 2012, 24, 1–24. [Google Scholar] [CrossRef]
  40. Nabubuya, A.; Namutebi, A.; Byaruhanga, Y.B.; Narvhus, J.; Stenstrøm, Y.; Wicklund, T.; Nabubuya, A.; Yusuf, B.; Judith, N.; Yngve, S.; et al. Amylolytic Activity in Selected Sweetpotato (Ipomoea batatas Lam) Varieties during Development and in Storage. Food Nutr. Sci. 2012, 3, 660–668. [Google Scholar] [CrossRef] [Green Version]
  41. Hagenimana, V.; Vezina, L.P.; Simard, R.E. Distribution of amylases within sweet potato (Ipomoea batatas L.) root tissue. J. Agric. Food Chem. 1992, 40, 1777–1783. [Google Scholar] [CrossRef]
  42. Sarikaya, E.; Higasa, T.; Adachi, M.; Mikami, B. Comparison of degradation abilities of α-and β-amylases on raw starch granules. Process Biochem. 2000, 35, 711–715. [Google Scholar] [CrossRef]
  43. Luck, W.A.P. Infrared overtone region. In Structure of Water and Aqueous Solutions; Luck, W.A.P., Ed.; Weinheim Verlag Chemie: Weinheim, Germany, 1974; pp. 248–284. [Google Scholar]
  44. Büning-Pfaue, H. Analysis of water in food by near infrared spectroscopy. Food Chem. 2003, 82, 107–115. [Google Scholar] [CrossRef]
  45. Osborne, B.G. Near-infrared spectroscopy in food analysis. In Encyclopedia of Analytical Chemistry: Applications, Theory and Instrumentation, 1st ed.; Meyers, R.A., Ed.; Wiley: New York, NY, USA, 2006; Volume 1, pp. 1–14. [Google Scholar]
  46. Farhadi, R.; Afkari-Sayyah, A.H.; Jamshidi, B.; Gorji, A.M. Prediction of internal compositions change in potato during storage using visible/near-infrared (Vis/NIR) spectroscopy. Int. J. Food Eng. 2020, 16. [Google Scholar] [CrossRef]
  47. Lu, G.; Huang, H.; Zhang, D. Prediction of sweetpotato starch physiochemical quality and pasting properties using near-infrared reflectance spectroscopy. Food Chem. 2006, 94, 632–639. [Google Scholar] [CrossRef]
  48. Ding, X.; Ni, Y.; Kokot, S. NIR spectroscopy and chemometrics for the discrimination of pure, powdered, purple sweet po-tatoes and their samples adulterated with the white sweet potato flour. Chemom. Intell. Lab. Syst. 2015, 144, 17–23. [Google Scholar] [CrossRef]
  49. De Carvalho, L.C.; Morais, C.L.M.; De Lima, K.M.G.; Junior, L.C.C.; Nascimento, P.; De Faria, J.B.; Teixeira, G.H.D.A. Determination of the geographical origin and ethanol content of Brazilian sugarcane spirit using near-infrared spectroscopy coupled with discriminant analysis. Anal. Methods 2016, 8, 5658–5666. [Google Scholar] [CrossRef]
Figure 1. Setting of (A) laboratory experimental device and (B) industrial device for measuring NIR spectra of sweet potato. 1, NIR light source; 2, sweet potato (sample); 3, sample holder; 4, detector; and 5, conveyor belt.
Agriculture 11 00135 g001
Figure 2. Schematic of NIR spectrum analysis applied to develop the prediction model using classification and regression of the internal quality of sweet potatoes (LDA: linear discriminant analysis, PLS: Partial least squares).
Agriculture 11 00135 g002
Figure 3. Changes in internal quality in terms of (A) moisture, (B) starch, and (C) α-amylase content of sweet potatoes during storage (p < 0.05) he data were analyzed using analysis of variance (ANOVA) followed by Duncan’s multiple range test (p <0.05) using SPSS software (SPSS, Chicago, IL, USA). The different letters (a, b, c, d, e) describe great differences for each internal quality.
Agriculture 11 00135 g003
Figure 4. (A) Cross-section of baked sweet potato completely decomposed by amylase, and (B) cross-section of baked sweet potato with starch, owing to incomplete starch degradation.
Agriculture 11 00135 g004
Figure 5. (A) NIR raw spectrum. Preprocessed spectrum captured through (B) Savitzky–Golay derivative (S–G), (C) standard normal variate (SNV), and (D) multiplicative scattering correction (MSC) for the sweet potatoes.
Agriculture 11 00135 g005
Figure 6. NIR raw spectrum of sweet potatoes with low moisture content (legend shows moisture content of sweet potatoes).
Agriculture 11 00135 g006
Figure 7. Linear discriminant analysis results for internal quality of sweet potatoes based on moisture ((A) analysis by raw spectrum and (B) Savitzky–Golay derivative (S–G) preprocessed spectrum) and starch content ((C) analysis based on raw spectrum and (D) standard normal variate (SNV) preprocessed spectrum).
Agriculture 11 00135 g007
Table 1. Calibration, cross-validation, and prediction results of PLS model for assessing internal quality of sweet potatoes.
Quality ParametersLVsCalibrationCross-ValidationPredictionRMSEP/
RMSECV
RPD
RC2RMSECRCV2RMSECVRP2RMSEP
Raw spectrum
Moisture30.58931.55080.56981.60270.65331.67061.04241.3258
Starch30.582516.61090.553817.34730.460717.91011.03241.0211
Savitzky–Golay derivative
Moisture70.78781.11470.69201.35200.80311.25900.93122.1655
Starch40.730313.35090.689614.41220.646214.50691.00661.6605
SNV
Moisture80.77151.15680.69191.35510.80471.25390.92532.0036
Starch90.832010.53830.768812.58900.772211.64180.92482.1288
MSC
Moisture70.75311.20240.71751.40210.80651.24800.89012.0136
Starch80.773412.23850.678414.80120.781111.41150.77102.1749
LV: Latent variable; RC2: Correlation coefficient of calibration; RMSEC: Root mean square errors of calibration; RCV2: Correlation coefficient of cross-validation; RMSECV: Root mean square error of cross-validation; RP2: Correlation coefficient of prediction; RMSEP: Root mean square errors of prediction; RPD: Residual prediction deviation.
Publisher’s Note: MDPI stays neutral with regard to jurisdictional claims in published maps and institutional affiliations.

