Article

Quantitative Evaluation of Macro-Nutrient Uptake by Cassava in a Tropical Savanna Climate

1
Department of Agronomy, Faculty of Agriculture, Khon Kaen University, Khon Kaen 40002, Thailand
2
Department of Biology, Faculty of Science, Khon Kaen University, Khon Kaen 40002, Thailand
3
Crop Genetics and Breeding Research Unit, USDA-ARS, Tifton, GA 31793, USA
4
Department of Crop & Soil Sciences, University of Georgia, Tifton, GA 31793, USA
*
Author to whom correspondence should be addressed.
Agriculture 2021, 11(12), 1199; https://doi.org/10.3390/agriculture11121199
Submission received: 22 October 2021 / Revised: 22 November 2021 / Accepted: 25 November 2021 / Published: 28 November 2021

Abstract

:
Matching fertilization with crop needs is important for maximizing yields and reducing fertilizer losses. Seasonal variation in nutrient uptake dynamics is poorly understood and thus, the ability to optimize fertilization strategies is limited. This study aims to investigate the effects of planting dates on macronutrient uptake dynamics in cassava genotypes with full irrigation. The performance of cassava genotypes, i.e., CMR38-125-77, Kasetsart 50 and Rayong 11, were evaluated in the early rainy (ERS) and post rainy seasons (PRS) for two years using a randomized complete block design with four replicates. The plants were harvested at 1, 3, 6, 9 and 12 months. Planting dates had significant effects on the accumulation of dry matter and storage roots as well as nutrient uptakes and partitioning. On average, the total nutrient uptake per plant to produce 2831–3279 g of biomass with 1244–1810 g of storage roots in the ERS varied among cassava genotypes, ranging from 21.1–24.3 g N, 5.1–5.9 g P, 26.5–29.5 g K, 14.1–22.2 g Ca, 6.1–7.6 g Mg and 2.0–2.3 g S. The total nutrient uptake per plant to produce 3353–3824 g of biomass with 1604–2253 g of storage roots in the PRS ranged from 27.1–32.4 g N, 5.2–6.0 g P, 29.1–31.3 g K, 11.9–20.3 g Ca, 7.3–9.9 g Mg and 1.2–1.5 g S. In the ERS, the majority of the total nutrient uptake occurred at the early growth stages, whereas in the PRS, this occurred at the mid- to late growth stages. At final harvest, the percentages of nutrient removal by the storage roots for ERS were 24.7–36.0% N, 26.0–32.3% P, 43.4–51.5% K, 12.4–17.6% Ca, 22.2–31.5% Mg and 27.2–31.5% S, whereas in the PRS the percentages were 30.4–44.4% N, 33.3–41.6% P, 44.7–57.3% K, 12.0–15.1% Ca, 20.2–28.1% Mg and 12.0–25.4% S. CMR38-125-77 exhibited satisfactory performance in nutrient uptake, nutrient use efficiency and storage roots yield across the planting dates. The evidence obtained from this study would greatly facilitate more efficient adoption of precision agriculture in cassava production by applying recommended fertilizers, e.g., rates, kinds and timings, according to crop demand in each growing season in Thailand and for choosing superior cassava genotypes.

1. Introduction

Cassava (Manihot esculenta), a starchy tropical root crop, is rising as a fully commercial crop and entering a diversified market since its starch can be used in several industries such as food, feed and as a material source for ethanol production [1]. Thailand is the world’s largest exporter of cassava products, accounting for about 68% of worldwide exports [2]. Regrettably, the present average yield of cassava in a farmer’s field in Thailand of approximately 20 t ha−1 is only 40% of its yield potential [2]. This high yield gap between the farmer’s field and potential yield is caused, in part, by poor crop management and unbalanced nutrient application. To minimize this yield gap, the adoption of technologies for appropriate crop management is required, and it is becoming more common to assist farmers with better precision in planning for management decisions to achieve maximum yield potential and quality.
There are two normal growing seasons for cassava cultivation: i.e., early rainy season (ERS) (April–June) and post rainy season (PRS) (October–November). In Thailand, cassava is planted mainly in the ERS, accounting for about 70% of the total planted areas, and planting cassava in the PRS accounts for about 30% [3]. Significant differences among planting dates in crop development, production of biomass and yields as well as the physiological traits of cassava have been observed since they are different in photoperiod, temperatures, solar radiation, and amount and distribution of rainfall [4,5,6,7,8,9]. In addition, a changing climate has the potential to alter the soil abiotic processes, thereby changing the nutrient availability in the soil and, thus, directly affecting the plant growth [10]. Generally, cassava requires high solar radiation and high relative air humidity (RH) for efficient photosynthesis [11]. Solar radiation and RH cause the opening of stomata and high transpiration, resulting in the high uptake of water and mineral nutrients by plants [12]. In other crops, Fageria et al. [13] reported that low solar radiation reduced growth, N fixation and nutrient uptake of legume crops. A short photoperiod (8 h) increased K, P, Mn, Fe and Cu uptake in photoperiod-sensitive varieties of pea (Pisum sativum) [14]. An increase in air temperature of 2 °C above the natural air temperature increased the contents of N, P and K in shoots of rice at maturity by 3.4–7.4% [15]. In tomato, high RH increased the amount of nutrient uptake per plant [16].
Although we know that the growth, development, yields and physiological traits of crops are affected by climatic factors, the current nutrient recommendation for cassava is mostly based on crop-specific needs for achieving expected yields and soil-specific nutrient supply characteristics. However, differences in plant nutrient uptake, yield, genotypes and planting dates are not considered in these recommendations. This amount of added nutrients may not be appropriate for specific planting dates or when new varieties are released. Decisions associated with when and what fertilizer to apply could be driven by crop nutrient uptake and be optimized to maximize yield under different planting dates.
There are two different starch bulking periods of cassava, including late and early bulking periods. Late bulking cultivars are usually planted in highlands, whereas early bulking cultivars are commonly planted in lowlands in rotation with other crops [1]. Unfortunately, study on the response of cassava genotypes to different planting dates on the accumulation dynamics of nutrient uptake and its distribution is limited. This information can provide basic knowledge on the nutrient recommendations of cassava, which should be made based on plant nutrient uptakes in specific genotypes, growing conditions and growth stages. With this in mind, the biggest challenge is to integrate that information to answer the questions that would facilitate more efficient adoption of precision agriculture for cassava production for increasing yield per area and farmer’s profit and reducing nutrient losses to the environment.
To the best of our knowledge, in cassava, the nutrient concentrations are quite different between plant tissues and growth phases. In rainfed crops, most nutrients initially accumulate in the leaves and stems and translocate to storage roots in the late parts of the growth cycle [17,18]. Nutrient removal from the soil by the storage roots at the 12-month growth period of the rainfed crops was in the descending order of N, K, Ca, P, Mg, S, Fe, Mn, Zn, Cu and B [17,18,19].
Although the uptake and distribution of nutrient elements in cassava rainfed crops has previously been documented by Howeler and Cadavid [18], no recent and comprehensive information exists on the patterns of nutrient uptake and its distribution of cassava genotypes with differences in starch bulking periods at different growth stages under full irrigation, particularly in different planting dates. Therefore, this study aims to quantify nutrient uptakes, partitioning and removal from the soil after the harvest of three cassava genotypes with different starch bulking periods, at different growth stages, grown in different planting dates under irrigated conditions. A better understanding of the nutrient uptake dynamics of cassava planted in different planting dates may provide basic information to support decision-making for improving fertilizer guidelines, especially in the northeast part of Thailand. Moreover, information regarding the variation in the nutrient uptake and yield among cassava genotypes will also provide an opportunity for cassava breeding programs to enhance nutrient use efficiency.

2. Materials and Methods

2.1. Plant Materials and Experimental Details

The field study was carried out under irrigated conditions at the Agronomy Department, Khon Kaen University, Thailand (16°28′ N, 102°48′ E, 200 m above sea level). In this study, soil samples in each planting date were randomly taken prior to planting (after improving the soil quality rate by applying 6250 kg of cattle manure) and after harvesting at the depth 0–30 and 30–60 cm to determine the physical and chemical properties, following the appropriate methods presented in Table 1.
Three cassava genotypes with different starch bulking times consisting of one elite line, namely CMR38-125-77 (early-bulking), and two commercial varieties, namely, Kasetsart 50 (mid-bulking) and Rayong 11 (late-bulking), which are hereinafter referred to as ‘CMR’, ‘KU50’ and ‘RY11’, respectively, were used in this study. The performance of the cassava genotypes was evaluated in a randomized complete block design (RCBD) with four replications for two planting dates, consisting of May (early rainy season: ERS) and November (post rainy season: PRS). The experiment was repeated in two consecutive years (2015 and 2016).
Ploughing was carried out twice using a 3-disk tractor and a 7-disk tractor, followed by harrowing. Soil ridges were raised using a spacing of 1 m between adjacent ridges. Heathy stem cuttings measuring 20 cm in length with the same age were used as planting materials, discarding the base and top of the stem. The stem cuttings were soaked with insecticide, Thiamethoxam (Syngenta crop protection limited, Bangkok, Thailand), for twenty minutes to prevent pest infestation. The cuttings were then incubated under warm and moist conditions for 3 days to stimulate bud germination. Planting was done in a single row by hoeing on the top of the ridges to a depth of approximately 12 cm using within-row spacing of 1 m. The plots consisted of 7 rows in an area of 20 m long and 7 m wide, with 140 plants in each plot.
Since the symptoms of micronutrient deficiencies were observed in both years, foliar applications of 1% ZnSO4·7H2O, 1% MnSO4 and 0.05% CuSO4·5H2O were used at the seedling stage to relieve these deficiencies. Chemical fertilizers were applied to the crop at 1 MAP, based on the nutrient contents of the soil before planting and the nutrient requirements for cassava reported by Howeler [17], to adjust the adequacy of soil nutrients for optimal cassava growth. At 2 MAP, ammonium sulfate ((NH4)2SO4) at 223.18 kg ha−1 and potassium chloride (KCl; 60% K2O) at 93.75 kg ha−1 (Chia tai company limited, Phranakhonsiayutthaya, Thailand) were applied manually to the crops. As the available P was already high based on the soil analysis (Bray II) and cassava nutrient requirements [17], P was not applied in this experiment.
Manual weeding was performed to avoid weed competition during the first 3 MAP, which is considered the critical period for weed interference. Insect pests and diseases were controlled when observed. The soil moisture was measured using a set of tensiometers placed at soil depths of 20 and 40 cm at four sites for each planting date. In order to keep plots well-watered, irrigation was initiated using mini sprinklers when the water tension at 20 cm of soil depth dropped to near −30 kPa, and it was stopped when the water tension at 40 cm of soil depth reached about 0 kPa.

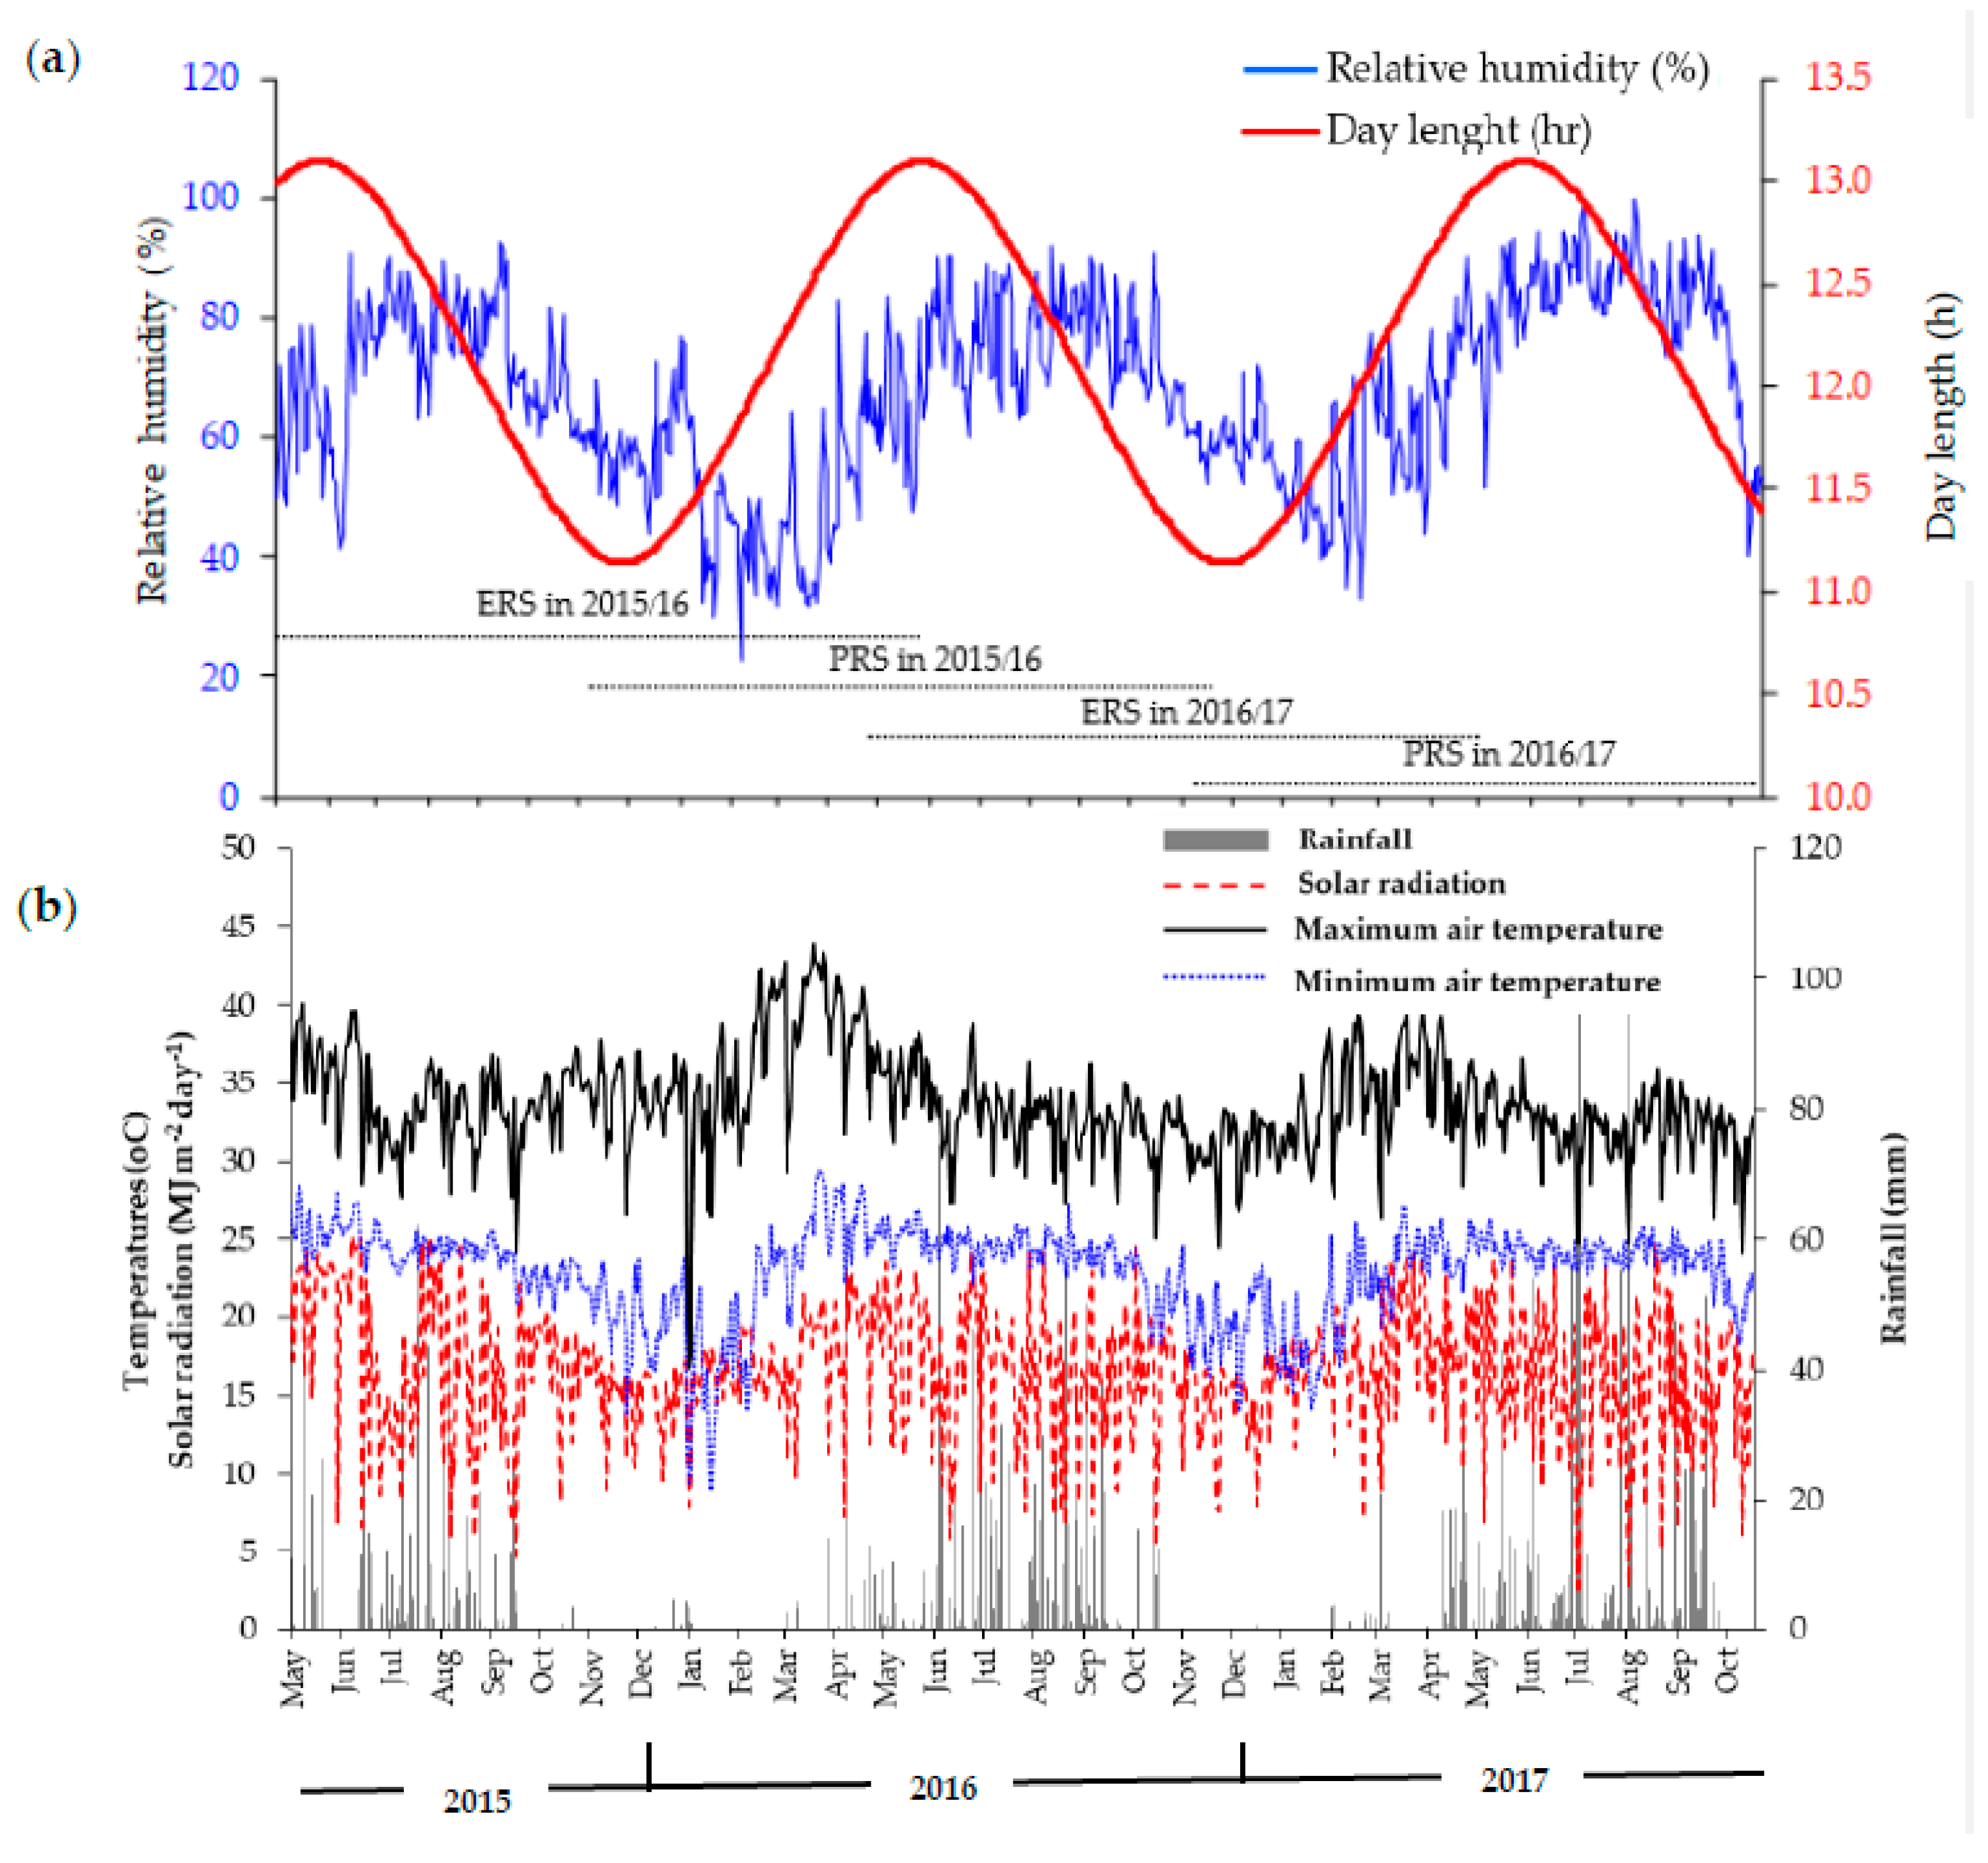
2.2. Description of the Study Site

The soil of the experimental area was classified as a Yasothon series (Yt: fine-loamy; siliceous, isohypothermic, Oxic Paleustults), which is broadly distributed in northeastern Thailand. The soil texture was loamy sand with pH 5.8 to 7.2 (Table 2). The soil physicochemical properties were similar between the two years. On average, at the depth 0–60 cm, the soil of the two planting dates had total N ranging from 0.01 to 0.03%, exchangeable K ranging from 30.7 to 44.9 mg kg−1, exchangeable Mg ranging from 30.0 to 52.3 mg kg−1, organic matter ranging from 0.31 to 0.51% and a cation exchange capacity ranging from 2.8 to 5.6 cmolc kg−1. These physicochemical properties were classified as low and very low contents in the soil compared to the nutrient requirement for cassava, as described by Howeler [17]. The soil used in this experiment had a medium content of exchangeable Ca (255 to 450 mg kg−1), available S (39.5 to 54.8 mg kg−1) and electrical conductivity (0.02 to 0.07 dS m−1), whereas it had high available P (40.7 to 85.6 mg kg−1) for cassava growth [17]. Fortunately, there was not much difference between the soil chemical properties prior to planting and after harvesting (Table 2), indicating that all additional nutrients were adequate for all cassava growth cycles, and the differences in crop performance might be mainly due to climatic factors and genotypes.
The climate in the experimental site is classified as a tropical savanna climate, according to the Köppen classification system. The annual average rainfall for the past 30 years in northeastern Thailand is 1405 mm. In this study, however, the crops were partially irrigated during the rainy season and fully irrigated during the dry season.
The weather conditions obtained from the weather station located in the experimental site (Watchdog 2700, Path computation element group, Meschede, Germany), showed that in 2015/16, the mean daily maximum temperature (T-max) throughout the growing periods in the ERS ranged from 16.4 to 43.9 °C and in the PRS ranged from 16.8 to 43.9 °C, while the mean daily minimum temperature (T-min) in the ERS ranged from 8.9 to 29.5 °C and in the PRS ranged from 8.8 to 29.5 °C (Figure 1). The means of solar radiation ranged from 6.4 to 25.4 MJ m−2 d−1 for the crops planted in the ERS and 5.4 to 24.5 MJ m−2 d−1 for the crops planted in the PRS, while RH ranged from 22.9 to 92.8% and 22.9 to 92.3% for the crops planted in the ERS and the PRS, respectively.
In 2016/17, the mean daily T-max throughout the growing periods in the ERS ranged from 24.5 to 39.8 °C and in the PRS ranged from 24.5 to 39.8 °C, while the mean daily T-min in the ERS ranged from 14.0 to 27.3 °C and in the PRS ranged from 13.9 to 27.2 °C (Figure 1). The means of solar radiation ranged from 5.4 to 24.5 MJ m−2 d−1 for the crops planted in the ERS and 7.7 to 24.8 MJ m−2 d−1 for the crops planted in the PRS, while RH ranged from 33.0 to 92.8% and 33.0 to 99.6% for the crops planted in the ERS and the PRS, respectively.
The climatic factors during the growing periods for each planting date in either year were similar, showing that the crops planted in the ERS faced high temperatures, high solar radiation, high RH and longer day length from planting to 3 MAP. During 3 to 10 MAP, the crops were then subjected to cooler temperatures, lower solar radiation and shorter day length. Conversely, RH during 3 to 10 MAP was high. All climatic factors during 11 to 12 MAP were likely the same as the conditions at planting.
Crops planted in the PRS faced cooler temperatures, lower solar radiation, lower RH, and shorter day length from planting to 4 MAP. The crops then faced higher temperatures, higher solar radiation and longer day length from 4 to 10 MAP; conversely, RH was low until 7 MAP. During the late growth stages, all climatic factors during 11 to 12 MAP were likely the same as those at the beginning of planting.

2.3. Biomass Accumulation and Distribution

For each experimental plot, six plants in the area of 6 m2 were harvested (excluding the border plants) at 1, 3, 6 and 9 MAP, and harvesting was done at 12 MAP from 18 bordered plants per plot in the harvesting area of 18 m2. After uprooting, the plants were portioned into leaves, petioles, stems, storage roots (>3 MAP) and stumps (>6 MAP). Stumps were cut at 20 cm above the soil surface, and the storage roots and stumps were washed in running tap water to remove any adhered soil particles, and then fresh weights of all plant parts were recorded individually with a digital balance. The stumps and stems were ground using a grinder, and the storage roots were cut with a stainless steel knife. Samples of 10% for each plant part were randomly taken and oven-dried at 70 °C till a constant weight was achieved, and the dry weights of each plant part were recorded.

2.4. Sample Preparation and Nutrient Analysis

The dried samples of each plant part were ground using an electronic stainless steel blender. The ground samples were stored in sealable plastic bags in dark and dry conditions until analysis. Small portions of the samples (0.5 to 1 g) were then taken randomly to determine nutrient content using appropriate methods for each nutrient element, as given in Table 1.
The nutrient uptake for each element was calculated individually by multiplying the dry weight of each plant part by its nutrient concentration. All plant parts were then summed to obtain the total nutrient uptake per individual plant and was expressed in g plant–1. The nutrient accumulation rates for four different crop durations, i.e., (i) sprout and leaf development to the beginning of root formation: 1–3 MAP, (ii) maximum growth rates of leaves and stems and storage root development: 3–6 MAP, (iii) high carbohydrate translocation: 6–9 MAP and (iv) storage root development to dormancy: 9–12 MAP [20], were calculated as the change in nutrient accumulation per ground area per unit of time.
The nutrient use efficiency (NUE) for biomass was calculated as the total biomass (g plant−1) divided by the total nutrient uptake of each element (g plant−1), and the NUE for storage roots was calculated as the storage root yield dry weight (g plant−1) divided by the total nutrient uptake (g plant−1) [21]. The percentage of nutrient removal by the storage roots was also calculated by dividing the storage root nutrient uptake by the total nutrient uptake and multiplying it by 100.

2.5. Statistical Analysis

The data recorded in each planting date were subjected to an ANOVA according to a RCBD [22]. The homogeneity of error variance was tested for all parameters and a combined analysis of variance was performed when error variances were homogeneous (pooled analysis over planting dates and years). All statistical analyses were performed using the Statistix 10 software program (Analytical Software, Tallahassee, FL, USA), and the comparison of means was carried out using least significant difference (LSD) at a 5% level of significance. The graphical presentation was performed using Microsoft Excel 2007.

3. Results

3.1. Combined Analysis of Variance

The combined analysis of variance over both planting dates and both years revealed significant differences in the year and planting date in terms of total nutrient uptake for most elements at most growth stages (Supplementary Table S1). The cassava genotypes were also significantly different in terms of the total nutrient uptake for most elements, with the exception of N at 1, 9 and 12 MAP, P at 1 and 3 MAP, K at 3, 6 and 9 MAP, Ca at 3 MAP and S at 3, 9 and 12 MAP. There were no significant interactions between genotype and year (G × Y) for most elements and most growth stages, except for P at 3 MAP, Ca at 1 MAP, Mg at 9 MAP and S at 6 MAP. Significant interactions were observed for the genotype and planting date (G × D) during crop development, especially during 3–9 MAP for all elements. Therefore, the means were combined across years and analyzed in separate planting dates.

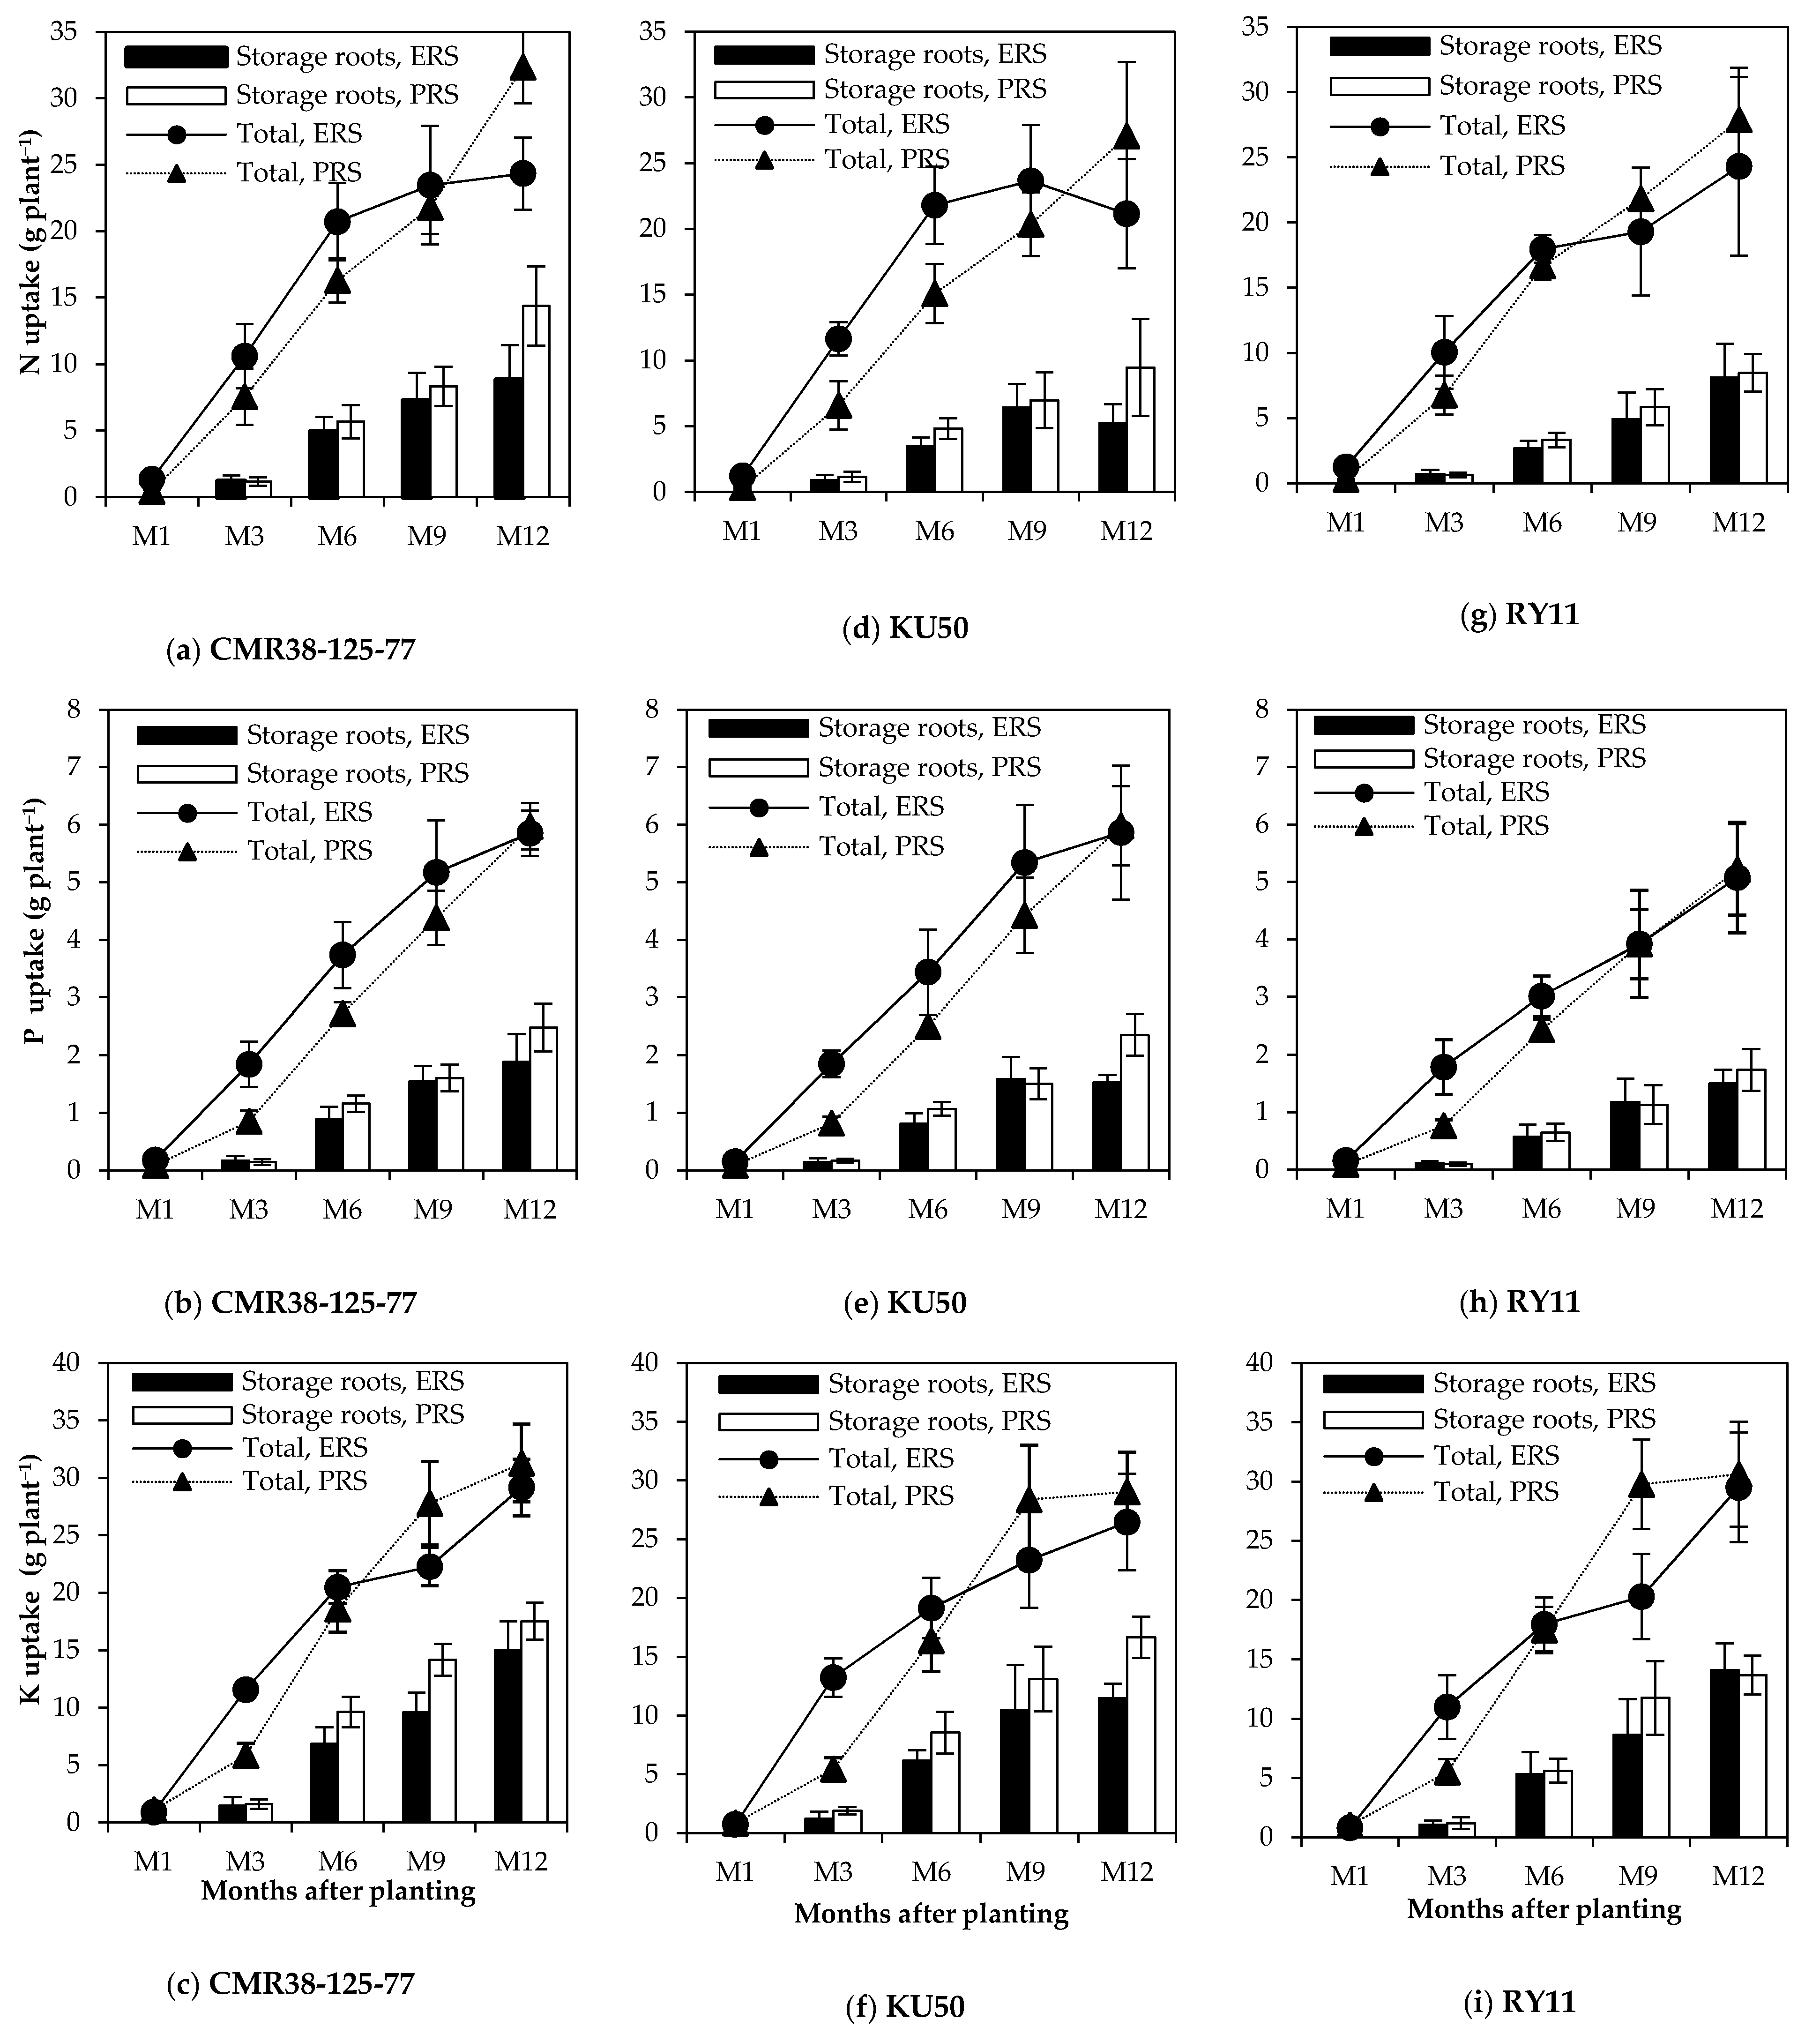
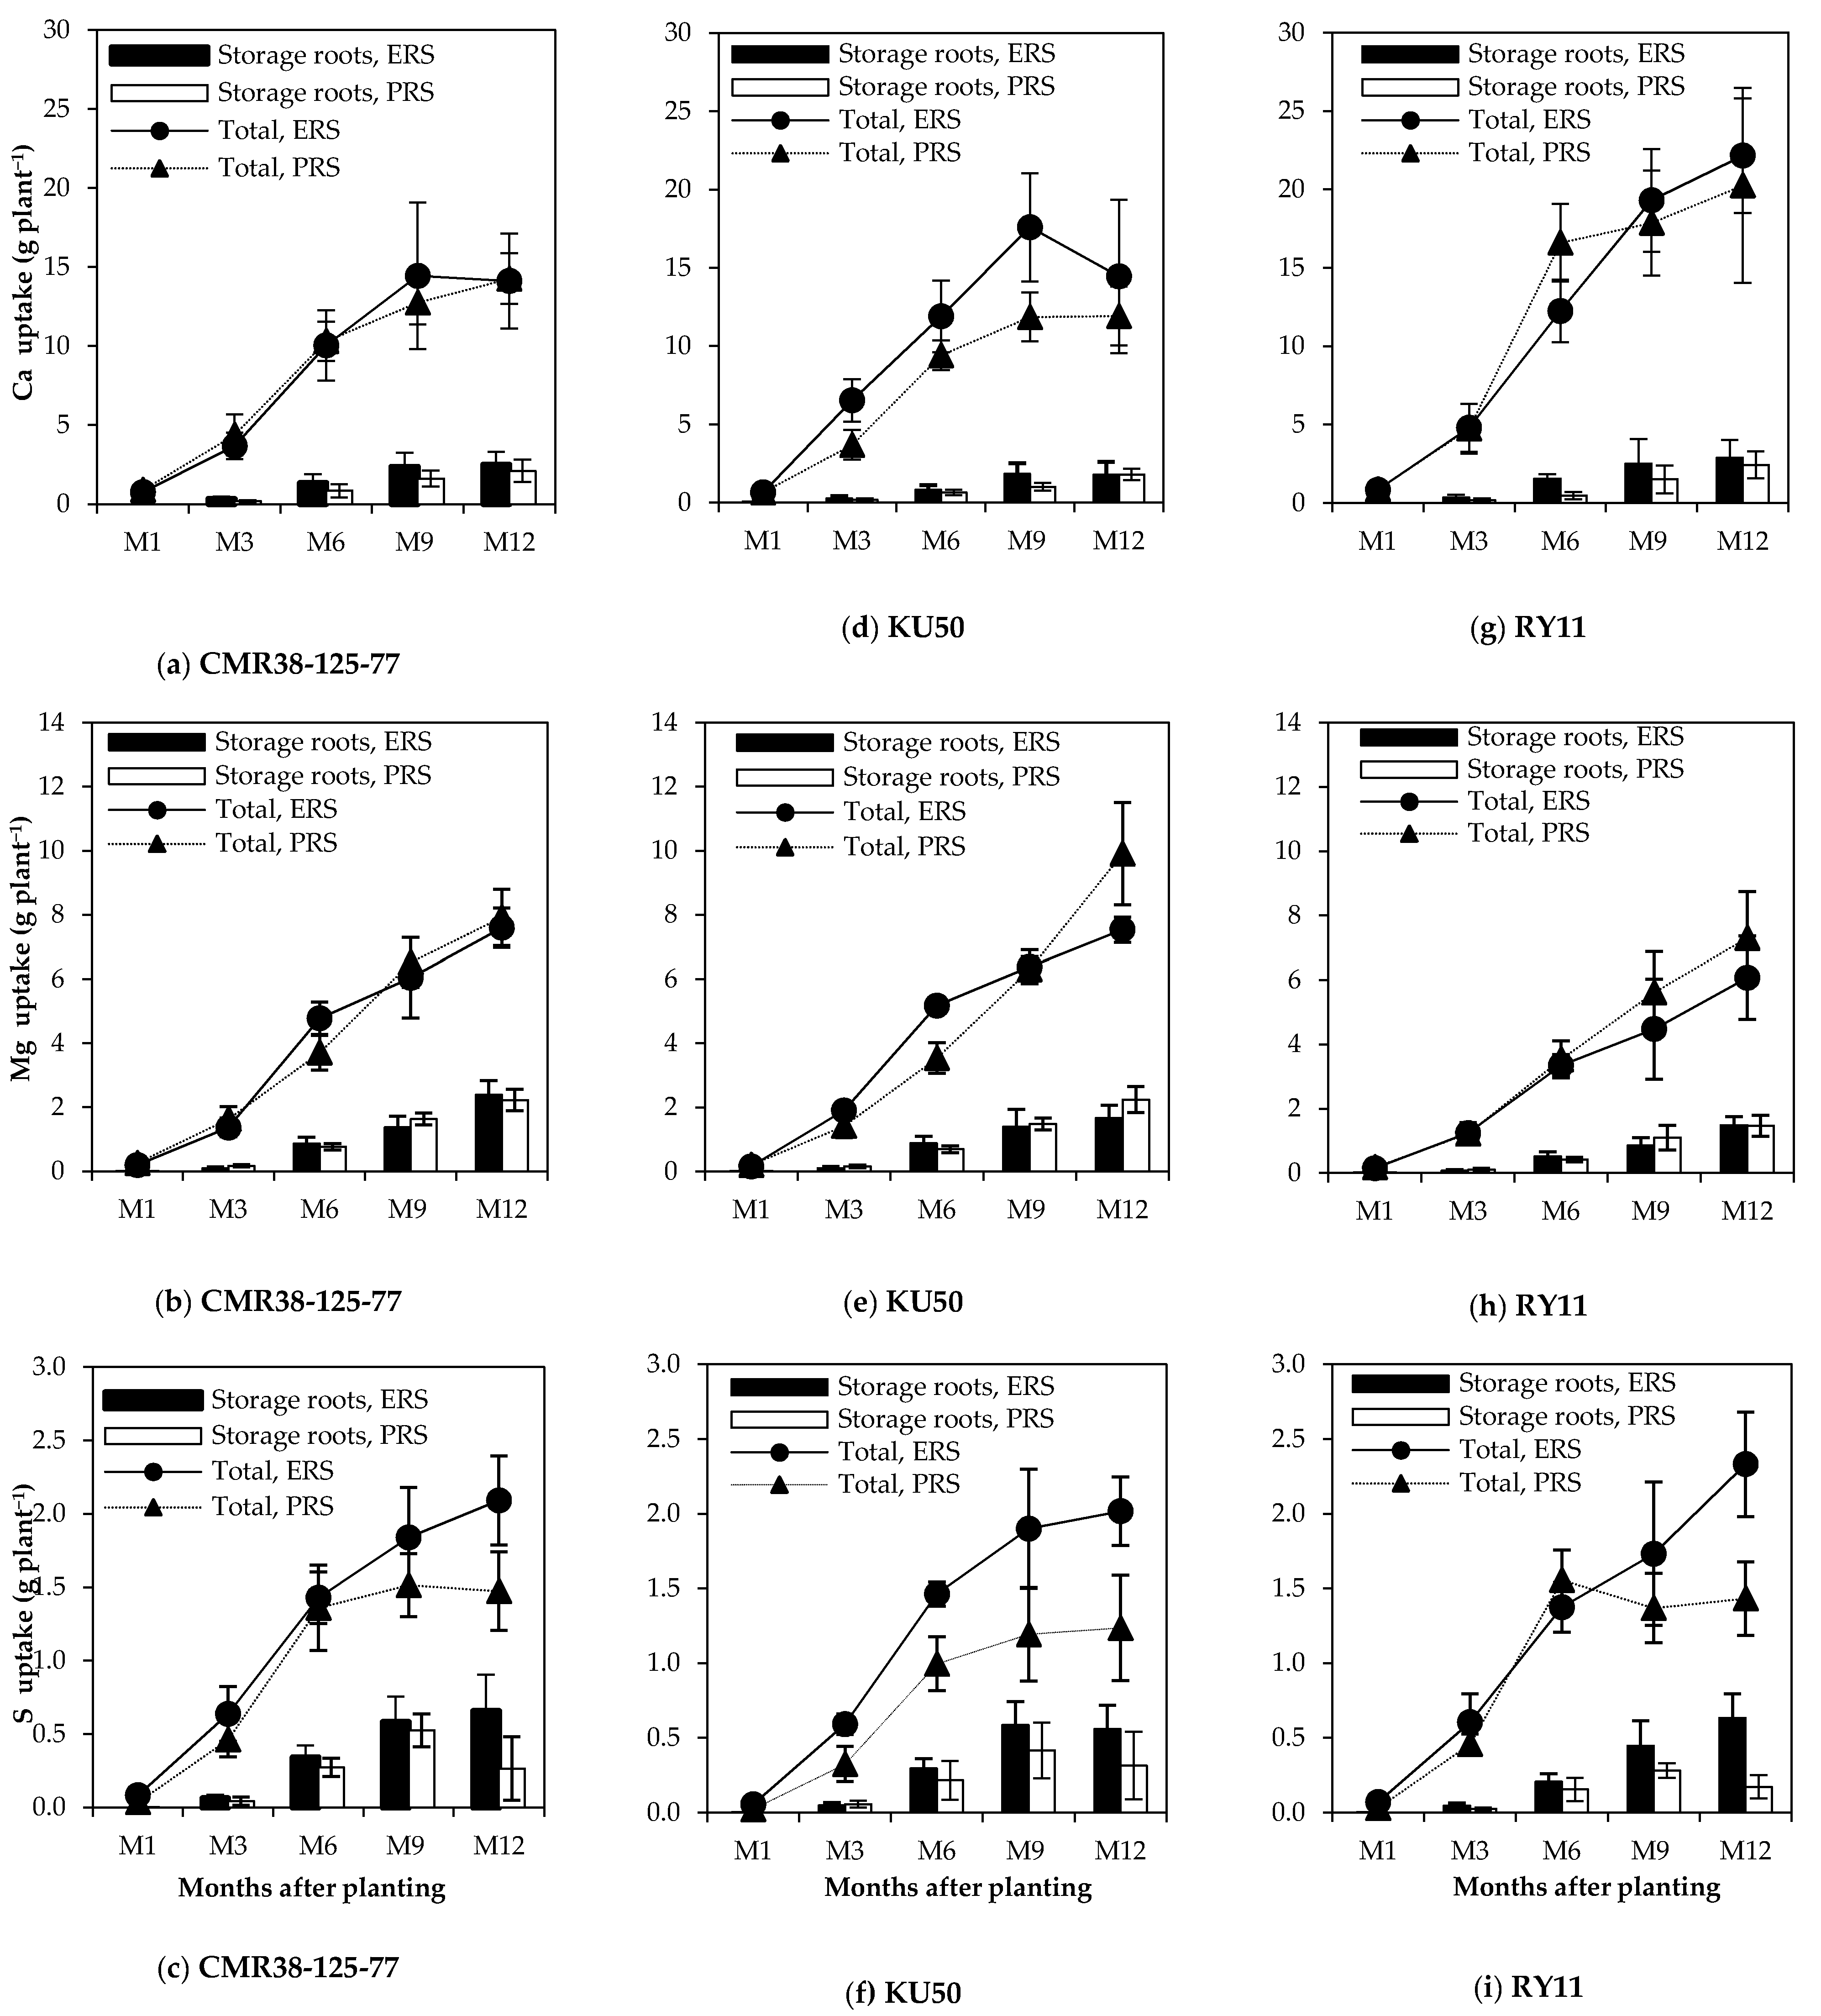
3.2. Total Nutrient Uptake, Nutrient Uptake by Storage Roots and Their Accumulation Rates

There were significant differences between the planting dates in terms of the total nutrient uptake, nutrient uptake by storage roots (Figure 2 and Figure 3) and their accumulation rates (Table 3) for most elements and genotypes. With the exception of Ca in RY11 and K during 3–6 MAP in all cassava genotypes, the total nutrient uptake and their accumulation rates during the early growth stage were higher in crops planted in the ERS than in the PRS in all cassava genotypes for most elements, especially during 1–6 MAP. After 6 MAP, the nutrient accumulation rates of the crops planted in the ERS slowly increased in all tested genotypes (Table 3). The accumulation rate of Ca in RY11 in the ERS showed the maximum increase rate in accumulation occurring for a long period during the early to late growth stages (1–9 MAP). Most nutrient elements of the crops planted in the PRS had the maximum increase rate in accumulation of nutrients during the mid- to late growth stages (3–9 MAP) and slowly increased after 9 MAP in all tested genotypes (Table 3), except for N, K and Ca in all genotypes, as they were high during the early to mid-growth stages (1–6 MAP). The maximum increase rate in the accumulation of N occurred for a second time during the late growth stage (9–12 MAP). No statistically significant difference between planting dates and among growth stages were observed in the accumulation rate of S for both planting dates (Table 3). Yet, most nutrients were continuously absorbed by the plant throughout the planting date (12 month) in most cassava genotypes. Unlike other elements in the ERS, the uptake and accumulation rates of N and Ca in KU50 and Ca in CMR increased rapidly with increasing plant age until plants were 9 MAP, and then decreased at 12 MAP (Figure 3 and Figure 4; Table 3).
Our study revealed that planting cassava in different planting dates gave different durations of maximum accumulation rates (Table 3), and the crops planted in the ERS appeared to have a greater total nutrient uptake than those planted in the PRS in all tested genotypes for most elements, particularly during early to mid-growth stages (Figure 2 and Figure 3). However, there were no significant differences between planting dates in the nutrient uptake at 12 MAP for most elements, since the difference in quantity of the two planting dates was relatively small, except for N in CMR and S in all tested genotypes (Figure 2a). The highest total nutrient uptake occurred at 12 MAP in both planting dates with all tested genotypes for most elements, except for N and Ca in CMR and KU50 of the crops planted in the ERS. It was noted that the crops planted in the PRS accumulated more N, P and K in the storage roots than those planted in the ERS. On the contrary, the crops planted in the ERS accumulated more Ca, Mg and S in the storage roots than those planted in the PRS.
Over all genotypes, cassava planted in the ERS had a total nutrient uptake per plant ranging from 21.1–24.3 g for N, 5.1–5.9 g for P, 26.6–29.5 g for K, 14.1–22.2 g for Ca, 6.1–7.6 g for Mg and 2.0–2.3 g for S. The total nutrient uptake per plant of the crops planted in the PRS ranged from 27.1–32.4 g for N, 5.2–6.0 g for P, 29.1–31.3 g for K, 11.9–20.3 g for Ca, 7.3–9.9 g for Mg and 1.2–1.5 g for S (Figure 2 and Figure 3). The amount of nutrients required for cassava growth in this study were listed in descending order of K, N, Ca, Mg, P and S, and the sequence was similar for both planting dates.
Considering both planting dates, RY11 and CMR appeared to have a greater total nutrient uptake for all elements in both planting dates. Moreover, higher total uptakes of Mg and P were also recorded in KU50 in both planting dates. CMR also had the highest values in terms of nutrient uptake by the storage roots for most elements in both planting dates, with the exception of Ca uptake by the storage roots, for which the highest uptake was recorded in RY11 (Figure 2 and Figure 3).
Figure 2. (ai) Total nitrogen, phosphorus and potassium accumulation and their accumulation in storage roots (g plant−1) of three cassava genotypes in the early rainy season (ERS) and post rainy season (PRS) with full irrigation. Each point represents the mean, and bars show standard deviation (n = 4). N = nitrogen; P = phosphorus; K = potassium; KU50 = Kasetsart 50; RY11 = Rayong 11.
Agriculture 11 01199 g002
Figure 3. (ai) Total calcium, magnesium and sulfur accumulation and their accumulation in the storage roots (g plant−1) of three cassava genotypes in the early rainy season (ERS) and post rainy season (PRS) with full irrigation. Each point represents the mean, and bars show standard deviation (n = 4). Ca = calcium; Mg = magnesium; S = sulfur; KU50 = Kasetsart 50; RY11 = Rayong 11.
Agriculture 11 01199 g003
Figure 4. (ai) Accumulation and distribution of nitrogen, phosphorus and potassium (g plant−1) of three cassava genotypes in the early rainy season (ERS) and post rainy season (PRS) with full irrigation. N = nitrogen; P = phosphorus; K = potassium; KU50 = Kasetsart 50; RY11 = Rayong 11.
Agriculture 11 01199 g004

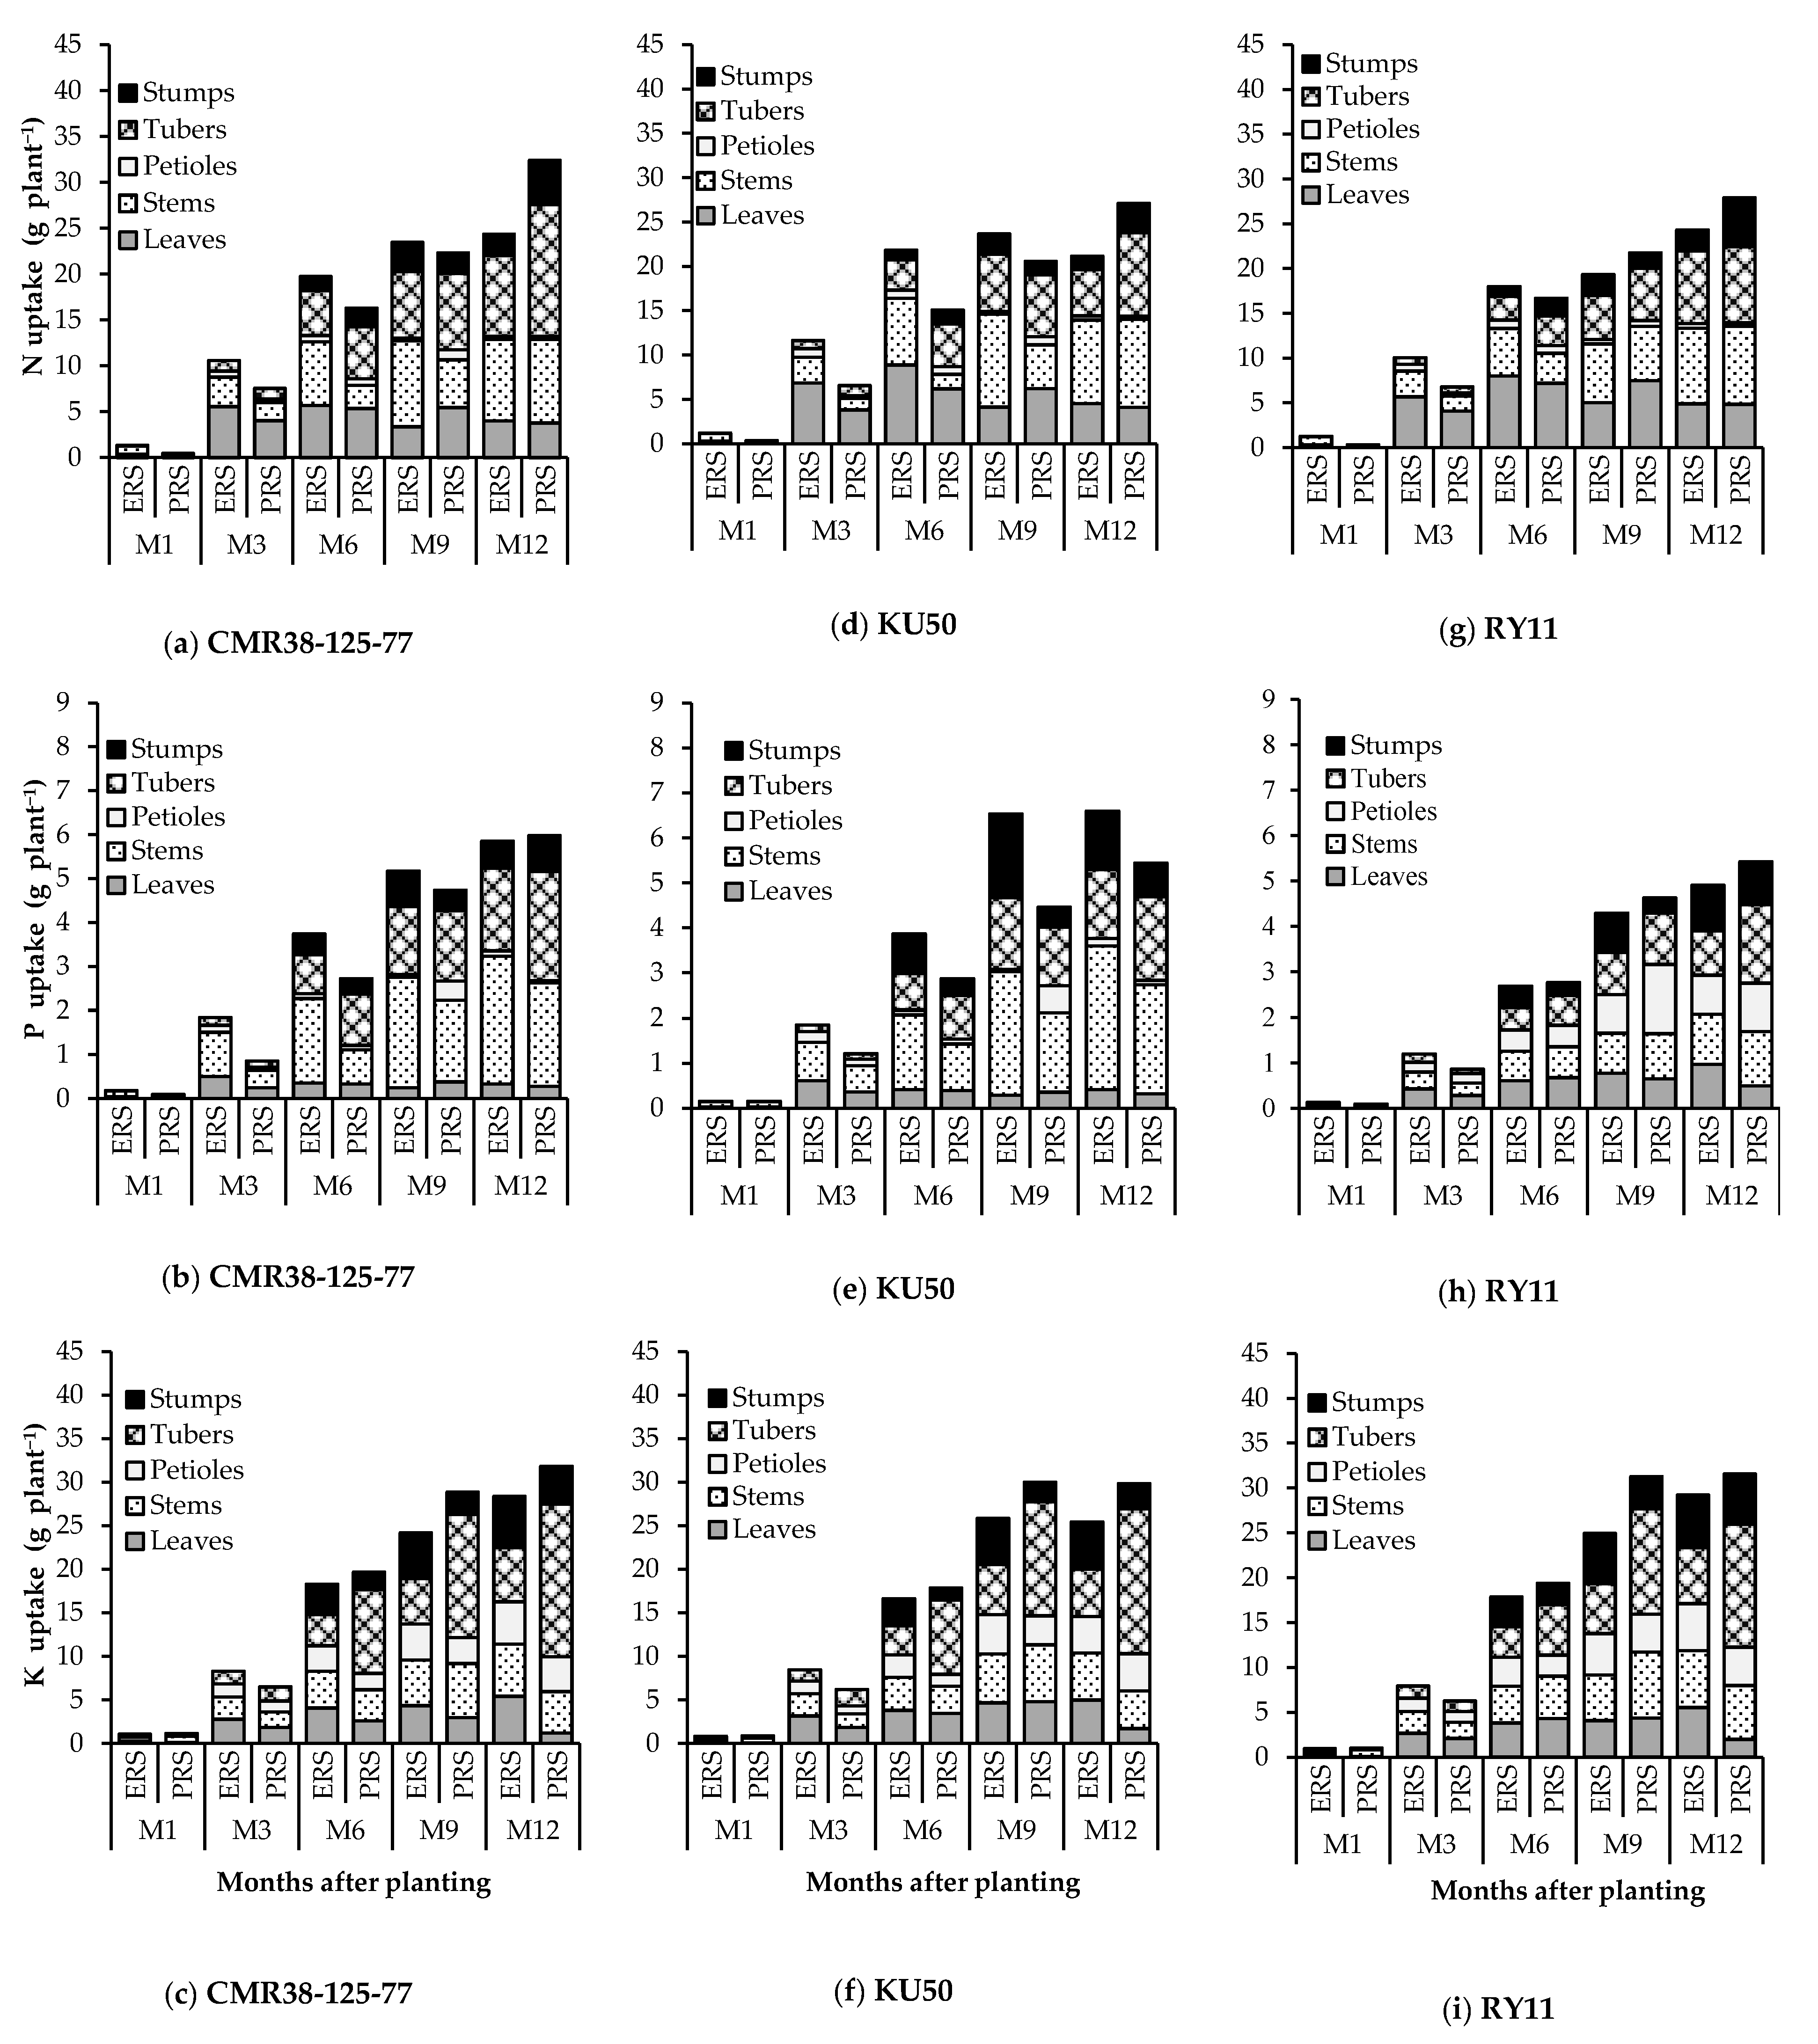
3.3. Nutrient Distribution and Nutrient Removal from the Soil by Storage Roots

Changes in nutrient distribution were similar in both planting dates. All nutrients initially accumulated in the leaves and petioles; their accumulation increased rapidly with increasing plant age until plants were 6 MAP, and decreased thereafter. However, nutrient accumulation in the stems and storage roots increased over time with increasing plant age. Yet, nutrient accumulations in the stumps remained relatively constant from 6 to 12 MAP for all elements (Figure 4 and Figure 5). Most nutrients (N, P and K) accumulated during the early growth stages in the leaves and stems, and were then partitioned to the storage roots during the mid- to late growth stages. Unlike other nutrients, Ca, Mg and S accumulated more in the stems than the storage roots throughout the growth periods in all tested genotypes (not more than one third of the total uptake).
The results show that the fast rate of nutrients’ translocation to the storage roots occurred during 9 to 12 MAP in all tested genotypes. In the PRS, the fast rate of nutrients’ partitioning to the storage roots occurred for a long period during 6–12 MAP in all tested genotypes (Figure 4 and Figure 5; Table 4). Unlike other nutrients, in the PRS, the highest partitioning rate of N in RY11 was detected at 12 MAP, the highest Ca partitioning rate occurred during 9–12 MAP and S occurred at 10 MAP in all tested genotypes. In addition, CMR and KU50 appeared to accumulate more P in the stems than RY11, whereas RY11 and KU50 appeared to accumulate more Ca in the stems than CMR for both ERS and PRS through the growing periods (Figure 4 and Figure 5).
Differences in the percentage of nutrient removal between the planting dates were also significant for most elements in all tested genotypes, except for Mg and S in all tested genotypes and most growth stages, K in CMR at 12 MAP, K in RY11 at 6–12 MAP and Ca in KU50 at 1–9 MAP (Table 4). The crops planted in the PRS had a higher percent of N, P and K partitioning than those planted in the ERS for all growth stages, with the exception of N at 12 MAP and K at 9 and 12 MAP in RY11, as they showed no significant differences between planting dates. The crops planted in the ERS seem to have a greater proportion of Ca, Mg and S to storage roots than those planted in the PRS for most genotypes and growth stages.
Considering both planting dates, the highest percentage of nutrient removal was recorded in CMR at 12 MAP in both planting dates for all elements, with the values of N (36.1%), P (32.3%), K (51.5%), Ca (17.6%), Mg (31.5%) and S (31.5%) in the ERS. In the PRS, the nutrient removal in CMR at 12 MAP included N (44.4%), P (41.6%), K (56.0%), Ca (14.8%) and Mg (28.1%). The highest percentage of S removal from the soil by the storage root, however, was observed at 9 MAP in CMR and KU50 for both planting dates (30.9–31.7% in the ERS and 34.7–34.9% in the PRS). Moreover, the highest percentage of removal of K (57.3%) and Ca (15.1%) was recorded in KU50 for the crops planted in the PRS (Table 4).
Figure 5. (ai) Accumulation and distribution of calcium, magnesium and sulfur (g plant−1) of three cassava genotypes in the early rainy season (ERS) and post rainy season (PRS) with full irrigation. Ca = calcium; Mg = magnesium; S = sulfur; KU50 = Kasetsart 50; RY11 = Rayong 11.
Agriculture 11 01199 g005

3.4. Accumulation of Biomass, Storage Root Dry Weight and NUE

The planting dates were significantly different for the storage root yield and biomass for most genotypes (Table 5). Across two years, in the ERS, biomass accumulated rapidly during the early growth stages, whereas in the PRS, this occurred at the mid- to late growth stages for all cassava genotypes. The crops planted in the PRS had a higher storage root dry weight than that the crops planted in the ERS, with the most obvious differences observed after 6 MAP. At final harvest, the cassava genotypes planted in the PRS gave the highest values of storage root dry weight, accounting for 1604–2253 g m−2, and biomass, accounting for 3353–3824 g m−2, which were higher than for the crops planted in the ERS with the values of 1244–1810 g m−2 for storage root dry weight and 2831–3280 g m−2 for biomass (Table 5). The storage root dry weight of RY11 was an exception, as it showed no statistically significant differences between planting dates. Significant differences in the storage root dry weight and biomass among genotypes were also recorded for both planting dates, with the highest value obtained in CMR and RY11 for the crops planted in the ERS. In the PRS, significantly higher storage root dry weight and biomass were observed in CMR and KU50.
Planting cassava in the PRS had significantly higher NUE for storage roots and biomass than that in the ERS for most elements and genotypes (Table 6). The N use efficiency of CMR and the K and Mg use efficiencies of RY11 for both storage roots and biomass, as well as the P use efficiency of RY11 for storage roots, were the exception, as there were no statistically significant differences between the planting dates. With the exception of the N use efficiency for biomass, CMR and RY11 showed high NUE for storage roots and biomass in the ERS for most elements, whereas CMR and KU50 showed good performance for these traits in most elements when planted in the PRS, except for the S use efficiency for biomass in which RY11 showed better performance.
The uptake ratios between the nutrients were selected based on their interactions between plant nutrients, as represented by the Mulder’s chart.
The nutrient uptake ratios of the three cassava genotypes are given in Table 7. The results indicate that the ratios of nutrient uptake varied between nutrients. The ratio of N/K ranged from 0.80–1.03 across the cassava genotypes and planting dates, whereas P/K, S/P, Mg/K and P/Ca ratios ranged from 0.17 to 0.50. In this study, we noted that the ratios of Ca/Mg and K/Ca were higher than that of other elements, with values of 1.20–3.65. RY11 seemed to have a higher Ca/Mg ratio than the other genotypes.

4. Discussion

Increasing cassava yield in terms of quantity and quality in response to a growing consumer demand requires good management practices. This is especially true for improved soil management to prevent land degradation caused by nutrient depletion and soil erosion [19]. Seasonal patterns of nutrient uptake and partitioning are a fundamental component in managing fertilizer application. This report provided new evidence of the nutrient uptake dynamics and partitioning in cassava genotypes in different planting dates grown under irrigation. Currently, planting cassava with supplemental irrigation is being practiced for increasing the yield per area. Precision agriculture has also become a cornerstone of sustainable agriculture to maximize profitability and environmental safety [23].
In this study, during field preparation, the soil pH in the experimental fields was adjusted to optimum conditions for nutrient availability by applying lime, according to lime requirements. The soil chemical properties were also adjusted into the same ranges at adequate levels for optimal cassava growth, according to the nutritional requirements of cassava [17], by applying chemical fertilizers. It was noted in this study that the soil chemical properties after harvesting were similar to those of pre-planting for most nutrients for all planting dates (Table 2). This indicated that the application of chemical fertilizers based on soil analysis was sufficient for the cassava growth cycle. As P was not applied to the crops because the content in the soil was higher than the optimum level for cassava growth, the available P of the soil after harvesting seemed to reduce for all planting dates. In cassava, the nutrient content of the fully expanded fifth leaf blades at 3–4 MAP are used as an indicator for determining the nutrition status. In the current study, the nutrient content in the leaf blades at 3 MAP (Supplementary Table S2) specified that the nutrient status for both planting dates and years were adequate for most nutrients; however, the P status was relatively high for both planting dates and years. Yet, adequate to relatively high levels of nutrient status resulted in achieving a cassava yield of approximately 90–100% of its yield potential [17].
We observed significant differences between the years and planting dates on nutrient uptake (Supplementary Table S1), indicating that variations in the nutrient uptake were highly affected by climatic factors during the growing periods in each planting date and year. While the interaction between the genotype and planting date was significant, the interaction between the genotype and year was not significant. This indicated that each cassava genotype accumulated the highest nutrients in the whole plant for different planting dates, but the performance of the cassava genotypes showed consistency across the years within planting dates. This showed the possibility of using nutrient uptake as a criterion to identify superior cassava genotypes by testing under different planting dates, with only a one-year trial. These results are consistent with other traits in cassava: Janket et al. [24] found no significant interaction between years and genotypes in terms of starch content, starch yield and granule size.
The pattern of total nutrient accumulation differed among growth stages and planting dates, and is strongly related to the demand for crop growth. The maximum total nutrient uptake and the accumulation rates of the crops planted in the ERS primarily occurred during the early growth stages at 1–6 MAP, and slowly increased during the late growth stages (Table 3; Figure 2 and Figure 3). Planting cassava in the PRS, however, had lower total nutrient uptake and nutrient accumulation rates during the early growth stages when compared to the ERS. The nutrient uptake of the crops planted in the PRS increased continuously from planting until harvest (Figure 2 and Figure 3) and the accumulation rates rapidly increased during the late growth stages, with the exception of increased rates of N and Ca, as they were high during 1–6 MAP for both planting dates (Table 3). Unlike other nutrients, the accumulation rate of S was not significantly different between planting dates and among growth stages within the planting dates, as the crops’ needs were very low. However, although S is required in lesser amounts compared to other macronutrients, it is essential for many functions in plants, i.e., the formation of chlorophyll and plant proteins [13,25].
Earlier studies in certain cultivation areas gave contrasting results in terms of the nutrient uptake. The N uptake of rainfed crops in previous reports ranged from 9.3 to 20.2 g plant−1 for producing yields of 1500–4500 g plant−1. The P uptake ranged from 1.2 to 4.6 g plant−1 and K uptake ranged from 8.1 to 48.5 g plant−1 [19]. The difference in nutrient uptake might be due to the genotypic variations in yield and biomass, as well as the difference in soil fertilizer status and growing conditions. Unambiguously, the values of nutrient uptake in the irrigated crops of the current study were higher than those of the rainfed crops, as concluded by Byju and Suja [19]. The underlying reason could be because the higher values of nutrient uptake in our irrigated crops were highly associated with higher biomass production and storage root yields compared to previous studies of rainfed crops [17,18]. The reasons for higher P uptake in this study may be due to the fact that the soil used in this experiment had high available P content, thereby resulting in greater absorption of this nutrient by cassava. However, the high content of P in the soil may have had an antagonistic effect on the absorption of other nutrients, such as S, Ca, Fe, Cu and Zn, through competition in the absorption of these nutrients for the same transporters (i.e., non-specific carrier proteins) [26,27]. Conversely, the high level of P content may have a synergistic effect on the absorption of Mg [26]. Moreover, we noted that the ratios of Ca/Mg and K/Ca were higher than that of other elements (1.20–3.65); thus, antagonism phenomena between these nutrients are more likely to happen than for other elements.
Changes in nutrient distribution patterns for both planting dates were similar. All nutrients initially accumulated in the shoots (leaves, petioles and stems) with increasing plant age until approximately 6 MAP, and declined afterwards. Most accumulated nutrients in the shoots were then translocated to the storage roots at the mid- to late growth stages at an accelerating rate (Figure 4 and Figure 5). Considering the late to dormancy growth stages, N, P and K accumulated mainly in the storage roots, while Ca, Mg and S accumulated mainly in the stems. Yet, after the canopy development stages, the accumulated nutrients in the shoot organs were returned to the soil by the falling of leaves and petioles at the late growth stages, as well as the stems and stumps, as they were left in the field after the harvesting of the storage roots. It seems likely that CMR and KU50 accumulated more P in the stem than RY11, whereas RY11 and KU50 accumulated more Ca in the stem than CMR (Figure 4). In this study, CMR and KU50 not only accumulated higher P in the stem, but they also captured higher P of the whole plant compared to RY11. The higher P uptake appears to be related to the better photosynthetic performance and starch yield of these genotypes [5,9], which led to increased P requirements because it plays a key role in reactions that involve ATP and participates in metabolic processes such as photosynthesis, energy transfer and synthesis and breakdown of carbohydrates, as well as protein metabolism [13]. Subsequently, the accumulated P can be transported throughout the plant, and is possibly translocated and accumulated in the stems in the late parts of the growth cycle [28]. Previous literature has noted that the ability of the plants to take up nutrients from the soil differs between plant species and even genotypes within the same species [29]. Since Ca is an immobile element throughout the plant, it mainly accumulated in the stems. The genotypes with a high Ca uptake might have greater root cap surface areas, because Ca ions can only enter into root cells through the root cap before moving along with water in the xylem through transpiration [28]. However, there is a need to further investigate root morphology that affects the uptake of different nutrients in different cassava genotypes.
At final harvest, the nutrient returns to the soils per plant by the non-harvested products in the ERS were 15.6–16.2 g N, 3.6–4.0 g P, 14.2–15.4 g K, 11.6–19.3 g Ca, 4.7–5.9 g Mg and 1.4–1.7 g S, and in the PRS were 17.6–19.4 g N, 3.5–3.6 g P, 12.4–17.0 g K, 10.1–18.0 g Ca, 5.7–7.7 g Mg and 1.0–1.3 g S. A previous study on cassava planted in rainfed conditions reported that nutrients returning to the soils per plant were 4.8 g N, 0.7 g P, 6.0 g K, 1.4 g Ca and 0.6 g Mg, with the ratio of 8:1:10:2:1 [30] However, the ratio of N, P, K, Ca and Mg returned to the soil in the present study was 5:1:4:4:2. The differences between the studies for nutrients returning to the soils may be a result of the differences in canopy characteristics, root morphology and the growth habits of the genotypes tested, as well as soil chemical properties, water management and growing conditions [18,19,30].
At final harvest, about 45–58% of the total K uptake was partitioned to the storage roots. This was greater than N (26–45%), P (26–42%), Ca (12–18%), Mg (20–31%) and S (12–31%). As more than half of the total K uptake was translocated to the storage roots, the cassava extracted large amounts of K from the soils. Prajapati and Madi [31] described K as being an essential element in cassava and other tuber crops for starch formation and production and the translocation of sugars due to K activating the enzyme responsible for starch synthesis and translocation. Nutrient removal by the storage roots (harvested products) quantitatively stated maintenance fertilizer application rates to replace the exported nutrients in order to protect against depletion of soil nutrients and to regulate dynamic changes in nutrients [32]. The average nutrient removal from the soil by the storage roots under rainfed conditions was summarized by Byju and Suja [19], who indicated that for an average storage root dry weight of 1.07–1.40 kg plant−1, cassava storage roots captured K (5.49–10.21 g plant−1) in the greatest amounts, followed by N (3.03–6.73 g plant−1), P (0.75–1.68 g plant−1), Ca (0.54–1.54 g plant−1), Mg (0.65–0.84 g plant−1) and S (0.33–0.70 g plant−1).
The nutrient removal from the soil was also related to the planting dates. Higher removal of N, P and K from the field by the storage roots was recorded in the PRS for all growth stages, whereas the higher removal of Ca and Mg was recorded in the ERS (Table 4). The lower percentage of nutrient removal values of Ca and Mg of the crops planted in the PRS was probably the result of high K content in the storage root, thereby limiting Ca and Mg translocations to the storage roots [28]. CMR accumulated all nutrient elements in the storage roots in the greatest amounts compared to others for both ERS and PRS, particularly during 6–12 MAP. The percentage of nutrient removal of N, P and K during 3–6 MAP of the crops planted in the PRS were much higher than thise planted in the ERS. This indicates the difference in the critical period of crop demand for these elements for storage root formation with respect to the planting dates. Byju and Suja [19] reported that the starch content and starch yield of cassava significantly increased under balanced NPK application; however, they were reduced with high N application [17], as cassava requires much less N than other crops [30]. A higher application of N may lead to excessive shoot growth, but a reduction in starch biosynthesis and poor storage root thickening [17].
It has been reported that the nutrients with greater portioned to storage roots are important nutrients to produce storage root yield, and the application of external nutrients should be replaced with the quantities of nutrients that were removed by harvested products [33]. The continuous cultivation of cassava without adequate maintenance fertilizations leads to depletion of soils [30].
The total nutrient uptake coincided with the maximum periods of dry weight production for different planting dates, as the crops require these nutrients for tissue formation at each growth stage [18]. In the literature, macronutrients are required in amounts greater than 0.1% of dry matter, since they play a major role in plant structure, while micronutrients (<0.01% of dry matter) are mainly involved in enzymatic reactions [13]. A study conducted by Phonjaroen et al. [6] indicated that high air temperature, RH and solar radiation during the early growth stages supported high total biomass productions during the early to mid-growth stages for the crops planted in the ERS, whereas lower values for air temperature, RH and solar radiation during the early growth stages reduced the total biomass accumulation rates during the early growth stages for the crops planted in the PRS. The obvious differences in photosynthetic capacity to the seasonal variations have been reported; cassava can achieve a great photosynthetic rate in a hot and humid climate with high solar radiation, RH and temperature [8,11], with the maximum photosynthetic rate obtained during the rainy season, followed by hot and cool seasons [8]. Relative humidity also affects the uptake of water and nutrients, as well as photosynthesis. The leaf photosynthetic rate of cassava varied among the genotypes from 25–31 µmol (CO2) m−2 s−1 in higher RH, and 7–20 µmol (CO2) m−2 s−1 in lower RH environments, in which the differences among the cassava genotypes were possibly due to the stomatal adjustment [34,35]. Accordingly, the production of cassava in more humid environments (at 70% RH) had more total biomass and storage root yield than in low RH at 30% [36].
Although the crops planted in the ERS gave higher total nutrient uptakes than those planted in the PRS in the early to mid-growth stages, the crops planted in the PRS had a greater nutrient partitioning efficiency from shoots to storage roots than that in the ERS (Table 4). This may explain why planting cassava in the PRS had a higher NUE for the storage roots than for those in the ERS (Table 6). In our study, CMR showed better performances for both the NUE for storage roots and the NUE for biomass for most elements across planting dates.
Changes in biomass accumulation and partitioning, as affected by planting dates, have previously been documented. Keating et al. [37] described how high temperatures during the planting date and a longer day length caused a high biomass production rate, but limited carbohydrates available for storage root development, whereas lower temperatures and a shorter day length during the planting date caused a low biomass production rate, but increased carbohydrates available for storage root development.
At final harvest of both planting dates, the amount of nutrients required by the whole plants for adequate growth had the following descending order: K > N > Ca > Mg > P > S, which was similar to previous observations [17]. Contrary nutrient uptake patterns were reported by Putthacharoen et al. [30], namely, N > K > Ca > P > Mg > S. The differences might be due to the difference in climatic conditions, water management, or plant and soil properties. Additionally, in our study, dolomitic limestone was used to correct the soil acidity and to improve the soil chemical properties, resulting in increased contents of Ca and Mg in the sorption complex. Increasing Ca and Mg in the soil also leads to more competition for uptake sites [26]. However, there was not much difference between K and N uptakes in our study.
Although nutrient management is a complex process, improving the understanding of the dynamics of nutrient uptake provides opportunities to optimize fertilizer application in terms of kinds, rates and timings. Information on nutrient uptake and partitioning from this study can provide a valuable model for modifying the nutrient management of cassava grown in different planting dates, thereby helping growers to increase their yields and profitability. Additionally, CMR would be a profitable genetic resource for improving the cassava yield, the ability of nutrient uptake and the NUE for both biomass and storage roots, as it performed satisfactorily for these traits across planting dates. However, this study was only conducted on a single site that provided evidence of the impact of planting dates and genotypes in nutrient uptake dynamics and distribution. It is difficult to conceive the improvements in fertilizer recommendations based on the result from a single study. Therefore, further investigations in multiple locations that cover all existing variabilities in soil and climates are still necessary. Moreover, an evaluation of the plant-soil relationship should also be determined to estimate nutrient bioavailability and synergy/antagonism phenomena, especially in soil with high variability in pH, CEC and clay texture.

5. Conclusions

The present study indicated that cassava planted in the ERS had a total uptake of nutrients higher than those planted in the PRS, with a descending order of: K > N > Ca > Mg > P > S. The nutrient uptakes by the whole plant for the crops planted in the ERS increased rapidly during the early to mid-growth stages, whereas the crops planted in the PRS mainly absorbed during mid- to late growth stages for most elements. Only the accumulation rate of S showed no difference between the seasons and the growth stage within seasons. The total nutrient uptake, however, increased with time, except for N in KU50 and Mg in CMR and KU50 at 12 MAP of the crops planted in the ERS. A greater percentage of nutrient partitioning to the storage roots for N, P and K were recorded for crops planted in the PRS compared to those planted in the ERS, and crops therefore accumulated a higher number of these elements in their storage roots. Contrarily, higher nutrient removal and accumulation in the storage roots for Ca, Mg and S were recorded for crops in the ERS than for those in the PRS. At final harvest, N (26–45%), P (26–42%) and K (45–58%) mainly accumulated in the storage roots, while those of Ca (12–18%), Mg (20–31%) and S (12–31%) mainly accumulated in the stems. CMR had satisfactory performances with respect to nutrient uptake, nutrient partitioning efficiency, NUE for biomass, NUE for storage roots and storage root dry weight across the planting dates. The results from this study are useful as additional information to support decision-making in refining fertilizer management to specific environments according to crop demands and to prevent imbalanced fertilization, and it would be a cornerstone for further sustainable agriculture to maximize yields, profitability and reduce fertilizer losses, thereby improving environmental safety. Moreover, this study also provided valuable data for breeding programs for enhancing nutrient use efficiency and yield performance.

Supplementary Materials

The following are available online at https://www.mdpi.com/article/10.3390/agriculture11121199/s1: Table S1: Combined analyses of variance for total N, P, K, Ca, Mg and S uptake (g plant−1) of three cassava genotypes during crop growth in two planting dates for two years. Table S2: Nutrient contents of the fourth and fifth fully explanted leaf blades at 3 MAP of three cassava genotypes planted in different planting dates with full irrigation.

Author Contributions

Conceptualization, N.V., P.B., P.T. and S.J.; Data curation, A.J.; Formal analysis, A.J. and S.J.; Investigation, A.J.; Methodology, A.J., N.V., P.B. and S.J.; Supervision, S.J.; Writing—original draft, A.J.; Writing—review & editing, B.T., W.K., P.B., C.C.H., C.K.K. and S.J. All authors have read and agreed to the published version of the manuscript.

Funding

This research was funded by the Royal Golden Jubilee Ph.D. Program (grant no. PHD/0216/2560); the National Science and Technology Development Agency (NSTDA), Thailand; and the Peanut, Jerusalem Artichoke and Cassava Improvement Research Group, Khon Kaen University.

Acknowledgments

Grateful acknowledgement is made to Khon Kaen University and the Peanut, Jerusalem Artichoke and Cassava Improvement Research Group for providing the facilities used in conducting this experiment and for the training for manuscript preparation. Special thanks go to the members of the Cassava Team project and the technicians of the Agronomy Department for their help in field data collection and laboratory analyses.

Conflicts of Interest

The authors declare no conflict of interest.

References

  1. Maung Aye, T.; Howeler, R.H. Integrated Crop Management for Cassava Cultivation in Asia. In Achieving Sustainable Cultivation of Cassava Volume 1: Cultivation Techniques; Burleigh Dodds: Cambridge, UK, 2007. [Google Scholar] [CrossRef]
  2. Food and Agricultural Organization of the United Nations (FAO). Available online: http://faostat.fao.org (accessed on 4 September 2020).
  3. Geo-Informatics and Space Technology Development Agency (GISTDA). Available online: https://ecoplant.gistda.or.th/ (accessed on 10 August 2020).
  4. Akinwumiju, A.S.; Adelodun, A.A.; Orimoogunje, O.I. Agro-climato-Edaphic zonation of Nigeria for a cassava cultivar using GIS-based analysis of data from 1961 to 2017. Sci. Rep. 2020, 10, 1259. [Google Scholar] [CrossRef] [Green Version]
  5. Janket, A.; Vorasoot, N.; Toomsan, B.; Kaewpradit, W.; Banterng, P.; Kesmala, T.; Theerakulpisut, P.; Jogloy, S. Seasonal variation in starch accumulation and starch granule size in cassava genotypes in a tropical savanna climate. Agronomy 2018, 8, 297. [Google Scholar] [CrossRef] [Green Version]
  6. Phoncharoen, P.; Banterng, P.; Vorasoot, N.; Jogloy, S.; Theerakulpisut, P.; Hoogenboom, G. Growth rates and yields of cassava at different planting dates in a tropical savanna climate. Sci. Agric. 2019, 76, 376–388. [Google Scholar] [CrossRef] [Green Version]
  7. Phoncharoen, P.; Banterng, P.; Vorasoot, N.; Jogloy, S.; Theerakulpisut, P.; Hoogenboom, G. The impact of seasonal environments in a tropical savanna climate on forking, leaf area index, and biomass of cassava genotypes. Agronomy 2019, 9, 19. [Google Scholar] [CrossRef] [Green Version]
  8. Vongcharoen, K.; Santanoo, S.; Banterng, P.; Jogloy, S.; Vorasoot, N.; Theerakulpisut, P. Seasonal variation in photosynthesis performance of cassava at two different growth stages under irrigated and rain-fed conditions in a tropical savanna climate. Photosynthetica 2018, 56, 1398–1413. [Google Scholar] [CrossRef]
  9. Wongnoi, S.; Banterng, P.; Vorasoot, N.; Jogloy, S.; Theerakulpisut, P. Physiology, growth and yield of different cassava genotypes planted in upland with dry environment during high storage root accumulation stage. Agronomy 2020, 10, 576. [Google Scholar] [CrossRef] [Green Version]
  10. Pugnaire, F.I.; Morillo, J.A.; Peñuelas, J.; Reich, P.B.; Bardgett, R.D.; Gaxiola, A.; Wardle, D.A.; Van Der Putten, W.H. Climate change effects on plant-soil feedbacks and consequences for biodiversity and functioning of terrestrial ecosystems. Sci. Adv. 2019, 5, 11. [Google Scholar] [CrossRef] [PubMed] [Green Version]
  11. El-Sharkawy, M.A. International research on cassava photosynthesis, productivity, eco-physiology, and responses to environmental stresses in the tropics. Photosynthetica 2006, 44, 481–512. [Google Scholar] [CrossRef]
  12. Barker, A.V.; Pilbeam, D.J. Handbook of Plant Nutrition; CRC Press: Boca Raton, FL, USA, 2015; p. 773. [Google Scholar]
  13. Fageria, N.K.; Baliger, V.C.; Jones, C.A. Growth and Mineral Nutrition of Field Crops; CRC Press: Boca Raton, FL, USA, 2010; p. 590. [Google Scholar]
  14. Proebsting, W.M.; Chaplin, M.H. The effect of photoperiod-induced flowering on the nutrient content of pea shoots. J. Plant Nutr. 1981, 4, 419–429. [Google Scholar] [CrossRef]
  15. Wang, J.; Li, L.; Lam, S.K.; Zhang, X.; Liu, X.; Pan, G. Changes in nutrient uptake and utilization by rice under simulated climate change conditions: A 2–year experiment in a paddy field. Agric. For. Meteorol. 2018, 250, 202–208. [Google Scholar] [CrossRef]
  16. Suzuki, M.; Umeda, H.; Matsuo, S.; Kawasaki, Y.; Ahn, D.; Hamamoto, H.; Iwasaki, Y. Effects of relative humidity and nutrient supply on growth and nutrient uptake in greenhouse tomato production. Sci. Hort. 2015, 187, 44–49. [Google Scholar] [CrossRef] [Green Version]
  17. Howeler, R.H. Cassava mineral nutrition and fertilization. In Cassava: Biology, Production and Utilization; Hillocks, R.J., Thresh, J.M., Bellotti, A., Eds.; CABI Publishing: New York, NY, USA, 2002; pp. 115–147. [Google Scholar]
  18. Howeler, R.H.; Cadavid, L.F. Accumulation and distribution of dry matter and nutrients during a 12-month growth cycle of cassava. Field Crop. Res. 1983, 7, 123–139. [Google Scholar] [CrossRef]
  19. Byju, G.; Suja, G. Chapter five-mineral nutrition of cassava. Adv. Agron. 1983, 159, 169–235. [Google Scholar] [CrossRef]
  20. Alves, A.A.C. Cassava botany and physiology. In Cassava: Biology, Production and Utilization; Hillocks, R.J., Thresh, J.M., Bellotti, A., Eds.; CABI Publishing: New York, NY, USA, 2002; pp. 66–89. [Google Scholar]
  21. Janket, A.; Jogloy, S.; Vorasoot, N.; Toomsan, B.; Kaewpradit, W.; Theerakulpisut, P.; Holbrook, C.C.; Kvien, C.K.; Banterng, P. Nutrient uptake and nutrient use efficiency of cassava genotypes with different starch bulking periods as affected by different planting dates. J. Plant Nutr. 2020, 44, 580–599. [Google Scholar] [CrossRef]
  22. Gomez, K.A.; Gomez, A.A. Statistical Procedures for Agricultural Research; John Wiley and Sons: New York, NY, USA, 1984; pp. 1–657. [Google Scholar]
  23. Polthanee, A.; Srisutham, M. Supplementary irrigation for cassava planted in the late rainy season of Northeastern Thailand. Asian J. Crop Sci. 2017, 9, 100–108. [Google Scholar] [CrossRef]
  24. Janket, A.; Vorasoot, N.; Toomsan, B.; Kaewpradit, W.; Theerakulpisut, P.; Holbrook, C.C.; Kvien, C.K.; Jogloy, S.; Banterng, P. Accumulation dynamics of starch and its granule size distribution of cassava genotypes at different growing seasons. Agriculture 2020, 10, 380. [Google Scholar] [CrossRef]
  25. Shrivastav, P.; Prasad, M.; Singh, T.B.; Yadav, A.; Goyal, D.; Ali, A.; Dantu, P.K. Role of Nutrients in Plant Growth and Development. In Contaminants in Agriculture; Naeem, M., Ansari, A., Gill, S., Eds.; Springer: Cham, Switzerland, 2002; pp. 43–59. [Google Scholar] [CrossRef]
  26. Rietra, R.P.; Heinen, M.; Dimkpa, C.O.; Bindraban, P.S. Effects of nutrient antagonism and synergism on yield and fertilizer use efficiency. Commun. Soil Sci. Plant Anal. 2017, 48, 1895–1920. [Google Scholar] [CrossRef] [Green Version]
  27. Senbayram, M.; Gransee, A.; Wahle, V.; Thiel, H. Role of magnesium fertilisers in agriculture: Plant–soil continuum. Crop Pasture Sci. 2016, 66, 1219–1229. [Google Scholar] [CrossRef]
  28. Mengel, K.; Kirkby, E.A. Principles of Plant Nutrition; International Potash Institute: Bern, Switzerland, 1987. [Google Scholar]
  29. Gunes, A.; Inal, A.; Aplaslan, M.; Cakmak, I. Genotypic variation in phosphorus efficiency between wheat cultivars grown under greenhouse and field conditions. Soil Sci. Plant Nutr. 2016, 52, 470–478. [Google Scholar] [CrossRef] [Green Version]
  30. Putthacharoen, S.; Howeler, R.H.; Jantawat, S.; Vichukit, V. Nutrient uptake and soil erosion losses in cassava and six other crops in a Psamment in eastern Thailand. Field Crop. Res. 1998, 57, 113–126. [Google Scholar] [CrossRef]
  31. Prajapati, K.; Mod, H.A. The importance of potassium in plant growth—A review. Indian J. Plant Sci. 2012, 1, 177–186. [Google Scholar]
  32. Bender, R.R.; Haegele, J.W.; Ruffo, M.L.; Below, F.E. Nutrient uptake, partitioning, and remobilization in modern, transgenic insect-protected maize hybrids. Agron. J. 2013, 105, 161–170. [Google Scholar] [CrossRef] [Green Version]
  33. Ezui, K.S.; Franke, A.C.; Mando, A.; Ahiabor, B.D.K.; Tetteh, F.M.; Sogbedji, J.; Janssen, B.H.; Giller, K.E. Fertilizer requirements for balanced nutrition of cassava across eight locations in West Africa. Field Crop Res. 2016, 185, 69–78. [Google Scholar] [CrossRef] [Green Version]
  34. De Tafur, S.M.; El-Sharkawy, M.A.; Calle, F. Photosynthesis and yield performance of cassava in seasonally dry and semiarid environments. Photosynthetica 1997, 33, 249–257. [Google Scholar] [CrossRef]
  35. Santanoo, S.; Vongcharoen, K.; Banterng, P.; Vorasoot, N.; Jogloy, S.; Roytrakul, S.; Theerakulpisut, P. Seasonal variation in diurnal photosynthesis and chlorophyll fluorescence of four genotypes of cassava (Manihot esculenta Crantz) under irrigation conditions in a tropical savanna climate. Agronomy 2019, 9, 206. [Google Scholar] [CrossRef] [Green Version]
  36. Cock, J.H.; Porto, M.C.M.; El-Sharkawy, M.A. Water use efficiency of cassava. III. Influence of air humidity and water stress on gas exchange of field grown cassava. Crop Sci. 1985, 25, 265272. [Google Scholar] [CrossRef]
  37. Keating, B.A.; Evenson, J.P.; Fukai, S. Environment effects on growth and development of cassava (Manihot esculenta Crantz) III. Assimilate distribution and storage organ yield. Field Crops Res. 1982, 5, 293–303. [Google Scholar] [CrossRef]
Figure 1. Relative air humidity (%), day length (h); (a) rainfall (mm), solar radiation (MJ m−2 day−1), maximum and minimum air temperatures (°C); (b) during the crop growth period of cassava. ERS = early rainy season, PRS = post rainy season.
Agriculture 11 01199 g001
Table 1. The digestion methods and equipment used for soil physicochemical properties and plant nutrient determination in this study.
ParametersDigestion MethodsEquipment/Methods
Soil analysis
Total nitrogen (%)Micro-Kjeldahl method
(Sulfuric acid; analytical reagent, Merck, Germany)
Auto-Analyzer 3 (Auto Analyzer 3, SEAL Analytical, Norderstedt, Germany)
Available phosphorus
(mg kg−1)
Bray II
(Ammonium fluoride and hydrochloric acid; analytical reagent, Sigma-Aldrich, Darmstadt, Germany)
Spectrophotometer
(U-2900UV/VIS, Hitachi, Tokyo, Japan)
Exchangeable potassium
(mg kg−1)
1N ammonium acetate
(Analytical reagent, Sigma-Aldrich, Darmstadt, Germany)
Flame photometer
(M410 flame photometer, Sherwood, Cambridge, UK)
Exchangeable calcium
(mg kg−1)
1N ammonium acetate
(Analytical reagent, Sigma-Aldrich, Darmstadt, Germany)
Flame photometer
(M410 flame photometer, Sherwood, Cambridge, UK)
Exchangeable magnesium (mg kg−1)1N Ammonium acetate
(Analytical reagent, Sigma-Aldrich, Darmstadt, Germany)
Atomic Absorption Spectrophotometer
(novAA 350, Analytik Jena, Münster, Germany)
Available sulfur (mg kg−1)Calcium dihydrogen phosphate
(Analytical reagent, Sigma-Aldrich, Darmstadt, Germany)
Spectrophotometer
(U-2900UV/VIS, Hitachi, Tokyo, Japan)
pH1:1 H2OpH meter
(F20 Fiveeasy, Mettler-Toledo International Inc., Columbus, OH, USA)
Electrical conductivity
(dS m−1)
1:5 H2OConductivity meter
(Seven Compact S230, Mettler-Toledo International Inc., Columbus, OH, USA)
Organic matter (%) Walkley and Black
Cation exchange capacity
(cmol kg−1)
1N Ammonium acetate/distillation
(Analytical reagent, Sigma-Aldrich, Darmstadt, Germany)
Soil texture Hydrometer
Plant nutrient analysis
Total nitrogen (%)Micro-Kjeldahl method
(Sulfuric acid; analytical reagent, Merck, Germany)
Auto-Analyzer 3
(Auto Analyzer 3, SEAL Analytical, Norderstedt, Germany)
Total phosphorus (%)Wet oxidation
Nitric acid and perchloric acid (analytical reagent, Qrec, New Zealand)
Spectrophotometer
(U-2900UV/VIS, Hitachi, Tokyo, Japan)
Total potassium (%)Wet oxidation
Nitric acid and perchloric acid (analytical reagent, Qrec, New Zealand)
Flame photometer
(M410 flame photometer, Sherwood, Cambridge, UK)
Total calcium (%)Wet oxidation
Nitric acid and perchloric acid (analytical reagent, Qrec, New Zealand)
Atomic Absorption Spectrophotometer
(novAA 350, Analytik Jena, Münster, Germany)
Total magnesium (%)Wet oxidation
Nitric acid and perchloric acid (analytical reagent, Qrec, New Zealand)
Atomic Absorption Spectrophotometer
(novAA 350, Analytik Jena, Münster, Germany)
Total sulfur (%)Wet oxidation
Nitric acid and perchloric acid (analytical reagent, Qrec, New Zealand)
Spectrophotometer
(U-2900UV/VIS, Hitachi, Tokyo, Japan)
Table 2. Soil physicochemical properties at pre-planting and post-planting in the experimental fields at the depths 0–30 cm and 30–60 cm.
Soil Physicochemical PropertiesERS in 2015/16PRS in 2015/16ERS in 2016/17PRS in 2016/17
0–30 cm30–60 cm0–30 cm30–60 cm0–30 cm30–60 cm0–30 cm30–60 cm
Physical Properties
Sand (%)84.983.987.482.492.993.88576
Silt (%)6.87.99.99.05.95.18.99.9
Clay (%)8.38.22.78.61.21.16.114.1
USDA classificationLoamy sandLoamy sandSandLoamy sand
Chemical Properties at Pre-planting
Total N (%)0.020.020.020.010.030.020.030.03
Available P (mg kg−1)85.683.056.040.782.776.885.142.1
Exchangeable K (mg kg−1)42.744.934.734.533.533.933.530.7
Exchangeable Ca (mg kg−1)415450255270367356380444
Exchangeable Mg (mg kg−1)30.031.434.233.552.343.643.139.2
Available S (mg kg−1)54.845.243.249.641.241.439.543.9
pH (1:1 H2O)7.47.56.35.97.37.46.97.4
EC (dS m−1)0.050.070.080.020.060.050.050.03
OM (%)0.420.440.450.310.510.440.510.32
CEC (cmolc kg−1)3.94.15.06.12.93.92.85.6
Chemical Properties at Post-planting
Total N (%)0.020.020.020.010.020.020.030.03
Available P (mg kg−1)85.981.344.537.662.352.481.235.1
Exchangeable K (mg kg−1)34.428.937.330.328.725.028.128.9
Exchangeable Ca (mg kg−1)434429241312406410355400
Exchangeable Mg (mg kg−1)40.541.139.538.739.739.147.247.1
Available S (mg kg−1)44.633.447.947.443.941.939.142.7
pH (1:1 H2O)7.17.05.86.26.96.87.17.2
EC (dS m−1)0.050.050.030.030.040.030.030.02
OM (%)0.500.470.390.310.340.260.490.27
CEC (cmolc kg−1)3.33.73.55.64.45.13.35.3
ERS = early rainy season; PRS = post rainy season; N = nitrogen; P = phosphorus; K = potassium; Ca = calcium; Mg = magnesium; S = sulfur; EC = electrical conductivity; OM = organic matter; CEC = cation exchange capacity.
Table 3. Nutrient accumulation rates (g accumulation m−2 day−1) of three cassava genotypes in the early rainy seasons (ERS) and post rainy seasons (PRS) with full irrigation.
MAPNF-TestPF-TestKF-TestCaF-TestMgF-TestSF-Test
ERSPRSERSPRSERSPRSERSPRSERSPRSERSPRS
g accumulation m−2 day−1
CMR38-125-77
1–30.15 a0.12 a*0.03 a0.01*0.18 a0.08 b**0.05 b0.06 ans0.02 b0.02 bns0.010.01ns
3–60.11 a0.10 ans0.02 a0.02ns0.10 b0.14 a*0.07 a0.07 ans0.04 a0.02 b*0.010.01ns
6–90.03 b0.06 b*0.02 b0.02ns0.02 c0.10 a**0.05 b0.03 b*0.01 b0.03 a**0.010.00ns
9–120.01 b0.12 a**0.01 c0.02**0.08 b0.04 c**−0.00 c0.02 b*0.02 b0.02 bns0.00−0.00ns
KU50
1–30.17 a0.10 a*0.03 a0.01 b**0.21 a0.08 b**0.10 a0.05 ans0.03 a0.02 bns0.010.01ns
3–60.11 b0.09 ans0.02 b0.02 ans0.07 b0.12 a**0.06 b0.06 ans0.04 a0.02 b*0.010.01ns
6–90.02 c0.06 b*0.02 a0.02 ans0.05 b0.13 a**0.06 b0.03 b*0.01 b0.03 a**0.010.00ns
9–12−0.03 c0.08 b**0.01 c0.02 a*0.04 b0.01 c*−0.04 c0.00 cns0.01 b0.04 a*0.000.00ns
RY11
1–30.15 a0.11 a*0.03 a0.01 c*0.17 a0.08 b*0.07 a0.06 bns0.020.02ns0.010.01ns
3–60.09 b0.10 ans0.01 b0.02 ans0.08 b0.13 a*0.08 a0.13 a*0.020.03ns0.010.01ns
6–90.02 c0.03 b*0.01 b0.02 ab*0.03 b0.14 a**0.08 a0.01 c**0.010.02*0.00−0.00ns
9–120.06 c0.13 a**0.01 b0.01 bns0.10 b0.01 c*0.03 b0.03 cns0.020.02ns0.010.00ns
ERS = early rainy season; PRS = post rainy season; N = nitrogen; P = phosphorus; K = potassium; Ca = calcium; Mg = magnesium; S = sulfur; KU50 = Kasetsart 50; RY11 = Rayong 11. Means in the same column with the same letters in each cassava genotype are not significantly different by LSD (p < 0.05). F-test was used to compare the difference between planting dates; ns, * and ** = non-significant, significant at p < 0.05 and significant at p < 0.01.
Table 4. Percent of nutrient removal from the soil by the storage roots of three cassava genotypes in the early rainy season (ERS) and post rainy season (PRS) with full irrigation.
MAPNF-TestPF-TestKF-TestCaF-TestMgF-TestSF-Test
ERSPRSERSPRSERSPRSERSPRSERSPRSERSPRS
CMR38-125-77
310.9 c15.3 c*9.4 c17.1 b**12.7 d27.5 b**8.8 c4.1 b*6.7 c10.4 bns9.9 c9.4 cns
623.7 b34.8 b**23.7 b42.7 a**33.5 c51.8 a**13.3 b8.2 b*18.1 b20.7 abns23.9 b20.1 bns
930.8 a38.3 a*30.0 a36.6 a**43.2 b51.0 a*16.3 a12.7 a*22.8 b25.0 ans31.7 a34.7 ans
1236.1 a44.4 a*32.3 a41.6 a**51.5 a56.0 ans17.6 a14.8 a*31.5 a28.1 ans31.5 a17.9 b**
KU50
37.7 c17.4 b**7.8 c20.6 c**9.2 c34.6 b**4.0 b5.0 bns5.6 b11.2 b*8.3 c17.4 c**
615.8 b32.0 a**23.7 b42.6 a**32.2 b52.2 a**7.0 b6.9 bns17.0 ab19.7 abns20.2 b21.7 bns
927.2 a34.3 a*29.6 a34.0 b*45.0 a46.2 a*10.5 a8.5 abns22.0 a23.5 ans30.9 a34.9 ans
1224.7 a34.9 a*26.0 a39.4 a*43.4 a57.3 a**12.4 a15.1 a*22.2 a22.6 ans27.7 a25.4 bns
RY11
37.27 d9.5 dns6.3 d12.5 b*9.7 c21.6 c**7.0 b3.6 b*5.8 c8.1 cns7.6 c5.4 cns
614.93 c19.9 c*19.0 c26.6 a*29.6 b32.1 bns12.7 a2.8 b**15.3 b11.9 bns15.1 b9.9 b**
925.49 b26.8 bns30.0 a28.9 ans42.7 a39.5 ans13.0 a8.4 ab*19.0 ab19.6 ans25.8 a20.5 ans
1233.36 a30.4 ans29.6 a33.3 a*47.8 a44.7 ans13.1 a12.0 a*24.5 a20.2 ans27.2 a12.0 b**
ERS = early rainy season; PRS = post rainy season; N = nitrogen; P = phosphorus; K = potassium; Ca = calcium; Mg = magnesium; S = sulfur; KU50 = Kasetsart 50; RY11 = Rayong 11. Means in the same column with the same letters in each cassava genotype are not considered significantly different by LSD (p < 0.05). F-test was used to compare the difference between planting dates; ns, * and ** = non-significant, significant at p < 0.05 and significant at p < 0.01. Storage root dry weights at final harvest for CMR38-125-77, KU50 and RY11 were 1810, 1244 and 1597 g m−2, respectively, for the crops planted in ERS and were 2253, 2113 and 1604 g m−2 for the crops planted in PRS.
Table 5. Storage root dry weight and biomass (g m2) of three cassava genotypes in the early rainy season (ERS) and post rainy season (PRS) with full irrigation.
GenotypesStorage Root Dry Weight (g m2)Biomass (g m2)
ERSPRSF-TestERSPRSF-Test
CMR38-125-771810 a2253 a**3280 a3824 a**
KU501244 b2113 a**2831 b3807 a**
RY111597 ab1604 bns3046 ab3353 b*
Mean15501990**30523661**
ERS = early rainy season; PRS = post rainy season; KU50 = Kasetsart 50; RY11 = Rayong 11. Means in the same column with the same letters are not considered significantly different by LSD (p < 0.05). F-test was used to compare the difference between planting dates; ns, * and ** = non-significant, significant at p < 0.05 and significant at p < 0.01.
Table 6. Nutrient use efficiency (NUE) for the storage roots and biomass of three cassava genotypes at 12 MAP in the early rainy season (ERS) and post rainy season (PRS) with full irrigation.
ElementGenotypesNUE for Storage RootsNUE for Biomass
ERSPRSF-TestERSPRSF-Test
NCMR38-125-7774 a70 bns135 a120ns
KU5059 b78 b*113 a141*
RY1166 ab125 a**58 b120*
PCMR38-125-77309 a337 a*561 a641**
KU50212 b353 a**406 b637**
RY11315 a307 bns600 a642*
KCMR38-125-7762 a72 a*112 a122*
KU5047 b73 a**90 b131*
RY1154 b52 bns103 b110ns
CaCMR38-125-77128 a158 a*232 a268 a*
KU5086 b177 a**165 b319 a**
RY1172 b79 bns138 b166 b*
MgCMR38-125-77238 a285 a*432 a483 a*
KU50165 b213 b**316 b384 b*
RY11253 a220 bns499 a469 ans
SCMR38-125-77865 a1529**1568 a2595 b**
KU50617 b1708**1181 b3078 a**
RY11685 b1120**1306 b2340 b**
ERS = early rainy season; PRS = post rainy season; N = nitrogen; P = phosphorus; K = potassium; Ca = calcium; Mg = magnesium; S = sulfur; KU50 = Kasetsart 50; RY11 = Rayong 11; NUE = nutrient use efficiency. Means in the same column with the same letters in each element are not considered significantly different by LSD (p < 0.05). F-test was used to compare the difference between planting dates; ns, * and ** = non-significant, significant at p < 0.05 and significant at p < 0.01.
Table 7. The nutrient uptake ratios of three cassava genotypes at final harvest, planted in the early rainy season (ERS) and post rainy season (PRS) with full irrigation.
NutrientEarly Rainy SeasonPost Rainy Season
CMR38-125-77KU50RY11CMR38-125-77KU50RY11
N/K0.830.800.821.030.900.91
P/K0.200.220.170.190.210.17
S/P0.360.340.460.250.210.27
Mg/K0.260.280.210.250.340.24
Ca/Mg1.861.923.651.801.202.77
K/Ca2.071.831.332.192.441.51
P/Ca0.410.410.230.420.500.26
Publisher’s Note: MDPI stays neutral with regard to jurisdictional claims in published maps and institutional affiliations.

