Article

Research on the Spatial Network Structure and Influencing Factors of the Allocation Efficiency of Agricultural Science and Technology Resources in China

1
School of Economics and Management, Northwest A&F University, Yangling District, Xianyang 712100, China
2
School of Economics and Management, South China Agricultural University, Guangzhou 510006, China
*
Author to whom correspondence should be addressed.
Agriculture 2021, 11(11), 1170; https://doi.org/10.3390/agriculture11111170
Submission received: 18 October 2021 / Revised: 12 November 2021 / Accepted: 17 November 2021 / Published: 19 November 2021

Abstract

:
The allocation efficiency of China’s agricultural science and technology resources (ASTR) varies in different regions and has a complicated spatial distribution pattern. To visually study whether there are correlations and mutual influences between the allocation efficiency of different regions, we use social network analysis methods (SNA). The study found that: (i) China’s allocation efficiency of ASTR has significant spatial correlation and spillover effects. The overall network density is declining. (ii) The spatial correlation network has significant regional heterogeneity. Some eastern provinces play “intermediaries” and “bridges” in the network. (iii) Geographical proximity, differences in economic development levels, industrial structure levels, and differences in urbanization have a significant impact on the formation of spatial association networks.

1. Introduction

The fundamental way out of agricultural development lies in the progress of science and technology [1]. Whether ASTR can be effectively used directly affects the development level of modern agriculture [2]. Since the reform and opening up, China’s agriculture and rural development has made a major breakthrough [3]. The agricultural quality, efficiency and comprehensive competitiveness have been greatly improved [4]. However, due to the differences in resource endowment, the flow of production factors and the gradual tightening of environmental constraints, the regional economic development and urbanization are significantly unbalanced, which leads to the spatial distribution pattern of China’s agricultural development level and agricultural science and technology innovation ability, that is, the eastern provinces are stronger than the western ones (“2020 China Regional Agricultural Science and Technology Innovation Ability Report”). In this case, it is difficult to allocate ASTR effectively among regions, resulting in the decline of agricultural marginal output. Therefore, speeding up the transformation of economic development mode and realizing the transformation of new and old kinetic energy has become the main way to improve the allocation efficiency [5]. The characteristics of ASTR are diversity, demand and scarcity. How to allocate various elements including human resources, financial resources, material resources and information to specific objects and different development directions, and obtain agricultural scientific and technological output, is also particularly important [6]. With the advancement of marketization, the urban-rural dual structure barriers are gradually broken, and the free flow of resources between regions is gradually causing ASTR to show a certain degree of relevance on the spatial scale, forming a complex spatial association network structure [7,8]. For example, there are fewer agricultural science and technology personnel in the western region, leading to lagging agricultural development [9]. To increase agricultural output in the western region, it is necessary to transfer agricultural science and technology personnel from the eastern region to meet the agricultural development of the western region [10]. The main contribution of this paper is that through the analysis of SNA, it is possible to fully understand the changes in the current network pattern of China’s allocation efficiency of ASTR, and understand the spatial transmission mechanism of the use of ASTR between regions. This research has important theoretical significance for grasping the direction of cross-regional coordinated development of ASTR and formulating differentiated science and technology development policies.
The spatial correlation network of the allocation efficiency of ASTR is a network type relationship that is gradually formed due to the flow and interaction of the input and output of ASTR in the geographical space. The focus of China’s ASTR allocation is the coordination of ASTR among provinces, but the geographical spaces are not adjacent to each other, which does not hinder the close spatial correlation of ASTR allocation among regions. Based on the data of agricultural scientific research institutions of 31 provinces in China from 2009 to 2018, this paper uses the modified gravity model to calculate the spatial correlation of inter-provincial agricultural science and technology resource allocation efficiency and constructs a corresponding “relational data” spatial correlation network matrix, uses the SNA method to comprehensively investigate the overall characteristics of the spatial correlation network of agricultural science and technology resource allocation efficiency and the role of individuals in the network, and further explores the driving factors of the formation of the spatial correlation network of agricultural science and technology resource allocation efficiency in China using the method of QAP. The purpose is to comprehensively describe the formation law and influencing factors of the spatial correlation network structure of the allocation efficiency of China’s ASTR.
Existing research provides a theoretical basis and methodological guidance for this research. As early as 1776, Adam Smith elaborated two ways of economic growth: increasing the amount of productive labor and improving the efficiency of labor [11]. By the middle of the 20th century, Robert Solow, an American economist, established an economic growth model within the framework of neoclassical economics. According to Solow’s model, after reaching the equilibrium point, the source of economic growth is labor growth and technological progress [12]. The rational allocation of resources is the basis of technological progress, and the allocation structure has a profound impact on the rational allocation of resources. Jorgenson et al. (1978) and Leoncini et al. (1996) found that the capacity of science and technology resource allocation affects economic growth on the basis of the data of economic growth in the United States, Japan, Germany and Italy, and different science and technology policies and economic policies among countries also has a very important impact on the effect of science and technology resource allocation [13,14]. The scarcity and importance of ASTR determine the unbalanced distribution of ASTR in different regions. Existing studies also show that the allocation of agricultural resources has obvious regional differences and spatial correlation [15]. However, the existing literature mainly studies the spatiotemporal dynamic distribution and spatial agglomeration spillover effect of science and technology resources from the methods of spatial exploratory data analysis (ESDA) and econometrics. For example, Ying believes that China has a spatial spillover effect of “core area to peripheral area”, and used the spatial lag model to examine the role of labor, capital, FDI and other factors on China’s regional economic growth. He pointed out that China’s economic growth exhibits strong mutual influences between regions [16]. Fan Fei et al., according to the connotation and structure of science and technology resources and some relevant data of more than 286 cities at prefecture level and above during 2001–2010, using a modified DEA method, determined the efficiency of science and technology resource allocation of different cities in different periods, and uncovered the distributional difference and change law of allocation efficiency in the time-space dimension [17]. The traditional ESDA method and spatial measurement technology are limited to the measurement of the proximity or distance relationship in geographic space between regions, and it is difficult to dynamically grasp the structural characteristics of the spatial correlation of the allocation of ASTR as a whole. With the improvement of China’s agricultural market system, the spatial cross-regional flow and intercommunication of agricultural production factors have become more obvious. The spatial association of ASTR has the structural characteristics of a complex network, which causes the spatial association constitute a two-to-one relationship. The “relational data” matrix network makes it difficult for the existing traditional measurement models based on “attribute data” to fully reveal the overall network structure and spatial clustering mode of “relational data”. The social network analysis method (SNA) can break through the limitations of “attribute data” analysis and carry out effective analysis on the network characteristics of “relational data” [18]. This method is an effective means to study the network structure characteristics of relational data, and is gradually becoming a new research paradigm in the fields of economics, management, etc. [19]. For example, the application of social network analysis methods is mainly concentrated on the study of the global economic system. Smith (1992) believes that the global economic system is a network system with spatial overlapping effects, and found that the level of economic development of various countries is closely related to their position in the world economic system network [20]. Haythornthwaite (1996), Otte et al. (2002), Anne L. J. Ter Wai (2009), Schiavo et al. (2010) and Cassi et al. (2012) studied the network relationship and its characteristics of information exchange [21], information sciences [22], economic geography [23], international trade [24] and financial integration [25]. However, few studies have applied it in the field of agricultural science and technology resource allocation and province association and interaction.

2. Methodology and Data Source

2.1. SBM Model

Since the DEA model cannot incorporate the slack variables of input and output into the efficiency evaluation at the same time, the results may be biased [26]. To overcome this shortcoming, the efficiency of the allocation of ASTR was measured using the SBM model proposed by Tone [27]. The specific model is as follows:
ρ = min 1 1 n i = 1 n t i x i 0 1 + 1 t 1 + t 2 r = 1 t 1 t r g y r 0 g + r = 1 t 2 t r b y r 0 b s . t . x 0 = X δ + t y 0 g = Y g δ t g y 0 b = Y b δ + t b t 0 , t g 0 , t b 0 , δ 0
In the formula, X, Yg and Yb, respectively, represent the input and output factors of each province; t, tg and tb, respectively, represent the slack variables of inputs, expected outputs, and undesired outputs; r represents the r-th decision-making unit; r0 represents the demand decision unit; r represents the r-th DMU; r0 represents the demand DMU. The objective function ρ is strictly decreasing, and 0 < ρ ≤ 1. If and only if t = 0, tg = 0 and tb = 0, i.e., ρ = 1, the decision-making unit is valid; when ρ < 1, that is, at least one of t, tg and tb is not zero, the decision-making unit is invalid, which means it is necessary to improve the input and output.
ASTR mainly refers to the collection of human resources, financial resources, material resources, information and other resource elements that can promote the development of agricultural economy in research and development activities. This research takes China’s 31 provincial agricultural research institutions from 2009 to 2018 as the research object. Using Wang’s (2020) related studies as a reference to construct an index system for the allocation efficiency of ASTR in Table 1 [28].
The index data are from the “Compilation of National Agricultural Science and Technology Statistics”. These data come from the Ministry of Science and Technology of China. They are classified and printed publicly by the relevant personnel of the Ministry of Agriculture of China. The “China Population and Employment Statistical Yearbook” contains data reflecting China’s population and employment status. The relevant staff of the National Bureau of Statistics of China collected the main data on the population employment statistics of the whole country and all provinces. The “China Statistical Yearbook” contains statistical data on all aspects of the economy and society of the whole country and provinces, as well as many important historical years and major national statistics in recent years.

2.2. The Modified Gravitational Model

The spatial correlation network of the allocation efficiency of ASTR refers to the collection of interregional relations between the efficiency of the use of ASTR in different provinces, and is also the basis for social network analysis. In the correlation network, each province is a “node” in the network, and the spatial correlation between the provinces in the allocation of ASTR is a “line” in the network. These nodes and lines constitute the spatial correlation network between provinces, and the strength of the relationship reflects the strength of the correlation [29]. The existing literature generally uses gravity model and VAR Granger causality analysis method to determine the spatial relationship, but the VAR model is too sensitive to the choice of the lag order and is not suitable for data with a short time span [30], while the gravity model has a stronger applicability, and can not only take into account the scale and regional distance, but also reveal the evolution characteristics of spatial correlation, which is more suitable for analyzing the aggregate cross-section data [31]. This paper uses the improved gravity model to measure the spatial correlation in various provinces. The specific model is as follows:
E s . t = K s . t H s J s L s 3 H t J t L t 3 Z s . t 2 , K s . t = L s L s + L t , Z s . t = z s . t p s p t
Es.t is the spatial correlation distance of the allocation efficiency of ASTR between province s and province t; Hs and Ht are the total population of province s and province t, respectively; Js and Jt are the total GDP of province s and province t, respectively; Ks.t is the contribution rate of the allocation efficiency of ASTR between province s and province t; Ls and Lt represent the development index of province s and province t, respectively; Zs.t is the economic geographic distance of province s and province t; Zs.t represents geographic distance between the capital cities of provincial s and provincial t; and ps and pt are the per capita GDP of provinces s and province t, respectively.
From Formula (2), the gravitational matrix (Rm,n) 31 × 31 of the allocation efficiency of ASTR in each province can be measured. In view of the fact that there may be a certain threshold for the strength of the interrelationship between provinces, the average value of each row of the gravity matrix is calculated as the threshold. When the element of each row is above the threshold, that is, greater than 1, it means that there is a correlation between the two provinces; conversely, when it is below the threshold, that is, less than 0, it means that there is no relationship between the two provinces. At the same time, because the spatial correlation measured by the traditional gravity model is not directional, the research uses the proportion of the allocation efficiency of ASTR in the two related provinces to modify the gravitational coefficient, so that we can get a 0–1 type (Rm,n) 31 × 31 asymmetrical matrix of the spatial correlation network for the allocation efficiency of ASTR.

2.3. Social Network Analysis SNA

Social Network Analysis (SNA) is a quantitative analysis method used to describe the relationships between members in the network structure and the impact of various relationship modes on the members in the structure. In recent years, it has been widely disseminated and applied in the fields of sociology, management and economics [25,32]. For the overall structural characteristics of the spatially correlation network of agricultural science and technology resource allocation efficiency, it can be measured by four indicators: network density, network correlation, network level and network efficiency [33]. The characteristics of individual networks mainly use centrality to study the status and role of each member of the associated network in the network (Table 2 and Table 3), including degree centrality, close to centrality, middle centrality [34].
Block model analysis is a method of spatial clustering of agricultural science and technology resource allocation efficiency in social network analysis. By calculating the correlation between the income (received) and spillover (sent) between the internal and external plates of each plate, the expectation and actual relationship ratio contained within each plate, and analyzing and judging the status, role and function of each plate in the associated network, reflecting the spatial clustering characteristics of each node and the transmission mechanism [33]. With reference to the definition and classification standards of existing studies in Table 4, this paper divides the plates in the spatial correlation network of the ASTR allocation efficiency into four types (Table 5) [35].

2.4. Quadratic Assignment Procedure (QAP)

The formation and changes of the spatial correlation network of the allocation efficiency of ASTR are the result of the interaction of various factors. This article chooses the QAP (Quadratic Assignment Procedure) method to analyze the driving forces that affect the spatial correlation of the efficiency of the allocation of ASTR across provinces [36]. QAP is a method of hypothesis testing that studies the relationship between two types of “relationships”, and is a method of comparing the similarity of each element in two matrices [37]. This method is based on the replacement of the existing matrix data, compares all the elements of the matrix, and then obtains the correlation coefficient between the two types of matrices, and carries out non-parametric tests on the correlation coefficient [38,39,40]. Since there is no need to assume that the independent variables are independent of each other, it is more effective and robust than the parametric method [41].
QAP correlation analysis mainly examines the correlation between two matrixes [42]. Based on the matrix replacement, the correlation coefficient is given by comparing the similarity of each grid value in the two square matrices, and then the correlation coefficient is tested non-parametrically [43]. The specific approach has three steps: (1) Calculate the correlation coefficient between the known long vector of two matrices. (2) Randomly replace the rows and corresponding columns of one matrix at the same time, and then calculate the correlation coefficient between the replaced matrix and the other matrix. Repeat this calculation process enough times to get a correlation coefficient distribution. It can be seen that the multiple correlation coefficients calculated after this random replacement are greater than or equal to the ratio of the observed correlation coefficients calculated in the first step [44,45,46]. (3) Finally, compare the calculated distribution of the actually observed correlation coefficient with the distribution of the correlation coefficient calculated according to random rearrangement. Investigate whether the correlation coefficient falls into the rejection domain or the acceptance domain, and then judge the correlation [47,48,49,50].
The principle of QAP regression analysis is the same as QAP correlation analysis [51,52,53,54]. Using QAP regression analysis to study the regression relationship between multiple independent variable matrices and a dependent variable matrix can effectively avoid the multicollinearity problem when using traditional measurement methods [55]. The estimation process is divided into two steps: (1) The long vector elements corresponding to the dependent variable matrix and the argument matrix are estimated by general multiple regression analysis, getting the actual parameter estimate and coefficient of determination R2. (2) The rows and columns of the argument matrix are randomly replaced to re-estimate, retaining all the estimation coefficients and the coefficient of determination R2, and repeating enough multiple displacement steps to calculate the proportion of random displacements greater than or equal to the actual parameter estimates in the number of random displacements [56,57,58]. Finally, the statistical standard error is estimated and the significance test is performed [59,60].
This article mainly considers selecting the following indicators to investigate the influencing factors of the spatial correlation network of allocation efficiency of ASTR:
(1) Geographical spatial proximity (Distance): The first law of geography states that the closer the geographical location is, the stronger the relationship is [61]. That is to say, the neighboring provinces may have a more significant relationship and spillover effect in the allocation of ASTR. Block model analysis also shows that there are obvious regional characteristics between the plates, which are characterized by the provincial Rook adjacency weight matrix, assigning adjacent provinces to 1 and non-adjacent one to 0 (assuming Hainan and Guangdong are adjacent). (2) Differences in economic development level (Pgdp): Spatial correlation between different provinces in the allocation of ASTR is closely related to local economic development level. Differences in economic development levels can lead to differences in the local agricultural research environment [62]. The provincial per capita GDP differences are used to characterize differences in the level of economic development. (3) Regional information level difference (Inform): Agricultural informatization has an irreplaceable influence on the development of the agricultural economy. Agricultural information can break the constraints of time and space, affect the efficient reorganization of agricultural production factors between different provinces, and accelerate the integration of cross-regional agricultural technology resources, and thus has an impact on the allocation efficiency of ASTR in multiple regions [63,64]. This paper uses the difference of the sum of mobile phones, color TVs, and computers to characterize the differences in the degree of regional informatization. (4) Industrial structure upgrade difference (Indus): The industrial structure upgrade is mainly the gradual upgrade of the national economy from primary industry to tertiary industry [65,66,67]. Therefore, the process of industrial structure transfer and upgrade will change the agriculturled economic growth mode and gradually increase the importance of the allocation of scientific and technological resources, as a result, affecting the allocation efficiency of agricultural scientific and technological resources in the region, which in turn affects the correlation in different regions. The difference in the proportion of the tertiary industry in the provinces in the GDP is used to characterize the differences in the industrial structure between provinces. (5) Differences in urbanization development status (Urban): The development of urbanization will promote the flow of agricultural population and then promote the exchange of agricultural production knowledge in neighboring regions, promote the agricultural development of neighboring regions, and affect the relationship of agricultural production between regions [68]. The difference in urbanization rate is used to characterize the difference in urbanization development. (6) Differences in the size of rural labor force (Labor) and differences in agricultural mechanization services (Mech): Both the agricultural labor force and the total power of agricultural machinery are the most important factors affecting agricultural production [69,70]. The scale of the rural labor force and the cross-regional work of agricultural machinery services also affect the spatial correlation of agricultural production between regions. The difference in the number of agricultural employees and the difference in the total power of agricultural machinery are used to characterize the difference in the scale of rural labor force and the difference in agricultural mechanization services.
The variable in the formula (“F = f (Distance, Pgdp, Indus, Inform, Indus, Urban, Labor, Mech)”) represents the relationships between the data, and is represented by a series of matrices. The dependent variable F represents the correlation matrix of the allocation efficiency of provincial ASTR; Distance is the adjacency weight matrix; Distance, Pgdp, Indus, Inform, Indus, Urban, Labor, Mech are relationship matrixes constructed for the provincial differences of various variables. The relevant data of 31 provinces from 2009 to 2018 come from the “Compilation of Agricultural Statistics” and “China Statistical Yearbook”.

3. Results

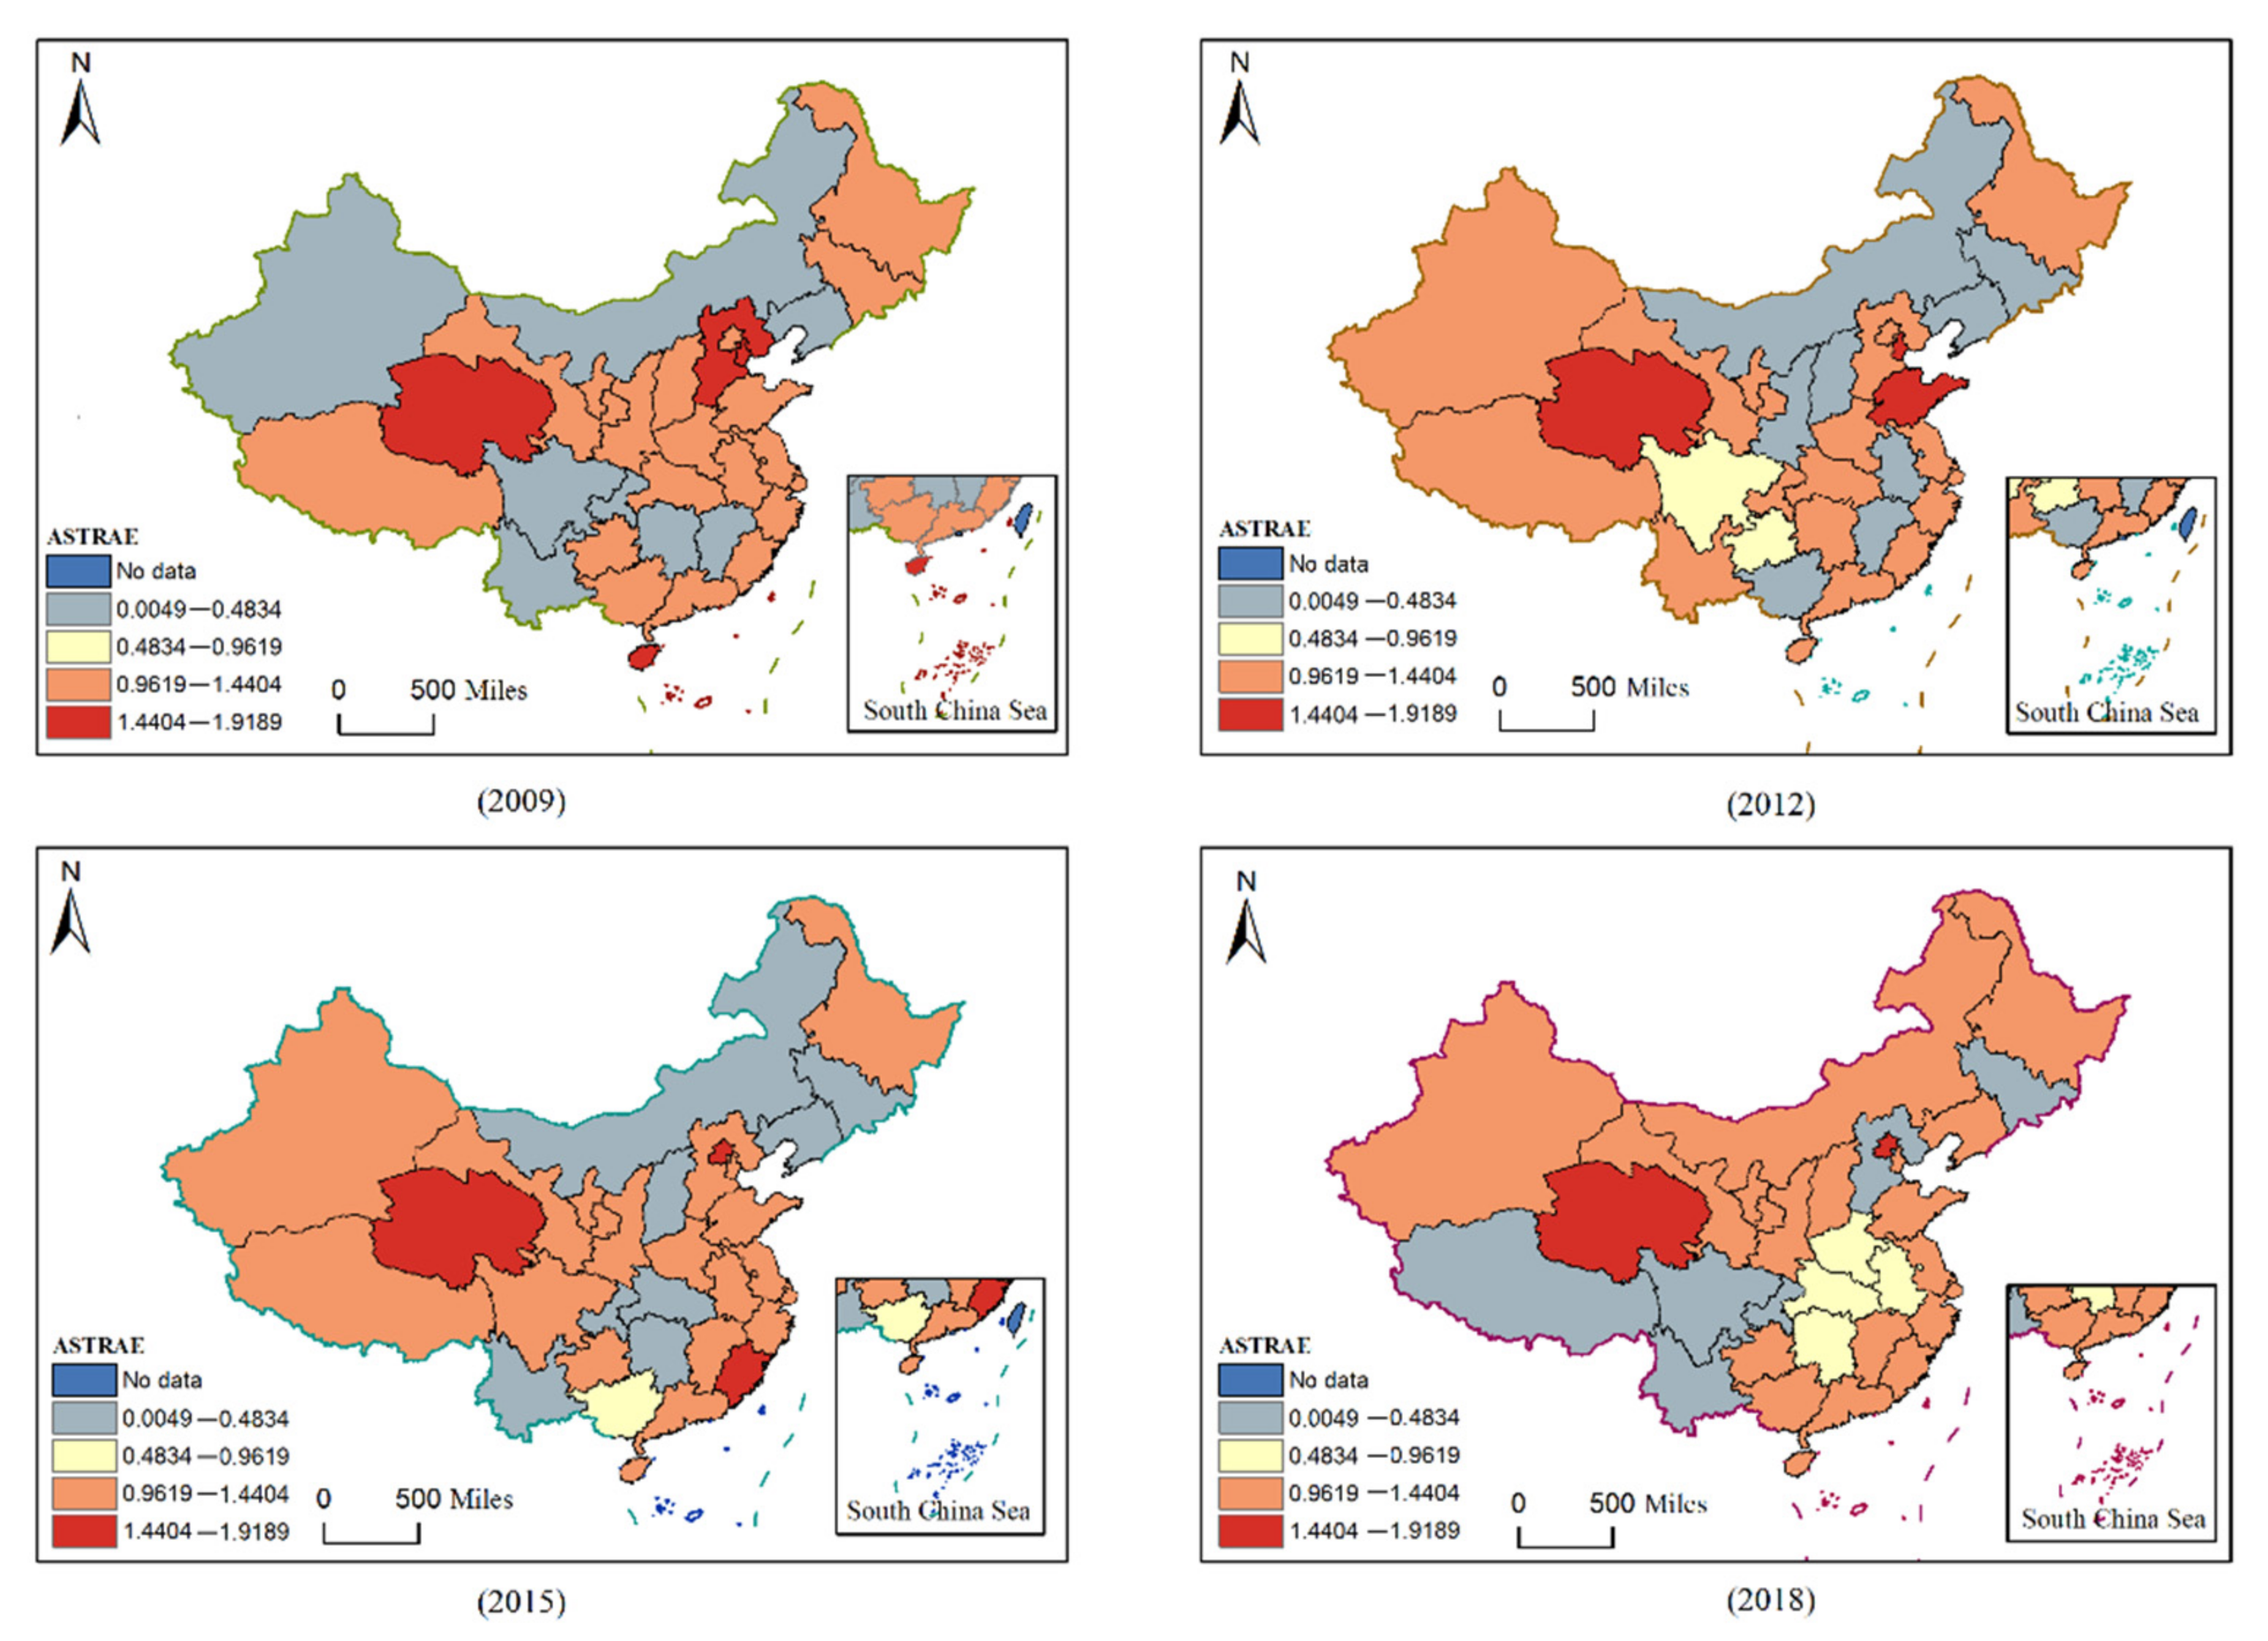
3.1. Analysis of Allocation Efficiency

This paper uses the provincial panel data of agricultural research institutions from 2009 to 2018, uses the SBM model to measure the efficiency of China’s agricultural science and technology resource allocation, and uses ArcGIS software to map the temporal and spatial evolution of efficiency the agricultural science and technology resource allocation in 2009, 2012, 2015 and 2018, and a comparative analysis of the allocation efficiency of ASTR in different provinces (Figure 1). From an overall perspective, China’s overall agricultural science and technology resource allocation efficiency has gradually improved from 2009 to 2018, and the allocation efficiency in various provinces has also increased significantly, but in terms of actual development, the overall allocation efficiency level still has a significant room for improvement. From the perspective of different regions, the allocation of ASTR in China shows obvious regional distribution differences. The allocation efficiency in the central and western regions is significantly better than that in the eastern regions. Increasing the input of agricultural science and technology human and financial resources is of great significance for improving the output and allocation efficiency of agricultural science and technology in the central and western regions.

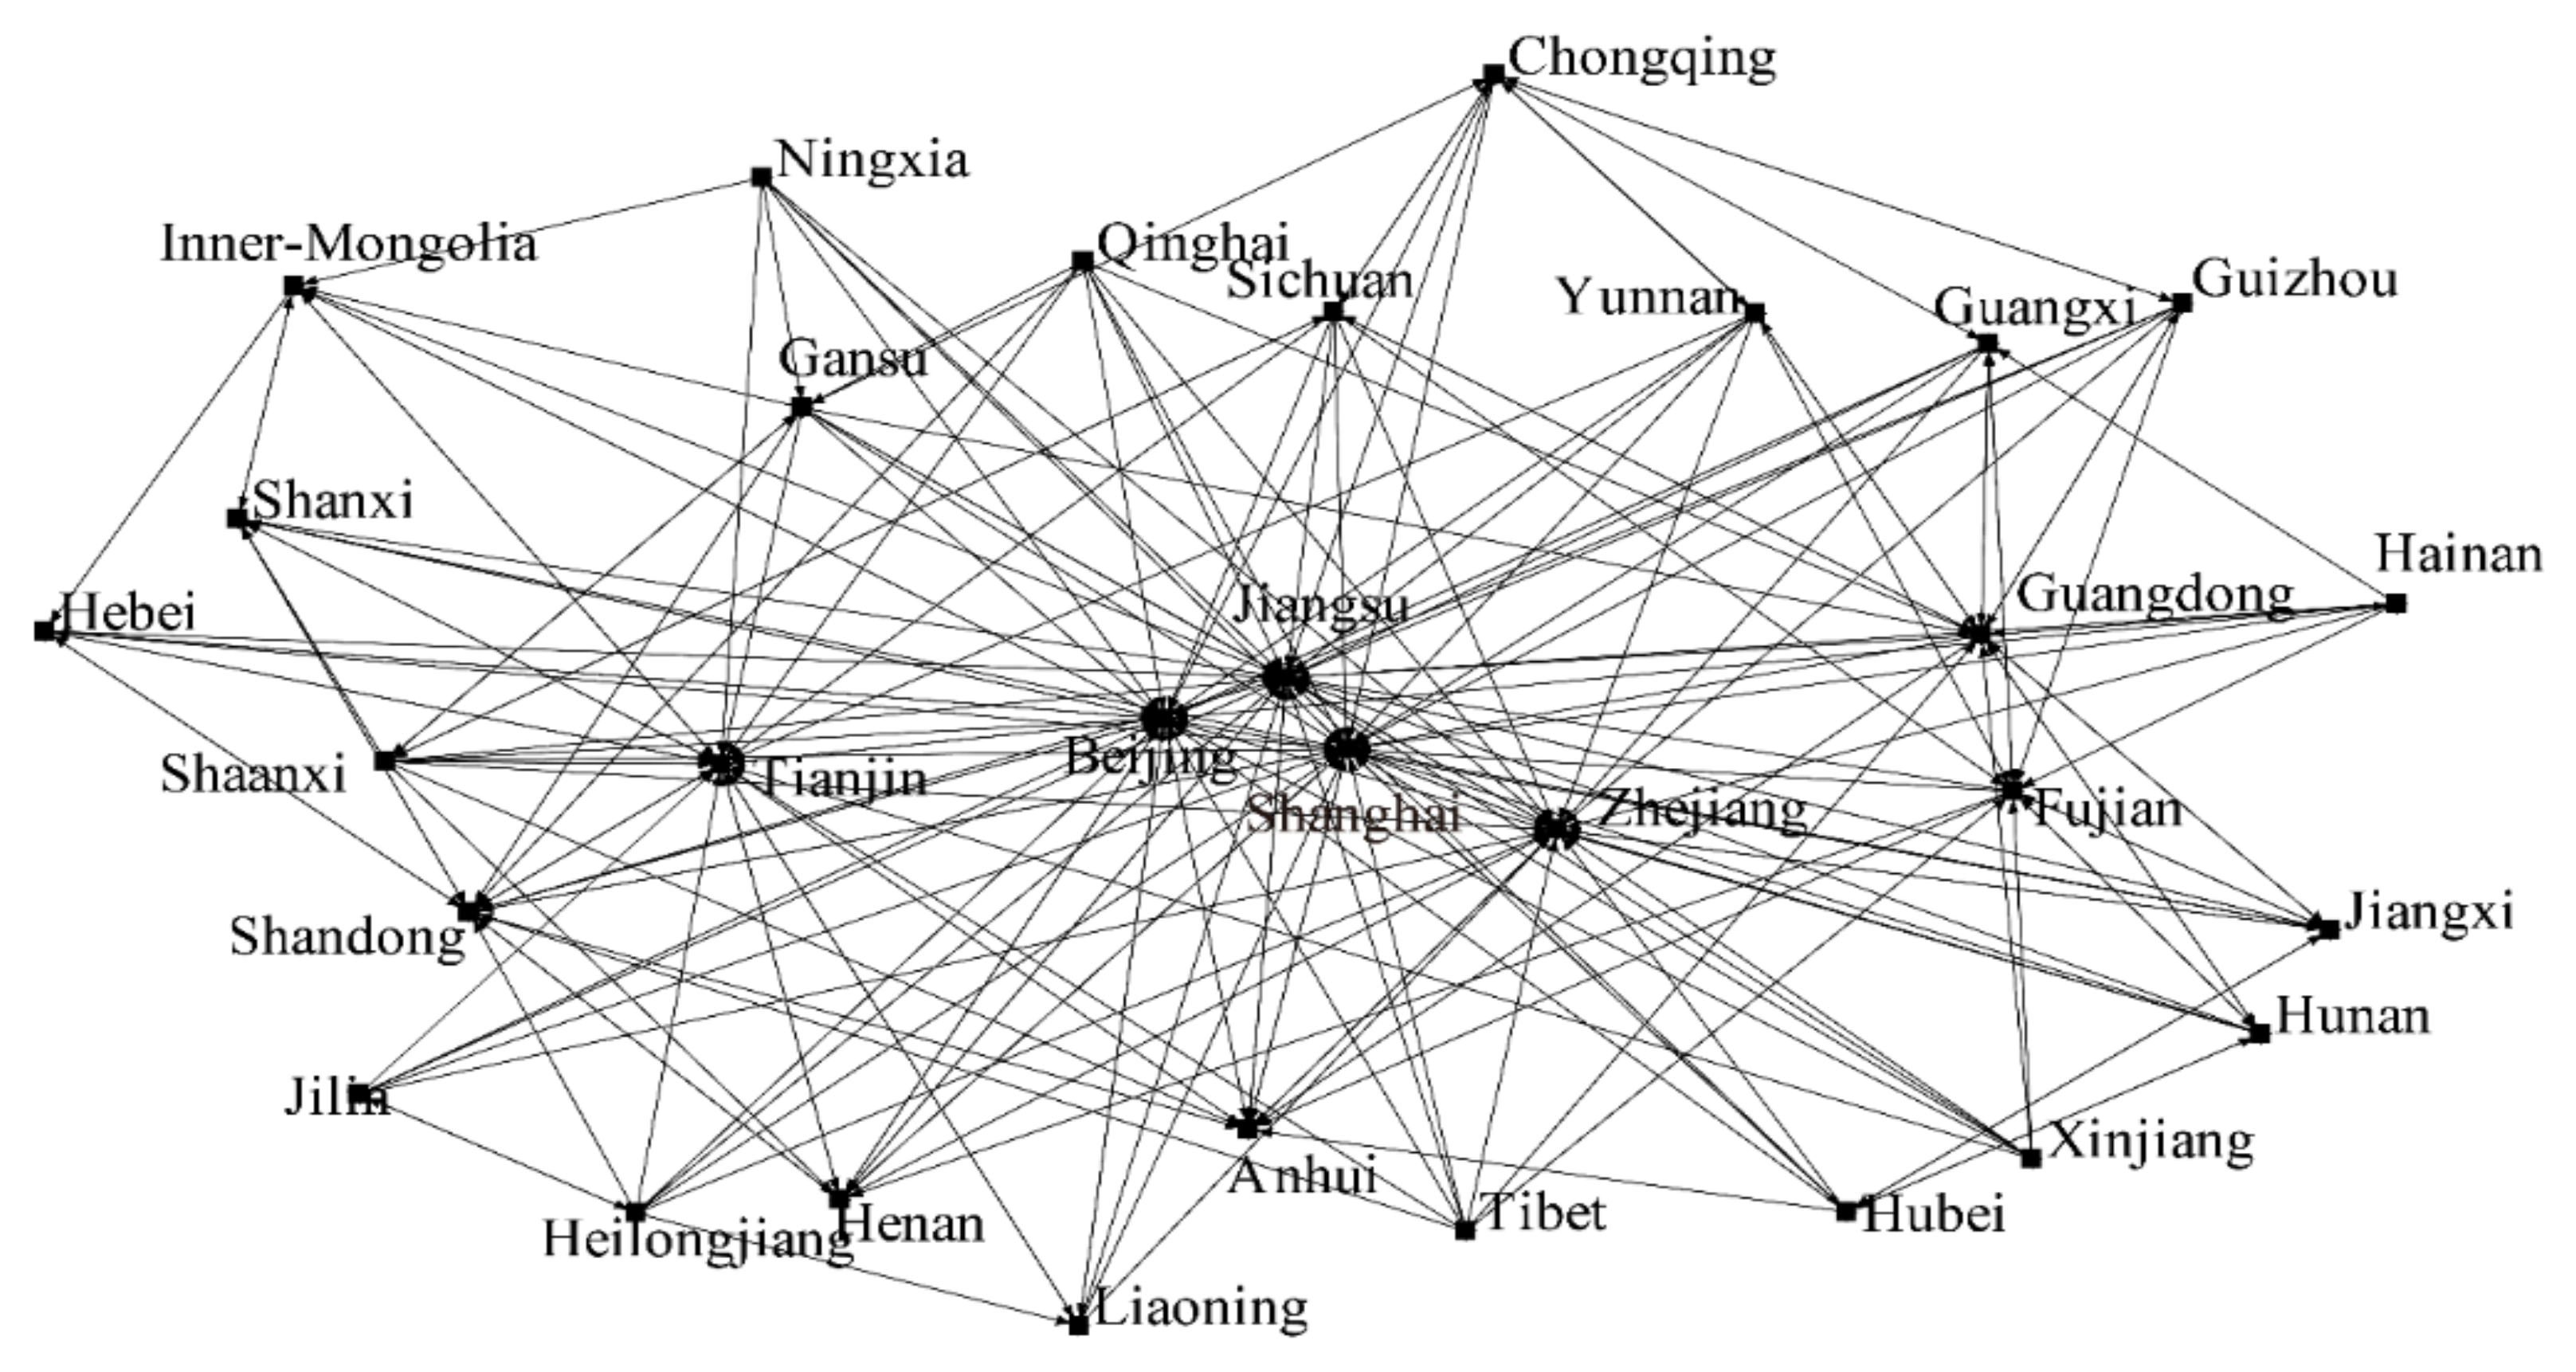
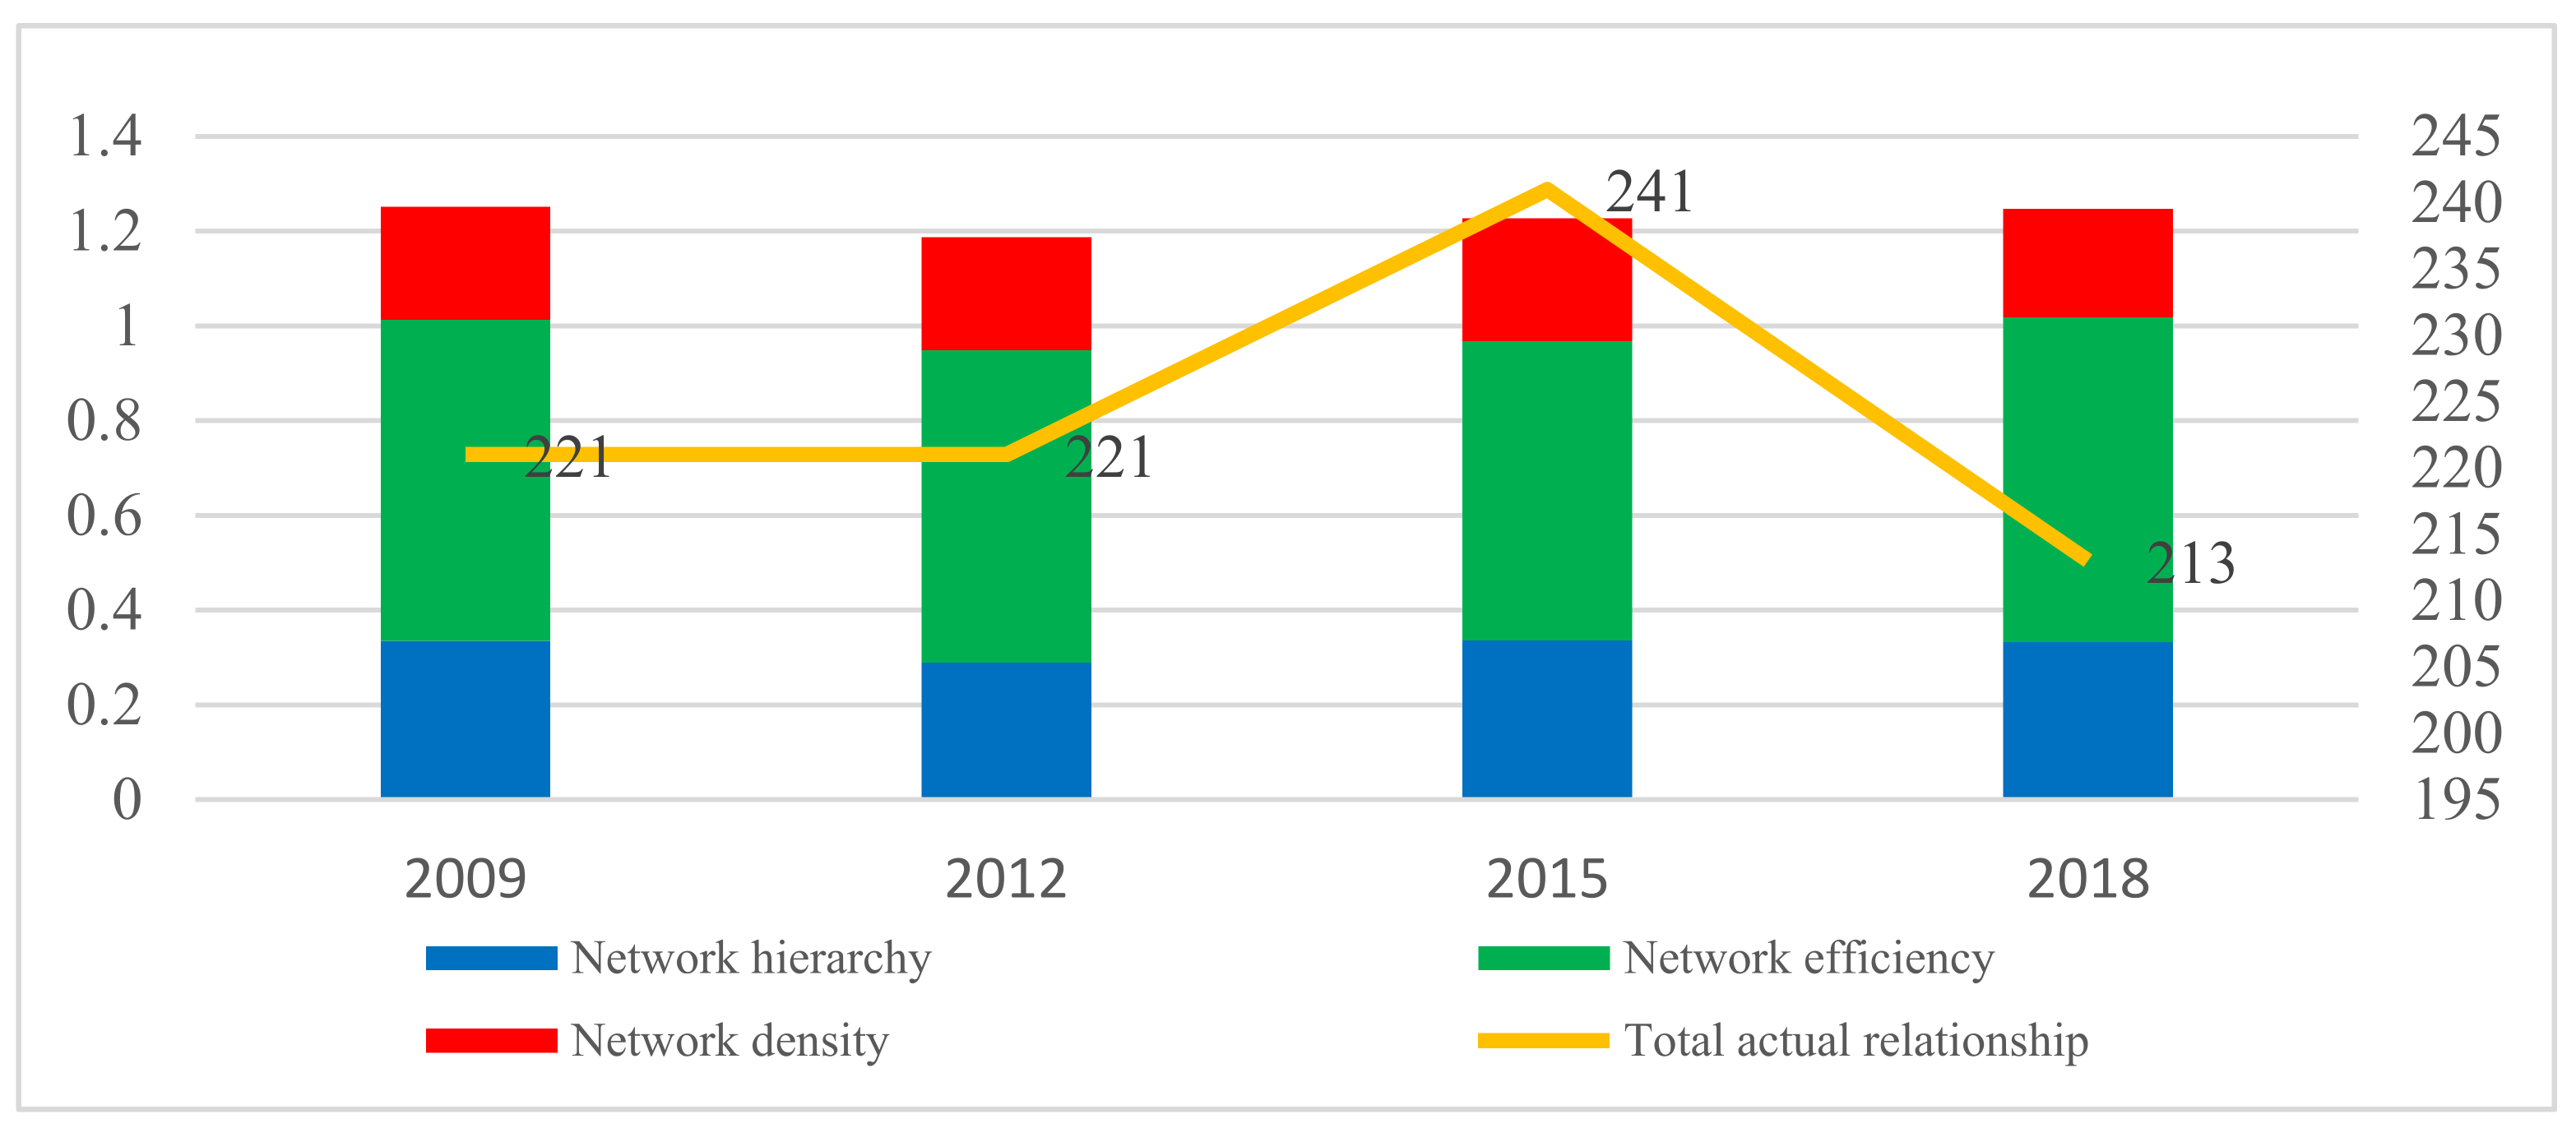
3.2. The Characteristics and Evolution Trend of the Overall Correlation Network Structure

According to the modified gravitational model, the spatial correlation of the allocation efficiency of ASTR among different provinces is identified, and a spatial correlation network at the provincial level is constructed. The Ucinet visualization tool Netdraw is used to draw a spatial correlation network diagram of China’s agricultural science and technology resource allocation efficiency from 2009 to 2018, and dynamically display the provincial correlation network structure of agricultural science and technology resource allocation efficiency. Taking 2018 (Figure 2) as an example, the nodes in the network represent 31 provinces, and the pointing lines between the provinces represent the network correlation strength and spillover relationship direction of the efficiency of agricultural science and technology resource allocation among different provinces. It can be seen from Figure 2 that China’s provincial-level agricultural science and technology resource allocation efficiency levels are increasingly closely linked, and the complexity of its network structure characteristics is becoming more and more significant. The entire spatial correlation network is a connected whole, and there are no isolated points. There is a maximum possible number of 930 relationships in the theoretical spatial correlation of the allocation efficiency of ASTR among 31 provinces, but there are actually 221 relationships, and the overall network density is 0.229, indicating that the efficiency of allocation of ASTR in China during the study period was significant spatial correlation; but from the perspective of network density, the degree of closeness is not high. Therefore, provinces and cities still need to strengthen the spatial flow of ASTR to improve allocation efficiency, and enhance the stability of the spatial correlation network. The calculation result of the network relevance is 1, which indicates that the development of agricultural science and technology resource allocation efficiency is related among all provinces. From the network correlation structure diagram, it can be seen that the connectivity between nodes is better. Provinces and cities in Eastern China, such as Beijing, Jiangsu, Shanghai and Zhejiang, are at the center of the network, and they are surrounded by most of the central and western provinces in the periphery, forming a “center- periphery” distribution pattern.
Figure 3 depicts the evolution trend of the spatial correlation network of China’s provincial agricultural science and technology resource allocation efficiency during the sample investigation period. The number of network relationships decreased from 221 in 2009 to 213 in 2018, and the network density also decreased from 0.238 in 2009 to 0.229, reflecting that the spatial correlation of the development of provincial agricultural science and technology resource allocation efficiency declined. The spillover effect of the linkage between nodes has also declined over time, and there is certain room for improving spatial synergy between provinces. The test results of the network level showed that the spatial correlation of the efficiency of the allocation of ASTR at the provincial level in the selected specific period showed a fluctuating downward trend, from 0.3348 in 2009 to 0.2888 in 2012 and rise to 0.3355 in 2015 and continued to drop to 0.3326 in 2018. This fluctuation indicates that there is no strict hierarchical structure in the allocation efficiency of ASTR across provinces in China. The network efficiency increased from 0.6782 in 2009 to 0.6851 in 2018, indicating that the number of connections between nodes has decreased, provincial spatial correlation has continued to weaken, and network stability has gradually decreased. According to the analysis of the overall network structure, in recent years, due to the country’s emphasis on technological innovation, the strict hierarchical allocation structure of ASTR in various regions in the past has been broken, but the degree of coordinated development of ASTR in the provinces in the allocation process is still not high. The allocation of ASTR between provinces still needs to be optimized, and the stability of the network structure of the allocation efficiency of ASTR needs to be improved urgently.

3.3. Spatially Correlated Individual Network Characteristics

To effectively analyze the status and role of the spatial correlation network in each province, the social analysis method is used to calculate the degree centrality, close to centrality, and middle centrality in the spatial correlation network of the agricultural science and technology resource allocation efficiency in each province. The characteristics of individual networks in 31 provinces are analyzed.

3.3.1. Degree Centrality

It can be seen from Table 6 that the average degree centrality of the 31 provinces in the country is 35.914, of which Beijing, Tianjin, Shanghai, Jiangsu, Zhejiang, Fujian, Shandong, Guangdong and Gansu have higher than average degree centrality; these eight provinces belong to the developed eastern coastal areas, which shows that the eastern region has a strong influence in the spatial correlation and spillover effects of agricultural science and technology resource allocation efficiency. Since the point-out degree and the point-in degree, respectively, correspond to the number of spillover relations and the number of receiving relations, according to the results in Table 6, there are 20 provinces with spillover relations greater than the average, among which the points of Guangdong, Shaanxi, Gansu and Sichuan are four provinces, whose point-out degree is higher, and provinces such as Fujian, Jiangxi, Hubei, Hunan, and Hainan have fewer spillover relationships. From the perspective of receiving relations, there are 10 provinces above the average, and the top provinces are Beijing, Tianjin, Shanghai, Jiangsu, and Zhejiang. The point-in degrees of these provinces are higher than the national point-out degrees. This shows that these provinces mainly accept spillover relationships from other provinces in the associated network. Among them, Beijing (32) and Shanghai (32) have the highest degree centrality, indicating that Beijing and Shanghai are at the core of the spatial correlation network of agricultural science and technology resource allocation efficiency. These two economically developed municipalities have spatial spillover effects and spatial correlations with the other 29 provinces. The centrality of Jilin, Ningxia, Xinjiang is relatively low. These provinces are less connected to other provinces. One possible reason for this is that they are mainly located in the northeastern and the western China, where are in relatively remote locations, lagging development and infrastructure, so the relationship with other provinces is not strong.

3.3.2. Close to Centrality

The average close to centrality of the correlation network of agricultural science and technology resource allocation efficiency in each province is 62.130, and there are nine provinces above the average, namely Beijing, Tianjin, Shanghai, Jiangsu, Zhejiang, Fujian, Shandong, Guangdong, and Gansu. Except for Gansu, they are all located in eastern China and have a high closeness to the center, indicating that these provinces act as “bridges” and can quickly establish contacts with other provinces in the allocation of ASTR in each province. Jiangsu (90.909), Shanghai (88.235) and Beijing (85.714) have the highest close to centrality values, which are significantly higher than those of other provinces, indicating that Jiangsu, Shanghai, and Beijing are at the center of the overall network, while Hebei, Liaoning, Jilin, Shanxi, Inner Mongolia, Guizhou, Ningxia, and Xinjiang rank relatively low. Most of these provinces are in the marginal zone with remote geographic locations. They are in the position of edge actors in the efficiency network of the allocation of ASTR.

3.3.3. Middle Centrality

The average value of middle centrality of agricultural science and technology resource allocation efficiency in each province is 2.210. This shows that China’s inter-provincial agricultural science and technology resource can quickly establish effective links. A total of six provinces are above the average. Among them, Beijing, Tianjin, Shanghai, Jiangsu, Zhejiang, and other provinces rank higher. These provinces play the role of “intermediary” and are at the center of the network. They exert strong control over the connections between other provinces. If resource mismatch occurs in these node provinces, it will cause a break in the network and create loopholes. The middle centrality values of these provinces, which include Liaoning, Jilin, Heilongjiang, Hebei, Shanxi, Hainan, Ningxia, and Xinjiang, are below the average. Other than Hebei, most of the other provinces are located in the northeast and west of China, with poor natural conditions, remote geographical location and lagging development. As a result, it is difficult for these provinces to influence and control other provinces in the spatial correlation network of China’s provincial agricultural science and technology resource allocation efficiency.

3.4. Small World Analysis

Steven H. Strogatz (2001) divides networks into regular networks and complex networks. Complex networks are divided into random networks, small-world networks and self-similar networks. Small-world networks divided into regular and random networks [71]. To quantitatively analyze the small-world characteristics of the agricultural science and technology resource allocation efficiency network, two indicators, “average distance” and “clustering coefficient”, are usually measured. According to calculations, the average distance of China’s provincial agricultural science and technology resource allocation efficiency spatial correlation network is 2.273, and the clustering coefficient is 0.463. These results show that it is completely possible to establish connections by passing through 1–3 intermediate provinces between any two province nodes in the network. From another perspective shows that the flow of a small amount of Chinese ASTR can drastically change the performance of the entire network. In other words, the improvement of the efficiency of the allocation of ASTR in a certain province can quickly affect other provinces. This highlights the interconnection and interaction of the flow of ASTR among different provinces.

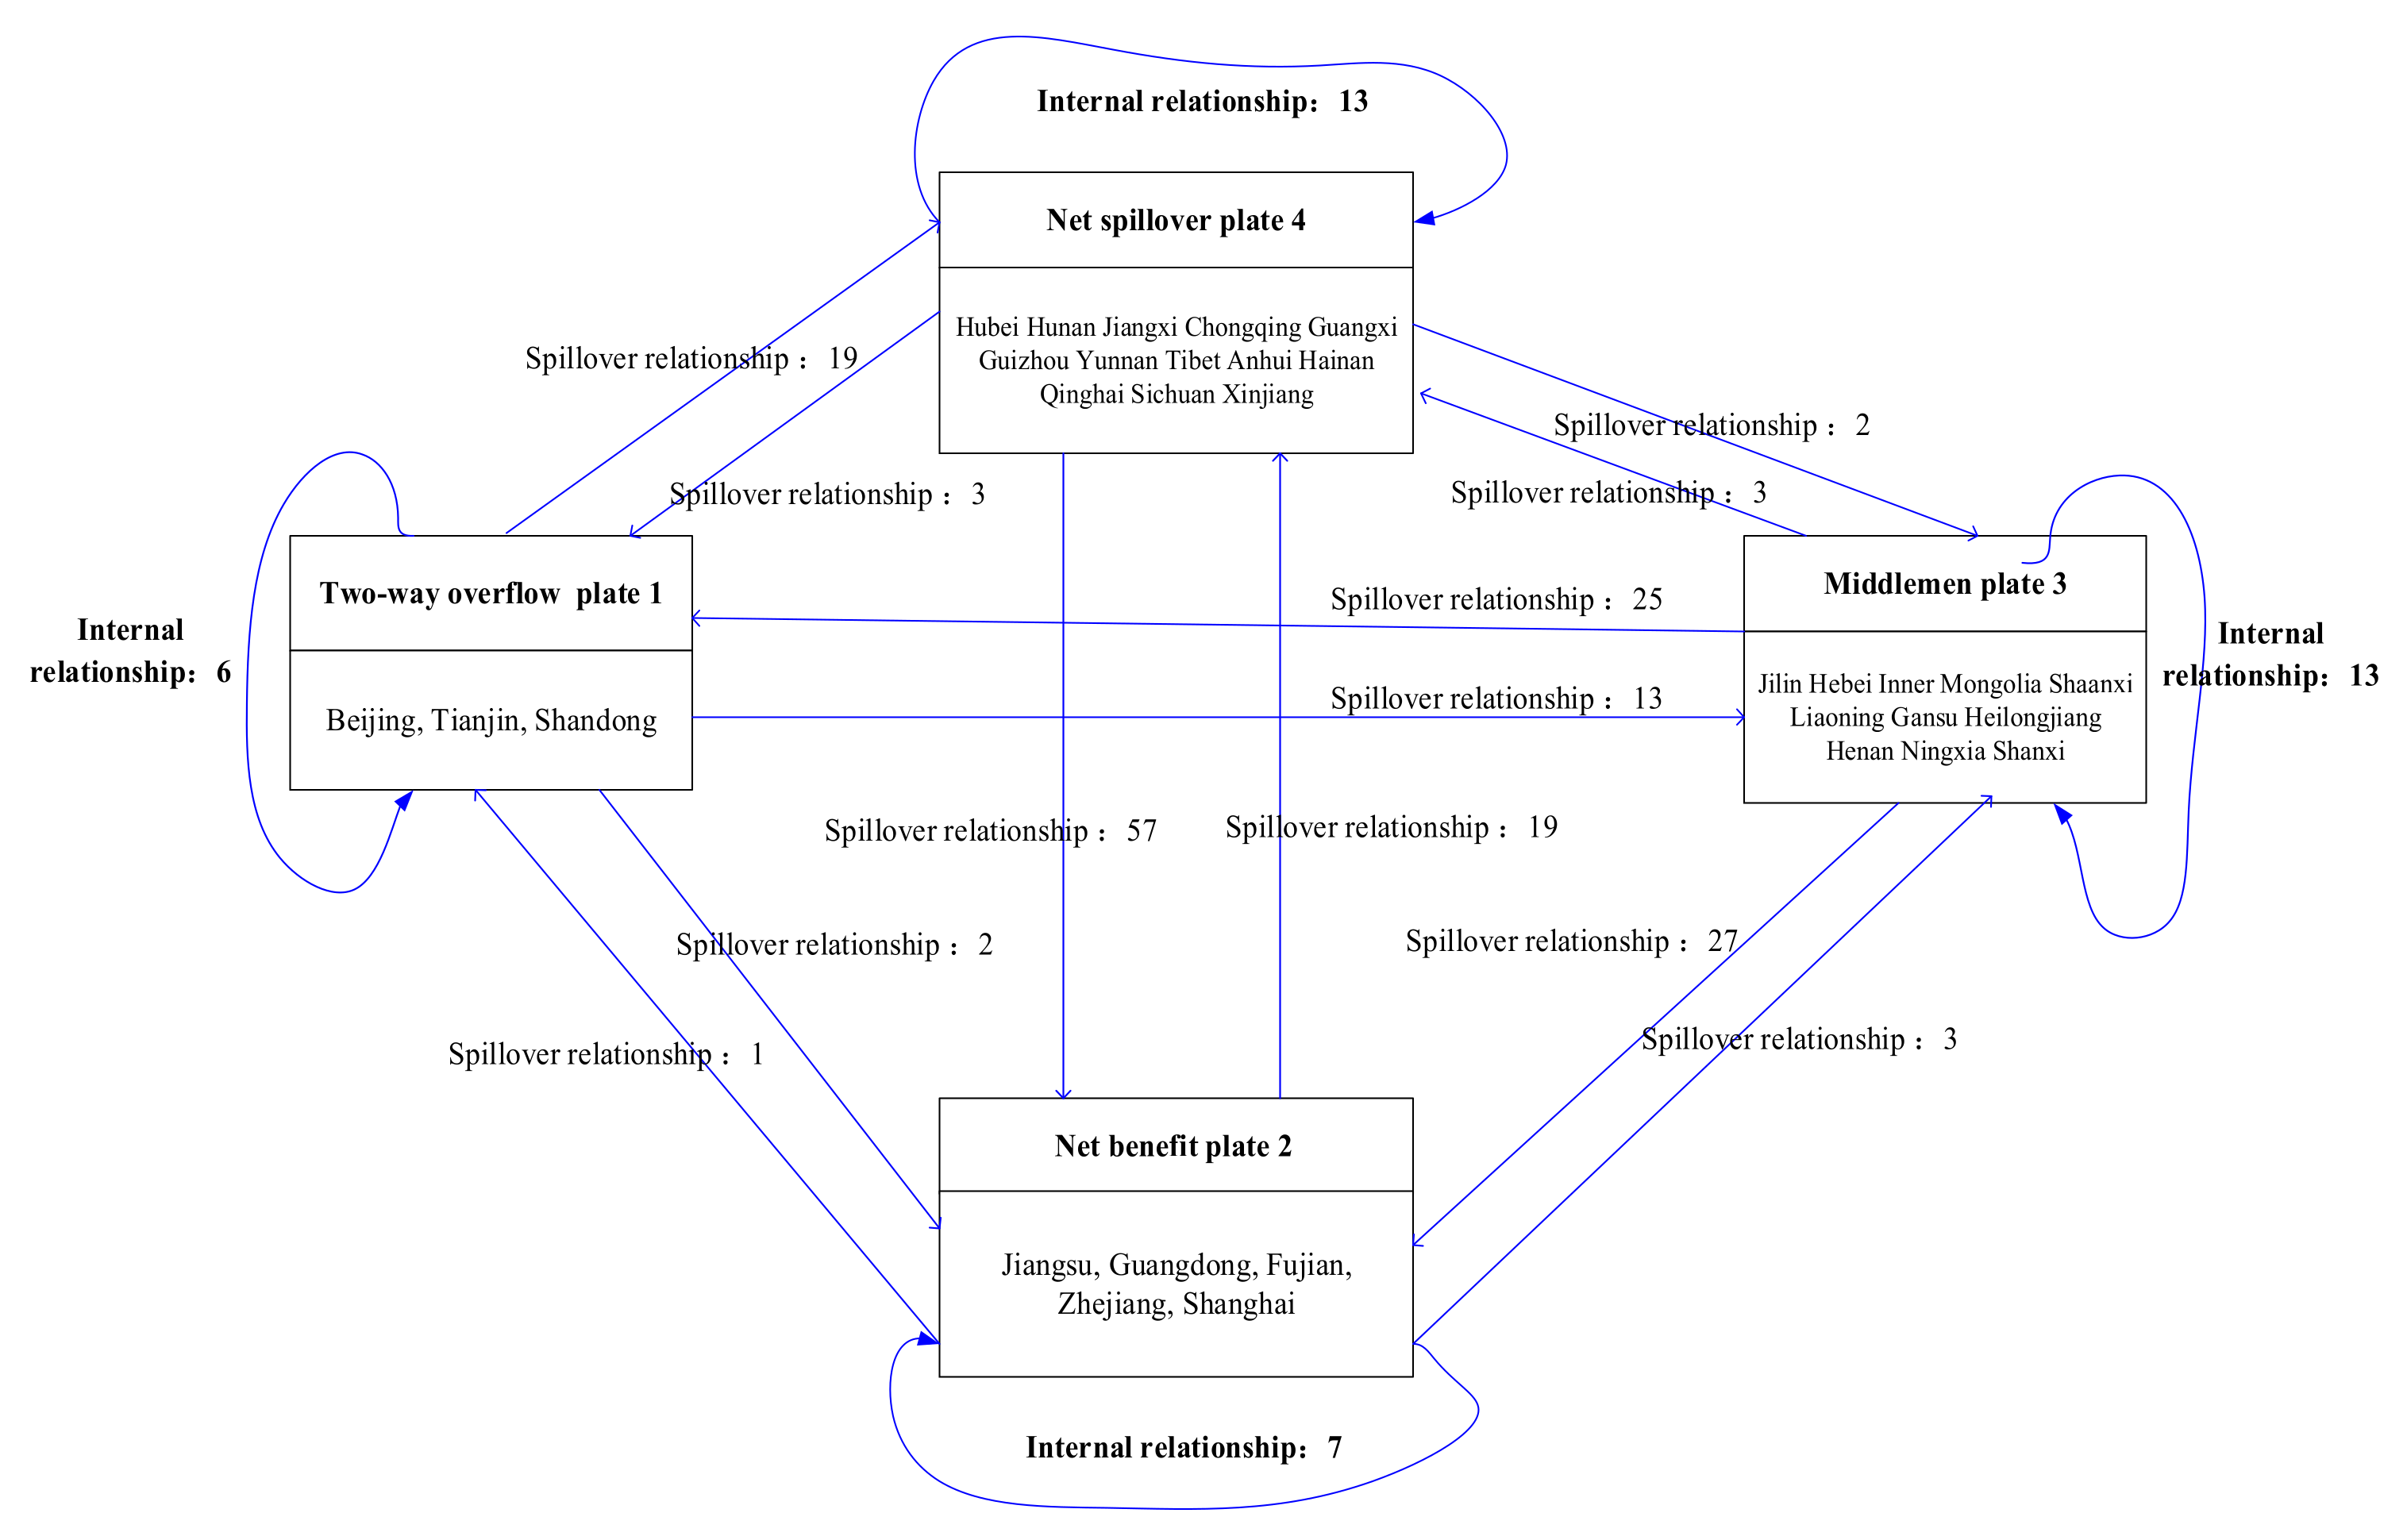
3.5. Block Model Analysis

Taking 2018 as an example, the block model analysis method was used to cluster the spatial correlation network of agricultural science and technology resource allocation efficiency in 31 provinces, and divide it into different sections to examine the structural characteristics and interaction relationship of the spatial correlation network. It is beneficial to perform a deep analysis of the internal structural characteristics of the spatial correlation network and the position, role and function of each plate. Using the CONCOR method (Convergent Correlations) in Ucinet 6.0, selecting the maximum segmentation depth of 2, and the concentration standard of 0.2, dividing the grain production of 31 provinces across the country into four blocks, and obtaining the four spillover effect relationships of the four plates (Table 7). The classification results show that Beijing, Tianjin, and Shandong belong to the first plate; the five regions of Jiangsu, Guangdong, Fujian, Zhejiang, and Shanghai belong to the second plate; Jilin, Hebei, Inner Mongolia, Shaanxi, Liaoning, Gansu, Heilongjiang, Henan, Ningxia, Shaanxi belong to the third plate; and Hunan, Hubei, Jiangxi, Chongqing, Guangxi, Guizhou, Yunnan, Tibet, Anhui, Hainan, Qinghai, Sichuan, and Xinjiang belong to the fourth plate.
It can be seen from Table 7 that in 2018, the total number of relationships in the spatial correlation network is 348, the development relationships among provinces within the plates is 174, and the development relationships among different plates is 174. The proportion of each is 50%, and the ratio of the correlation between the plates is equal to the ratio within the plates, indicating that the spatial spillover effect of the efficiency of the allocation of ASTR in each province is balanced among and within the plates. In the first plate, there are 6 internal relationships, 45 external relationships receiving from external plates, and 24 spillover relationships in total. The expected internal relationship ratio is 6.667%, and the actual internal relationship ratio is 25.000%. The plate receives a spillover relationship from other plates, and also has a spillover effect on other plates. Therefore, plate I belongs to the two-way spillover plate type. Members of this plate all belong to the developed provinces in the eastern region. ASTR in this region can not only satisfy the needs of their own agricultural science and technology development, it can also spill over to other provinces, indicating that different provinces have quite different roles and responsibilities in the spatial correlation network. In the second plate, there are 7 internal relationships, 86 external relationships receiving from external plates, and 24 spillover relationships in total. The expected internal relationship ratio is 13.333%, and the actual internal relationship ratio is 23.333%. The number of relationships within the plate is significantly higher than the number of spillover relationships, and the spillover effect between plate members is relatively limited, so plate II belongs to the net benefit plate type. In the third plate, there are 13 internal relationships, 18 external relationships in the receiving plate, and 80 spillover relationships in total. The expected internal relationship ratio is 30.000%, while the actual internal relationship ratio is 19.118%. It can be seen that the actual internal relationship ratio of this plate is relatively low. This plate sends spillover relationships to other plates and also receives spillover relationships from others, and the number of internal relationships is basically the same as the number of spillover relationships. Therefore, plate III belongs to the middleman plate type. Members of the plate are all located in the central and western areas. In the fourth plate, there are 13 internal relationships, 25 external relationships receiving from external plates, and 97 spillover relationships in total. The expected internal relationship ratio is 40.000%, while the actual internal relationship ratio is 14.286%. It can be seen that the number of spillover relationships from members of this plate to other plates is significantly greater than the number of spillover relationships received, that is, “benefit” is lower than “spillover”, so plate IV belongs to the net spillover plate type. Most of this plate is located in the central and western regions. As the country has attached great importance to the development of the central and western regions in recent years, it has successively implemented the policies of the rise of the central China and the development of the western region. Therefore, the ASTR in these regions can meet their own needs while also benefiting other provinces carrying out the spillover of ASTR.
To accurately analyze the spillover paths and spatial correlations among the above four plates, the network density matrix of the plates was calculated to examine the transmission law of the allocation efficiency of ASTR among the plates. Taking the overall network density as the critical value, if the density matrix between the plates is greater than the critical value, assign a value of 1, otherwise it is 0, so as to convert the density matrix into an image matrix (Table 8). From the image matrix, we can see the correlation and transmission mechanism between the agricultural science and technology resource allocation efficiency plates, and draw the correlation diagram from this (Figure 4). The results show that the first and second plates have a significant correlation and spatial spillover effect to the interior of the plates, while the third and fourth plates have no significant correlation and spillover effects on the interior of the plates. This shows that the provinces in the eastern region have a strong linkage of the efficiency of agricultural technology resource allocation, and the linkage of the efficiency of agricultural technology resource allocation between the central and western provinces is weak. The key element resources in the allocation of agricultural technology resources in the first and second plates are mainly carried out by the third and fourth plates, so that the first and second plates have become the core source of China’s provincial agricultural science and technology resource allocation efficiency network. At the same time, the first plate has a spillover effect on the third plate, so does the second plate on the fourth plate, indicating that the ASTR in the central and western provinces has a trend of spillover to the eastern coastal provinces. Each plate plays a comparative advantage role in the associated network, and the overall interconnection and spillover effects of the whole domain are more obvious.

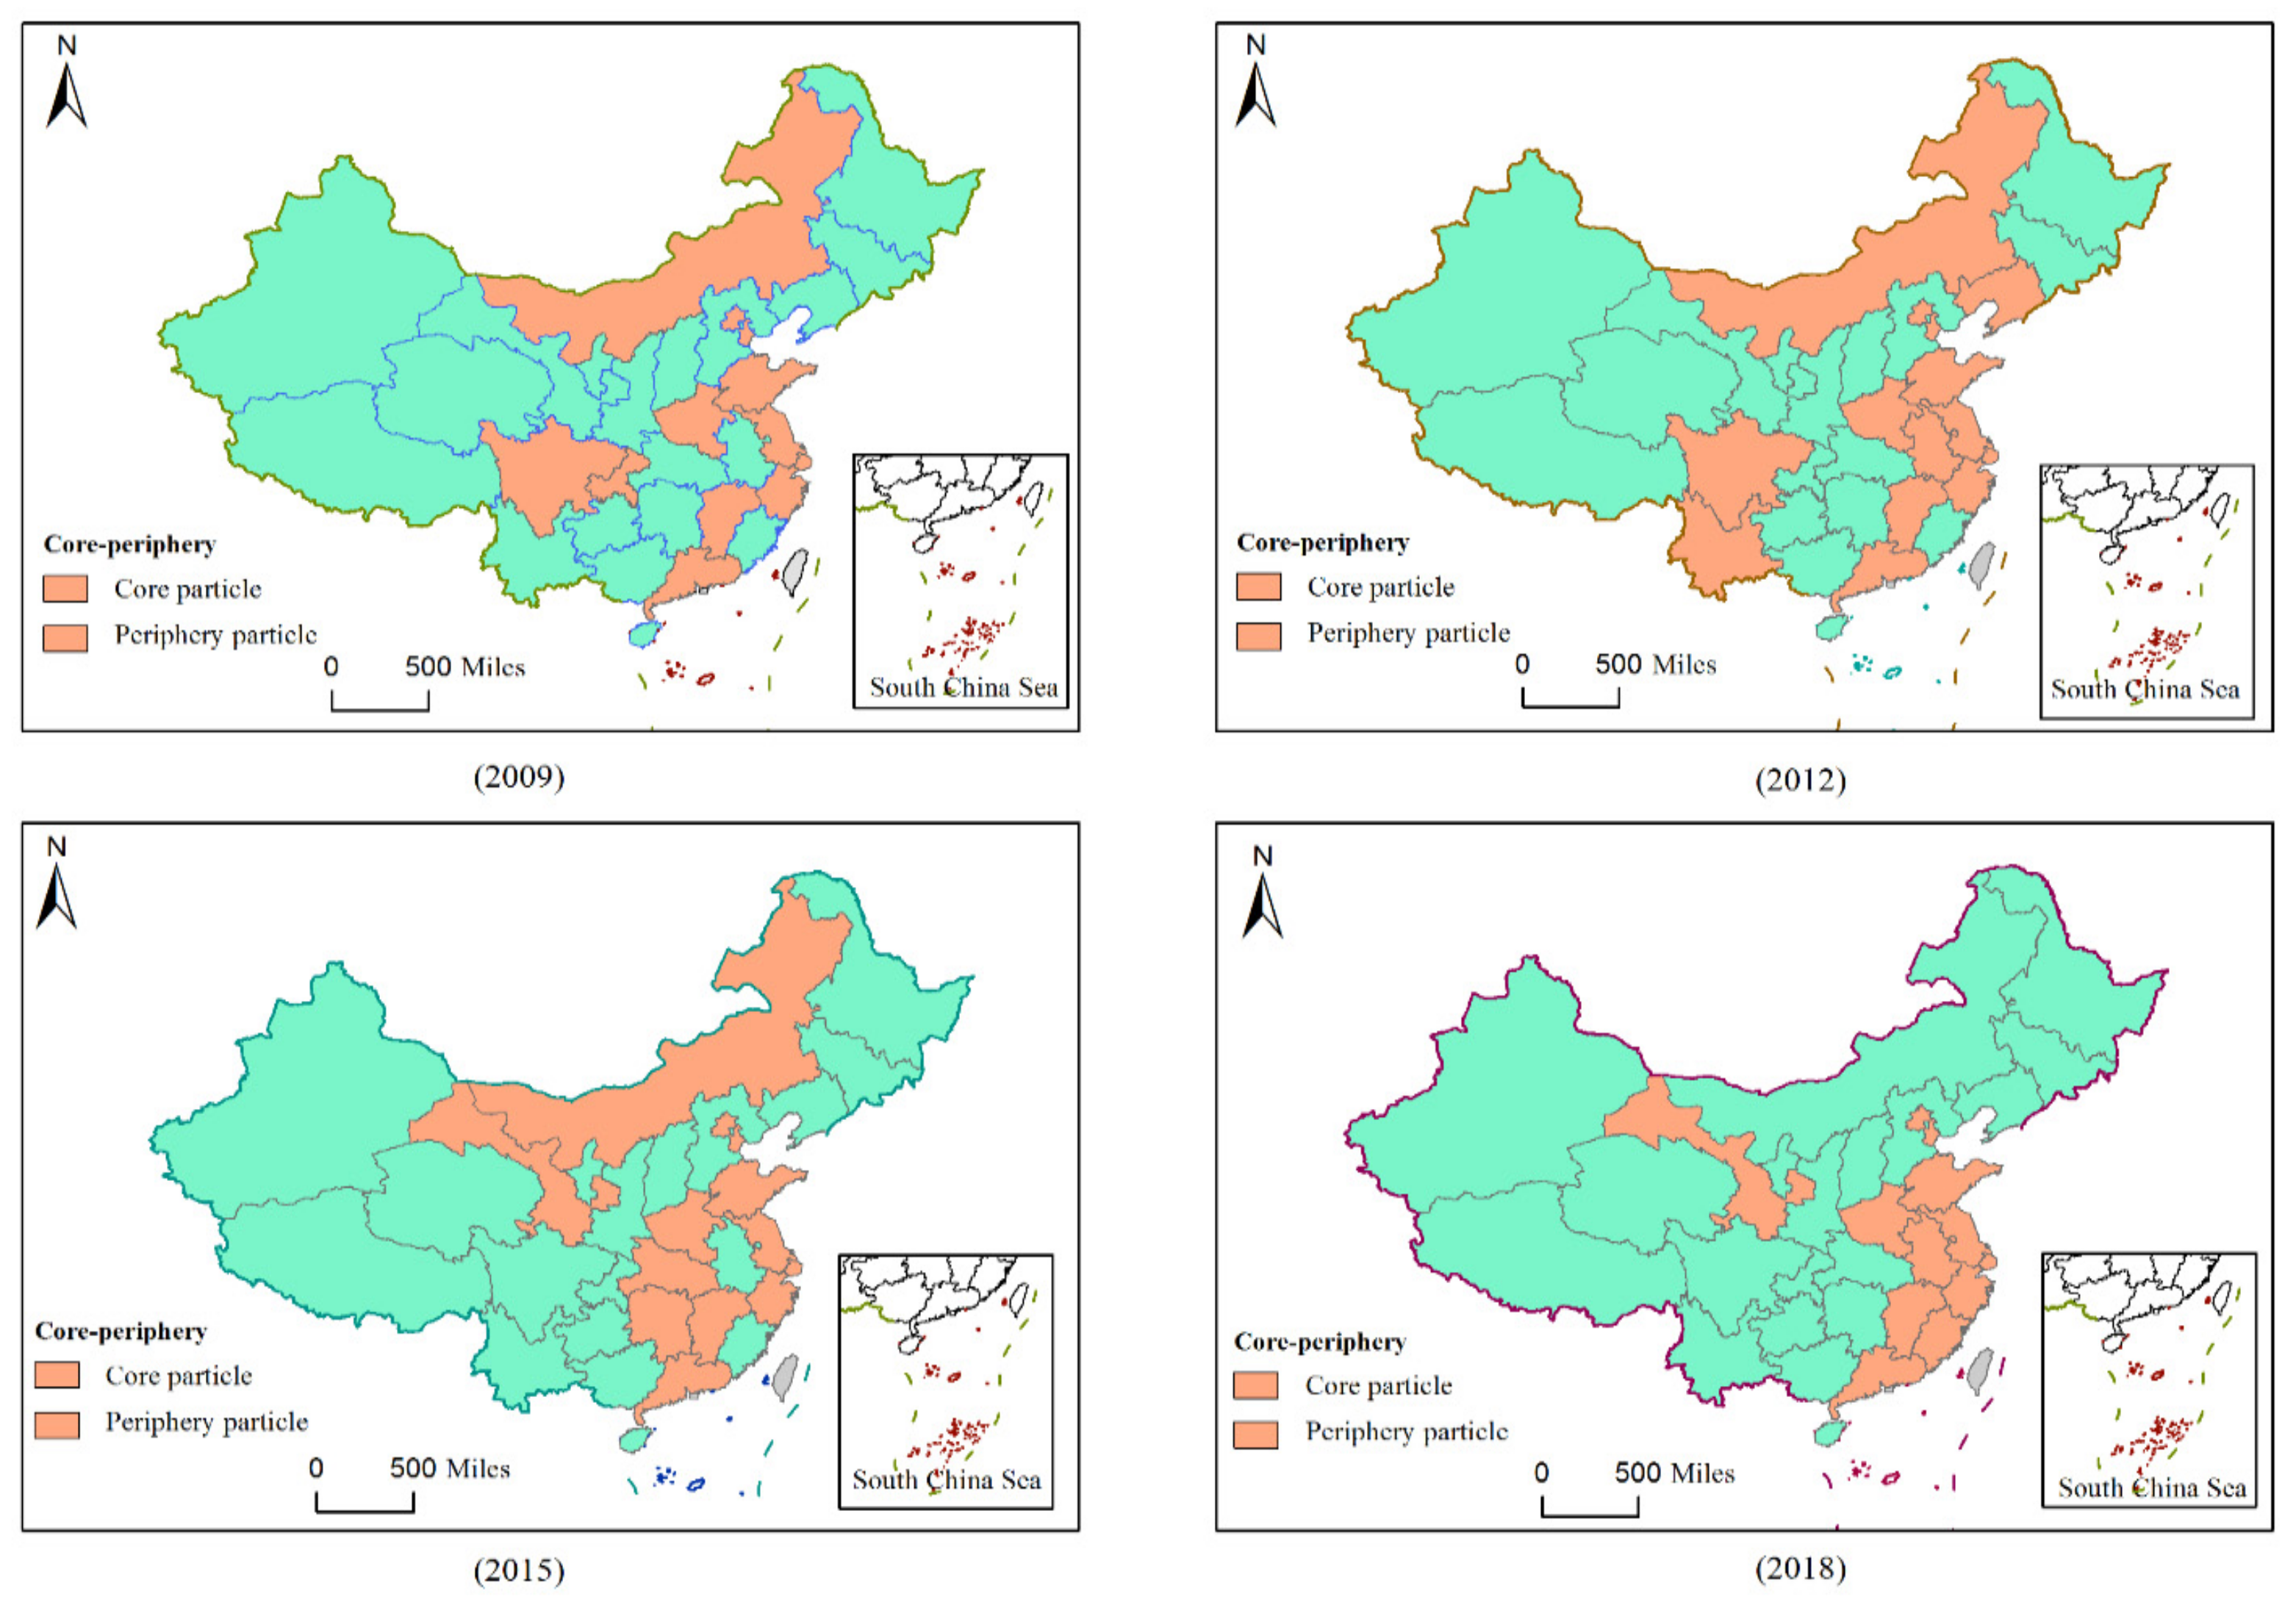
3.6. Core–Periphery Analysis

John Friedmann proposed a complete set of theoretical systems related to spatial development planning, that is, the “core–periphery” theory [72]. The theory believes that the core area is a regional social organization subsystem with high innovation and transformation capabilities, and the peripheral area is a regional social subsystem determined by the core area based on the dependency relationship with the core area [73]. A core–periphery analysis of China’s agricultural science and technology resource allocation efficiency (Figure 5) shows that the spatial correlation network from 2009 to 2018 presents a development trend of gradual expansion of the core area and gradual reduction of the peripheral area, and the core area shows a continuous spread from the eastern region to the central and western. We can see that the absolute core areas of the spatial correlation network of China’s agricultural science and technology resource allocation efficiency are mostly in the eastern region, and most of the periphery areas are in the western region. At the same time, the core area exhibits a relatively obvious space neighborhood effect. The provinces in the core area are basically adjacent in space, indicating that the allocation of ASTR at the core node can significantly drive the development of surrounding provinces and have a strong demonstration and leading role in surrounding provinces.

3.7. Analysis of Influencing Factors Based on QAP Method

To test the correlation relationship between the spatial correlation network of agricultural science and technology resource allocation efficiency and the driving factors, 10,000 random replacements were used for testing. The relevant results showed (Table 9) the spatial correlation network of agricultural science and technology resource allocation efficiency, and spatial adjacency, industrial structure, urbanization and economic development level all pass the 1% significance test, while the agricultural employees, the total power of agricultural machinery, and the degree of informatization do not pass the significance test. This indicates that the spatial adjacency, industrial structure, urbanization, and economic development level of each province have an important influence on the formation of the spatial correlation network of the allocation efficiency of ASTR, but the function of agricultural employees, the total power of agricultural machinery and the degree of informatization are not significant.

3.8. Regression Analysis Based on QAP Method

According to the measurement model, 2009, 2012, 2015, and 2018 were selected as typical years to perform QAP regression analysis on the spatial correlation strength matrix of China’s ASTR and the difference matrix of each driving factor, and the number of random replacements was 10,000 (Table 10). It can be seen that the adjusted R2 for the four years is between 0.304 and 0.326, and passed the 1% significance level test, that is, the selected driving factors can explain 31.4–39.6% of the changes in the spatial correlation of China’s agricultural science and technology resource allocation efficiency. The overall fitting results is better.
From the regression results in Table 10, it can be seen that the direction and extent of the influence of different driving factors on the correlation network of agricultural science and technology resource allocation efficiency changes with time, showing obvious characteristics of differentiation. Specifically: (1) the coefficient of geographic proximity is significantly positive in typical years, indicating that geographic proximity plays an important role in strengthening the spatial correlation of the efficiency of the allocation of ASTR between provinces. In addition, as time goes by, this positive strengthening effect has been continuously improving on the fluctuation from 0.2122 in 2009 to 0.2694 in 2018. There is a stronger spatial spillover effect between neighboring provinces and promotes the formation of a spatial correlation network. (2) The difference coefficient of economic development level in the four years were all significantly positive and showed a slight downward trend, indicating that the greater the difference in economic development levels, the more promoting the provincial agricultural science and technology resource allocation network. (3) The regression coefficients of industrial structure upgrade were not significant in 2009, 2015, and 2018, indicating that industrial structure upgrading had little effect on the network of agricultural science and technology resource allocation. (4) The regression coefficients of agricultural mechanization services, degree of informatization, and differences in agricultural employees are positive, but none of them pass the significance test, indicating that differences in them have no effect on the correlation network. A possible reason for this is that due to China’s complex terrain differences, agricultural machinery cannot be fully popularized, and there is a lack of corresponding agricultural science and technology personnel to popularize agricultural informatization in areas where economic development is relatively backward. As a result, the associated impact of the allocation of scientific and technological resources is not significant.

4. Discussion

Since the reform and opening up, major breakthroughs have been made in the development of China’s agricultural and rural areas. The contribution rate of agricultural scientific and technological progress has increased from 42.3% in 2002 to 60.7% in 2021. This has played an important role in supporting and leading China’s agricultural and rural development. The use efficiency of ASTR has shown an upward trend year by year, but the overall situation is still relatively low. DEA ineffective areas account for more than 60%, and there is a phenomenon of unbalanced regional development [74]. To further study the spatial relevance of the allocation efficiency of ASTR, to promote a more balanced use of ASTR in different regions. This article discusses the spatial correlation structure and influencing factors of the allocation efficiency of ASTR in different provinces in China. We not only analyzed the overall network characteristics and the characteristics of each point in the spatial correlation network, but also discussed the influencing factors of the ASTR distribution efficiency in the spatial correlation network.
In terms of topic selection, it is different from the previous literature on the calculation of the use efficiency of agricultural science and technology resources in all provinces in China, and the analysis of regional gaps and balance from the calculation results [75]. It is also different from the direct analysis of most other articles that focus only on the allocation efficiency of agricultural science and technology resources in a specific province [76,77,78,79,80,81,82]. This article analyzes China as a whole, and regards the provinces as a collection of resource use efficiency correlations. The provinces are the “points” in the spatial association network, and the spatial association relations between the provinces in terms of use efficiency are the “lines” connecting the points in the network. These points and lines constitute the use efficiency of ASTR in China as a whole. This kind of research has practical significance. From the perspective of research, the factors that affect the spatial correlation of the use efficiency of ASTR are fully considered. The external environmental factors and internal technical factors are incorporated into a unified analysis framework for GAP analysis. In terms of research methods, the existing research mainly uses the DEA-Manquist index to measure the allocation efficiency of ASTR. This paper uses the SBM model to measure the efficiency. It can not only deal with undesired output in a more appropriate manner and solve the problem of sorting ineffective units and effective units at the same time, but can also make further comparisons among effective decision-making units. This enhances the accuracy of the measurement results. In terms of the research results, the article draws the conclusion that the relationships between the allocation efficiencies of China’s provincial ASTR is getting closer, and the complexity of the network structure characteristics is becoming more and more obvious. This discovery is also consistent with the concept of agricultural regional integration and coordinated development proposed by Chinese scholars [83]. However, with respect to the network density value, the compactness is not high. This finding shows that in order to effectively realize the effective use of ASTR, it is necessary to implement regionally coordinated distribution [84]. Ignoring the spatial correlation effect is not able to effectively improve the use efficiency of the overall ASTR, which is consistent with the research conclusion of Xue [85]. He analyzed the level of ASTR in China’s six administrative regions from 2010 to 2017. The research findings for all regions show a growth trend. Among them, north China has the largest growth rate and northwest China has the smallest. From the perspective of regional comparison, the level of agricultural science and technology resources in order from high to low are as follows: east, north, central south, northeast, southwest and northwest. The results of the overall Moran index show that the level of ASTR in the whole country has the phenomenon of agglomeration, which is gradually weakening year by year. The results of the local Moran index show that most of the provinces are concentrated in the high–high concentration area and the low–low concentration area, and the trend of polarization is obvious.
In recent years, due to the country’s emphasis on technological innovation, the previously strict ASTR hierarchical distribution structure in various regions has been broken. However, the distribution method of ASTR in China still needs to be optimized, and the stability of the network structure of ASTR distribution efficiency urgently needs to be improved [86]. Meanwhile, it can be seen that the eastern region has a strong influence in the spatial correlation and spillover effect of the allocation efficiency of ASTR. Other provinces have more relationships with provinces in the eastern region in the agricultural science and technology resource allocation efficiency correlation network. Among them, Beijing and Shanghai are at the core of the spatial correlation network of agricultural science and technology resource allocation efficiency. This is basically consistent with the research conclusions of Deng [87]. This result shows that provinces and cities with higher efficiency in the allocation of ASTR have higher spatial spillover effects and spatial correlation. Therefore, provinces with higher levels of economic development and higher resource allocation efficiency should become “bridges” in the coordinated allocation of China’s cross-regional ASTR. Finally, based on the QAP regression results, it can be seen that the spatial adjacency, industrial structure, urbanization, and economic development level of each province have an important influence on the formation of a spatial correlation This is basically consistent with the research results of Li and Dong. Li analyzed the spatial correlation from the perspective of China’s regional economic growth [35]. Dong studied its influencing factors from the perspective of innovation efficiency of ASTR [88]. Among these factors, geographical proximity plays an important role in strengthening inter-provincial spatial correlation, and neighboring provinces have a stronger spatial spillover effect and promote the formation of spatial correlation networks. This also confirms the research of Hou and Chen. These two scholars believe that geographical proximity has an important influence on the pattern of China’s agricultural food production and the formation of the spatial pattern of China’s agricultural green development [89,90]. These findings provide a theoretical basis for the government to formulate a reasonable regional coordinated allocation policy for ASTR.
Although this article discusses the overall network characteristics of the spatial correlation network of China’s agricultural science and technology resource allocation efficiency and the influencing factors of the spatial correlation network, there are still certain limitations. First of all, due to the inability to obtain data in various cities in China, this paper only studies the spatial correlation of the allocation efficiency in 31 provinces. In the future, if we can obtain urban-level data, we can further conduct more detailed research. Secondly, the research time span is only from 2009 to 2018. Since the statistical caliber of China’s ASTR changed in 2009, the relevant data from 1991 to 2008 were not analyzed. Due to the impact of the novel coronavirus pneumonia (COVID-19), the statistical data for 2019–2020 will be updated slowly, so the time span of this article is relatively short, at only 10 years. Finally, this paper uses the QAP regression method to explore the influencing factors of the spatial correlation of China’s inter-provincial agricultural science and technology resource allocation efficiency. However, empirical research cannot determine the influence mechanism of these factors. In future research, it is necessary to explore the influence mechanism of these factors on the spatial correlation network.

5. Conclusions and Policy Implications

In this paper, the revised gravity model is used to estimate the spatial correlation intensity of the allocation efficiency of ASTR among provinces of China, and the correlation network is established. On this basis, the social network analysis method is used to analyze the structural characteristics of the correlation network. Furthermore, the QAP regression method was used to analyze the main driving factors affecting the spatial correlation of the allocation efficiency of ASTR. The study found that:
(1) From the perspective of the overall network structure, there is a significant spatial correlation and spillover effect in the allocation efficiency of ASTR in China, and the overall network density is declining. Moreover, the current network density is only 0.229, so there is a large room for improvement in the inter-provincial network correlation relationship. In addition, the spatial related network has good accessibility, and the network grade and network efficiency decrease in the fluctuation, gradually breaking the hierarchical spatial network structure. The allocation efficiency of ASTR among provinces showed a trend of balanced development. (2) From the perspective of individual network structure characteristics, the spatial correlation network of agricultural science and technology resource allocation efficiency has significant regional heterogeneity. Beijing, Tianjin, Shanghai, Jiangsu, Zhejiang rank high in the close to centrality and the middle centrality, and play the role of “intermediary” and “bridge” in the allocation efficiency network of agricultural science and technology resources. (3) Based on the analysis of the core–edge structure and block model, the spatial correlation network shows a trend wherein the core area keeps expanding and the edge area keeps shrinking. At the same time, the allocation efficiency is generally unbalanced. The correlation network of allocation efficiency can be divided into four plates. Most eastern provinces belong to the net benefit plate, while most central and western provinces belong to the net spillover plate. (4) The spatial proximity, the level of economic development, the level of industrial structure and the level of urbanization have significant effects on the formation of the spatial correlation network of the efficiency of ASTR allocation among provinces in China. However, differences in the size of the rural labor force, the level of informatization, and the difference in agricultural mechanization services have no significant impact.
Based on the above conclusions, the following policy implications can be drawn:
(1) First of all, the spatial correlation “channel” should be constructed in multiple ways. The spatial correlation network is an interlinked whole, and there are no isolated points. Therefore, when strengthening the spatial correlation relationship of the allocation efficiency of ASTR in the provinces, we should not only consider the performance of “attribute data”, but also pay attention to the spatial agglomeration ability, so as to promote the allocation of ASTR from “local” to “whole”. (2) Secondly, different functions should be taken on according to different positions in the spatial correlation network of different provinces. In addition, more effective and correct allocation measures should be taken according to local conditions. Furthermore, it is necessary to give full play to the advantages of the eastern areas to drive the central and western regions to transform their allocation mode and realize the efficient allocation of ASTR. In addition, the provinces located at the edge of the network should actively introduce the technology and management means of advanced regions, narrow the gap with the core provinces, and achieve coordinated development among regions. (3) Finally, geographical proximity, regional differences in economic development, regional similarities in industrial structure and differences in the size of labor factors should be fully considered. Since geographical distance from neighboring provinces will reduce the flow cost, it is necessary to strengthen the cross-regional flow and cooperation of ASTR in neighboring provinces, and narrow the gap in technology and talents between provinces. In this way, a regional linkage effect of ASTR allocation among regions can be realized, and a more stable spatial correlation network can be formed between regions.

Author Contributions

Conceptualization, Y.W.; Methodology, Z.C.; Software, M.H.; Validation, Y.W.; Formal analysis, X.W. and Y.W.; Investigation, Y.W.; Data curation, Y.W.; Writing—original draft preparation, Y.W.; Writing—review and editing, Y.W., X.W.; Visualization, F.W.; Supervision, F.W.; Project administration, Y.W.; Funding acquisition, F.W. All authors have read and agreed to the published version of the manuscript.

Funding

This research was funded by the National Natural Science Foundation of China, grant number 71673222 and 72064009, the Humanities and Social Science Fund of Ministry of Education of China, grant number 15XJA790005, the China Scholarship Council Funded Project, grant number 202106300001, and the Shaanxi Provincial Key R&D Program Project, grant number 2020KW-029. The APC was funded by the National Natural Science Foundation of China, grant number 71673222.

Institutional Review Board Statement

Ethical review and approval were waived for this study as the study does not collect any personal data of the respondents, and respondents were informed that they could opt out any time from giving a response.

Informed Consent Statement

Informed consent was obtained from all subjects involved in the study.

Data Availability Statement

The data will be provided upon request by the corresponding author.

Conflicts of Interest

The authors declare no conflict of interest.

References

  1. Xu, X. Efficiency and Technical Progress in Traditional and Modern Agriculture: Evidence from Rice Production in China. Agric. Econ. 1998, 18, 157–165. [Google Scholar] [CrossRef] [Green Version]
  2. Ministry of Agriculture and Rural Affairs of the People’s Republic of China. The 13th Five-Year Plan for Agricultural Science and Technology Development; Ministry of Agriculture and Rural Affairs: Beijing, China, 2017.
  3. Xu, C.; Chunru, H.; Taylor, D.C. Sustainable Agricultural Development in China. World Dev. 1992, 20, 1127–1144. [Google Scholar] [CrossRef]
  4. Yu, X.; Zhao, G. Chinese Agricultural Development in 30 Years: A Literature Review. Front. Econ. China 2009, 4, 633–648. [Google Scholar] [CrossRef]
  5. Jin, S.; Ma, H.; Huang, J.; Hu, R.; Rozelle, S. Productivity, Efficiency and Technical Change: Measuring the Performance of China’s Transforming Agriculture. J. Prod. Anal. 2010, 33, 191–207. [Google Scholar] [CrossRef]
  6. Rask, K.J.; Rask, N. Economic Development and Food Production–Consumption Balance: A Growing Global Challenge. Food Policy 2011, 36, 186–196. [Google Scholar] [CrossRef]
  7. Groenewold, N.; Lee, G.; Chen, A. Inter-Regional Spillovers in China: The Importance of Common Shocks and the Definition of the Regions. China Econ. Rev. 2008, 19, 32–52. [Google Scholar] [CrossRef] [Green Version]
  8. Groenewold, N.; Guoping, L.; Anping, C. Regional Output Spillovers in China: Estimates from a VAR Model. Pap. Reg. Sci. 2007, 86, 101–122. [Google Scholar] [CrossRef]
  9. Deng, X.; Zhong, H.; Bai, X.; Zhao, T.; Wang, M. Opportunities and Challenges for Development of Urbanization in Western China. Chin. J. Popul. Resour. Environ. 2013, 11, 236–243. [Google Scholar] [CrossRef]
  10. Hu, B.; Liu, Y.; Zhang, X.; Dong, X. Understanding Regional Talent Attraction and Its Influencing Factors in China: From the Perspective of Spatiotemporal Pattern Evolution. PLoS ONE 2020, 15, e0234856. [Google Scholar] [CrossRef] [PubMed]
  11. Smith, A. The Wealth of Nations; W. Strahan and T. Cadell: London, UK, 1776. [Google Scholar]
  12. Solow, R. Learning from? Learning by Doing? Lessons for Economic Growth; Stanford University Press: Palo Alto, CA, USA, 1997. [Google Scholar]
  13. Leoncini, R.; Maggioni, M.A.; Montresor, S. Intersectoral Innovation Flows and National Technological Systems: Network Analysis for Comparing Italy and Germany. Res. Policy 1996, 25, 415–430. [Google Scholar] [CrossRef]
  14. Jorgenson, D.W.; Nishimizu, M. U.S. and Japanese Economic Growth, 1952–1974: An International Comparison. Econ. J. 1978, 88, 707. [Google Scholar] [CrossRef]
  15. Malecki, E.J. Entrepreneurship in Regional and Local Development. Int. Reg. Sci. Rev. 1993, 16, 119–153. [Google Scholar] [CrossRef]
  16. Ying, L.G. Measuring the Spillover Effects: Some Chinese Evidence. Pap. Reg. Sci. 2005, 79, 75–89. [Google Scholar] [CrossRef]
  17. Fan, F.; Du, D.; Wang, X. The Measure and Characteristics of Spatial-Temporal Evolution of China’s Science and Technology Resource Allocation Efficiency. J. Geogr. Sci. 2014, 24, 492–508. [Google Scholar] [CrossRef]
  18. Oliveira, M.; Gama, J. An Overview of Social Network Analysis. WIREs Data Min. Knowl. Discov. 2012, 2, 99–115. [Google Scholar] [CrossRef] [Green Version]
  19. Borgatti, S.P.; Mehra, A.; Brass, D.J.; Labianca, G. Network Analysis in the Social Sciences. Science 2009, 323, 892–895. [Google Scholar] [CrossRef] [Green Version]
  20. Smith, D.A.; White, D.R. Structure and Dynamics of the Global Economy: Network Analysis of International Trade 1965–1980. Soc. Forces 1992, 70, 857. [Google Scholar] [CrossRef]
  21. Haythornthwaite, C. Social Network Analysis: An Approach and Technique for the Study of Information Exchange. Libr. Inf. Sci. Res. 1996, 18, 323–342. [Google Scholar] [CrossRef]
  22. Otte, E.; Rousseau, R. Social Network Analysis: A Powerful Strategy, Also for the Information Sciences. J. Inf. Sci. 2002, 28, 441–453. [Google Scholar] [CrossRef]
  23. Ter Wal, A.L.J.; Boschma, R.A. Applying Social Network Analysis in Economic Geography: Framing Some Key Analytic Issues. Ann. Reg. Sci. 2009, 43, 739–756. [Google Scholar] [CrossRef] [Green Version]
  24. Schiavo, S.; Reyes, J.; Fagiolo, G. International Trade and Financial Integration: A Weighted Network Analysis. Quant. Financ. 2010, 10, 389–399. [Google Scholar] [CrossRef]
  25. Cassi, L.; Morrison, A.; Ter Wal, A.L.J. The Evolution of Trade and Scientific Collaboration Networks in the Global Wine Sector: A Longitudinal Study Using Network Analysis. Econ. Geogr. 2012, 88, 311–334. [Google Scholar] [CrossRef]
  26. Kao, C. A Maximum Slacks-Based Measure of Efficiency for Closed Series Production Systems. Omega 2022, 106, 102525. [Google Scholar] [CrossRef]
  27. Tone, K. A Slacks-Based Measure of Efficiency in Data Envelopment Analysis. Eur. J. Oper. Res. 2001, 130, 498–509. [Google Scholar] [CrossRef] [Green Version]
  28. Wang, F.; Wu, L.; Zhang, F. Network Structure and Influencing Factors of Agricultural Science and Technology Innovation Spatial Correlation Network—A Study Based on Data from 30 Provinces in China. Symmetry 2020, 12, 1773. [Google Scholar] [CrossRef]
  29. Freeman, L.C.; Roeder, D.; Mulholland, R.R. Centrality in Social Networks: Ii. Experimental Results. Soc. Netw. 1979, 2, 119–141. [Google Scholar] [CrossRef] [Green Version]
  30. Kleibergen, F.; Mavroeidis, S. Weak Instrument Robust Tests in GMM and the New Keynesian Phillips Curve. J. Bus. Econ. Stat. 2009, 27, 293–311. [Google Scholar] [CrossRef]
  31. Miller, B.N.; Reidl, C.J., Jr. Gravity in One Dimension—Persistence of Correlation. Astrophys. J. 1990, 348, 203. [Google Scholar] [CrossRef]
  32. Ducruet, C.; Beauguitte, L. Spatial Science and Network Science: Review and Outcomes of a Complex Relationship. Netw. Spat. Econ. 2014, 14, 297–316. [Google Scholar] [CrossRef] [Green Version]
  33. White, H.C.; Boorman, S.A.; Breiger, R.L. Social Structure from Multiple Networks. I. Blockmodels of Roles and Positions. Am. J. Sociol. 1976, 81, 730–780. [Google Scholar] [CrossRef]
  34. Carrington, P.J.; Scott, J. The SAGE Handbook of Social Network Analysis; SAGE Publications Ltd: London, UK, 2011. [Google Scholar]
  35. Li, J.; Chen, S.; Wan, G.; Fu, C. The Spatial Correlation and Explanation of China’s Regional Economic Growth—Based on the Network Analysis Method. Econ. Res. 2014, 49, 4–16. [Google Scholar]
  36. Burkard, R.E.; Çela, E.; Pardalos, P.M.; Pitsoulis, L.S. The Quadratic Assignment Problem. In Handbook of Combinatorial Optimization; Du, D.-Z., Pardalos, P.M., Eds.; Springer: Boston, MA, USA, 1998; pp. 1713–1809. ISBN 978-1-4613-7987-4. [Google Scholar]
  37. Wang, F.; Gao, M.; Liu, J.; Fan, W. The Spatial Network Structure of China’s Regional Carbon Emissions and Its Network Effect. Energies 2018, 11, 2706. [Google Scholar] [CrossRef] [Green Version]
  38. Zhang, Y.; Li, Z. Research on Spatial Correlation Network Structure of Inter-Provincial Electronic Information Manufacturing Industry in China. Sustainability 2019, 11, 3534. [Google Scholar] [CrossRef] [Green Version]
  39. Bai, C.; Zhou, L.; Xia, M.; Feng, C. Analysis of the Spatial Association Network Structure of China’s Transportation Carbon Emissions and Its Driving Factors. J. Environ. Manag. 2020, 253, 109765. [Google Scholar] [CrossRef]
  40. Yin, R.; Zhao, B.; Zhang, M.; Wang, C. Analyzing the Structure of the Maritime Silk Road Central City Network through the Spatial Distribution of Financial Firms. Emerg. Mark. Financ. Trade 2020, 56, 2656–2678. [Google Scholar] [CrossRef]
  41. Nemeschkal, H.L. Character Coupling for Taxa Discrimination: A Critical Appraisal of Quadratic Assignment Procedures (QAP)1. J. Zool. Syst. Evol. Res. 2009, 29, 87–96. [Google Scholar] [CrossRef]
  42. Ma, Y.; Xue, F. Deciphering the Spatial Structures of City Networks in the Economic Zone of the West Side of the Taiwan Strait through the Lens of Functional and Innovation Networks. Sustainability 2019, 11, 2975. [Google Scholar] [CrossRef] [Green Version]
  43. Everett, M. Social Network Analysis; Textbook at Essex Summer School in SSDA; University of Essex: Essex, UK, 2002. [Google Scholar]
  44. He, Y.; Lan, X.; Zhou, Z.; Wang, F. Analyzing the Spatial Network Structure of Agricultural Greenhouse Gases in China. Environ. Sci. Pollut. Res. 2021, 28, 7929–7944. [Google Scholar] [CrossRef]
  45. Wang, Z.; Liu, Q.; Xu, J.; Fujiki, Y. Evolution Characteristics of the Spatial Network Structure of Tourism Efficiency in China: A Province-Level Analysis. J. Destin. Mark. Manag. 2020, 18, 100509. [Google Scholar] [CrossRef]
  46. Gu, W.; Liu, H. Spatial Structure, Hierarchy and Formation Mechanisms of Scientific Collaboration Networks: Evidence of the Belt and Road Regions. Chin. Geogr. Sci. 2020, 30, 959–975. [Google Scholar] [CrossRef]
  47. Akbari, H. Exploratory Social-Spatial Network Analysis of Global Migration Structure. Soc. Netw. 2021, 64, 181–193. [Google Scholar] [CrossRef]
  48. Dai, X.; Yan, L. The Spatial Correlation and Explanation of the Evolution of China’s Regional Human Capital Structure—Based on Network Analysis Method. Sustainability 2020, 13, 212. [Google Scholar] [CrossRef]
  49. Zhao, Y.; Zhang, G.; Zhao, H. Spatial Network Structures of Urban Agglomeration Based on the Improved Gravity Model: A Case Study in China’s Two Urban Agglomerations. Complexity 2021, 2021, 1–17. [Google Scholar] [CrossRef]
  50. Sun, Y.; Hou, G. Analysis on the Spatial-Temporal Evolution Characteristics and Spatial Network Structure of Tourism Eco-Efficiency in the Yangtze River Delta Urban Agglomeration. IJERPH 2021, 18, 2577. [Google Scholar] [CrossRef] [PubMed]
  51. Wu, X.; Lu, J.; Wu, S.; Zhou, X. Synchronizing Time-Dependent Transportation Services: Reformulation and Solution Algorithm Using Quadratic Assignment Problem. Transp. Res. Part. B Methodol. 2021, 152, 140–179. [Google Scholar] [CrossRef]
  52. Silva, A.; Coelho, L.C.; Darvish, M. Quadratic Assignment Problem Variants: A Survey and an Effective Parallel Memetic Iterated Tabu Search. Eur. J. Oper. Res. 2021, 292, 1066–1084. [Google Scholar] [CrossRef]
  53. Lu, L.; Fang, K.; Liu, C.M.; Sun, C. The Spatial Network Contagion of Environmental Risks Among Countries Along the Belt and Road Initiative. Front. Environ. Sci. 2021, 9, 721408. [Google Scholar] [CrossRef]
  54. Li, N.; Huang, Q.; Ge, X.; He, M.; Cui, S.; Huang, P.; Li, S.; Fung, S.-F. A Review of the Research Progress of Social Network Structure. Complexity 2021, 2021, 1–14. [Google Scholar] [CrossRef]
  55. George, A.B. Encyclopedia of Social Networks; SAGE Publications, Inc.: London, UK, 2011; ISBN 978-1-4129-7911-5. [Google Scholar]
  56. He, D.; Chen, Z.; Pei, T.; Zhou, J. The Regional and Local Scale Evolution of the Spatial Structure of High-Speed Railway Networks—A Case Study Focused on Beijing-Tianjin-Hebei Urban Agglomeration. Int. J. Geo-Inf. 2021, 10, 543. [Google Scholar] [CrossRef]
  57. Wang, S.; Yang, L. Spatial Competition, Strategic R&D and the Structure of Innovation Networks. J. Bus. Res. 2022, 139, 13–31. [Google Scholar] [CrossRef]
  58. Zhang, Y.; Wu, Z. Research on the Spatial Association Network Structure for Innovation Efficiency of China’s New Energy Vehicle Industry and Its Influencing Factors. PLoS ONE 2021, 16, e0255516. [Google Scholar] [CrossRef] [PubMed]
  59. Wang, K.; Wang, M.; Gan, C.; Chen, Q.; Voda, M. Tourism Economic Network Structural Characteristics of National Parks in the Central Region of China. Sustainability 2021, 13, 4805. [Google Scholar] [CrossRef]
  60. Gan, C.; Voda, M.; Wang, K.; Chen, L.; Ye, J. Spatial Network Structure of the Tourism Economy in Urban Agglomeration: A Social Network Analysis. J. Hosp. Tour. Manag. 2021, 47, 124–133. [Google Scholar] [CrossRef]
  61. Shekhar, S.; Xiong, H. First Law of Geography. In Encyclopedia of GIS; Shekhar, S., Xiong, H., Eds.; Springer: Boston, MA, USA, 2008; p. 321. ISBN 978-0-387-30858-6. [Google Scholar]
  62. Saeed, K.; Prankprakma, P. Technological Development in a Dual Economy: Alternative Policy Levers for Economic Development. World Dev. 1997, 25, 695–712. [Google Scholar] [CrossRef]
  63. Kiplang’at, J.; Ocholla, D.N. Diffusion of Information and Communication Technologies in Communication of Agricultural Information among Agricultural Researchers and Extension Workers in Kenya. S. Afr. J. Libr. Inf. Sci. 2013, 71, 234–246. [Google Scholar] [CrossRef] [Green Version]
  64. Fafchamps, M.; Minten, B. Impact of SMS-Based Agricultural Information on Indian Farmers. World Bank Econ. Rev. 2012, 26, 383–414. [Google Scholar] [CrossRef]
  65. Bustos, P.; Caprettini, B.; Ponticelli, J. Agricultural Productivity and Structural Transformation: Evidence from Brazil. Am. Econ. Assoc. 2016, 106, 1320–1365. [Google Scholar] [CrossRef]
  66. Xing, J. Research on the Impact of Industrial Agglomeration and Structural Upgrade on County Economic Growth under the New Normal Condition—Based on the Empirical Study of 101 Counties in Jiangsu and Zhejiang Provinces. DEStech Trans. Comput. Sci. Eng. 2017, 208–216. [Google Scholar] [CrossRef] [Green Version]
  67. Mao, G.; Dai, X.; Wang, Y.; Guo, J.; Cheng, X.; Fang, D.; Song, X.; He, Y.; Zhao, P. Reducing Carbon Emissions in China: Industrial Structural Upgrade Based on System Dynamics. Energy Strategy Rev. 2013, 2, 199–204. [Google Scholar] [CrossRef]
  68. Conde, R.C.; Nisnovich, N.L.D. Agricultural Development in the Process of Urbanization: Functions of Production, Population Patterns, and Urbanization. In Urbanization in the Americas from Its Beginning to the Present; Schaedel, R.P., Hardoy, J.E., Scott-Kinzer, N., Eds.; De Gruyter Mouton: Berlin, Germany, 1978; pp. 443–458. ISBN 978-90-279-7530-0. [Google Scholar]
  69. Stabler, J.C.; Olfert, M.R.; Greuel, J.B. Spatial Labor Markets and the Rural Labor Force. Growth Chang. 1996, 27, 206–230. [Google Scholar] [CrossRef]
  70. Xie, Y.; Li, M.; Zhou, J.; Zheng, C. Research on Prediction of Agricultural Machinery Total Power Based on Grey Model Optimized by Genetic Algorithm. In Proceedings of the International Conference on Photonics and Image in Agriculture Engineering (PIAGENG 2009), Zhangjiajie, China, 11 July 2009; p. 74901M. [Google Scholar]
  71. Strogatz, S.H. Exploring Complex Networks. Nature 2001, 410, 268–276. [Google Scholar] [CrossRef] [Green Version]
  72. Friedman, J.R. Regional Development Policy: A Case Study of Venezuela; MIT Press: Cambridge, MA, USA, 1966. [Google Scholar]
  73. Abdel-Rahman, H.M.; Wang, P. Toward a General-Equilibrium Theory of a Core-Periphery System of Cities. Reg. Sci. Urban Econ. 1995, 25, 529–546. [Google Scholar] [CrossRef]
  74. Yang, C. Research on the Allocation Efficiency of Agricultural Science and Technology Resources. Ph.D. Thesis, Huazhong University of Science and Technology, Wuhan, China, 2011. [Google Scholar]
  75. Yang, C.; Xu, W.; Kong, L.; Li, X.; Zhang, J. Research on the Allocation Efficiency of Science and Technology Resources of the Academy of Agricultural Sciences—Based on the Panel Data Analysis of 30 Provincial Academy of Agricultural Sciences. South. J. Agric. Sci. 2015, 46, 170–174. [Google Scholar]
  76. Huo, D. Evaluation of the Allocation Efficiency of Agricultural Science and Technology Resources in Gansu Province. Master’s Thesis, Lanzhou University, Lanzhou, China, 2016. [Google Scholar]
  77. Zheng, J.; Yang, D. Calculation and Analysis of the Allocation Efficiency of Agricultural Science and Technology Resources in the Central and Western Regions. Stat. Decis. 2016, 20, 102–105. [Google Scholar]
  78. Yang, C.; Wang, Y.; Tan, Z.; Qin, H. Analysis of Guangxi Agricultural Science and Technology Resource Allocation Structure and Efficiency Measurement. Sci. Technol. Ind. 2017, 17, 32–38. [Google Scholar]
  79. Mao, S.; Wang, X.; Lin, Q. Research on the Structure and Allocation Efficiency of Scientific and Technological Resources of Agricultural Scientific Research Institutions in the Beijing-Tianjin-Hebei Region. Agric. Econ. Manag. 2019, 3, 42–50. [Google Scholar]
  80. Li, Y.; Bai, L. Research on the Allocation Efficiency and Influencing Factors of Agricultural Science and Technology Innovation Resources in Yunnan Province. China Agric. Resour. Reg. Plan. 2019, 40, 63–69. [Google Scholar]
  81. Ma, Y.; Tai, Y.; Lv, J. Evaluation of Ningxia’s Agricultural Science and Technology Resource Allocation Efficiency Based on DEA Model. Jiangsu Agric. Sci. 2021, 49, 224–231. [Google Scholar]
  82. Li, H.; Duan, Z. The Temporal and Spatial Differences in the Allocation Efficiency of Scientific and Technological Resources in the Western Region—An Empirical Analysis Based on the DEA-Malmquist Index Model. Sci. Technol. Econ. 2021, 34, 11–15. [Google Scholar]
  83. Chen, Q.; Zhang, J.; Cheng, L.; Li, Z. Analysis of Regional Differences in the Allocation Ability of Agricultural Science and Technology Resources and Decomposition of Driving Factors. Sci. Res. Manag. 2016, 37, 110–123. [Google Scholar]
  84. Shen, S.; Fu, L.; Li, Z. Research on the Coordinated Development of Agricultural Science and Technology Innovation Resource Allocation and Industrial Structure in Jiangsu Province under the New Normal. Jiangsu Agric. Sci. 2017, 45, 290–294. [Google Scholar]
  85. Xue, P.; Li, G.; Luo, Q.; Liu, S.; Chen, Y. Research on the Regional Differences and Spatial Structure of China’s Agricultural Science and Technology Resources. Agric. Technol. Econ. 2021, 5, 108–120. [Google Scholar]
  86. Yang, C.; Wang, Y.; Xu, W.; Zhang, J. Study on the Structural Effect of Scientific and Technological Resource Allocation of Agricultural Research Institutions Based on Computational Experiments. Sci. Technol. Prog. Policy 2016, 33, 19–27. [Google Scholar]
  87. Deng, M.; Yang, C. Research on the Dynamic Evolution of China’s Agricultural Science and Technology Resource Allocation Efficiency Based on Super-Efficiency DEA Model. China Agric. Resour. Reg. Plan. 2017, 38, 61–66. [Google Scholar]
  88. Dong, M. Research on the Allocation Efficiency and Influencing Factors of My Country’s Agricultural Science and Technology Innovation Resources. East China Econ. Manag. 2014, 28, 53–58. [Google Scholar]
  89. Chen, Z.; Sarkar, A.; Rahman, A.; Li, X.; Xia, X. Exploring the Drivers of Green Agricultural Development (GAD) in China: A Spatial Association Network Structure Approaches. Land Use Policy 2021, 112, 105827. [Google Scholar] [CrossRef]
  90. Hou, M.; Deng, Y.; Yao, S. Spatial Agglomeration Pattern and Driving Factors of Grain Production in China since the Reform and Opening Up. Land 2021, 10, 10. [Google Scholar] [CrossRef]
Figure 1. Temporal and spatial evolution analysis of ASTR.
Agriculture 11 01170 g001
Figure 2. China’s agricultural science and technology resource allocation efficiency spatial relation network.
Agriculture 11 01170 g002
Figure 3. Characteristic pattern of the overall network structure of allocation efficiency.
Agriculture 11 01170 g003
Figure 4. The transfer relationship among the four major plates of correlation network.
Agriculture 11 01170 g004
Figure 5. The core–periphery structure of the spatial correlation network.
Agriculture 11 01170 g005
Table 1. Allocation efficiency index system for the of ASTR.
Input IndicatorsThe Name of the IndicatorOutput IndicatorsThe Name of the Indicator
Human inputPractitioners (persons) in scientific research institutionsAcademic outputPublished scientific papers (articles)
R&D personnel (people)Publishing scientific and technological works (kinds)
Full-time equivalent of the R&D personnel (human year)
Material inputActual completion of capital investment (thousands of dollars)Technical outputNumber of patents accepted (pieces)
Research Infrastructure (Thousands)Number of patents granted (pieces)
Year-end fixed assets (thousands of yuan)Number of patents for valid inventions (pieces)
Financial inputInternal expenditure of scientific research institutions this year (thousands of yuan)Economic outputTechnical income from non-government funds (thousands of dollars)
Internal expenditure on R&D (thousands of dollars)Production and operation income (thousands of yuan)
Table 2. Indexes used to measure the overall structural characteristics of the spatially correlation network of ASTR allocation efficiency.
IndexIndicator Meaning
Network densityIndicates the density and complexity of the spatial network relationship of the allocation efficiency of ASTR; the greater the value, the closer the connection between regions.
Network correlationReflects the stability and fragility of the network structure of agricultural science and technology resource allocation efficiency.
Network levelCharacterizes the asymmetrical reachability in the spatial network node of agricultural science and technology resource allocation efficiency.
Network efficiencyIndicates the number of spatially associated channels for the ASTR allocation efficiency; the lower the network efficiency value, the more associated channels.
Degree centralityMeasures the status of each member in the overall network; the higher the value, the greater the relationship generated by the member, and the more prominent the central position in the network.
Close to centralityDepicts the degree of direct correlation between a single member and other members in the associated network; the higher the value, the more direct relationships the member has.
Middle centralityReflects the degree of control of a member of the network over the relationship between other members, that is, the degree of mediation; the higher the value, the more obvious the mediation.
Table 3. The calculation and explanation of the main indicators of the analysis of the spatial correlation network characteristic of the ASTR allocation efficiency.
IndexFormulaDescription
The overall networkNetwork density D = L N × N 1 The ratio of the actual number of relationships to the total number of theoretical maximum relationships
Network correlation C = 1 V N × N 1 2 The degree of direct or indirect reachability between any two members
Network level H = 1 K max K The degree of asymmetrical reachability between members in the network
Network efficiency E = 1 M max M Extent of redundant connections in the network
Individual networkDegree centrality D C = n N 1 The ratio of the number of members directly associated with a member to the maximum possible total number of members directly associated
Close to centrality C C = j = 1 N d i j The sum of the shortcuts distance between a member and other members in the network
Middle centrality B C = 2 j N k N b j k i N 2 3 N + 2 , b j k i = g j k i g j k The extent to which members of the network play an intermediary role for other members
Note: N is the total number of members in the network; L is the number of actual associated relationships; V is the number of unreachable member pairs in the network; K is the number of symmetrically reachable member pairs in the network; M is the number of redundant lines in the network; n is the number of other members directly associated with a member in the network; dij is the shortcut distance between the two members, i.e., the number of relationships contained in the shortcut; gjk is the number of shortcuts between members j and k, and gjk(i) is the shortcut number between members j and k passes through the member i, then bjk(i) is the probability that member i is on the shortcut between j and k, j ≠ k ≠ i and j < k.
Table 4. Classification standards of the four major plates.
The Proportion of the Internal Relationships of the PlatesThe Proportion of Relationships Received by the Plate
Close to 0Less than 0
≥(gq-1)/(g-1)Two-way overflow plateNet benefit plate
<(gq-1)/(g-1)Net spillover plateMiddlemen plate
Table 5. The four major plates in China’s agricultural science and technology resource allocation efficiency network.
TypeMeaning
Net spillover plateMembers of this plate sent significantly more spillover relationships than those received by other plates
Net benefit plateMembers of this plate received significantly more spillover relationships than those sent by other plates
Two-way overflow platesThere are more spillover relationships between the internal members of the plate and more external spillovers to the plate
Middlemen plateThe internal members of the plate have relatively few connections and more contacts with external members outside of the plate The member sends and receives the spillover relationships with members external to the plate
Table 6. The centrality of the spatial correlation network of China’s allocation efficiency in 2018.
ProvinceDegree CentralityClose to CentralityMiddle Centrality
Point-OutPoint-InThe TotalCentralityRankCentralityRankCentralityRank
Beijing8243283.333385.714314.1102
Tianjin8172560.000571.42955.2455
Hebei54920.0002955.556290.15227
Shanxi651123.3332056.604200.22721
Inner-Mongolia551023.3332056.604200.22524
Liaoning53820.0002955.556290.08630
Jilin61720.0002955.556290.08630
Heilongjiang81926.6671357.692130.24519
Shanghai6263286.667288.235213.5223
Jiangsu3273090.000190.909115.5411
Zhejiang4202470.000476.92347.0384
Anhui3101333.3331060.000100.79510
Fujian791643.333763.83071.9857
Jiangxi761323.3332056.604200.22622
Shandong8101840.000862.50081.0919
Henan671326.6671357.692130.31216
Hubei731023.3332056.604200.13928
Hunan731023.3332056.604200.22622
Guangdong10112146.667665.21762.3706
Guangxi641026.6671357.692130.29517
Hainan71823.3332056.604200.13429
Chongqing741126.6671357.692130.36015
Sichuan931230.0001258.824120.55011
Guizhou72923.3332056.604200.23820
Yunnan821026.6671357.692130.41213
Tibet80826.6671357.692130.36414
Shaanxi1021233.3331060.000100.49912
Gansu1031340.000862.50081.3438
Qinghai80826.6671357.692130.22225
Ningxia70723.3332056.604200.22026
Xinjiang70723.3332056.604200.25118
Average6.8716.87113.74235.914-62.130-2.210-
Table 7. Analysis of spillover effects of each section of the spatial correlation network.
PlateNumber of Relationships ReceivedMember NumberNumber of External Relationships Receiving PlatesNumber of Spillover Plate RelationshipsTotal Number of Spillover RelationshipsProportion of Internal Relationships Expected (%).Actual Proportion of Internal Relationships (%).Plate Role Division
iiiiiiiv
I6213334518246.666725.0000Two-way overflow
II17319586232413.333323.3333Net benefit
III25271331018558030.000019.1176broker
IV19572131325789740.000014.2857Net spillover
Table 8. Density matrix and image matrix of each section of China’s agricultural science and technology resource allocation efficiency spatial correlation network.
PlateDensity MatrixImage Matrix
12341234
11.0000.1330.4330.0771010
20.0670.3500.0600.2920101
30.8330.5400.1440.0231100
40.4870.8770.0150.0831100
Table 9. QAP correlation analysis of the spatial correlation network and its driving factors.
VariableActual Correlation FactorThe Level of SignificanceThe Mean of the Correlation CoefficientStandard DeviationMinimumMaximump ≥ 0p < 0
Distance0.17630.00020.00050.0362−0.12340.13350.00021.000
Indus0.18060.0098−0.00020.06590.16430.26440.00980.9904
Labor0.04280.2110−0.00060.0576−0.14410.24450.21100.7892
Urban0.34780.00020.00030.0654−0.16640.29680.00021.0000
Mech0.02670.2985−0.00010.0606−0.14810.27530.29850.7017
Pgdp0.50260.00020.00070.0635−0.14610.29030.00021.000
Inform0.00190.46010.00020.0586−0.16560.21350.46010.5401
Table 10. The results of the regression of the drivers of the spatial correlation.
Variable2009201220152018
Distance0.2122 ***
(0.0353)
0.2598 ***
(0.0338)
0.2531 ***
(0.0003)
0.2694
(0.0350)
Indus−0.0175
(0.3580)
0.0504 *
(0.3529)
0.0314
(0.3729)
0.0119
(0.2617)
Labor0.0135
(0.0000)
0.0029
(0.0000)
0.0058
(0.0000)
0.0330
(0.0000)
Urban−0.2109 **
(0.0024)
−0.1227 **
(0.0022)
−0.0807 *
(0.0022)
−0.0697 **
(0.0017)
Mech0.0384
(0.0000)
0.0278
(0.0000)
0.0674
(0.0000)
0.0214
(0.0000)
Pgdp0.6955 ***
(0.0000)
0.5988 ***
(0.0000)
0.5760 ***
(0.0000)
0.5938 ***
(0.0000)
Inform0.0490
(0.0003)
0.0157
(0.0003)
0.0106
(0.0004)
0.0042
(0.0004)
R20.30430.30810.30860.3258
Adj-R20.29890.30280.30340.3207
p-Value0.00000.00000.00000.0000
Observations930930930930
The number of random
displacements
5000500050005000
Note: The coefficients of the variables in the table are standardized regression coefficients; *, **, *** indicate significant at the levels of 10%, 5%, and 1%, respectively. The value in brackets indicates the probability that the regression coefficient generated by random replacement is not less than actually observed regression coefficient.
Publisher’s Note: MDPI stays neutral with regard to jurisdictional claims in published maps and institutional affiliations.

