Article

Crop Models: Important Tools in Decision Support System to Manage Wheat Production under Vulnerable Environments

1
Agro-Climatology Laboratory, Department of Agronomy, University of Agriculture, Faisalabad 38040, Pakistan
2
Department of Agronomy, MNS University of Agriculture, Multan 60000, Pakistan
3
Fooder Research Sub-Station, AARI, Faisalabad 38850, Pakistan
4
Institute of Food and Agricultural Sciences, University of Florida, Gainesville, FL 32611, USA
*
Author to whom correspondence should be addressed.
Agriculture 2021, 11(11), 1166; https://doi.org/10.3390/agriculture11111166
Submission received: 5 September 2021 / Revised: 5 October 2021 / Accepted: 13 October 2021 / Published: 19 November 2021
(This article belongs to the Special Issue Application of Decision Support Systems in Agriculture)

Abstract

:
Decision support systems are key for yield improvement in modern agriculture. Crop models are decision support tools for crop management to increase crop yield and reduce production risks. Decision Support System for Agrotechnology Transfer (DSSAT) and an Agricultural System simulator (APSIM), intercomparisons were done to evaluate their performance for wheat simulation. Two-year field experimental data were used for model parameterization. The first year was used for calibration and the second-year data were used for model evaluation and intercomparison. Calibrated models were then evaluated with 155 farmers’ fields surveyed for data in rice-wheat cropping systems. Both models simulated crop phenology, leaf area index (LAI), total dry matter and yield with high goodness of fit to the measured data during both years of evaluation. DSSAT better predicted yield compared to APSIM with a goodness of fit of 64% and 37% during evaluation of 155 farmers’ data. Comparison of individual farmer’s yields showed that the model simulated wheat yield with percent differences (PDs) of −25% to 17% and −26% to 40%, Root Mean Square Errors (RMSEs) of 436 and 592 kg ha−1 with reasonable d-statistics of 0.87 and 0.72 for DSSAT and APSIM, respectively. Both models were used successfully as decision support system tools for crop improvement under vulnerable environments.

1. Introduction

Decision support systems are important in modern agriculture. Agricultural produce demand is increasing, and more production will be required from limited available land. Decision support systems are very important for judicious use of available farm resources for raising farm production within a limited area. Wheat (Triticum aestivum L.) is the most important cereal crop in the world and is a staple food of about one third of the world’s population. It is the principal source of carbohydrates for humans. Its straw constitutes an essential part of livestock feed and provides raw material for the paper industry. Wheat demand is continuously increasing to feed the growing population in many countries such as Pakistan. Decision support systems will be helpful for farmers to address various challenges emerging due to climate change, which is among the major threats to wheat production in Pakistan. Crop models are very effective scientific tools widely used for economical and environmentally sound crop production decisions to quantify the critical yield gap between actual and climatic potential of wheat [1,2]. Crop models assist in categorizing ideotypes that are well adapted to specific environmental conditions, and to understand interactions between genotypes, environment and management [3,4]. Models are used for nitrogen use efficiency, as it is the most limiting factor for crop production under semiarid regions, which are generally nitrogen deficient [5,6,7,8,9].
Crop models can be used to guide farmers to make crop management decisions to minimize the risks associated with environmental variability and optimize the use of limited available resources such as nitrogen [10,11]. It is becoming communal practice to apply crop models in assessing agricultural impacts and to study the spatial crop yield variability for precision farming at the regional scale [12,13]. Simulation models provide an alternative method for exploring short and long-term agronomic management practices for efficient use of resources and time [14,15]. Crop models allow stakeholders to test hypotheses and carry out virtual experiments concerning plant growth that could otherwise take years to test under field conditions. Simulation models take minimal time compared to field experiments to observe the potential impact of various management strategies and suggest changes in management to the farmer, whereas other studies take a much longer time before achieving an outcome [16]. Crop models can be tested directly on a specific farmer’s field after calibration and validation with a local field experimental dataset; to save the time and cost of experimentation [17]. The decision support systems for agro-technology transfer (DSSAT) and Agricultural Production System Simulator (APSIM) allow stakeholders to combine technical knowledge, phenology, crop growth, development and production function with economic and environmental impacts to facilitate economic analysis and risk assessment of farming enterprises [18,19]. Crop model development and validation at the experiment level is most important for improving the understanding of fundamental processes of crop production, supporting strategic agricultural management decisions and ensuring crop productivity [20,21,22,23]. The DASSAT and APSIM have the capability to simulate wheat crop growth in response to nitrogen and genotypes more efficiently than various field experiments [24,25]. However, neither model has been tested under field conditions in Pakistan and no information on the intercomparison of models for their improvement is available.
Comparison of different crop models can predict the uncertainties associated with crop growth, development and yield, including model structure uncertainty that is very difficult to quantify [18,26,27]. Comparison of models can provide an opportunity to identify systematic errors, while minimizing these errors can improve the models and provide accuracy assessment. Many studies have been conducted for prediction of yield variability due to environment and crop management by comparing mechanistic crop models [28,29,30,31]. Model comparison variability analysis at field and regional scales is most important for assessing crop growth and yield under suboptimal conditions, nutrient limitation and cultivar response [32]. However, in Pakistan, limited work has been reported on crop model intercomparison experimentally, or in farmers’ fields, concerning the impacts of the environment, especially on the wheat crop. The main thrust of this study was (1) calibration of DSSAT and APSIM models with experimental data and intercomparison for assessing agronomic management, and (2) assessing the models’ performances in farmers’ fields in rice-wheat cropping systems.

2. Material and Methods

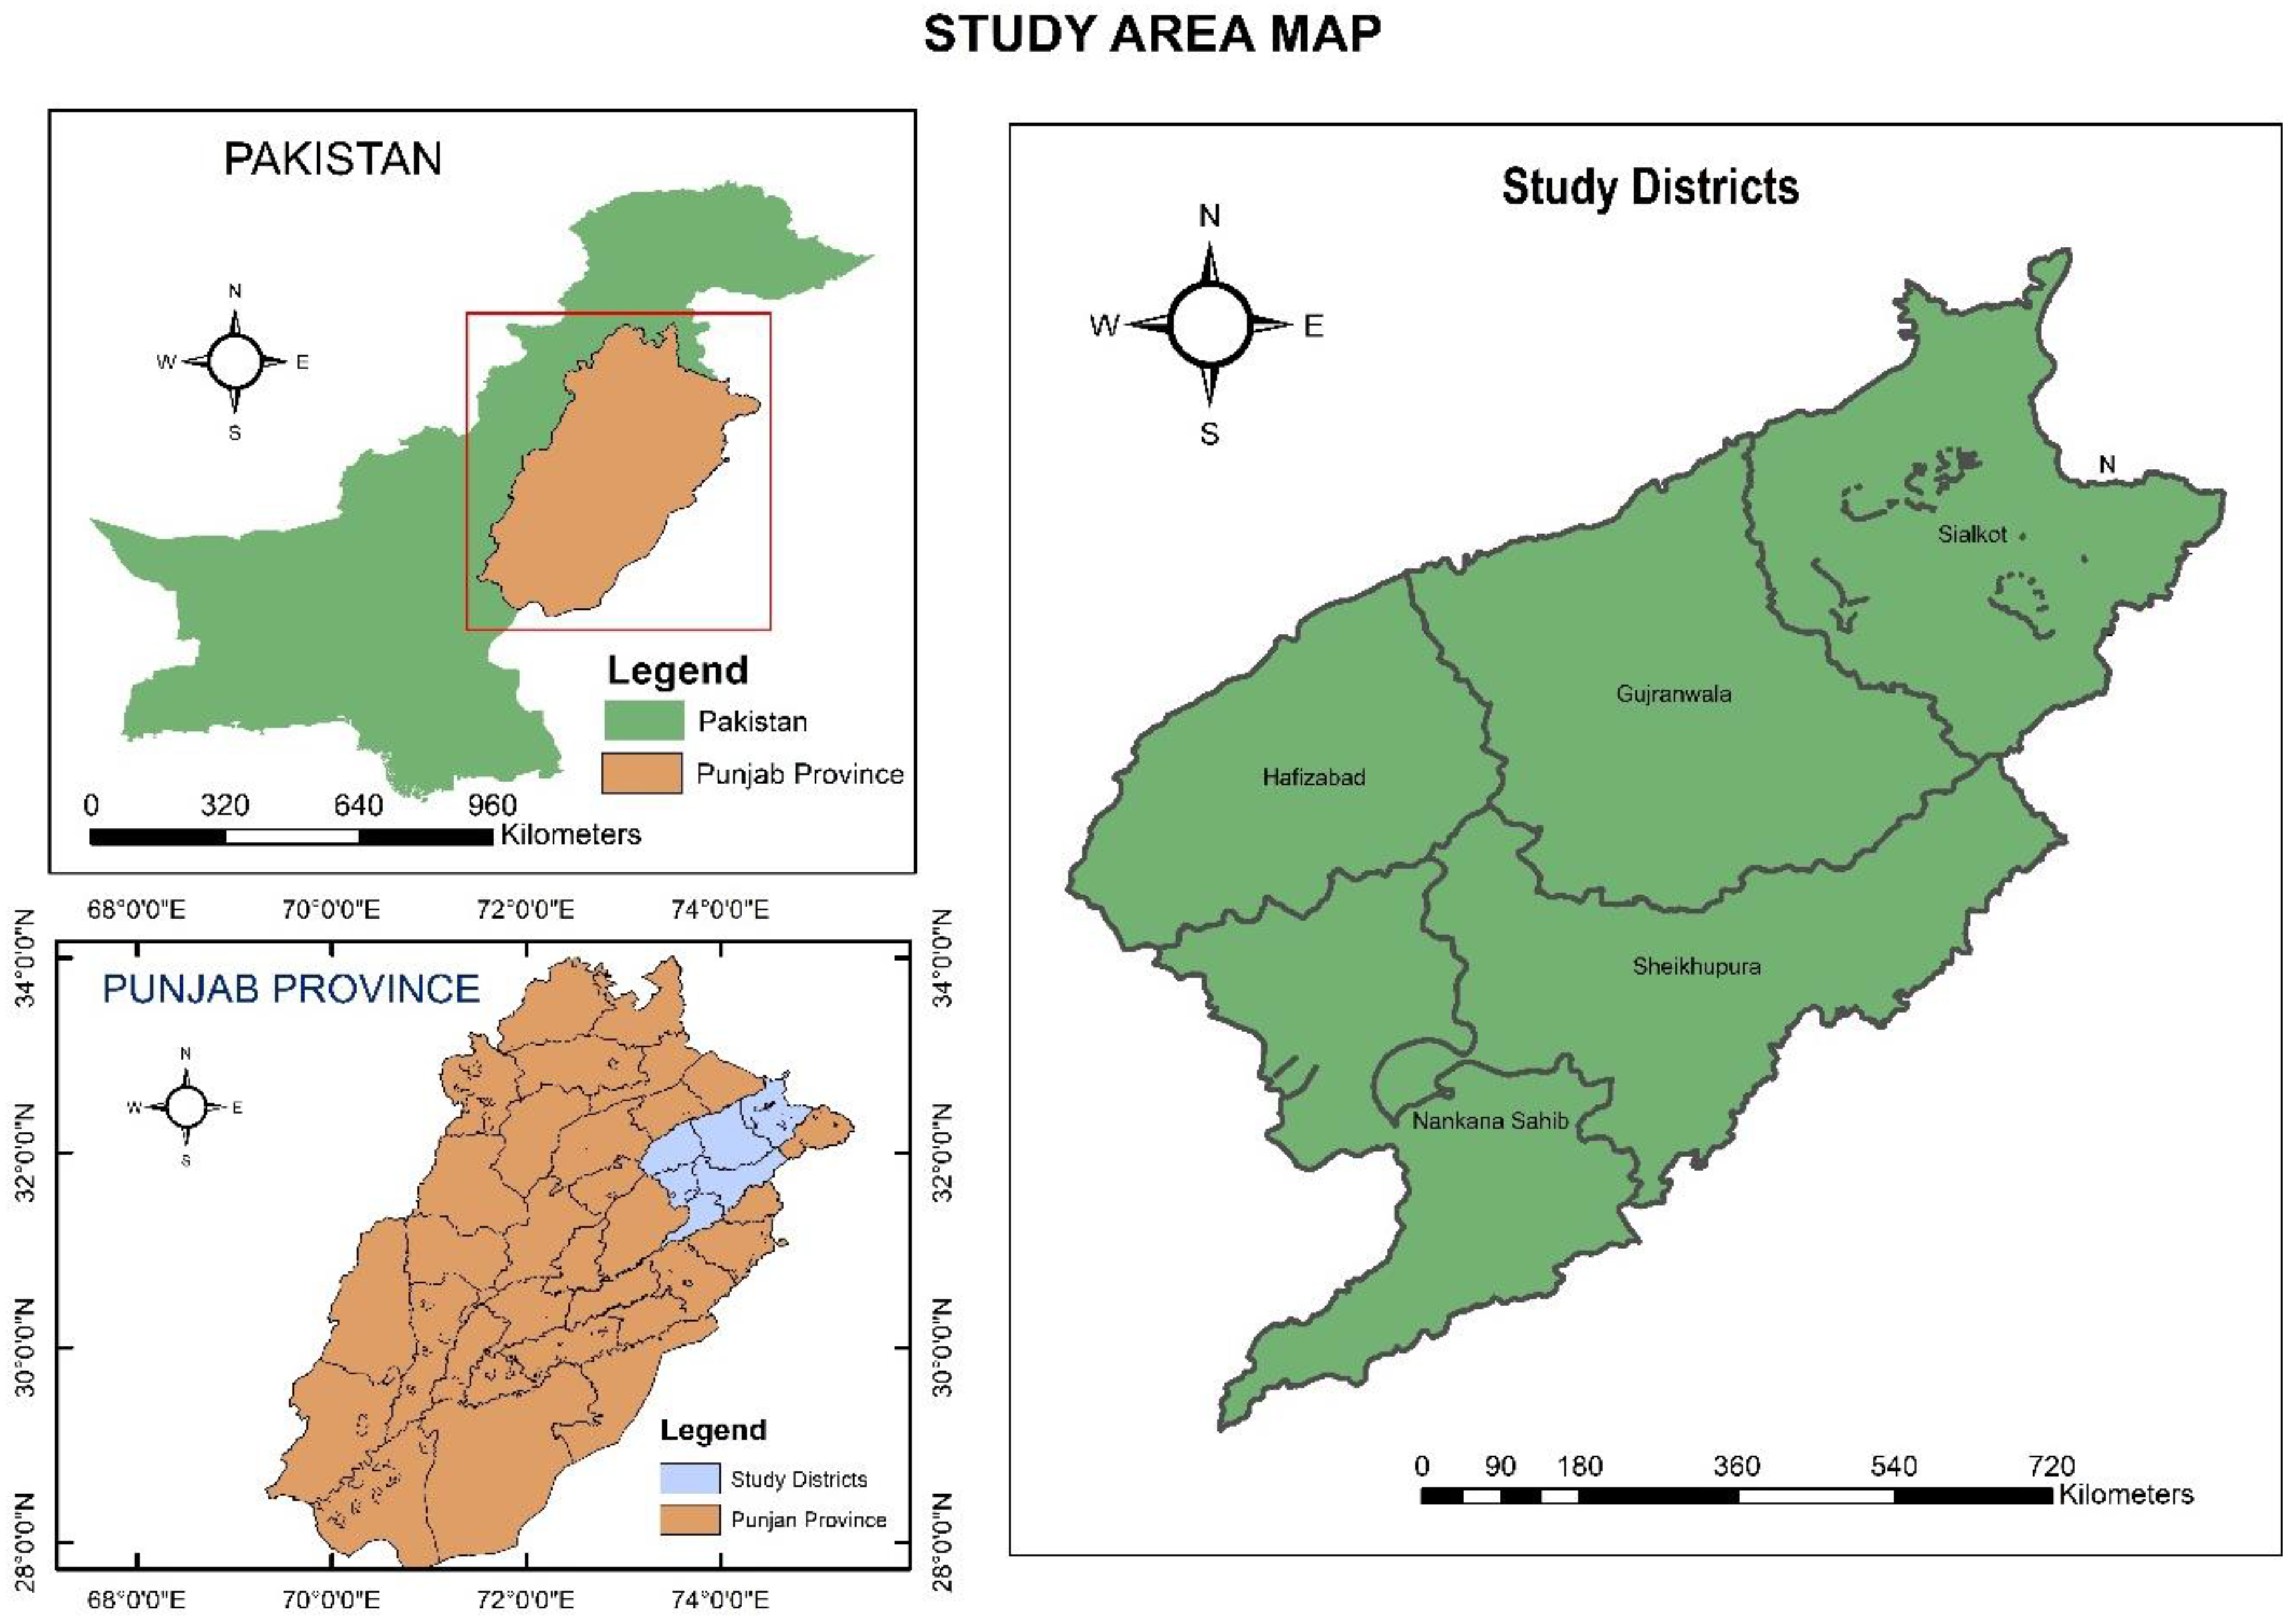
2.1. Field Experiments

Field experiments were conducted during 2008 and 2009 to evaluate the performance of promising wheat cultivars and nitrogen management under the semiarid environment of Faisalabad. The experiment was laid out in a split plot design with three replications. Three wheat cultivars (Sehar-2006, Faisalabad-2008 and Lasani-2006) were grown in the main plot while four nitrogen rates (0, 55, 110 (standard) and 220 kg ha−1) were randomized in subplots. Moreover, 220 kg ha−1 was added during the 2009 experiment to check its impact on wheat productivity and the models’ responses to high nitrogen rates.

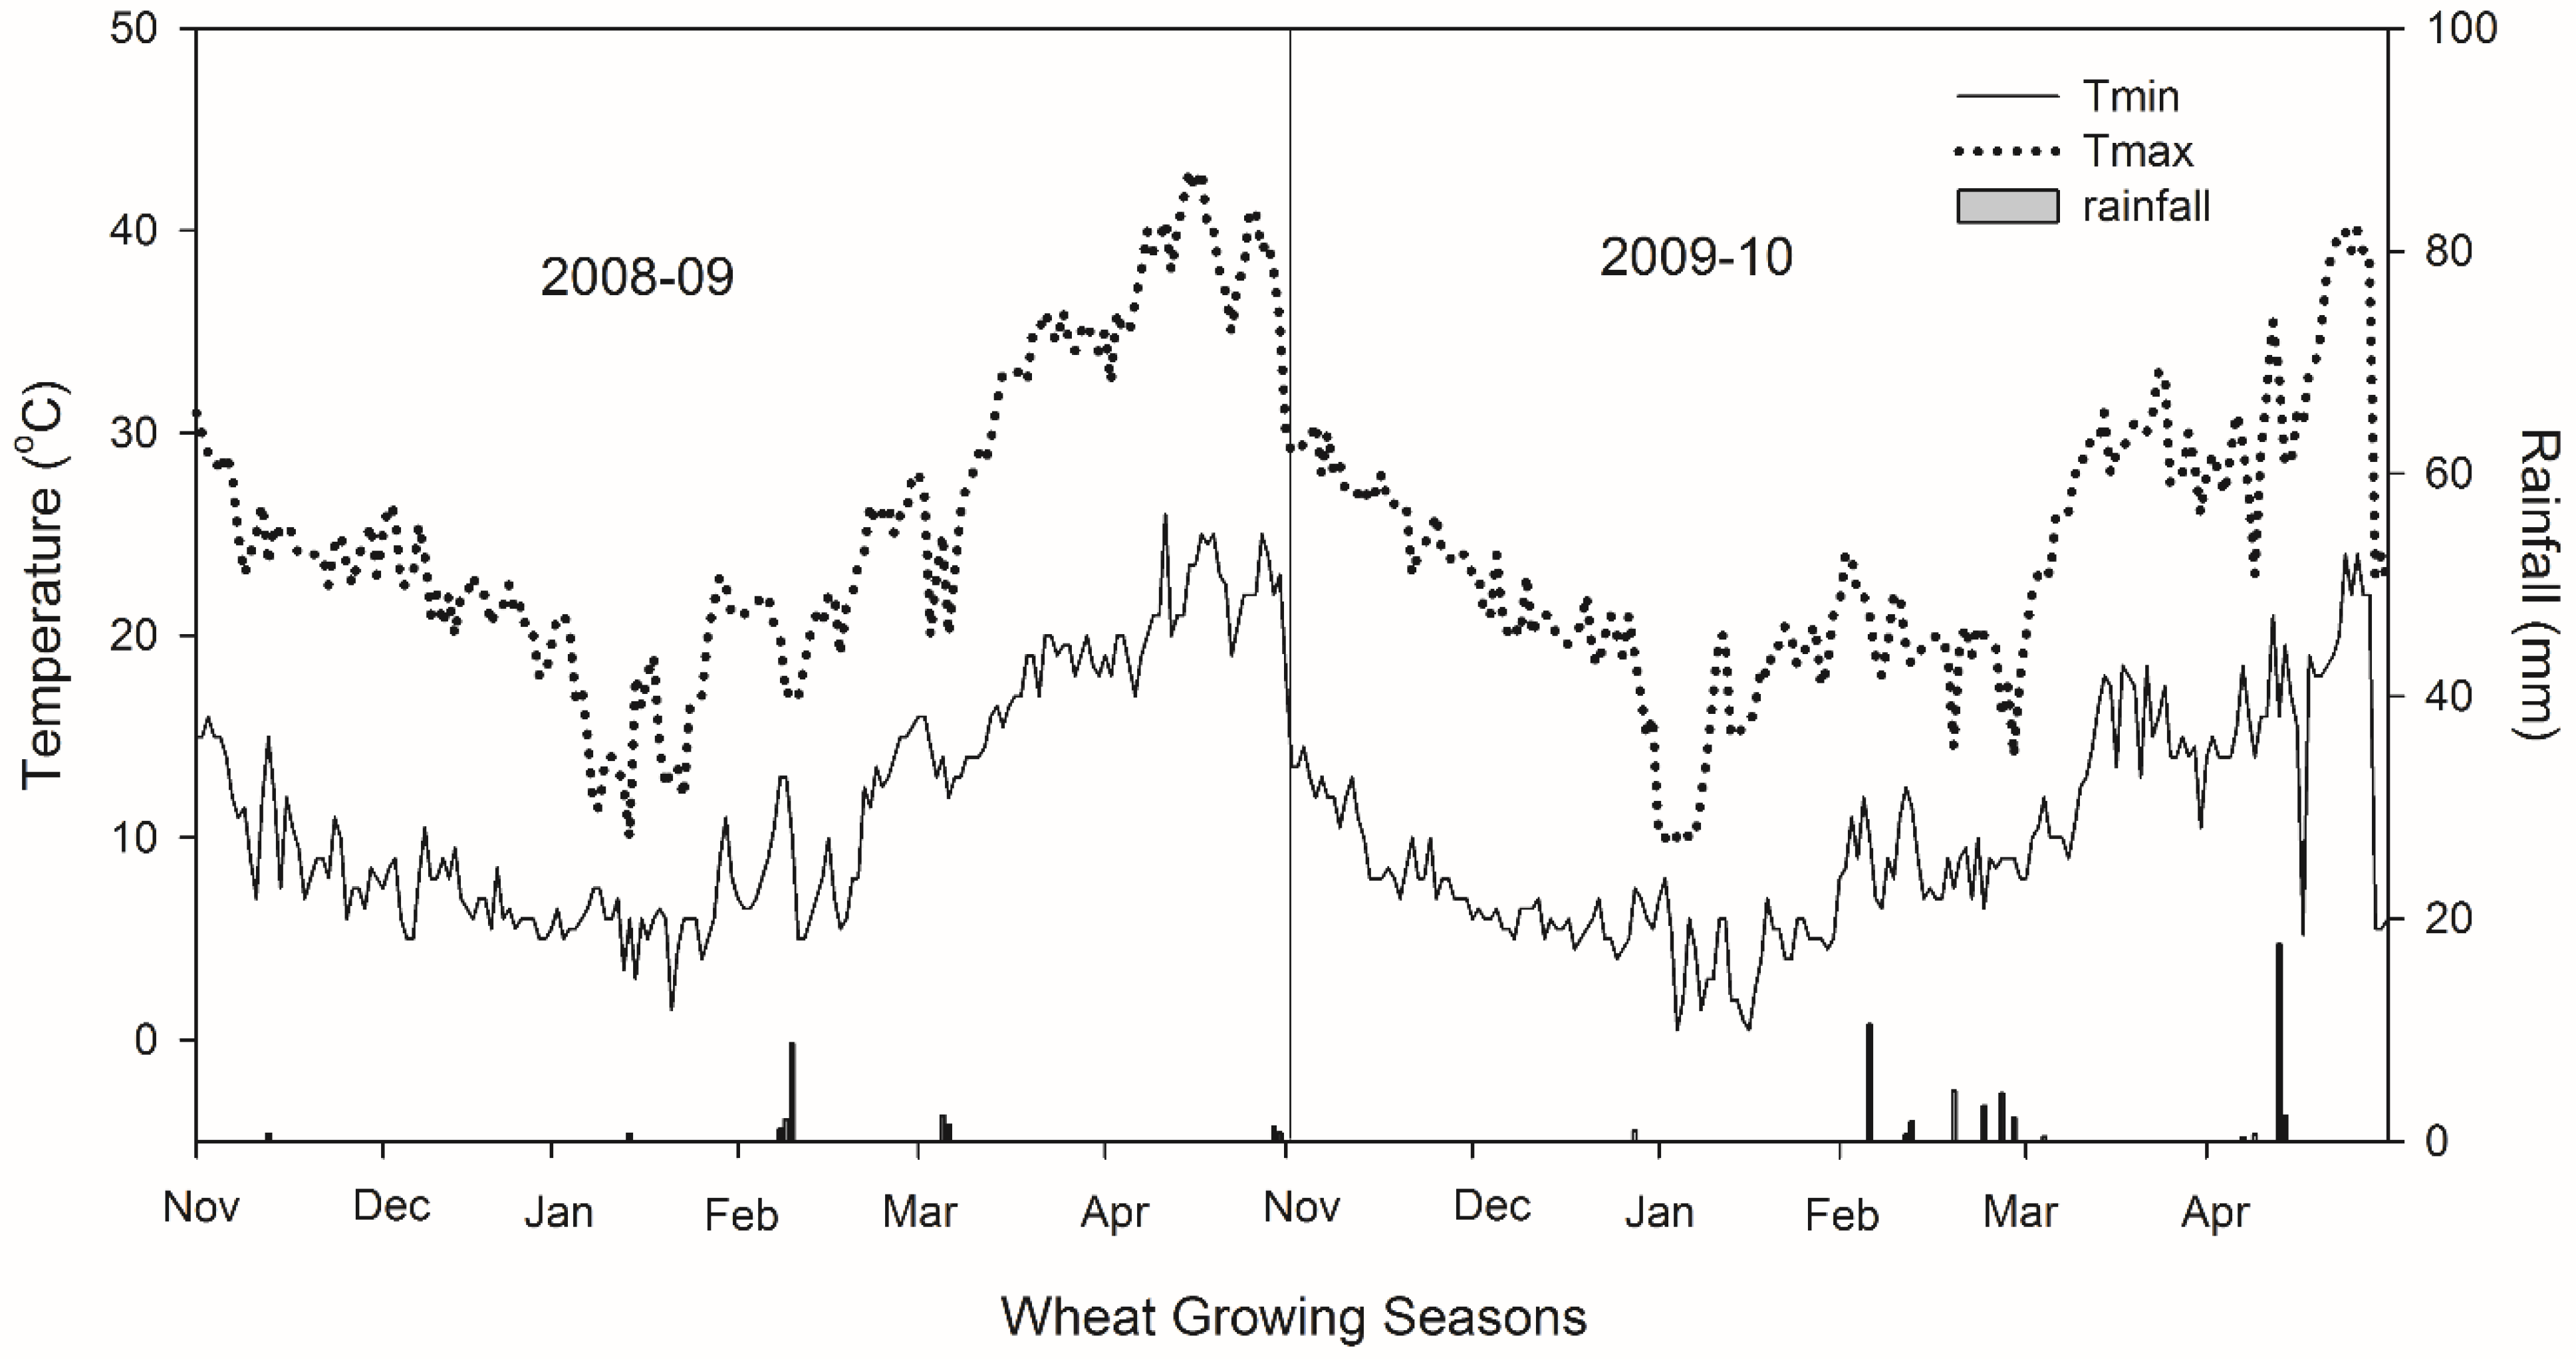
2.2. Environmental Conditions of the Experimental Site

Standard environmental data (daily maximum and minimum air temperature (°C), rainfall, (mm), and daily sunshine hours (h) were recorded by a weather station installed close to the field experiments. Average temperature ranged from 13.5 to 26.3 °C during spring seasons of 2008 to 2009 and 2009 to 2010. Average sunshine hours of 6 to 9.2 per day were recorded. More rainfall was recorded in the months of March and April during the growing season of 2009 to 2010. Maximum total rainfall of 22.9 mm occurred in the month of April. Temperature was lower at early stages of growth and higher at the grain formation stage, while overall less radiation was recorded during the 2009 to 2010 season. The mean temperature was too high during the months of March and April and caused the shriveling of grains, resulting in reduced grain yield (Figure 1).

2.3. Soil Characteristics at the Experimental Site

The soil at the test site is a silty loam, brown in color, well drained and strongly calcareous in nature. Soil was analyzed up to 30 cm depth to determine the physiochemical characteristics before and after the harvest of the crop. Chemical and physical properties of the Lyallpur (Faisalabad) soil series indicated high pH, and low N (<1%) and organic carbon (<1%) content. The soil had less organic carbon in different horizons (0.89–0.42) due to oxidation promoted by high temperature. The experimental area soils were deficient in nitrogen (0.01% to 0.7%), which decreased in the subsoil. Soil bulk density was lower in the upper soil and increased with soil depth (1–1.53 g cm−3).

2.4. Measurements of Lyallpur Soil Series Data

Representative composite soil samples were collected from the master horizon of AP, B2, B3Ca and C at a depth of 15–142 cm using a soil augur prior to sowing of the experimental seeds. The soil samples were then air-dried, crushed, and passed through a 2 mm sieve for the analysis of soil physical and chemical properties. The main morphological feature of the Lyallpur soil series profile indicated that topsoil color and structure were uniform but varied with increasing the depth. The protocol for sample analysis and collection was reported by [33]. The physical and chemical features indicated that clay percentage increased from 26 to 32%. The organic carbon percentage was decreased from 0.89 to 0.42% from the AP to C horizon. This decrease in organic carbon was due to high temperature, which promoted its oxidation. The soil profiles (AP, B2) had neutral pH while B3Ca and C profiles were alkaline in nature. Total N% was higher in AP profile (0.07), then, it decreased to 0.03% in B2. The bulk density of soil was lower at soil surface, then, increased with soil depth from 1–1.53 g cm−3. Drainage upper limit (DUL) and lower limit (SLL) and Sat. hydraulic conductivity in cm h−1 were calculated by the models.

2.5. Sampling Methodology Regarding Growth Parameters

Wheat was planted during second week of November during both years with a seed rate of 100 kg ha−1 by maintaining row to row distance at 30 cm. Crop growth and phenological data were recorded from each experimental plot. Physiological maturity was monitored regularly by sampling grain from primary tillers. In each growing season, seven growth samples were recorded with an interval of 14 days. Plants in one meter were arbitrarily harvested from each experimental unit. Plant samples were divided into leaves, stem, and grains according to the crop stage. Fresh weight of all the components was measured. Sub-samples of 200 g of leaves and stem were oven-dried up to a persistent weight at 60 °C for dry weight determination. Leaf area was calculated by measuring the area of 100 g of leaves using an electronic leaf area meter (Licor, model 3100, LI-COR Biosciences, Lincoln, NE, USA). The leaf area index (LAI) was calculated as the ratio of total leaf area to occupied surface area. Crop was harvested manually at maturity and all the yield-related parameters were measured.

2.6. Farmers’ Field Data

Extensive farm surveys of 155 farms from five districts, namely Sheikhupura, Nankana Sahab, Hafizabad, Gujranwala and Sialkot were conducted by using the stratified random sampling technique because of the heterogeneous nature of the population in these regions (Figure 2). Each district was taken as a separate stratum, because of its own climatology and topography and two villages were taken randomly from each stratum. From each stratum, 30 respondents (15 farms from each village) were chosen randomly so that the selected farms can be considered as true representative of the farming population. The household data including crop management practices, planting date, plant population, sowing method, irrigation amount, fertilizer application schedule, initial field conditions, cultivar and data on final harvest such as biomass and yield, were used as input dataset for both crop models.

2.7. Climatic Conditions of Rice-Wheat Cropping System

The climatic data of Sheikhupura and Sialkot meteorological observatories installed by the Pakistan meteorological department were used for this study. The quality of the weather data was checked, and data were transformed into AgMIP file according to its protocol. The historic data for the Hafizabad, Nankana sahib and Gujranwala were obtained from the global AgMERRA (Modern Era-Retrospective Analysis for Research and Applications), it was estimated in a manner like the gap filling bias adjustment of the AgMIP protocols. Climate of the rice-wheat cropping area is semiarid with an average annual maximum and minimum temperatures of 31.2 °C and 17.2 °C, respectively. The annual precipitation ranges from 300–400 mm. Mean seasonal maximum and minimum temperatures is about 37.1 °C and 24.3 °C, respectively. Monthly climatology differences were calculated between the AgMERRA dataset for Hafizabad and Nankana Sahib from where the distance was greater than 50 km from the weather station while for Gujranwala, the distance was less than 50 km.

2.8. Soil and Soil Series Characteristics of Rice-Wheat Cropping System

Soil series (Kotli, Sultanpur, Sagar, Bahawal, Pindorian, Shahpur, Eminaabad, Khurrianwala, Jaranwala) were dominant in the surveyed region and used for 155 farmer’s field model validation of five strata in the rice-wheat cropping system. Soil series data about soil physical, chemical and morphological features were collected form the soil survey department of Pakistan.

2.9. Crop Models Descriptions and Calibration

The CSM-CERES-wheat embedded in DSSAT4.5 [1,18] and APSIM 7.5 were used in this study. CERES-wheat uses carbon, nitrogen, water, and principles of energy balance to simulate the processes regarding growth and development of wheat [1]. The Century soil OM module is integrated into the DSSAT v4.5 to model the dynamics of soil organic nutrient processes [34,35]. Model users often wish to “calibrate” the model or to estimate some or all parameters by fitting the overall model outputs to field data [36]. The model has specific parameters information related to crop in species and cultivar files which define day length sensitivity, heat unit accretion required for each specific growth and development stage. Wheat crop data about phenology, growth, yield, and yield components collected from field trials were used for estimation of genetic coefficients in both crop models. Models were then calibrated with experimental data collected during 2008–2009 for cultivars using the recommended nitrogen (110 kg ha−1) in non-stress conditions and were evaluated with the rest of nitrogen treatments. Sensitivity analyses were also used to test the performance of each crop coefficient in CERES-DSSAT. Wheat genetic coefficients required for CERES model calibration include P1D (Photoperiod sensitive), P1V (vernalization sensitive), P5 (thermal time from the onset of linear fill to maturity), PHINT (thermal time between the appearance of leaf tips) for phenology simulation while G3 (tiller death coefficient), G2 (potential kernel growth rate), G1 (kernel number per unit weight of stem + spike at anthesis), deal with grain yield simulation.
The APSIM version 7.5 was used to simulate the phonological development, biomass growth and yield. NWHEAT is interlinked with soil water (SOILWAT), soil nitrogen (SOILN), surface crop residue (RESIDUE), fertilizer and irrigation sub-module for wheat simulation [18,37]. The four genetic coefficients in APSIM (Emerg_to_endjuv, Startgf_to_mat, Vern_sens and Photop_sens) affect the phonological development while Potential_grain_filling_rate, Grains_per_gram_stem and Max_grain_size deal with grain yield [18,38]. During the model calibration process, the phenology parameters were calibrated before the parameters related to the yield component [39,40], to improve the accuracy of calibration process.

2.10. Statistical Analysis

Simulation performance of the models were evaluated by calculating different statistic indices, such as the root mean square error (RMSE), mean percentage difference (MPD), an index of agreement (d) with the Equations (1)–(4), respectively [41].
R M S E = [ i = 1 n ( p i o i ) 2 / n ] 0.5    
M P D = [ i = 1 n ( | o i p i | o i ) 100 ] / n
Error   ( % ) = ( ( p o ) o ) 100
d = 1 - [ i = 1 n ( p i o i ) 2 i = 1 n ( | p i | + | o i | ) 2 ]
where pi and oi are the predicted and observed values for studied variables, respectively, and n is the number of observations. Linear regression analysis between simulated and observed grain yield and biomass at harvest was done to evaluate the performance of the model at different locations. The model performance improved as the R2 and d value approach unity while RMSE, MPD and error proceed to zero.

2.11. Models Evaluation at Farmers’ Field

After calibration and evaluation, the models were further evaluated with farmer’s field data keeping the cultivar coefficients constant. Farmers of the selected sites have small and scattered land with one to ten hectares area. Locally adopted promising cultivars (Faisalbad-2008, Lasani-2008 and Sehar-2006) were planted by broadcasting wheat seed using variable seed rates (111–136 kg ha−1) in November to January while the recommended planting time is November in the rice-wheat cropping region. Crops were harvested from the 1st week of April to 3rd week of May according to survey data. Nitrogen was commonly applied in the form of urea @ 79 to 164 kg ha−1 while phosphorous as DAP, SSP and TSP @ 56 to 113 kg ha−1. No potash fertilizer was used due to availability of canal irrigation water (200–450 mm) in the region. A full dose of phosphorous and half nitrogen was applied at the time of land preparation while second half dose of nitrogen was broadcasted at first irrigation.

3. Results

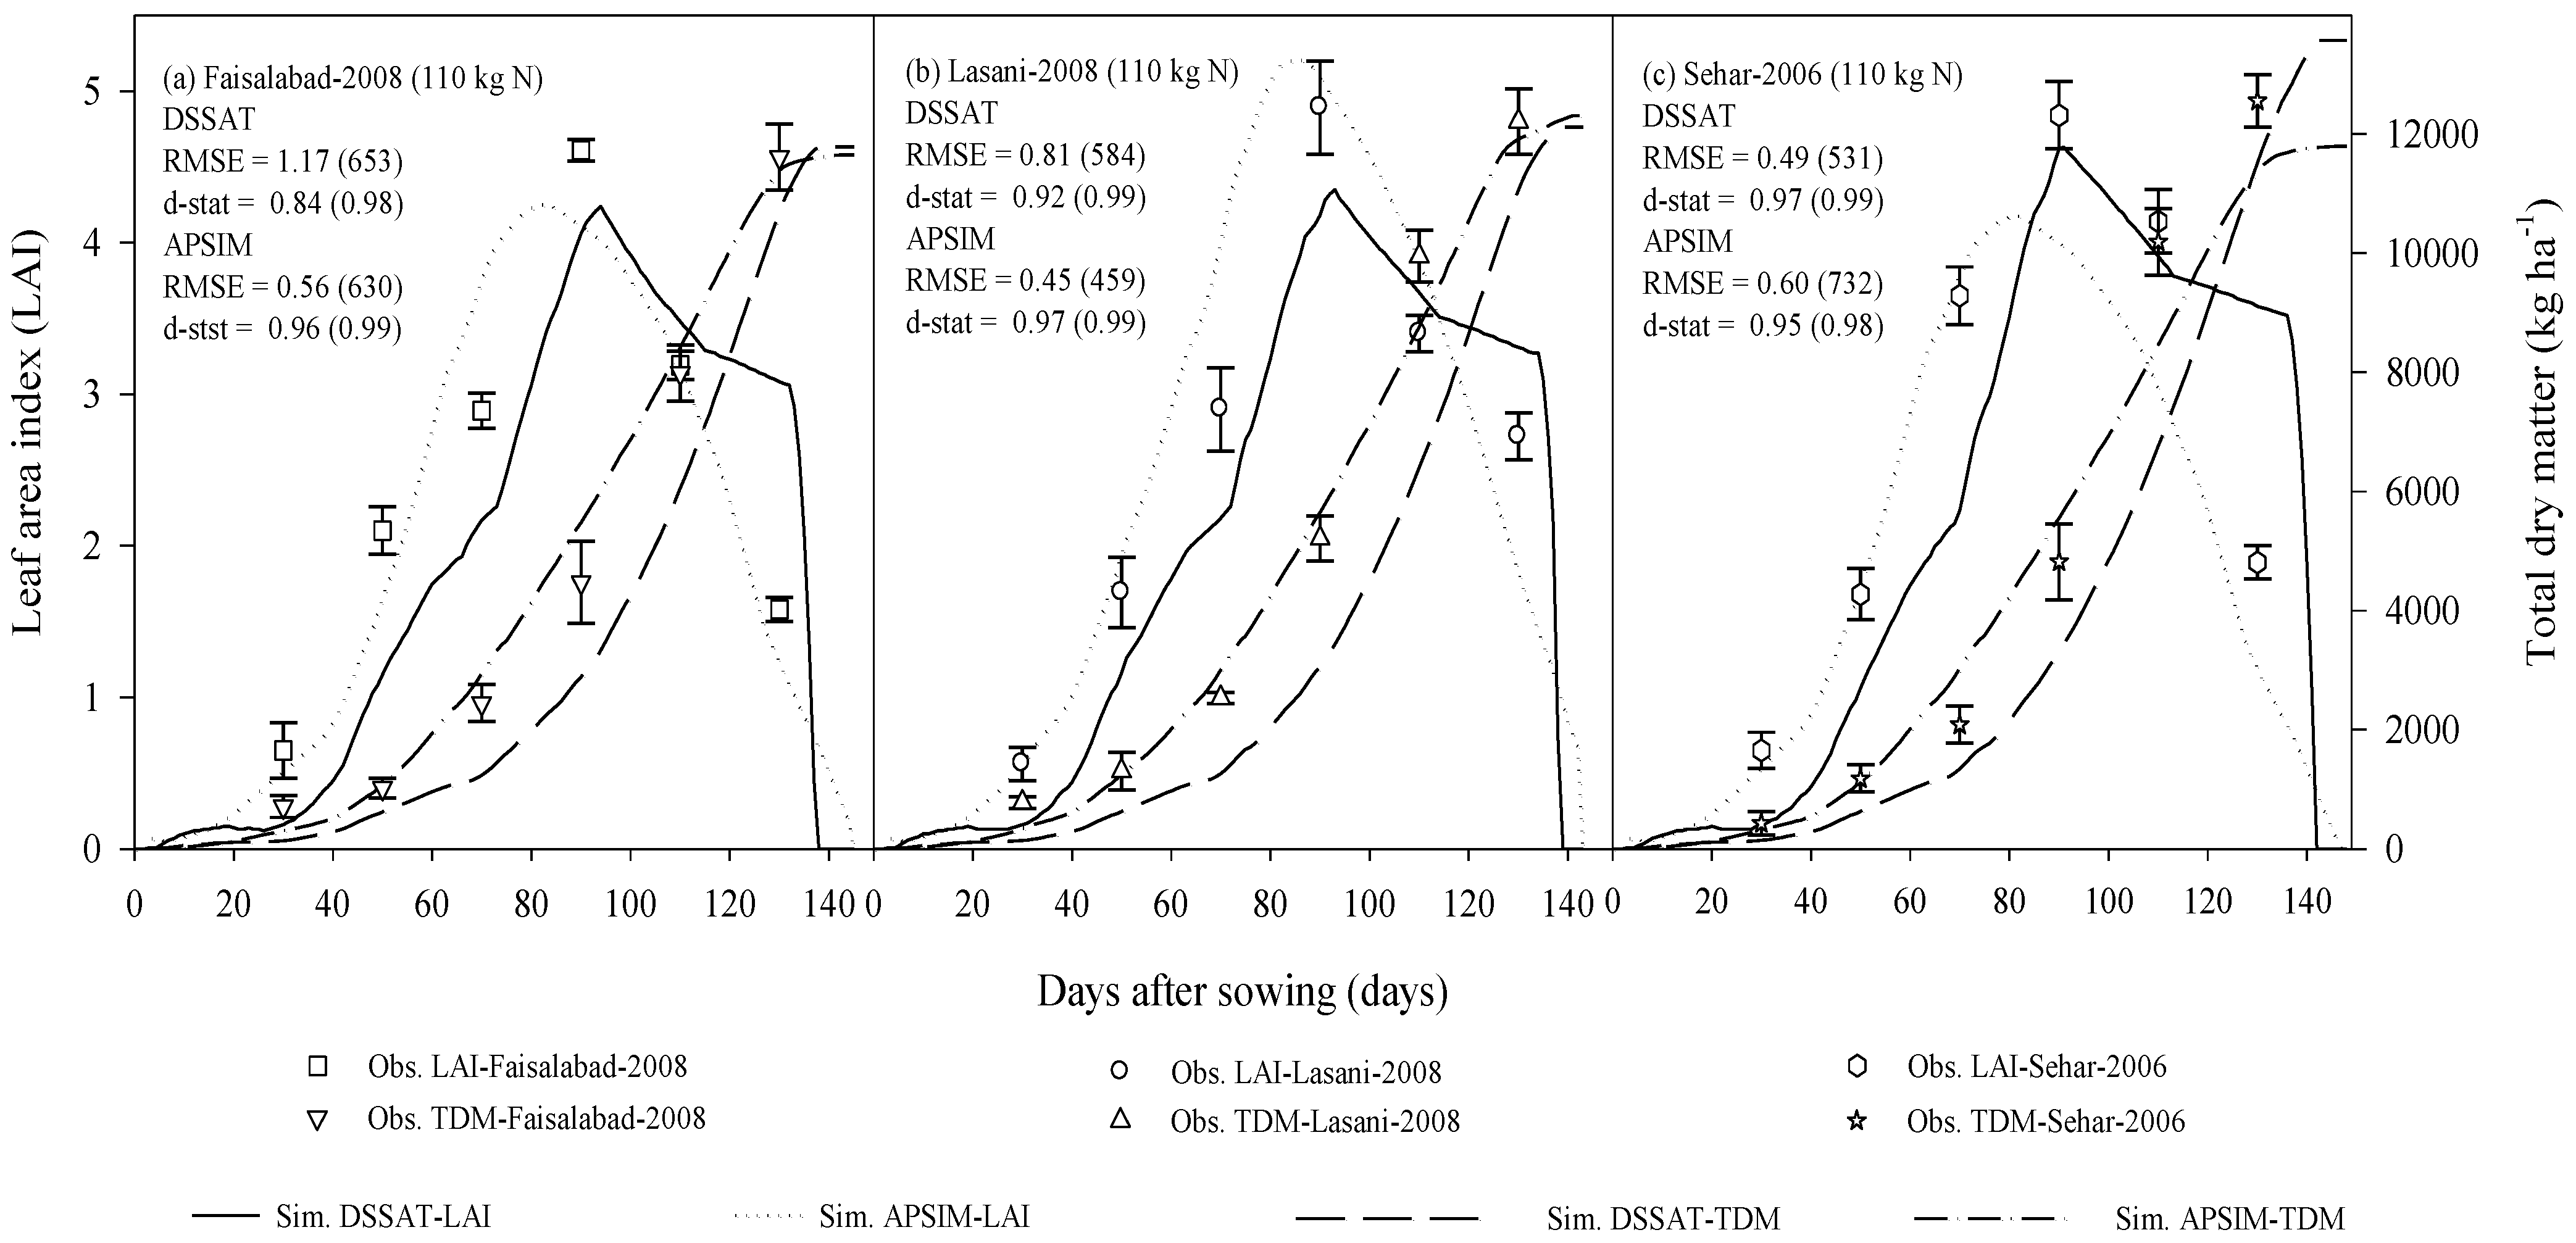
3.1. Cultivars Coefficient Estimation and Models Parametrization

The CERES-Wheat model requires seven cultivar coefficients for the simulation of phenology, growth and yield. Models were calibrated using non-stress experimental treatment (110 kg N ha−1) during the 2008–2009 growing season while others (0, 55, 220 N kg ha−1) were used for models’ validation and evaluation. The final values of cultivar coefficients that determine optimum vernalizing temperature in days (P1V) and P1D for photoperiod response of wheat crop and reproductive (P5, G1, G2, G3, and PHINT) growth and development are presented in Table 1.
The final values for APSIM-wheat genetic coefficient are presented in Table 2. APSIM also have seven cultivar coefficients in which grains per stem, max grain size and the potential grain filling rate are related to yield, while thermal time from emergence to end juvenile stage (°d) and sensitivity to photoperiod work for growth and phenology.
A close agreement was obtained between observed and simulated parameters for all cultivars (Fasisalabad-2008, Lasani-2008 and Sahar-2006). Calibrated CERES-wheat predicted the same number of days taken to anthesis as observed during field experiments with root mean square error (RMSE) and percentage difference (PD) values of 0 for cultivars Faisalabad-2008 and Lasani-2008 while a 2 day difference was recorded for cultivar Sehar-2006. One-day difference between observed and simulated days was seen in APSIM-wheat for cultivar Faisalabad-2008 and 1.85 and 1.87 were computed for cultivar Lasani-2008 and Sehar-2006, respectively. In the case of physiological maturity, CERES- wheat predicted same number of days for cultivar Faisalabad-2008 while there was only one day difference for both cultivars Lasani-2008 and Sahar-2006 with PD of 0.71 and 0.68, respectively (Table 3). APSIM-wheat over-simulated the maturity days for all genotypes with PD of 0.70, 2.84 and 1.37 for Faisalabad-2008, Lasani-2008 and Sehar-2006, respectively. CERES-wheat predicted wheat phenology precisely with a lower percent difference (PD) as compared to APSIM-wheat.
CERES-Wheat predicted maximum LAI with minimum PD as compared with the observed ones, 0.35, 0.2 and 0.1 for Faisalabad-2008, Lasani-2008 and Sehar-2006, respectively. APSIM-wheat slightly overestimated LAI with high PD as compared to CERES-wheat. Both models slightly underestimated maximum LAI for all wheat genotypes while APSIM-wheat overestimated only one genotype (Faisalabad-2008) with 10.66 PD. CERES-wheat predicted the time course LAI precisely for all cultivars, especially for Sehar-2006 with RMSE of 0.49 and higher d-value (0.97) for the whole growing season while APSIM-wheat predicted lower LAI during peak season but the time course analysis prediction for the whole growing season was good with a lower RMSE (0.60) and higher d-value (0.95). APSIM-wheat gave good statistics for cultivar Lasani-2008 with the lowest RMSE (0.45) and highest d-index (0.97) while the prediction for cultivar Faisalabad-2008 was also good by both models having a d-value of 0.84 and 0.96 for CERES and APSIM-wheat.
Simulation of the total biomass at harvest was also well predicted by CERES-wheat with PD values of 1.62, 1.49 and 3.32 between simulated and observed for Faisalabad-2008, Lasani-2008 and Sehar-2006, respectively. A lower PD (0.04) for cultivar Faisalabad-2008 and 0.33 for Lasani-2008 was computed in APSIM-wheat but interesting results were recorded in cultivar Sahar-2006. Here, the model underestimated the total biomass with a slightly high PD of 6.10 while CERES-wheat over-simulated with a lower PD of 3.32. Dry matter time series production showed that both models worked well with good statistics for all cultivars (Figure 3). Models’ predicted grain yield showed good agreement with observed yield, having minimum difference of 40 kg ha−1 in cultivar Faisalbad-2008 with PD 0.82. A close agreement was observed for the rest of the cultivars with PD 1.10 and 4.84 by CERES-wheat and 0.47 and 3.23 for APSIM-wheat (Table 2).

3.2. Evaluation of the CERES-Wheat and APSIM-Wheat Models

Accuracy of the calibrated CERES and APSIM-Wheat models and performance of genetic coefficient were assessed by running the model with rest of the treatments (0, 55, 220 N kg ha−1) of the experiment while 110 N kg ha−1 was used for model calibration with all genotypes during the 2008–2009 growing season. The models were further evaluated with all nitrogen treatments of 2009–2010 for all cultivars. Prediction capabilities of the models were tested by judging the performance of the crop in terms of phenology (days to anthesis and maturity), leaf area index, above ground biomass production and grain yield of all treatments.

3.3. Prediction of Wheat Phenology

For crop growth models, the accurate simulation of phenological development under different growth conditions is the major requirement for accurate prediction of crop growth and yield. The days taken to anthesis and maturity for all cultivars were delayed in the field with the nitrogen increment, so it was an indicator that wheat development and phenology were influenced by nitrogen. At lower nitrogen rate, the simulated days taken to anthesis were closely related to observed days but, at higher nitrogen application (220 kg N ha−1), CERES-Wheat under-simulated anthesis by 2 days in the 2008–2009 growing year for sehar-2006. Maximum simulated and observed days to anthesis (107.7) were obtained from cultivar Lasani-2008 with a mean percent difference (MPD) of 0.31%. Overall, MPD ranged from −1.87 to 0.93 with RMSE values ranging from 0.58 to 1.41 for all cultivars at different nitrogen rates during 2008–2009. APSIM-Wheat simulation also showed good agreement with the observed values for all cultivars, a higher MPD (2.16%) was obtained from Lasani-2008 among cultivars. Overall error ranged from 0 to 2.80% with RMSE (0.58 to 1.41) among all treatments during the calibrated year (2008–2009). APSIM-wheat simulated anthesis days with a higher MPD of 1.84% at 120 kg N ha−1 application while DSSAT slightly under-simulated having a PD of 0.93 (Table S1). Similar trend for lower and higher nitrogen increment was observed for maturity days as above in both models’ simulation. Low percent difference was observed at higher nitrogen levels with RMSE ranging from 0.58 to 1.00 days and 0.41 to 2.6 days with cultivars as predicted by CERES and APSIM-Wheat, respectively. At higher nitrogen increment of 220 kg ha−1, PD was found lower as compared with lower nitrogen application. An overall high PD was computed in APSIM-Wheat simulation for cultivar Lasani-2008 (2.84) and Sehar-2006 (2.78). Performance of CERES-Wheat was good in case of maturity day’s prediction, mean percent difference (MPD) is zero with all evaluated treatments having a mean RMSE of 0.80 days while, in APSIM, a slightly higher PD (2.8%) was recorded with a mean RMSE of 1.94 days (Table S2). These results showed that both crop models can predict phenology reasonably good at 110 kg N ha−1. Phenology was affected by nitrogen increments in the field because higher nitrogen favors vegetative growth and delays the anthesis and maturity, but this trend was not predicted by the models.

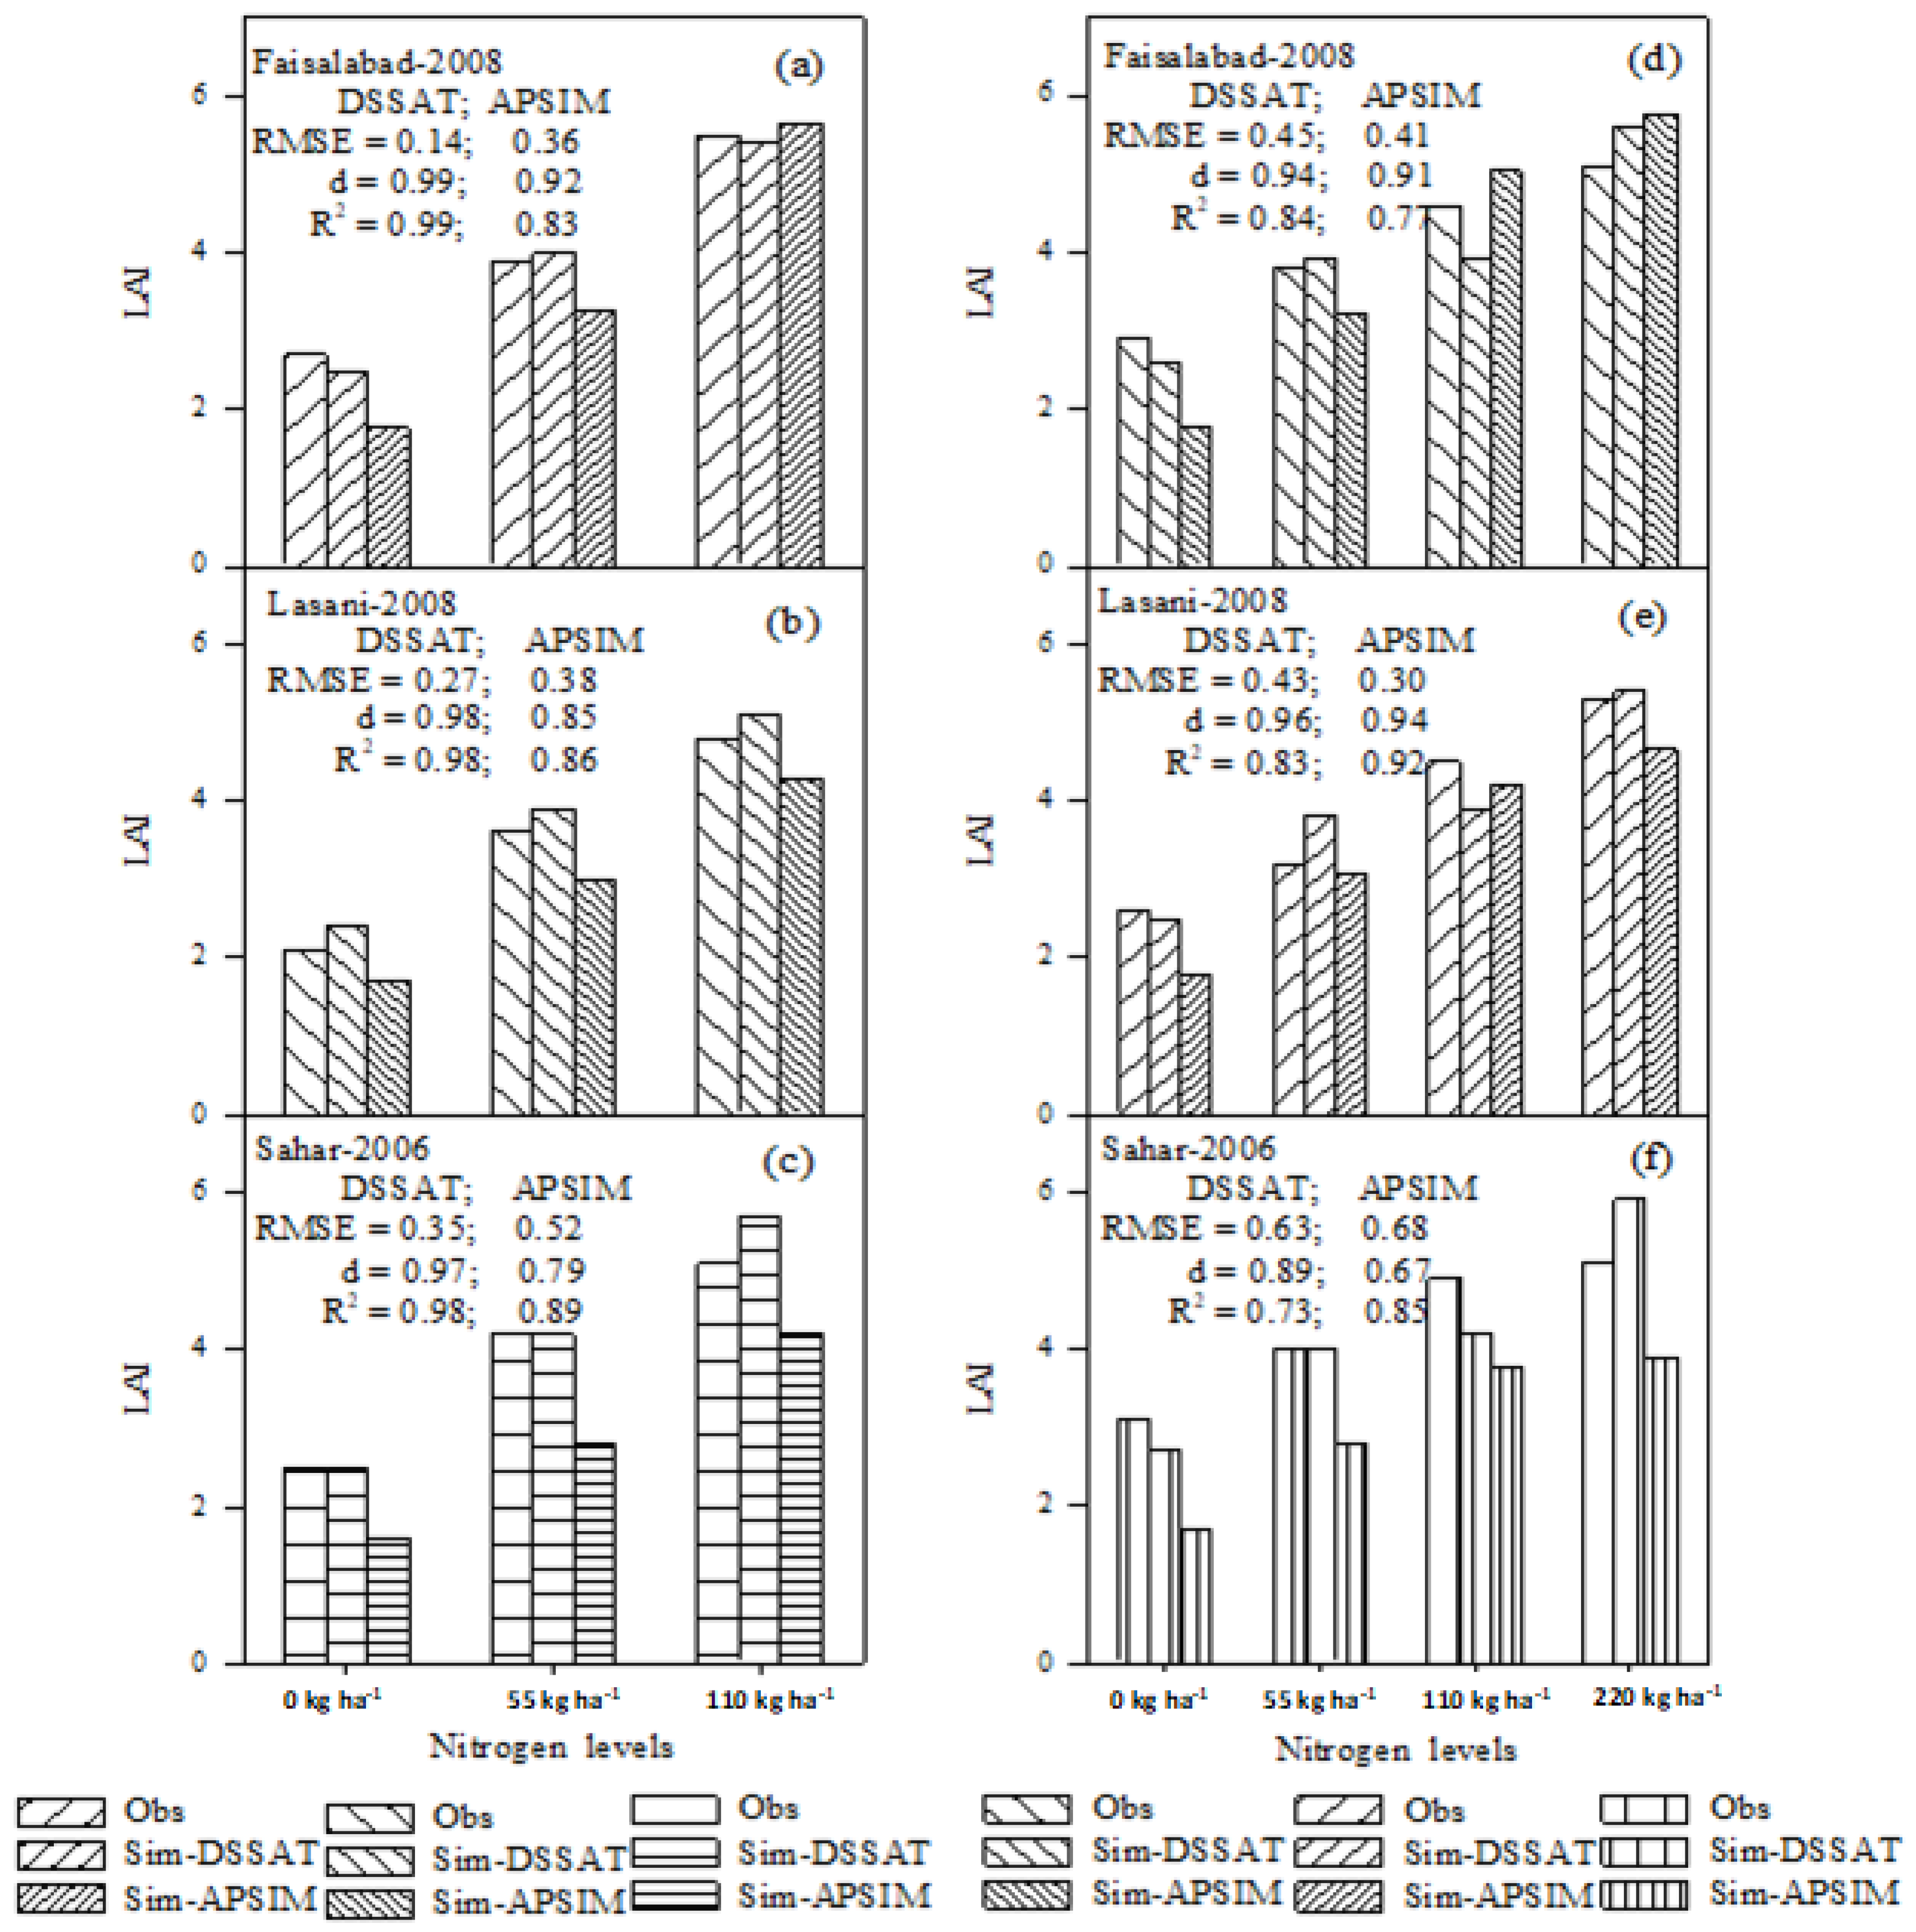
3.4. Leaf Area Index (LAI)

Evaluation of models for LAI showed that CERES-Wheat best predicted the LAI in cultivar Faisalabad-2008 with an average error (−2.22), RMSE ranging from 0.14 to 0.35 with MPD 2.22 to 9.62% and higher d-index (0.97–0.99) as compared to APSIM-Wheat. APSIM under-simulated LAI for cultivars having higher MPD with RMSE ranging from 0.36 to 0.52, higher d-index 0.80 to 0.92 and satisfactory R2 ranging from 0.83 to 0.89 for wheat cultivars during the 2008–2009 growing year. CERES-Wheat predicted zero percent error for Sehar-2006 at lower nitrogen levels (0 and 55 kg ha−1) while a higher percent error (11.76%) was observed at higher nitrogen rate (220 kg ha−1) during the calibrated year, however, APSIM-Wheat simulates higher differences at lower nitrogen and lower differences at higher nitrogen application (Figure 4). Models predicted good agreement for the time course between observed and simulated LAI, CERES-Wheat under-simulated LAI during early growth but later showed a close agreement among observed and simulated values. The APSIM-Wheat time course evaluation predicted good simulation during the 2008–2009 growing season with higher nitrogen rates (220 kg ha−1), with lower RMSE (0.48–0.62) and good d-index (0.95–0.98) as compared to the zero-nitrogen application. CERES-Wheat predicted well the time course changes at all nitrogen rates with better RMSE (0.51–1.18) and d values (0.75–0.98) for cultivars (Figure S1).
Both model under-simulated LAI during the 2009–2010 growing year with lower RMSE (1 and 0.46) and higher d-index of 0.93 and 0.84. DSSAT slightly under-simulated LAI with MPD of −0.52 at 0 kg nitrogen ha−1 for all cultivars while APSIM also under-simulated LAI at low nitrogen with MPD −17% but having a higher coefficient of regression (0.85) in combination of nitrogen with wheat cultivars. Relationship between observed and predicted leaf area index showed higher values for the coefficient of determination (R2) for both models during the 2008–2009 and 2009–2010 growing seasons, as demonstrated in Figure 5. Time course LAI were in good agreement at different phenological stages, R2 values ranged from 0.77–0.95 and d-index 0.69–0.98 with low RMSE of 0.37 to 1.23 and 0.32 to 0.82 for CERES and APSIM-Wheat, respectively, during 2009–2010 (Figure S2). APSIM-wheat under-simulated LAI at 0 and 55 kg N ha−1 for all cultivars while over-simulated with the application of 110 and 220 kg N ha−1 in cultivar Faisalabad-2008 having lower RMSE (0.51 and 0.62) and a good d-index of 0.97 and 0.96, respectively, while CERES-wheat under-simulated at lower nitrogen (0 and 55 kg ha−1) but a close agreement was recorded with the application of higher nitrogen (220 kg N ha−1), especially in cultivars Lasani-2008 and Sehar-2006 with low RMSE (1.23 and 0.79) and a high d-index of 0.84 and 0.94, respectively.

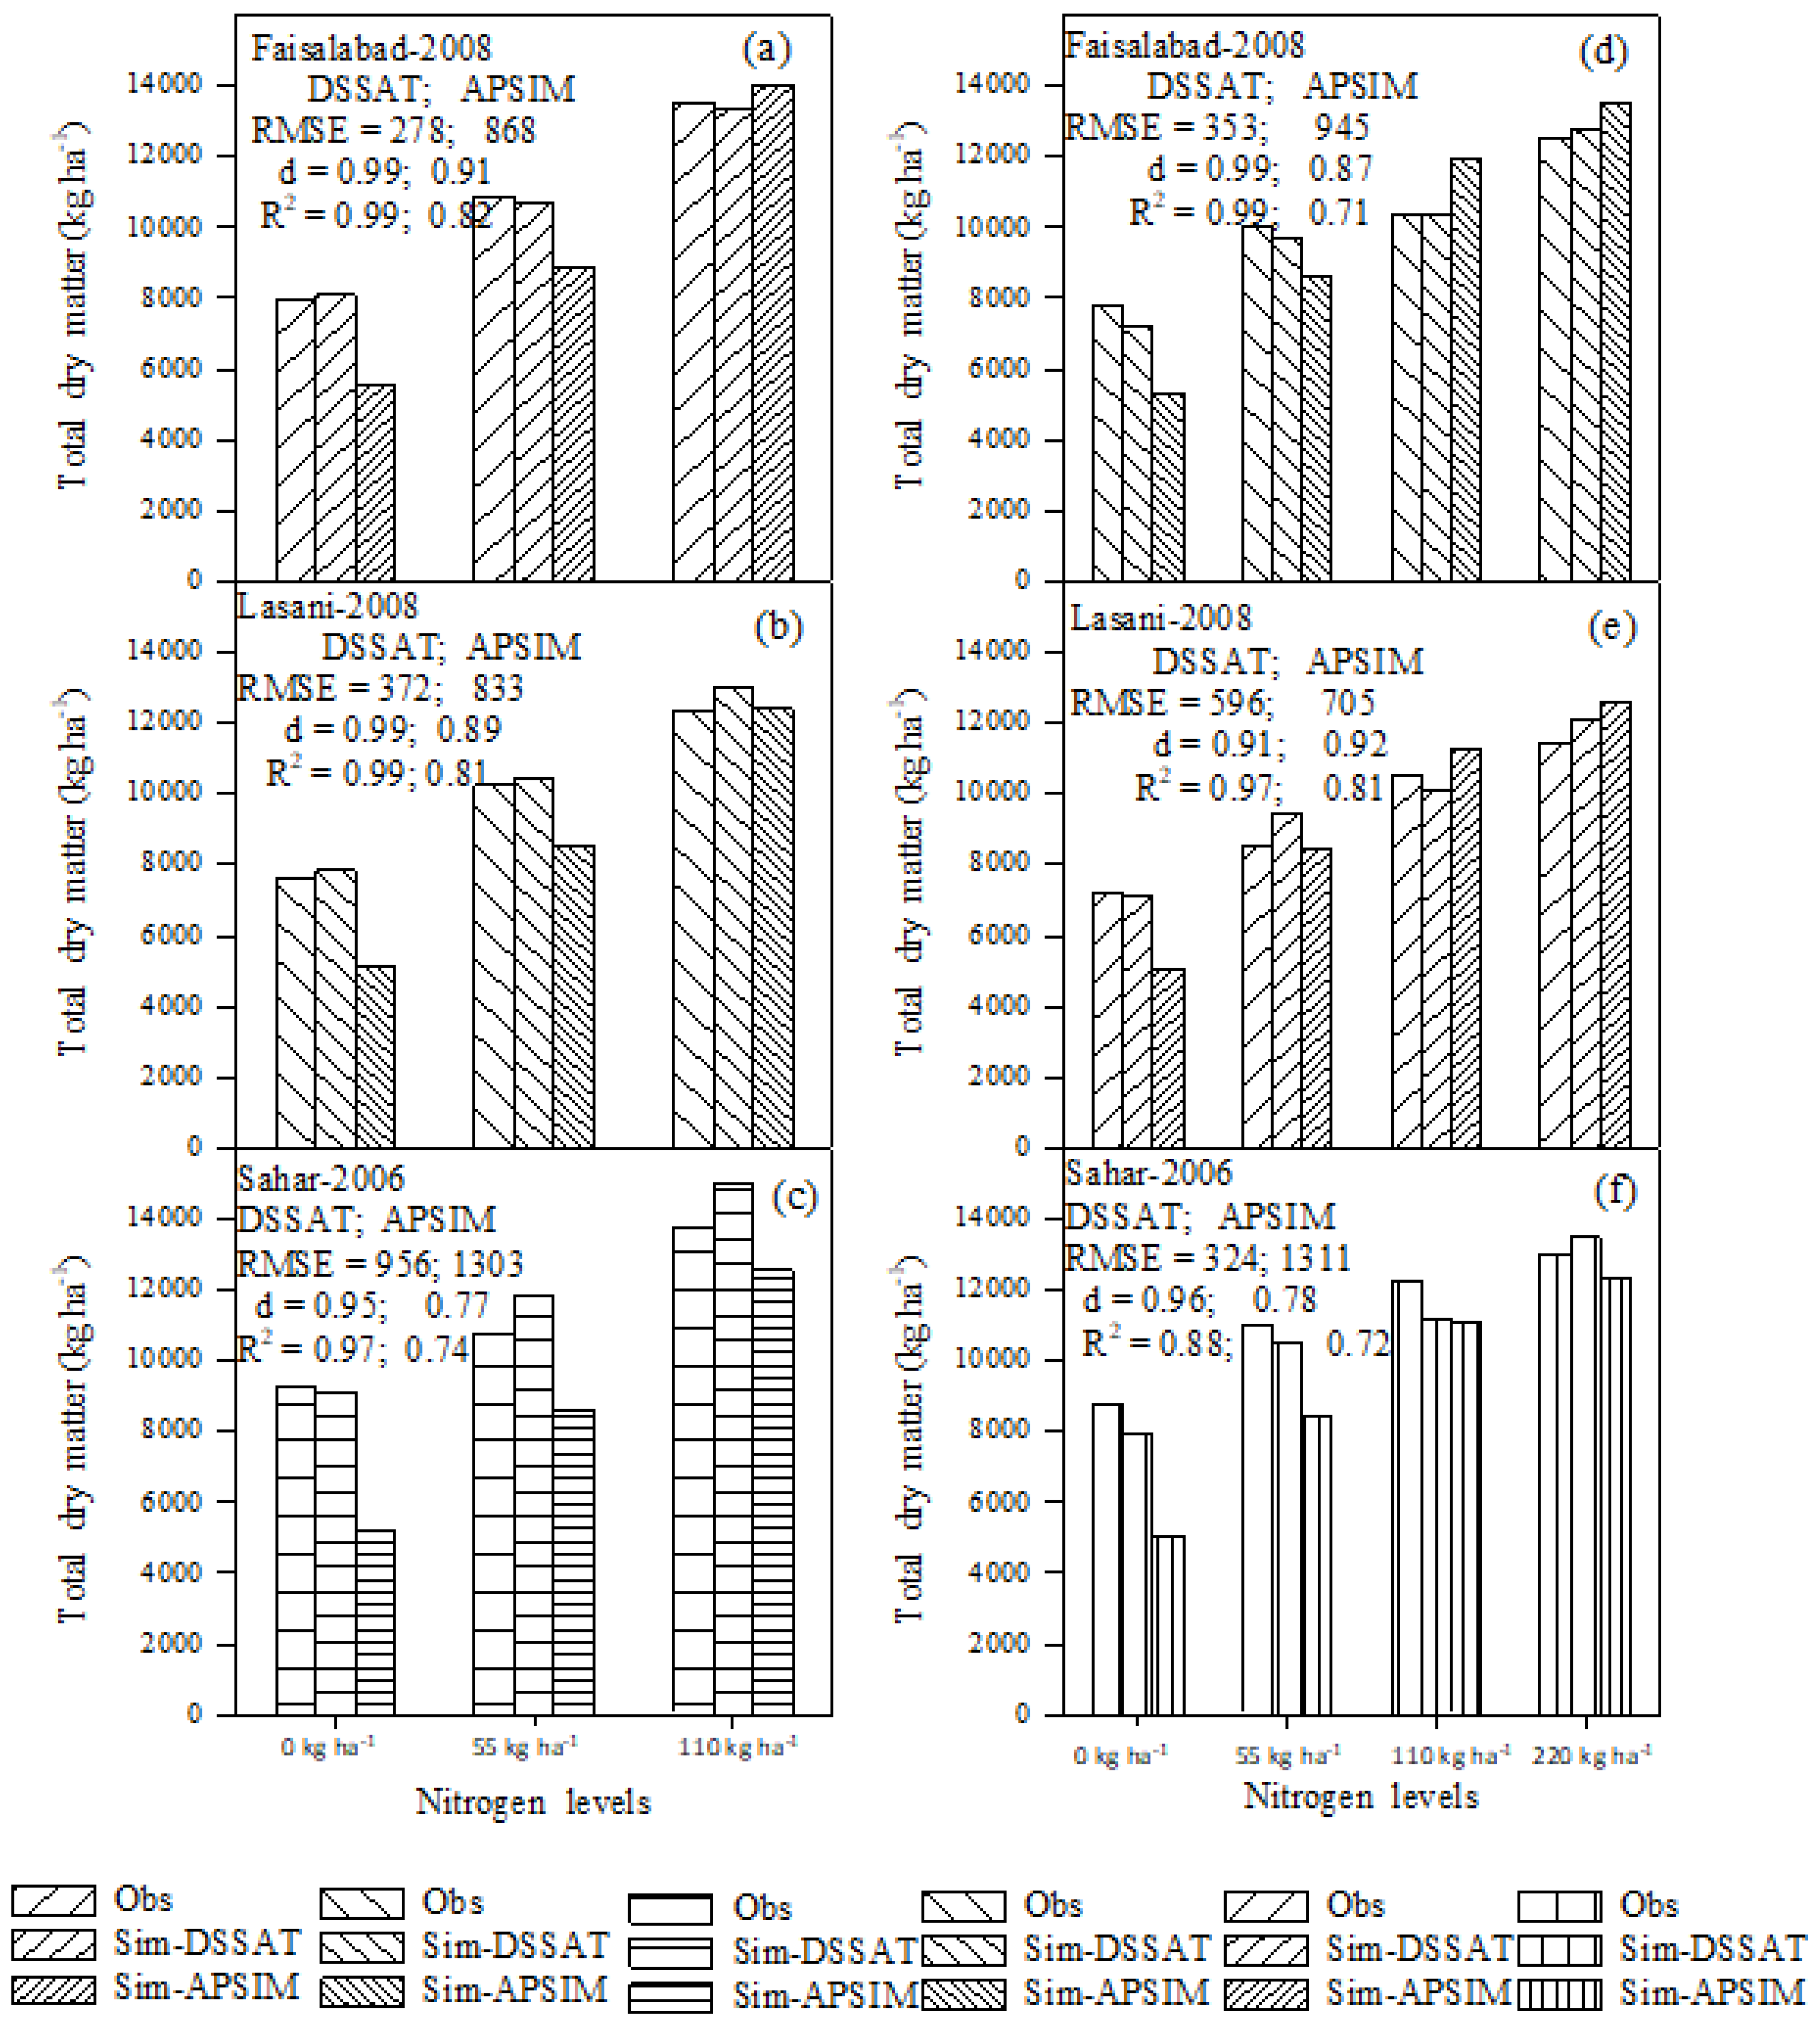
3.5. Total Dry Matter
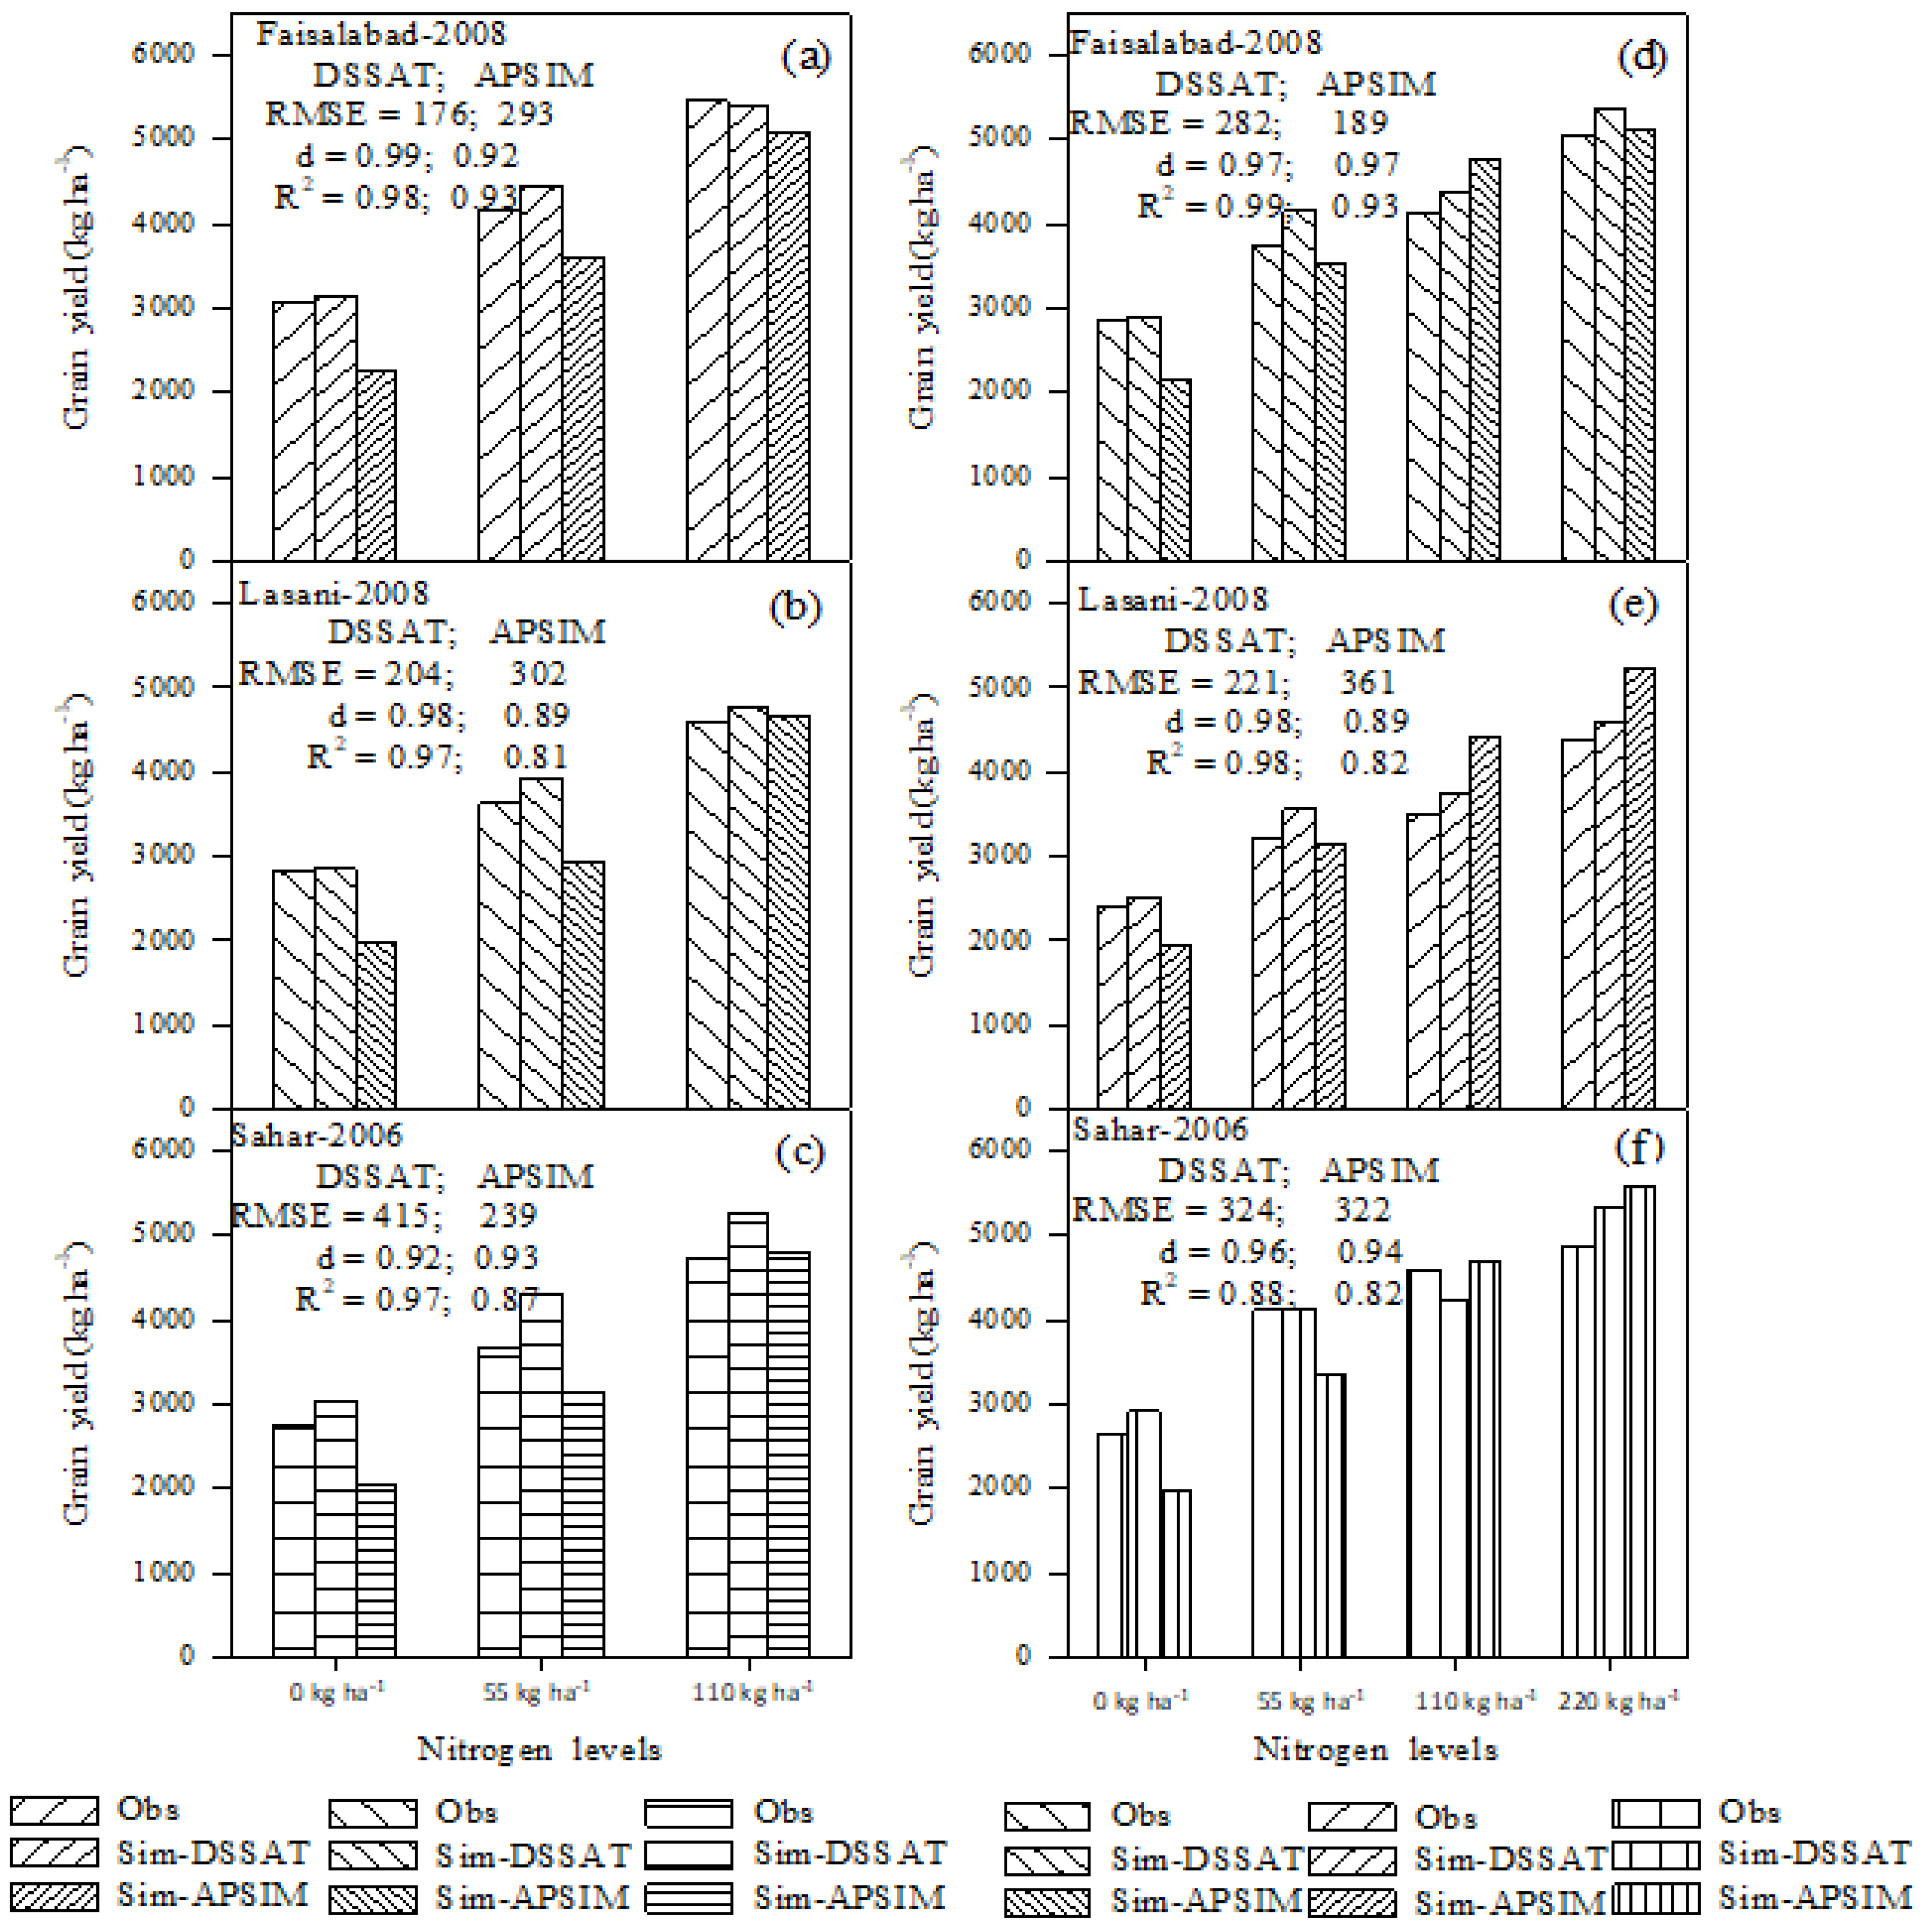
Total dry matter (TDM) was more accurately simulated by CERES-Wheat with lower RMSE (278–955 kg ha−1) and higher d-index (0.95–0.99) as compared to APSIM-Wheat during evaluation with data obtained during 2008–2009. Good simulation was observed for cultivar Faisalbad-2008 (RMSE 278 and 868 kg ha−1, d-index 0.99 and 0.91 and MPD 0.3 and 17%) for CERES and APSIM-Wheat, respectively, as compared to the rest of cultivars. Lower error percentage was observed with low nitrogen rates as compared to higher levels, 2.3% for Lasani-2008 and 1.5% for Sehar-2006 with the application of 0 kg N ha−1 while higher doses of nitrogen showed a significantly higher percent error between observed and simulated (CERES-Wheat) above ground biomass with the application of 220 kg N ha−1, 4.8% and 8.9% for Lasani-2008 and Sehar-2006, respectively. Mean PD for nitrogen rates with cultivars showed lesser difference at higher nitrogen rate (220 kg ha−1) in APSIM-Wheat as compared to DSSAT with higher mean d-Index (0.97) and R2 0.98 (Figure 6). The d-index and RMSE of the time course for the total above ground biomass at different phonological stages ranged from 0.94 to 0.99 and 388 to 1422 kg ha−1 for CERES-Wheat while they ranged from 0.90 to 0.99 and 370 to 978 kg ha−1 for APSIM-Wheat during calibrated year (Figure S1).
Simulation of TDM by both crop models during the growing year (2009–2010) were closely related to the observed values with less RMSE of 424 and 986 kg ha−1, higher d index (0.97 and 0.86) and R2 values of 0.95 and 0.75 for CERES and APSIM-Wheat, respectively. Both models under-simulated TDM at lower nitrogen (0 and 55 kg ha−1), with reasonable low PD and a close agreement was observed with the application of higher nitrogen (110 kg ha−1), with PD of 4.34% and 10.7% while slightly over-simulated at 220 kg N ha−1 having a percent difference of 3.4% and 7.4% for CERES and APSIM-Wheat, respectively. Simulation response regarding cultivars was also good with lower RMSE, higher d-index and R2 values, especially in Lasani-2008 with MPD of 2.7% and 11.9% while RMSE 596 and 705 kg ha−1 and d-index 0.91 and 0.92 was recorded between observed and CERES and APSIM-Wheat simulations, respectively (Figure 6). RMSE ranged from 253 to 596 kg ha−1 and 705 to 1311 kg ha−1 for CERES and APSIM-Wheat, respectively, while d-index ranged from 0.91 to 0.99 and 0.77 to 0.92% was recorded among all cultivars during models’ evaluation (2009–2010). Mean RMSE of time series TDM analysis ranged from 470 to 980 and 313 to 1769 kg ha−1 and d-index ranged from 0.94 to 0.99 and 0.86 to 0.99 for CERES and APSIM-Wheat, respectively. APSIM-Wheat under-simulated at zero nitrogen, with d-index of 0.87 to 0.89 and slightly under-simulated at 55 kg N ha−1, with RMSE ranging from 388 to 1449 kg ha−1 while CERES-Wheat showed a good agreement with lower RMSE of 470 to 880 kg ha−1 with a good d-index of 0.97–0.98 (Figure S2). The coefficient of regression (R2) between simulated and observed TDM was high (0.97 to 099 and 0.76 to 0.82) and (0.94 to 0.99 and 0.71 to 0.88) among experimental treatments with different cultivars used during 2008–2009 and 2009–2010 for CERES and APSIM-Wheat, respectively (Figure 5).

3.6. Grain Yield

The lower values for RMSE and higher d-index (close to one) reflected that the model predicted grain yield well. Simulated values were in good agreement with the observed grain yield having RMSE 176 to 415 kg ha−1 and MPD 3% to 13% for CERES-Wheat while 239 to 302 kg ha−1 and −13% to −16% for APSIM-Wheat among cultivars with different nitrogen rates during 2008–2009. Minimum RMSE (176 kg ha−1), MPD (2.60) and higher d-index (0.99) were recorded for cultivar Faisalabad-2008 in CERES-Wheat. While APSIM-Wheat under-simulated it with an RMSE of 293 kg ha−1 and a d-index of 0.92. Both models predicted grain yield quite well at all nitrogen levels, higher differences were observed with lower N input while there was a close agreement for higher nitrogen rates. CERES-wheat over-simulated (MPD 4.5–10.9%, RMSE 265 kg ha−1, d-index 0.96) while APSIM under-simulated grain yield at all nitrogen rates with MPD −3.4% to −27%, RMSE 277 kg ha−1 and a d-index of 0.92 during calibrated year (Figure 7).
Cultivars yield response was predicted well by both models while overall RMSE ranged from 221 to 324 kg ha−1 and 189 to 322 kg ha−1 with good d-index values (0.96–0.98 and 0.89–0.97) and lower MPD (3.1 to 6.5 and 2.7 to 5.9) for CERES and APSIM-Wheat, respectively. Models over-simulated grain yield for nitrogen rates with cultivars, MPD ranged from 1.5 to 10.9 and 0 to 15.4% for CERES-Wheat and APSIM in cultivars Faisalabad-2008 and 3.9 to 10.4 and −2.2% to −20% for cultivar Lasani-2008 while they ranged from 0.17 to 10.70 and 1.8% to 21% PD for cultivar Sahar-2006 (Figure 7). Both crop models simulated grain yield reasonably good at all nitrogen rates with MPD ranged from 1% to 6.8% for CERES-Wheat and −13.8 to 11.5 for APSIM-Wheat. Low MPD was recorded at 0 and 55 kg N ha−1 while a slightly higher difference was seen with the application of 110 and 220 kg N ha−1 for both CERES and APSIM-Wheat. The model’s performance was better in year 2009–2010 with an MPD of 4.9 and 0.67% as compared to calibrated year that had an MPD of 6.8 and −15.3% for CERES and APSIM-Wheat, respectively. Relationship between observed and simulated grain yield at harvest was in good agreement with a higher coefficient of determination (0.95 to 0.97 and 0.87–0.98) for CERES-Wheat while it ranged from 0.81 to 0.90 and 0.88 to 0.98 for APSIM-Wheat in combination of nitrogen rates and cultivars during first and second growing year, respectively (Figure 5).

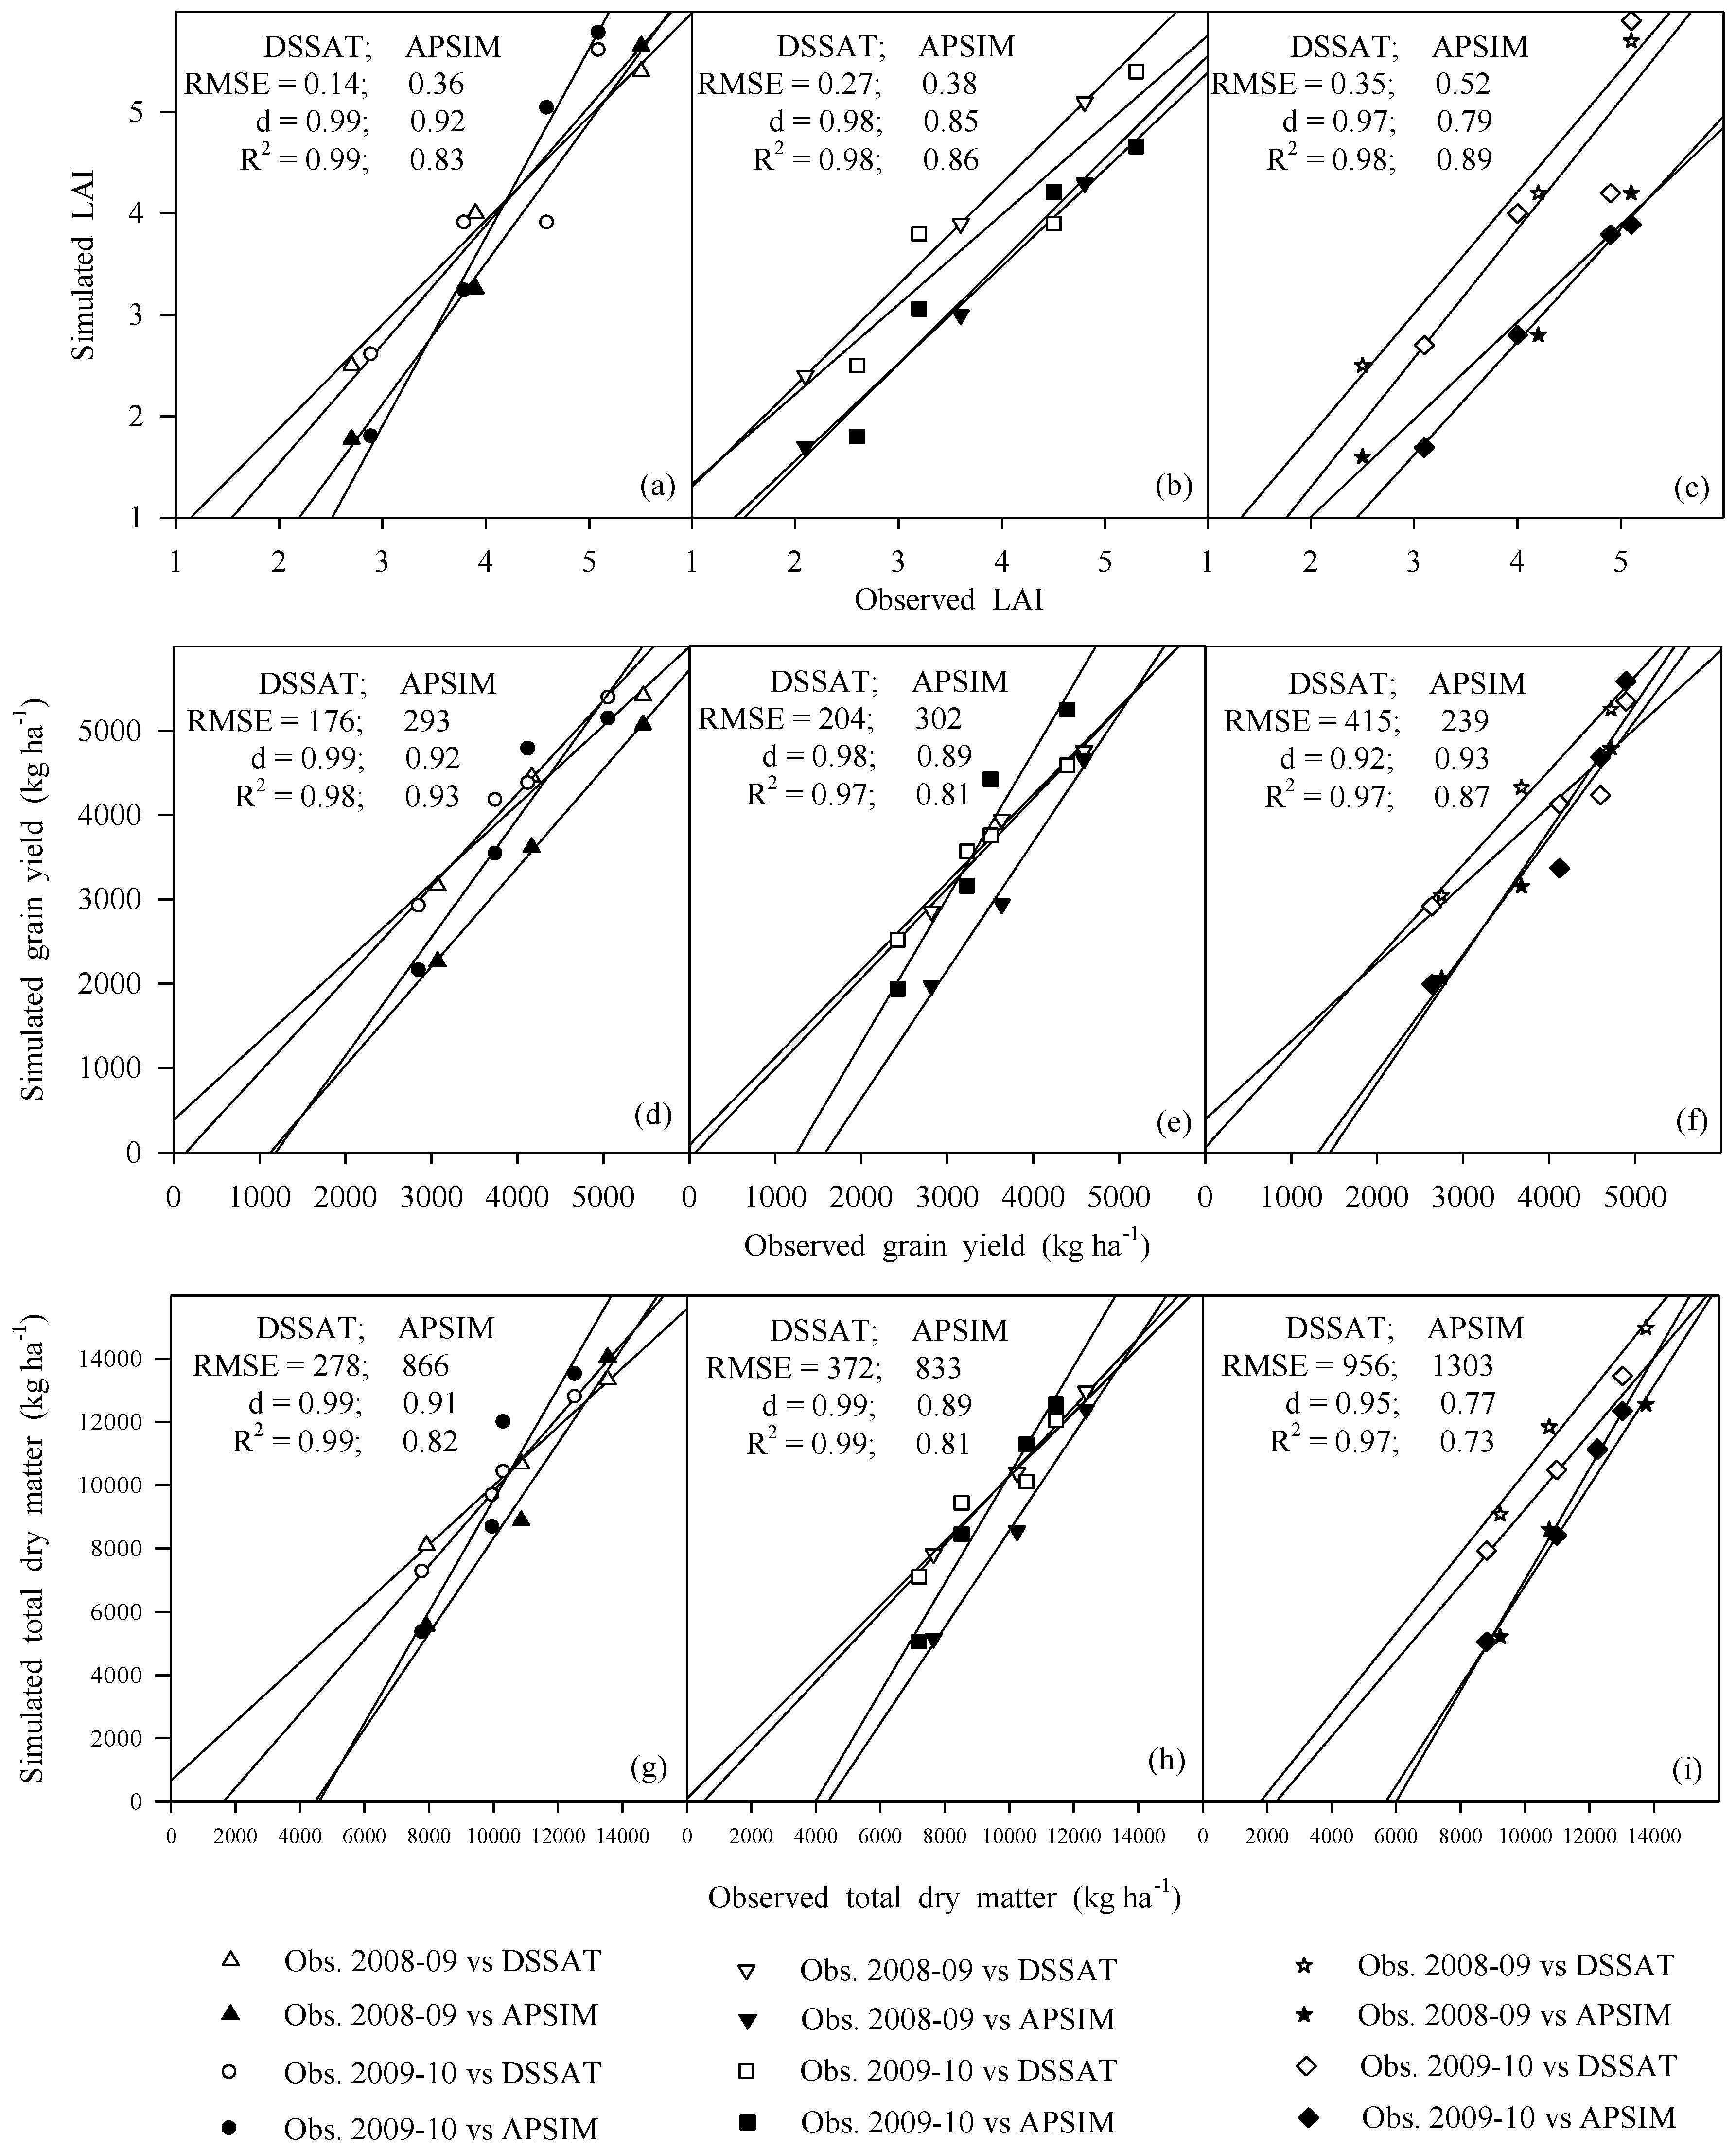
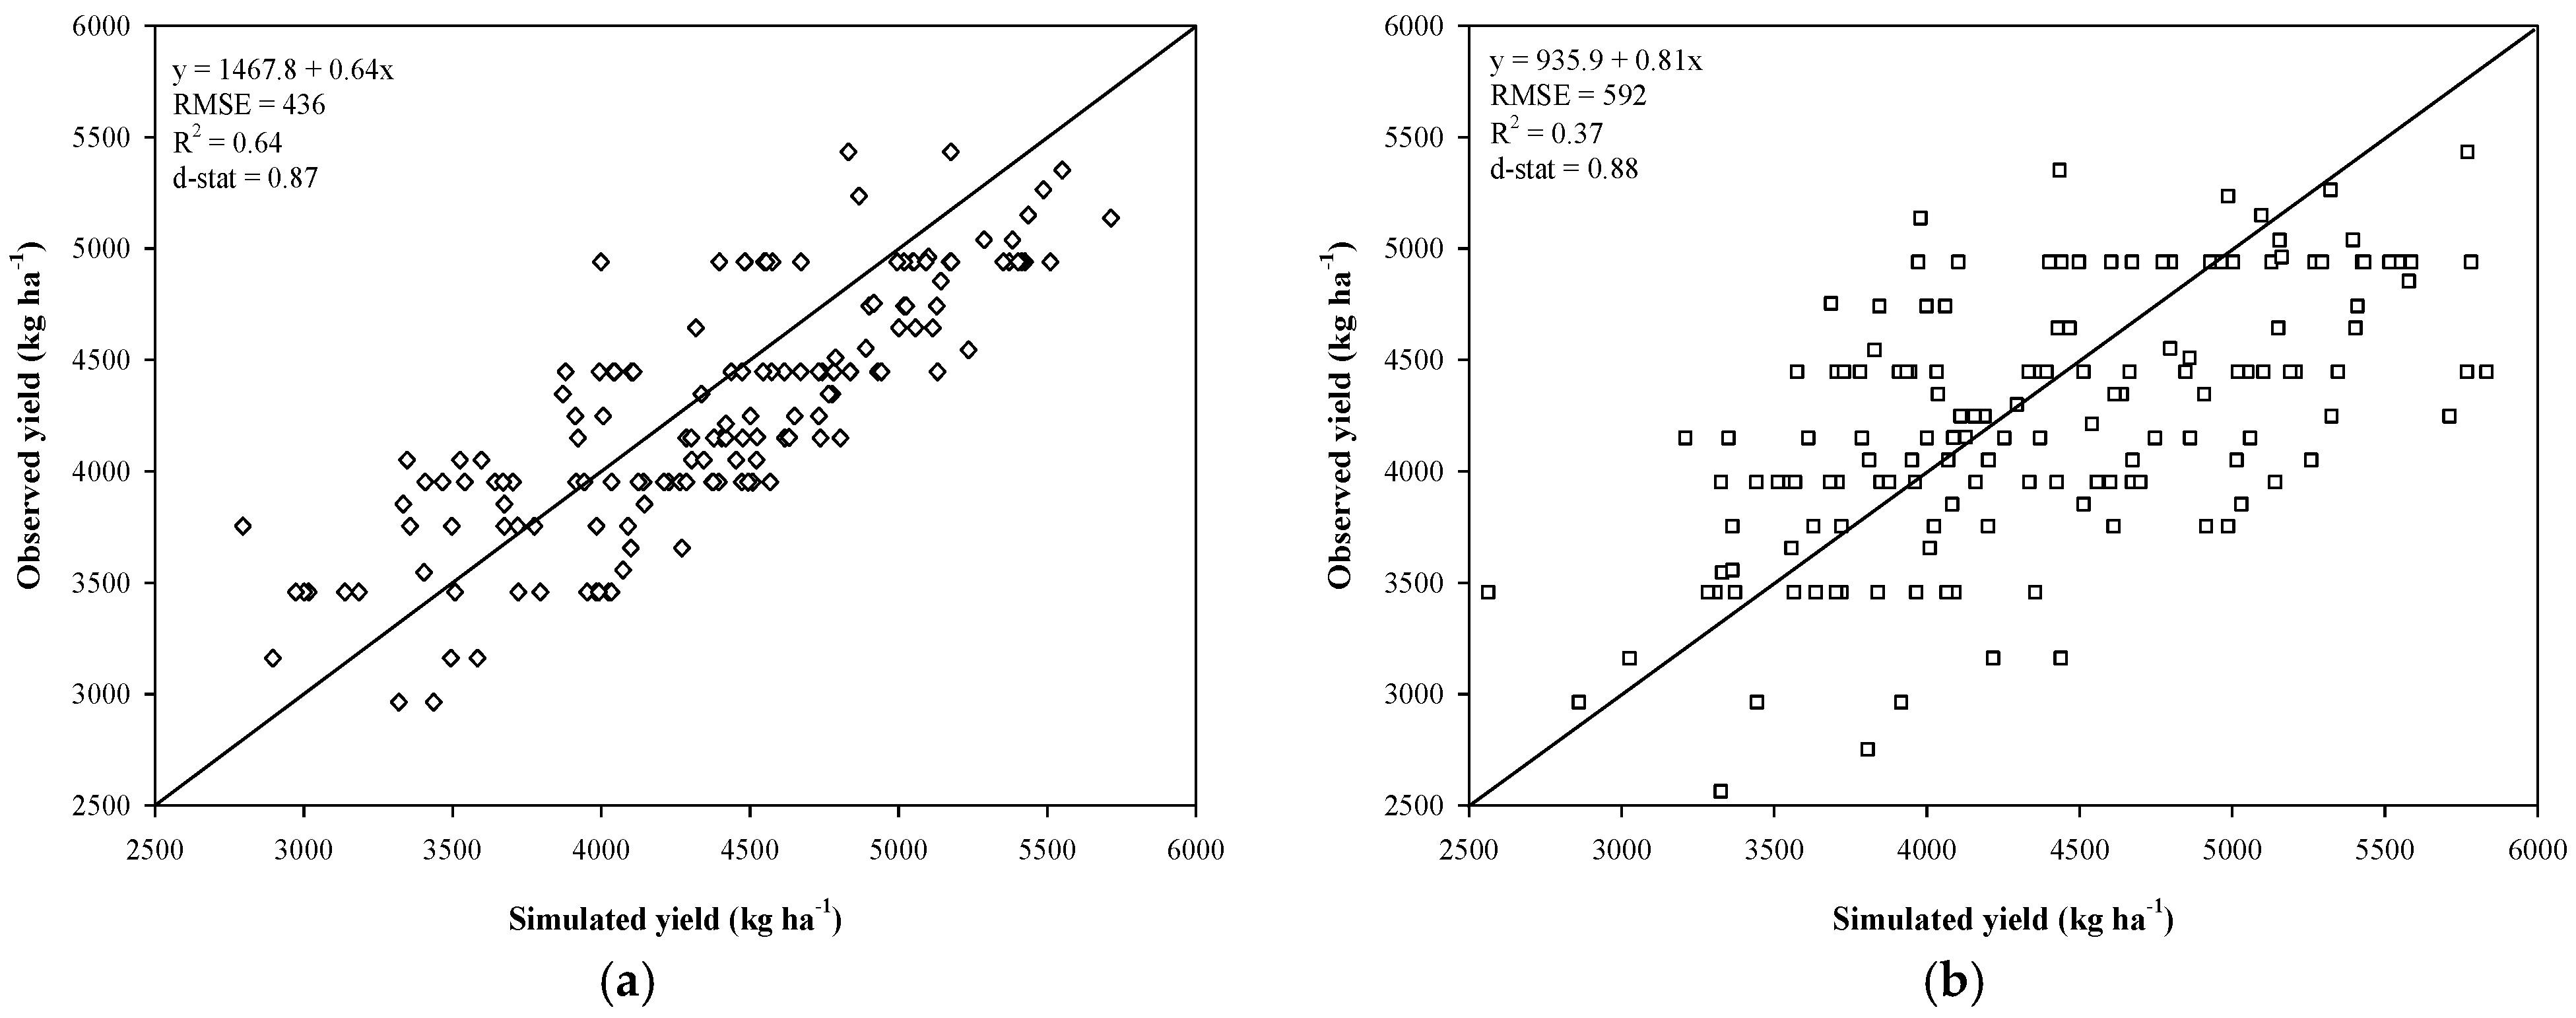
3.7. CERES-Wheat and APSIM-Wheat Evaluation at Farmer’s Field

CERES-Wheat and APSIM-Wheat crop models were calibrated with experimental data for three wheat cultivars. Genetic coefficients were tested with an independent dataset of next year experiments for their accuracy and reliability, the same genetic coefficients were used for models’ evaluation at farmer’s field for wheat yield simulation in five strata of the rice-wheat cropping system. Soil series of each stratum (two soil series in one strata) were built by using soil data from the soil survey department of Pakistan. A close agreement was indicated between farmer’s field yield and simulated one. When models were evaluated with farmer’s yield, the goodness of fit (R2) was 0.64 in CERES-Wheat and 0.37 in APSIM-Wheat by drawing relation of observed and simulated yield of 155 farms as shown in Figure 8. Comparison of individual farmer yield showed that model (CERES-Wheat) simulated wheat yield with a percent difference (PD) ranging from −25% to 27% and −26% to 40% having an RMSE of 436 and 592 kg ha−1 with a good d-statistic (0.87 and 0.72). CERES-wheat predictions of farmers’ field were deemed good and reliable as compared to APSIM-Wheat. This might be due to different response to farmer’s management practices and, probably, the genetic coefficient performance does vary as CERES-Wheat performed well in another year of evaluation. The performance of models differed for good and poor management practices of the farmers. The difference between simulated and observed yield was less for those farmers whose management practices were almost near to the recommended crop management practices. Planting time, plant population, number of irrigations, irrigation at critical stages, time of fertilizer application, application at crop critical stages, fertilizer application rate, weed management and disease control were better in case of progressive farmers and the model also simulated almost same yield as observed.

4. Discussion

Comparison of crop simulation models can be used for assessing their ability to predict crop phenology, growth, development and yield. It is possible to model weaknesses that create systematic errors and require improvements. A single model can give promising results in a certain region and specific agro-ecological environments, but a multi-model comparison approach could be reliable for yield estimation and uncertainty analysis among models. Crop models are a simplification of authenticity, but oversimplification was also found in models that led to discrepancies between simulated and observed data. DSSAT-CERES and APSIM-wheat differ to some degree regarding their equation structure. CERES-wheat is complex for some processes [1] while APSIM-wheat also shows the complexity by interacting various inputs, including phosphorous, soil residues, soil-water dynamics interactions [18]. The model uncertainty identified by Walker et al. [42] is related to the model input data, parameterization and model structure which are very difficult to quantify. Crop models used the same daily weather variables as input dataset, soil physical and chemical properties and field initial conditions with basic crop and soil management practices. Input data uncertainties were minimized in this study as the same input dataset was used for both models’ calibration. Previous model’s intercomparison showed that a minimal dataset used for calibration can results in higher chances of uncertainty in yield simulation [23,29]. Although, the current study had detailed field experimental data for model calibration with good simulation. Both models simulated well at high nitrogen application while for sub-optimal management, such as N-limitation, a variation was present during both years’ evaluations.

4.1. Wheat Cultivars Genetic Coefficients

Faisalabad-2008 being a medium- to late-sown cultivar required more days (optimum vernalizing temperature, P1V), while Sehar-2006, as an early sown cultivar, took less vernalizing temperature (16 days). The number of simulated days taken to anthesis by CERES-wheat were found to be sensitive to P1V: a change of 1 day resulted in a 3-day delay in the anthesis date [43]. Generally, P1V was reported within a wider range of 10 to 65 days that is independent of environment and region. P1V values of 20 days were used in the Mediterranean environment for durum wheat [44] while Yang et al. [45] and Nakayama et al. [46] used values of 15 and 10, respectively for northern plains in China. The photoperiod coefficient (P1D) varied between 40–45 and depends upon the photoperiod sensitivity among the cultivars. Cultivar Lasani-2008 had maximum value of P1D (45) while 41 and 40 were estimated for Faisalabad-2008 and Sehar-2006, respectively. Rinaldi [44]) described a value of 30%, which is lower while Yang et al. [45] projected a P1D of 48% in semi-arid environment, which is closer to our findings. The grain filling duration (P5) is cultivar-dependent and ranged from 510 to 691 growing degree days (GDDs). Sehar-2006 had maximum value (691 °C.d) while 510 and 596 °C days were estimated for Lasani-2006 and Faisalabad-2008, respectively. Our results are in good agreement with Ghaffari et al. [47] who reported 548 GDDs for semi-arid environment while Rinaldi [44] calculated 570 and Saseendran et al. [48] reported 610 GDDs. A slight difference was observed between our values and that used by Yang et al. [45] and Nakayama et al. [46] in Northern China. The kernel number coefficient (G1) varied from 31–37, which is lower than the default values. At anthesis, the maximum kernel number per unit canopy weight (G1) was assessed for cultivar Sehar-2006 (37 k g−1) as compared to Faisalabad-2008 (31 k g−1) and Lasani-2006 (32 k g−1). Under a similar climate, Nakayama et al. [48] reported a value of 32 k g−1, which is closer to our study. G1 values of 15 and 21 were reported by Rinaldi [44] in Italy and Rezzoug et al. [43] in North Africa, respectively, which were lower compared to our findings due to differences in environments. Standard kernel size under optimum conditions (G2) indicates the boldness of the grain; it is the genetic character of the genome and is influenced by the environmental stress, especially in the reproductive phase. Cultivar Faisalabad-2008 had maximum values (28 mg). This indicates that it is a bold grain variety while Sehar-2006 (22 mg) has medium grain size. Rinaldi [44] reported G2 values of 47 mg in Italy while 49 mg was recorded by Rezzoug et al. [43] in North Africa that were higher compared to our findings. Sehar-2006 had minimum non-stressed mature tiller weight (G3), i.e., 1.2 (g dwt) while 1.3 and 1.9 (g dwt) were estimated for cultivar Faisalabad-2008 and Lasani-2008, respectively. Singh et al. [49] reported 1.5 (g dwt) under temperate environment using CERES-wheat (ver.4). Nasim et al. [50] also reported G3 values in the range of 1.5–1.9 for wheat planted under semi-arid environment while Rinaldi [45] reported G3 values of 1.3 for Italy. The interval between successive leaf tip appearances (PHINT, °C days) ranged from 68 (°C days) for cultivar Lasani-2008, to 70 °C days and to 74 °C days for Faisalabad-2008 and Sehar-2006, respectively. These results agreed with Nasim et al. [50] who reported 65 to 80 °C days PHINT values for different cultivars in arid to semi-arid environment of the country. PHINT (76 GDDs) for winter wheat cultivars was estimated in semiarid environment [48] while 90 GDDs for same cultivars were reported in China [45,46]. In APSIM-wheat, Faisalabad-2008 was adjusted with 422 (degree days) for “Emerg_to_endjuv” due to the later heading than the other two cultivars, i.e., Lasani-2008 (389) and Sahar-2006 (390). Zhao et al. [40] reported 400 °C days for wheat during sensitivity analysis for APSIM model, whereas sehar-2006 required more thermal time from beginning of grain-filling to maturity which was due to the longer reproductive growth phase as compared to others (549 for Lasani-2008 and 560 for Faisalabad-2008). Similar results were also reported by Yunusa et al. [19] under rainfed wheat and Zhao et al. [40] reported 545 °C days for different locations in Australia while 600 to 740 °C days were reported by Asseng et al. [38] for USA, Mexico, New Zealand and Australia. Kernel number per stem weight at the beginning of grain-filling is genetically controlled and this genotype character also influenced by the environment. The maximum kernel number (35.5) was recorded for cultivar Lasani-2008 while Sehar-2006 had 28 and 24 grain per stem for Faisalabd-2008. Sensitivity to photoperiod was more than 3 for all cultivars. In general, genetic coefficients used in models characterize the growth and development of crop varieties differing in maturity [51] while the difference in parameters results from the combined effects of cultivation areas, crop growth constraints, and agronomical practices. In addition, other authors claimed that genetic coefficients are not only site-specific [52] but also year-specific [53]. However, coefficients derived from experimentations covering a range of environmental and agronomic conditions are likely to be more robust than those derived from a limited range of conditions [51].

4.2. Phenology

CERES-Wheat and APSIM-Wheat simulated phenological phases of all cultivars well during evaluation. Good statistical indices (MPD 0–0.41 and RMSE 0.80–0.86) were computed for CERES-Wheat during the 2008–2009 evaluation. It predicted almost an equal number of days during calibration while a higher MPD was recorded in APSIM-Wheat. Models’ simulations were also found reasonably good during the 2009–2010 evaluation with the lowest RMSE for both anthesis and maturity. Simulations also showed better prediction of CERES as compared to APSIM. A possible reason might be a limited set of genetic coefficients (Emerg_to_endjuv, Startgf_to_ mat (°d)) in APSIM-wheat for phenology simulation [40] while CERES-Wheat has a comprehensive set of genetic coefficients for phenology, such as PHINT, P1V, P1D and P5 [45]. APSIM has complex interaction and complications in simulating some phenological stages [18]. Leaf appearance rate and number of leaves control the timing of flowering appearance. So, accurate simulation of leaf initiation and appearance is crucial for accurate simulation of phenology [18,40]. Our findings for phenology events were equivalent to those reported by Nasim et al. [51] for the same locality under semiarid conditions but the days to anthesis were different due to different genotype [54] and weather conditions of the study area. However, the models did not predict the delay in phenological stages with the increase of nitrogen as observed in the field trials. CERES and APSIM wheat calculate phenological stages based on thermal time (degree days). Thermal time is calculated using the air temperature and does not reflect the soil temperature in the root zone. Our findings regarding the phenological stages were better than different studies conducted in a different environment with diverse wheat genotypes using different versions of DSSAT and APSIM. However, a wider range of datasets was used and good phenological simulations with RMSE of 4.49 and 5.08 (days) for anthesis and maturity were recorded, respectively [51].

4.3. Leaf Area Index (LAI) and Total Dry Matter

Leaf area index simulations were good during both year of evaluation while the time course analysis slightly overpredicted but had lower RMSE (0.25 days) and good R2 and a d-index value of 0.98 during the calibrated year (2008–2009) in CERES-Wheat. APSIM wheat under-simulated LAI during both years of study with good statistical indices (RMSE ranged from 0.42 and 0.46 and reliable d-index values of 0.86 and 0.84). APSIM-Wheat showed a linear relationship with nitrogen application but less response to zero- nitrogen application as compared to CERES-Wheat. Although, APSIM is highly sensitive to nitrogen as depicted in the time course trends with quite good statistical indices. APSIM-Wheat under-simulated LAI for all genotypes with an overall acceptable range of MPD during both years. Differences in growth pattern were due to variability in weather conditions during the years. Higher solar radiation and temperature favored the early growth of LAI during the first year as compared to 2nd year of the study. Temperatures higher than 34 °C have decreased the wheat yield up to 50% due to increased leaf senescence during the growth stages [38]. Minimum and extreme temperature might lead to great uncertainty in APSIM-Wheat because green leave death rate is controlled by decreasing the daily minimum temperature which might contribute to the uncertainty in leaf area simulation [46].
Crop models’ prediction for above ground biomass for wheat genotypes and nitrogen increments was quite good for both studied years. CERES-Wheat over-simulated TDM with mean PD (2.8%) and RMSE 535 kg ha−1. Simulation results were better during evaluation in the 2009–2010 growing period having an MPD of 1.80% and an RMSE of 424 kg ha−1 for CERES-Wheat because the crop produced less TDM during 2009–2010, so the prediction was closer to observed ones. The use of models for TDM simulation was described with good accuracy by Chen et al. [25] who concluded that the APSIM-wheat model can simulate biomass and is able to describe more than 90% variation in crop biomass. Dry matter was strongly influenced by vernalization sensitivity and thermal time to floral initiation. The thermal time required between the stages from emergence to end of juvenile was determined by the vernalization sensitivity of the wheat cultivar and the number of vernalization days during that period [55]. Changing the value of vernalization sensitivity resulted in a lengthy or reduced vegetative growth period, thereby affecting the biomass accumulation in APSIM wheat. Our findings regarding the total dry matter in CERES-Wheat were in accordance to some other studies [50,56] under semi-arid environment while a sub-tropical study was supported by Andarzian et al. [57]. In the rice- wheat cropping system, rice straw acts as surface mulch which alters soil temperature in the seed zone that ultimately affects the rate of germination, development, and growth [58]. In wheat, an increase in soil temperature (3–5 cm topsoil) towards optimum around the crown root nodes significantly increases dry matter production.

4.4. Grain Yield

CERES-Wheat and APSIM-Wheat simulated grain yield well during both year of evaluation for all cultivars with different nitrogen rates. Lower MPD (6.8%) was recorded in CERES-Wheat while APSIM overall under-simulated with slightly higher MPD (−15%) but had good RMSE (227 kg ha−1) and a higher d-index value (0.92) for all treatments during model evaluation (2008–2009). APSIM-Wheat under-simulated due to different prediction behavior and difference in genetic coefficient. The genetic coefficients dealt with grain yield simulation in APSIM are the thermal time from beginning of grain-filling to maturity (°d), kernel number per stem weight, potential maximum grain size. Our findings were slightly different from previous studies that were conducted under different environments across the world, but some studies conducted in India showed that yields prediction using CERES-wheat under DSSAT (V3.5) by Pathak et al. [59] and using WTGROWS by Aggarwal et al. [60] for Ludhiana, were slightly greater (mean 7.9 and 7.0 t ha−1, respectively). The study by Pathak et al. [58] used different varieties, and hence cannot directly be compared to cultivars used in this study. Our results also confirm the review of Timsina and Humphreys [51] that stated satisfactory simulation of grain yield across several locations throughout the world, except at very low-yield levels or in high-temperature environments. APSIM-wheat performed well for grain yield and the overall results were satisfactory as reported by Singh et al. [8] with R2 values (0.88). The results depicted that APSIM model performed well, and its efficacy can be determined by validation of statistical indices. Zhang et al. [55] reported that yield simulation might be improved if the model could simulate more accurately the days after sowing under variable climatic scenarios. Uncertainty for grain yield prediction by CERES-Wheat was due to genetic coefficient calculations by sensitivity analysis approach. Moreover, grain yield was influenced by the values of genetic coefficients PHINT, G1, G2, and G3. CERES-wheat was highly sensitive to change in these genetic coefficients, 10% variation in grain yield was observed by changing only one value in G1 while a similar trend was observed for G2 and G3 for the kernel weight and number of ears per m2, respectively. APSIM-Wheat performance for grain yield simulation can be achieved by using measured phyllochrons instead of a general value [61] because the grain yield of wheat has a stronger relationship with the kernel number per unit ground area than kernel weight [62]. In general, the results for the simulated grain yield indicated that the CERES and APSIM-Wheat are capable to simulate yield precisely for wheat cultivars with different nitrogen rates under irrigated conditions for a semiarid environment. Nitrogen stress and difference in precipitation during the growing season might affect the performance of the models.

4.5. CERES-Wheat and APSIM-Wheat Evaluation at Farmers’ Field

Calibrated models were evaluated with data collected from farmer’s field and showed higher variation and percent error as compared to field experiments, probably due to the use of sub-optimal crop management practices (sowing time, irrigation, fertilizer, planting density etc.) at farmers’ fields with a high degree of variation in resource application and utilization. CERES-Wheat farmer’s field simulations were in good range with MPD of −25% to 27%, RMSE of 436 kg ha−1 with a reasonable high d-index of 0.87 and a bias of 0.98 was obtained between the observed and simulated grain yield while APSIM-Wheat simulation showed higher variation with MPD of −26% to 40% and RMSE of 592 kg ha−1. As discussed earlier regarding the good prediction of CERES- Wheat, the same trend was observed in farmers’ field evaluation which is only due to the robust estimation of the wheat genetic coefficient. However, the farmers field data evaluation showed higher uncertainty as compared to experimental data, because in the experiments, the management errors were controlled to reduce the experimental error, but it was not so in case of the farmer, where the farmers face several constraints apart from the variability in the management practices. Farmers’ field grain yield was less as compared to experiment due to the above-discussed facts but some progressive farmers field simulations were in accordance with the observed parameters, the reason was only the recommended use of inputs and agronomic crop management practices in the study areas due to the awareness among the farmers. A higher PD between simulated and observed grain yield was recorded up to 40% by the model as well as representing the poor crop management practices by the farmers. This wider variability in grain yields in the rice-wheat cropping system indicates the need in capturing and analyzing the variability in other wheat yield zones as well. Our finding showed that the CERES and APSIM-Wheat models can be used as an appropriate tool to explore farm management options and to determine the best ones to apply in sustainable crop production at farmers’ field.

5. Conclusions

Despite of limitations, DSSAT and APSIM can be a useful decision support systems to assist scientists, extension experts and even farmers to evaluate the best agronomic management practices in the rice-wheat cropping system. Furthermore, the model simulations can be used and extrapolated to other areas with similar environmental conditions. DSSAT predicted the phenology and yield of wheat in a better way in both experiments and rice-wheat cropping system farmer field data due to its comprehensive set of genetic coefficients available as compared to APSIM. The intercomparison of DSSAT and APSIM developed the confidence to evaluate options for sustainable wheat production in the rice-wheat cropping system. Model intercomparison can play a major role for decision making for stakeholders and policy makers at the government level for production planning to raise farm production and farming livelihood.

Supplementary Materials

The following are available online at https://www.mdpi.com/article/10.3390/agriculture11111166/s1. Table S1: Comparison of simulated and observe days to anthesis at different nitrogen levels for wheat cultivars during year 2008–2009, Table S2: Comparison of simulated and observe days to maturity at different nitrogen levels for wheat cultivars during year 2008–2009, Figure S1: Simulated and observed time course leaf area index and total dry matter of wheat cultivars, Faisalabad-2008 (a, d, g), Lasani-2008 (b, e, h) and Sehar-2006 (c, f, i) at various nitrogen levels (0, 55 and 220 kg ha−1) for DSSAT and APSIM models evaluation for the year 2008–2009, Figure S2: Simulated and observed time course leaf area index and total dry matter of wheat cultivars, Faisalabad-2008 (a, d, g, j), Lasani-2008 (b, e, h, k) and Sehar-2006 (c, f, i, l) at various nitrogen levels (0, 55, 110 and 220 kg ha−1) for DSSAT and APSIM models evaluation for the year 2009–2010.

Author Contributions

Conceptualization, A.W. and G.H.; methodology, A.W. and K.H.; software, A.W., K.H. and M.H.-u.-R.; validation, A.I. and Q.S.; formal analysis, A.W., K.H. and A.I., investigation, A.W., K.H., M.H.-u.-R. and Q.S.; resources, A.W. and G.H.; data curation, K.H.; writing—original draft preparation, A.W., K.H., M.H.-u.-R. and Q.S.; writing—review and editing, A.W., K.H., M.H.-u.-R., Q.S. and G.H.; visualization, A.W. and K.H.; supervision, A.W.; project administration, A.W. and G.H.; funding acquisition, A.W. and G.H. All authors have read and agreed to the published version of the manuscript.

Funding

This research was funded by funded by UKaid.

Institutional Review Board Statement

IRBS statement is not required because no humans, animals or biological material is used in this study.

Data Availability Statement

Data will be available on request to corresponding author.

Acknowledgments

This work was funded by UKaid with Agricultural Modeling Intercomparsion and Improvemnet Project (AgMIP).

Conflicts of Interest

The authors confirm that there is no conflict of interest with the networks, organizations and data centers referred in the manuscript.

References

  1. Jones, J.W.; Hoogenboom, G.; Porter, C.H.; Boote, K.J.; Batchelor, W.D.; Hunt, L.A.; Wilkens, P.W.; Singh, U.; Gijsman, A.J.; Ritchie, J.T. The DSSAT Cropping System Model. Eur. J. Agron. 2003, 18, 235–265. [Google Scholar] [CrossRef]
  2. Hussain, K.; Wongleecharoen, C.; Hilger, T.; Ahmad, A.; Kongkaew, T.; Cadisch, G. Modelling resource competition and its mitigation at the crop-soil-hedge interface using WaNuLCAS. Agrofor. Syst. 2016, 90, 1025–1044. [Google Scholar] [CrossRef]
  3. Yin, X.; Struik, P.C. Applying Modelling Experiences from the Past to Shape Crop Systems Biology: The Need to Converge Crop Physiology and Functional Genomics. New Phytol. 2008, 179, 629–642. [Google Scholar] [CrossRef] [PubMed]
  4. Rötter, R.; Tao, F.; Höhn, J.G.; Palosuo, T. Use of Crop Simulation Modelling to Aid Ideotype Design of Future Cereal Cultivars. J. Exp. Bot. 2015, 66, 3463–3476. [Google Scholar] [CrossRef] [Green Version]
  5. Hussain, K. Measuring and Modelling Resource Use Competition at the Crop-Soil-Hedge Interface on a Hillside in Western Thailand; Uni-Hohenheim: Stuttgart, Germany, 2015; pp. 1–136. [Google Scholar]
  6. Hussain, K.; Ilyas, A.; Wajid, A.; Ahmad, A.; Mahmood, N.; Hilger, T.; Kongkaew, T. Alley Cropping Simulation: An Opportunity for Sustainable Crop Production on Tropical Uplands. Pak. J. Agric. Sci. 2019, 56, 109–112. [Google Scholar] [CrossRef]
  7. Arora, V.; Singh, H.; Singh, B. Analyzing Wheat Productivity Responses to Climatic, Irrigation and Fertilizer-Nitrogen Regimes in a Semi-Arid Sub-Tropical Environment Using the CERES-Wheat Model. Agric. Water Manag. 2007, 94, 22–30. [Google Scholar] [CrossRef]
  8. Singh, A.K.; Tripathy, R.; Chopra, U.K. Evaluation of CERES-Wheat and CropSyst Models for Water–Nitrogen Interactions in Wheat Crop. Agric. Water Manag. 2008, 95, 776–786. [Google Scholar] [CrossRef]
  9. Montazar, A.; Mohseni, M. Optimizing Wheat Water Productivity as Affected by Irrigation and Fertilizer-nitrogen Regimes in an Arid Environment. J. Agric. Sci. 2011, 3, p143. [Google Scholar] [CrossRef]
  10. Hoogenboom, G. Contribution of Agrometeorology to the Simulation of Crop Production and its Applications. Agric. For. Meteorol. 2000, 103, 137–157. [Google Scholar] [CrossRef]
  11. Boote, K.J.; Jones, J.W.; Hoogenboom, G.; White, J.W. The Role of Crop Systems Simulation in Agriculture and Environment. Int. J. Agric. Environ. Inf. Syst. 2010, 1, 41–54. [Google Scholar] [CrossRef]
  12. Parry, M.; Rosenzweig, C.; Livermore, M. Climate Change, Global Food Supply and Risk of Hunger. Philos. Trans. R. Soc. B Biol. Sci. 2005, 360, 2125–2138. [Google Scholar] [CrossRef] [Green Version]
  13. Bannayan, M.; Crout, N.; Hoogenboom, G. Application of the CERES-Wheat Model for Within-Season Prediction of Winter Wheat Yield in the United Kingdom. Agron. J. 2003, 95, 114–125. [Google Scholar] [CrossRef]
  14. Farage, P.; Ardö, J.; Olsson, L.; Rienzi, E.; Ball, A.; Pretty, J. The Potential for Soil Carbon Sequestration in Three Tropical Dryland Farming Systems of Africa and Latin America: A Modelling Approach. Soil Tillage Res. 2007, 94, 457–472. [Google Scholar] [CrossRef]
  15. Malone, R.; Huth, N.; Carberry, P.; Ma, L.; Kaspar, T.; Karlen, D.; Meade, T.; Kanwar, R.; Heilman, P. Evaluating and Predicting Agricultural Management Effects under Tile Drainage Using Modified APSIM. Geoderma 2007, 140, 310–322. [Google Scholar] [CrossRef] [Green Version]
  16. Kalra, N.; Chakraborty, D.; Kumar, P.R.; Jolly, M.; Sharma, P. An Approach to Bridging Yield Gaps, Combining Response to Water and other Resource Inputs for Wheat in Northern India, Using Research Trials and Farmers’ Fields Data. Agric. Water Manag. 2007, 93, 54–64. [Google Scholar] [CrossRef]
  17. Evett, S.R.; Tolk, J.A. Introduction: Can Water Use Efficiency be Modeled Well Enough to Impact Crop Management? Agron. J. 2009, 101, 423–425. [Google Scholar] [CrossRef]
  18. Keating, B.A.; Carberry, P.S.; Hammer, G.L.; Probert, M.E.; Robertson, M.J.; Holzworth, D.; Huth, N.I.; Hargreaves, J.N.G.; Meinke, H.; Hochman, Z.; et al. An Overview of APSIM, a Model Designed for Farming Systems Simulation. Eur. J. Agron. 2003, 18, 267–288. [Google Scholar] [CrossRef] [Green Version]
  19. Yunusa, I.A.M.; Bellotti, W.D.; Moore, A.D.; Probert, M.E.; Baldock, J.A.; Miyan, S.M. An Exploratory Evaluation of APSIM to Simulate Growth and Yield Processes for Winter Cereals in Rotation Systems in South Australia. Aust. J. Exp. Agric. 2004, 44, 787–800. [Google Scholar] [CrossRef]
  20. Van Ittersum, M.; Howden, S.; Asseng, S. Sensitivity of Productivity and Deep Drainage of Wheat Cropping Systems in a Mediterranean Environment to Changes in CO2, Temperature and Precipitation. Agric. Ecosyst. Environ. 2003, 97, 255–273. [Google Scholar] [CrossRef]
  21. Carberry, P.; Hochman, Z.; McCown, R.; Dalgliesh, N.; Foale, M.; Poulton, P.; Hargreaves, J.; Hargreaves, D.; Cawthray, S.; Hillcoat, N.; et al. The FARMSCAPE Approach to Decision Support: Farmers’, Advisers’, Researchers’ Monitoring, Simulation, Communication and Performance Evaluation. Agric. Syst. 2002, 74, 141–177. [Google Scholar] [CrossRef]
  22. Palosuo, T.; Kersebaum, K.C.; Angulo, C.; Hlavinka, P.; Moriondo, M.; Olesen, J.E.; Patil, R.H.; Ruget, F.; Rumbaur, C.; Takáč, J.; et al. Simulation of Winter Wheat Yield and Its Variability in Different Climates of Europe: A Comparison of Eight Crop Growth Models. Eur. J. Agron. 2011, 35, 103–114. [Google Scholar] [CrossRef] [Green Version]
  23. Fodor, N.; Máthéné-Gáspár, G.; Pokovai, K.; Kovács, G.J. 4M-Software Package for Modelling Cropping Systems. Eur. J. Agron. 2003, 18, 389–393. [Google Scholar] [CrossRef]
  24. Chen, C.; Wang, E.; Yu, Q. Modelling the Effects of Climate Variability and Water Management on Crop Water Productivity and Water Balance in the North China Plain. Agric. Water Manag. 2010, 97, 1175–1184. [Google Scholar] [CrossRef]
  25. Adam, M.; Belhouchette, H.; Corbeels, M.; Ewert, F.; Perrin, A.; Casellas, E.; Celette, F.; Wery, J. Protocol to support model selection and evaluation in a modular crop modelling framework: An application for simulating crop response to nitrogen supply. Comput. Electron. Agric. 2012, 86, 43–54. [Google Scholar] [CrossRef]
  26. Ferrise, R.; Moriondo, M.; Bindi, M. Probabilistic Assessments of Climate Change Impacts on Durum Wheat in the Mediterranean Region. Nat. Hazards Earth Syst. Sci. 2011, 11, 1293–1302. [Google Scholar] [CrossRef]
  27. Børgesen, C.D.; Olesen, J.E. A Probabilistic Assessment of Climate Change Impacts on Yield and Nitrogen Leaching from Winter Wheat in Denmark. Nat. Hazards Earth Syst. Sci. 2011, 11, 2541–2553. [Google Scholar] [CrossRef] [Green Version]
  28. Rötter, R.; Palosuo, T.; Kersebaum, K.C.; Angulo, C.; Bindi, M.; Ewert, F.; Ferrise, R.; Hlavinka, P.; Moriondo, M.; Nendel, C.; et al. Simulation of Spring Barley Yield in Different Climatic Zones of Northern and Central Europe: A Comparison of Nine Crop Models. Field Crop. Res. 2012, 133, 23–36. [Google Scholar] [CrossRef]
  29. Van Rees, H.; McClelland, T.; Hochman, Z.; Carberry, P.; Hunt, J.; Huth, N.; Holzworth, D. Leading Farmers in South East Australia Have Closed the Exploitable Wheat Yield Gap: Prospects for Further Improvement. Field Crop. Res. 2014, 164, 1–11. [Google Scholar] [CrossRef]
  30. Martre, P.; Wallach, D.; Asseng, S.; Ewert, F.; Jones, J.W.; Rötter, R.; Boote, K.; Ruane, A.C.; Thorburn, P.J.; Cammarano, D.; et al. Multimodel Ensembles of Wheat Growth: Many Models are Better than One. Glob. Chang. Biol. 2015, 21, 911–925. [Google Scholar] [CrossRef]
  31. Soltani, A.; Sinclair, T.R. A Comparison of Four Wheat Models with Respect to Robustness and Transparency: Simulation in a Temperate, Sub-Humid Environment. Field Crop. Res. 2015, 175, 37–46. [Google Scholar] [CrossRef]
  32. Rosenberg, N.J. Climate Change, Agriculture, Water Resources: What Do We Tell Those That Need to Know? Clim. Chang. 2010, 100, 113. [Google Scholar] [CrossRef]
  33. Moodie, C.D.; Smith, H.W.; McCreery, R.A. Laboratory Manual for Soil Fertility; LWW: Washington, DC, USA, 1951; Volume 71, ISBN 0038-075X. [Google Scholar]
  34. Gijsman, A.J.; Hoogenboom, G.; Parton, W.J.; Kerridge, P.C. Modifying DSSAT Crop Models for Low-Input Agricultural Systems Using a Soil Organic Matter–Residue Module from CENTURY. Agron. J. 2002, 94, 462–474. [Google Scholar] [CrossRef]
  35. Porter, C.H.; Jones, J.W.; Adiku, S.; Gijsman, A.J.; Gargiulo, O.; Naab, J.B. Modeling Organic Carbon and Carbon-Mediated Soil Processes in DSSAT v4.5. Oper. Res. 2010, 10, 247–278. [Google Scholar] [CrossRef]
  36. Wong, M.T.F.; Asseng, S. Determining the Causes of Spatial and Temporal Variability of Wheat Yields at Sub-field Scale Using a New Method of Upscaling a Crop Model. Plant Soil 2006, 283, 203–215. [Google Scholar] [CrossRef]
  37. Zheng, B.; Chenu, K.; Doherty, A.; Chapman, S. The APSIM-Wheat Module (7.5 R3008). Agric. Prod. Syst. Simulator (APSIM) Initiat. 2014, 615. [Google Scholar]
  38. Asseng, S.; van Keulen, H.; Stol, W. Performance and application of the APSIM N Wheat Model in the Netherlands. Eur. J. Agron. 2000, 12, 37–54. [Google Scholar] [CrossRef]
  39. Ma, L.; Ahuja, L.R.; Saseendran, S.A.; Malone, R.W.; Green, T.R.; Nolan, B.T.; Bartling, P.N.S.; Flerchinger, G.N.; Boote, K.J.; Hoogenboom, G. A Protocol for Parameterization and Calibration of RZWQM2 in Field Research. In Methods of Introducing System Models into Agricultural Research; John Wiley & Sons Ltd.: New York, NY, USA, 2011; pp. 1–64. ISBN 9780891181965. [Google Scholar]
  40. Zhao, G.; Bryan, B.A.; Song, X. Sensitivity and Uncertainty Analysis of the APSIM-Wheat Model: Interactions Between Cultivar, Environmental, and Management Parameters. Ecol. Model. 2014, 279, 1–11. [Google Scholar] [CrossRef]
  41. Willmott, C.J. Some Comments on the Evaluation of Model Performance. Bull. Am. Meteorol. Soc. 1982, 63, 1309–1313. [Google Scholar] [CrossRef] [Green Version]
  42. Walker, W.E.; Harremoës, P.; Rotmans, J.; van der Sluijs, J.P.; van Asselt, M.B.A.; Janssen, P.; Krayer von Krauss, M.P. Defining Uncertainty: A Conceptual Basis for Uncertainty Management in Model-Based Decision Support. Integr. Assess. 2003, 4, 5–17. [Google Scholar] [CrossRef] [Green Version]
  43. Rezzoug, W.; Gabrielle, B.; Suleiman, A.; Benabdeli, K. Application and Evaluation of the DSSAT-Wheat in the Tiaret Region of Algeria. Afr. J. Agric. 2008, 3, 284–296. [Google Scholar]
  44. Rinaldi, M. Water Availability at Sowing and Nitrogen Management of Durum Wheat: A Seasonal Analysis with the CERES-Wheat Model. Field Crop. Res. 2004, 89, 27–37. [Google Scholar] [CrossRef]
  45. Yang, Y.; Watanabe, M.; Zhang, X.; Hao, X.; Zhang, J. Estimation of Groundwater Use by Crop Production Simulated by DSSAT-Wheat and DSSAT-Maize Models in the Piedmont Region of the North China Plain. Hydrol. Process. 2006, 20, 2787–2802. [Google Scholar] [CrossRef]
  46. Nakayama, T.; Yang, Y.; Watanabe, M.; Zhang, X. Simulation of Groundwater Dynamics in the North China Plain by Coupled Hydrology and Agricultural Models. Hydrol. Process. 2006, 20, 3441–3466. [Google Scholar] [CrossRef]
  47. Ghaffari, A.; Cook, H.; Lee, H. Simulating Winter Wheat Yields under Temperate Conditions: Exploring Different Management Scenarios. Eur. J. Agron. 2001, 15, 231–240. [Google Scholar] [CrossRef]
  48. Saseendran, S.; Trout, T.; Ahuja, L.; Ma, L.; McMaster, G.; Nielsen, D.; Andales, A.; Chávez, J.; Ham, J. Quantifying Crop Water Stress Factors from Soil Water Measurements in a Limited Irrigation Experiment. Agric. Syst. 2015, 137, 191–205. [Google Scholar] [CrossRef]
  49. Singh, H.; Singh, K.N.; Hasan, B. Evaluation of CERES-Rice Model (V. 4.0) under Temperate Conditions of Kashmir Valley, India. Cereal Res. Commun. 2007, 35, 1723–1732. [Google Scholar] [CrossRef]
  50. Nasim, W.; Ahmad, A.; Wajid, S.A.; Hussain, A.; Khaliq, T.; Usman, M.; Hammad, H.M.; Sultana, S.R.; Mubeen, M.; Ahmad, S. Simulation of Different Wheat Cultivars under Agro-Ecological Condition of Faisalabad-Pakistan. Crop. Environ. 2010, 1, 44–48. [Google Scholar]
  51. Timsina, J.; Humphreys, E. Performance of CERES-Rice and CERES-Wheat Models in Rice–Wheat Systems: A Review. Agric. Syst. 2006, 90, 5–31. [Google Scholar] [CrossRef]
  52. Gabrielle, B.; Roche, R.; Angas, P.; Cantero-Martínez, C.; Cosentino, L.; Mantineo, M.; Langensiepen, M.; Hénault, C.; Laville, P.; Nicoullaud, B.; et al. A Priori Parameterisation of the CERES Soil-Crop Models and Tests Against Several European Data Sets. Agronomie 2002, 22, 119–132. [Google Scholar] [CrossRef] [Green Version]
  53. Overman, A.R.; Wilkinson, S.R.; Evers, G.W. Yield Response of Bermudgrass and Bahiagrass to Applied Nitrogen and Overseeded Clover. Agron. J. 1992, 84, 998–1001. [Google Scholar] [CrossRef]
  54. Liu, Y.; Wang, E.; Yang, X.; Wang, J. Contributions of Climatic and Crop Varietal Changes to Crop Production in the North China Plain, since 1980s. Glob. Chang. Biol. 2010, 16, 2287–2299. [Google Scholar] [CrossRef]
  55. Zhang, Y.; Feng, L.; Wang, E.; Wang, J.; Li, B. Evaluation of the APSIM-Wheat Model in Terms of Different Cultivars, Management Regimes and Environmental Conditions. Can. J. Plant Sci. 2012, 92, 937–949. [Google Scholar] [CrossRef] [Green Version]
  56. Kumar, R.; Singh, K.K.; Gupta, B.R.D.; Baxla, A.K.; Rathore, L.S.; Attri, S.D. Optimum Sowing Dates for Soybean in Central India Using CROPGRO and Climprob Symbiosis. Meteorol. Appl. 2002, 9, 247–254. [Google Scholar] [CrossRef]
  57. Andarziyan, B.; Bakhshande, A.; Banayan Aval, M.; Emam, Y. Evaluation of the CERES-Wheat Model in Ahvaz Condition. Iran. J. Field Crop. 2008, 6, 11–22. [Google Scholar]
  58. Kaspar, T.C.; Bland, W.L. Soil Temperature and Root Growth. Soil Sci. 1992, 154, 290–299. [Google Scholar] [CrossRef]
  59. Pathak, H.; Ladha, J.; Aggarwal, P.; Peng, S.; Das, S.; Singh, Y.; Singh, B.; Kamra, S.; Mishra, B.; Sastri, A.; et al. Trends of Climatic Potential and On-Farm Yields of Rice and Wheat in the Indo-Gangetic Plains. Field Crop. Res. 2003, 80, 223–234. [Google Scholar] [CrossRef]
  60. Aggarwal, P.; Kalra, N.; Singh, A.; Sinha, S. Analyzing the Limitations Set by Climatic Factors, Genotype, Water and Nitrogen Availability on Productivity of Wheat I. The Model Description, Parametrization and Validation. Field Crop. Res. 1994, 38, 73–91. [Google Scholar] [CrossRef]
  61. Bassu, S.; Asseng, S.; Motzo, R.; Giunta, F. Optimising Sowing Date of Durum Wheat in a Variable Mediterranean Environment. Field Crop. Res. 2009, 111, 109–118. [Google Scholar] [CrossRef]
  62. Duggan, B.L.; Richards, R.A.; Van Herwaarden, A.F.; Fettell, N.A. Agronomic Evaluation of a Tiller Inhibition Gene (Tin) in Wheat. I. Effect on Yield, Yield Components, and Grain Protein. Aust. J. Agric. Res. 2005, 56, 169–178. [Google Scholar] [CrossRef]
Figure 1. Mean minimum and maximum temperature and rainfall at Faisalabad during the 2008–2009 and 2009–2010 wheat growing seasons.
Agriculture 11 01166 g001
Figure 2. Geographical location of integrated assessment regions (5 stratum) with 155 farmers’ field in the Rice-Wheat cropping zone of Punjab, Pakistan.
Agriculture 11 01166 g002
Figure 3. Simulated and observed time course leaf area index and total dry matter of wheat cultivars, Faisalabad-2008 (a), Lasani-2008 (b) and Sehar-2006 (c) for DSSAT (CERES) and APSIM models calibration for year 2008–2009.
Agriculture 11 01166 g003
Figure 4. Intercomparison of simulated and observed leaf area index at different nitrogen levels for wheat cultivars during years 2008–2009 (ac) and 2009–10 (df).
Agriculture 11 01166 g004
Figure 5. Comparison of measured and simulated LAI (ac), grain yield (df) total dry matter (gi) of wheat cultivars with different nitrogen application rates during the calibrated year 2008–2009 and evaluation year 2009–2010.
Agriculture 11 01166 g005
Figure 6. Intercomparison of simulated and observed total dry matter (kg ha−1) at different nitrogen levels for wheat cultivars during years 2008–2009 (ac) and 2009–2010 (df).
Agriculture 11 01166 g006
Figure 7. Intercomparison of simulated and observed grain yield (kg ha−1) at different nitrogen levels for wheat cultivars during years 2008–2009 (ac) and 2009–2010 (df).
Agriculture 11 01166 g007
Figure 8. Relationship between observed and simulated yield in 155 farmers’ wheat fields (a) using DSSAT (CERES-Wheat), (b) using APSIM-Wheat in five strata of the rice-wheat cropping zone of Punjab, Pakistan.
Agriculture 11 01166 g008
Table 1. Genetic coefficients under CERES-Wheat used for model calibration.
CultivarsP1V
(Days)
P1DP5
(°C.d)
G1
(#/g)
G2
(mg)
G3
(g dwt)
PHINT
(°C.d)
Faisalabad-2008224159631281.370
Lasani-2008194551032241.968
Sehar-2006164069137221.274
Table 2. Genetic Coefficients for APSIM Wheat Calibration.
Faisalabad-2008Lasani-2008Sahar-2006
1 Emerg_to_endjuv (°d)422.0389390
2 Startgf_to_ mat (°d)560549628
3 Potential_grain_filling_rate (g per kernel per day)0.00200.00100.0010
4 Grains_per_gram_stem (g per stem)24.035.528.0
5 Max_grain_size (g per kernel)0.0460.0630.062
6 Vern_sens2.52.162.35
7 Photop_sens3.593.823.32
1 Emerg_to_endjuv (thermal time from emergence to end juvenile stage (°d), 2 Startgf_to_ mat (thermal time from beginning of grain-filling to maturity (°d), 3 Potential_grain_filling_rate (potential grain-filling rate (g per kernel per day)), 4 Grains_per_gram_stem (coefficient of kernel number per stem weight at the beginning of grain-filling (g per stem)), 5 Max_grain_size (potential maximum grain size (g per kernel)), 6 Vern_sens (sensitivity to vernalization), 7 Photop_sens (sensitivity to photoperiod).
Table 3. Comparison of observed and simulated anthesis, maturity days, leaf area index, grain yield and biological yield of cultivars Faisalabad 2008, Lasani-2008 and Sahar-2006 for the parameterization of DSSAT (CERES-Wheat) and APSIM (APSIM-Wheat) during 2008–2009.
ParametersCultivar Faisalabad-2008Cultivar Lasani-2008Cultivar Sahar-2006
(DSSAT)(APSIM)(DSSAT)(APSIM)(DSSAT)(APSIM)
Obs.Sim.PDSim.PDObs.Sim.PDSim.PDObs.Sim.PDSim.PD
Days to anthesis 10610601070.9410810801101.851071051.871091.87
Days to maturity 14214201430.701411400.711452.841461450.681481.37
Maximum LAI4.704.35−7.925.2010.664.54.3−4.444.25−5.564.84.70−2.084.17−13.04
Grain yield
(kg ha−1)
489748570.8248570.82425643031.1042360.47448847054.8443433.23
Above ground biomass
(kg ha−1)
12,31712,1181.6212,3120.0411,61411,7871.4911,6520.3312,56112,9783.3211,7956.10
Publisher’s Note: MDPI stays neutral with regard to jurisdictional claims in published maps and institutional affiliations.

