Article

Grain-Filling Characteristics in Extra-Large Panicle Type of Early-Maturing japonica/indica Hybrids

1
Joint International Research Laboratory of Agriculture and Agri-Product Safety, Institutes of Agricultural Science and Technology Development, The Ministry of Education of China, Yangzhou University, Yangzhou 225009, China
2
Jiangsu Key Laboratory of Crop Cultivation and Physiology, Jiangsu Key Laboratory of Crop Genetics and Physiology, Jiangsu Co-Innovation Center for Modern Production Technology of Grain Crops, Research Institute of Rice Industrial Engineering Technology, Yangzhou University, Yangzhou 225009, China
*
Author to whom correspondence should be addressed.
Agriculture 2021, 11(11), 1165; https://doi.org/10.3390/agriculture11111165
Submission received: 4 October 2021 / Revised: 11 November 2021 / Accepted: 16 November 2021 / Published: 19 November 2021

Abstract

:
Early-maturing japonica/indica hybrids (EJIH) have recently been released, performing a yield potential of 13.5 t ha−1 and greater yield increase over conventional japonica rice (CJ) and hybrid indica rice (HI) in production. More spikelets per panicle and improved grain-filling efficiency underlined the basis for the superior yield performance of EJIH. However, few studies are available on the panicle traits and grain-filling characteristics of EJIH, as well as their differences to CJ and HI. In our study, two EJIH, two CJ, and two HI cultivars with similar growth patterns were grown in the same fields. EJIH had a 12.2–18.8% increased (p < 0.05) grain yield relative to CJ and HI, mainly attributed to their higher daily grain yield. Although it had a lower panicle per m2, EJIH exhibited 28.0–38.3% more (p < 0.05) spikelets per m2 from an increase of 58.0–87.8% (p < 0.05) in spikelets per panicle than CJ and HI. Compared with CJ and HI, EJIH had a higher single panicle weight and more grains in the six parts of the panicle, especially in the upper secondary branches (US) and middle secondary branches (MS). EJIH exhibited a higher leaf area index (LAI), leaf area duration (LAD), leaf photosynthetic rate, and SPAD values after heading, which helped increase shoot biomass weight at heading and maturity and post-heading biomass accumulation. For CJ and HI, the grain-filling dynamics of grains in the six parts were all well simulated by the Richards equation. For EJIH, the grain-filling dynamics of grains in the lower secondary branches (LS) were well fitted by the logistics equation, with the Richards equation simulating grain positioning on the other five parts. EJIH had a lower mean grain-filling rate (GRmean) and longer days and grain filling amounts (GFA) during early, middle, and late stages than CJ and HI. Our results suggest EJIH gave a yield advantage over CJ and HI through a higher daily grain yield. The panicle traits and grain-filling characteristics differed greatly among the three cultivar types. Compared with CJ and HI, EJIH had lower GRmean and higher days and more grains in the panicle during early, middle, and late stages, which contributed to an increased GFA after heading, improved filled-grain efficiency, and higher grain yield.

1. Introduction

The dominated cropping system in the lower reaches of the Yangtze River, China, is a rotation of rice and wheat [1]. In this system, rice is sown after harvesting wheat, and wheat is sown after harvesting rice. Proper sowing date is a critical basis for achieving a high yield of rice and wheat [2,3,4]. In recent years, late-maturing rice cultivars with high yield performance have been widely planted by farmers. However, these late-maturing rice cultivars are always harvested late, which delays the sowing date of wheat and easily cause a yield penalty [5,6]. Hence, rice cultivars with an early maturity and high yield potential are greatly needed to achieve the dual goals of high yields of rice and wheat in a rice-wheat cropping system.
Recently, great strides have been made in developing early-maturing japonica/indica hybrids (EJIH) represented by Yongyou 2640 and Yongyou 1640 in China. Compared with conventional japonica rice (CJ) and hybrid indica rice (HI), these EJIH demonstrated a similar growth pattern and superior yield potential [7,8]. Yongyou 2640 gained a yield record of 13.5 t ha−1 across consecutive years in production [9,10]. Owing to such characteristics, these EJIH were popular and extensively planted in production. For example, the planting area of Yongyou 2640 achieved 100,000 hectares in 2017 [10]. It has been widely recognized that more spikelets per panicle and improved grain-filling efficiency underlie the high yield of EJIH and their yield advantage over CJ and HI [11,12,13]. The spikelets per panicle of EJIH consistently exceeded 250, almost a one-fold increase over that of CJ [12,14]. More importantly, EJIH exhibited a filled-grain percentage (%) of nearly 90, similar to CJ and HI [13,14,15]. At present, however, few studies are available on panicle traits and grain-filling characteristics of EJIH with the extra-large panicle type.
For crops, grain filling is an important physiological process that affects grain yield and quality [16,17]. Modeling analysis is a classical method to understand the grain-filling characteristics of crops. For rice, the Richards equation is typically adopted to analyze the grain-filling dynamics of superior and inferior spikelets [18,19,20]. Here, superior spikelets, refer to the spikelets located in the upper primary branches (UP), flower earlier and have a faster grain-filling rate, while inferior spikelets refer to spikelets located in the lower secondary (LS) position of the panicle, and flower later with a lower grain-filling rate [20]. CJ and HI differ greatly in grain-filling characteristics. Generally, CJ has been considered as a synchronous grain-filling type, with HI considered an asynchronous type. CJ exhibits a lower grain-filling rate and longer grain-filling duration of the superior and inferior spikelets relative to HI [21,22,23]. To date, little attention has been paid to the difference in grain-filling characteristics among EJIH, CJ, and HI, the three main cultivar types in production in China. Furthermore, previous studies regarding rice grain-filling traits have focused mostly on the superior and inferior spikelets, which only occupy a small proportion of the panicle and do not entirely reflect grain-filling characteristics of different parts in the panicle, especially for rice cultivars with a large panicle.
Here, two EJIH cultivars, two CJ cultivars, and two HI cultivars were grown in the same paddy fields. Each panicle was divided into six parts, e.g., grains in the UP, upper secondary branches (US), middle primary branches (MP), middle secondary branches (MS), lower primary branches (LP), and LS. The present study was conducted to (1) determine panicle traits and grain-filling characteristics of EJIH and their differences to CJ and HI, and (2) investigate the main factors underlying improved grain-filling efficiency of EJIH with extra-large panicle type.

2. Materials and Methods

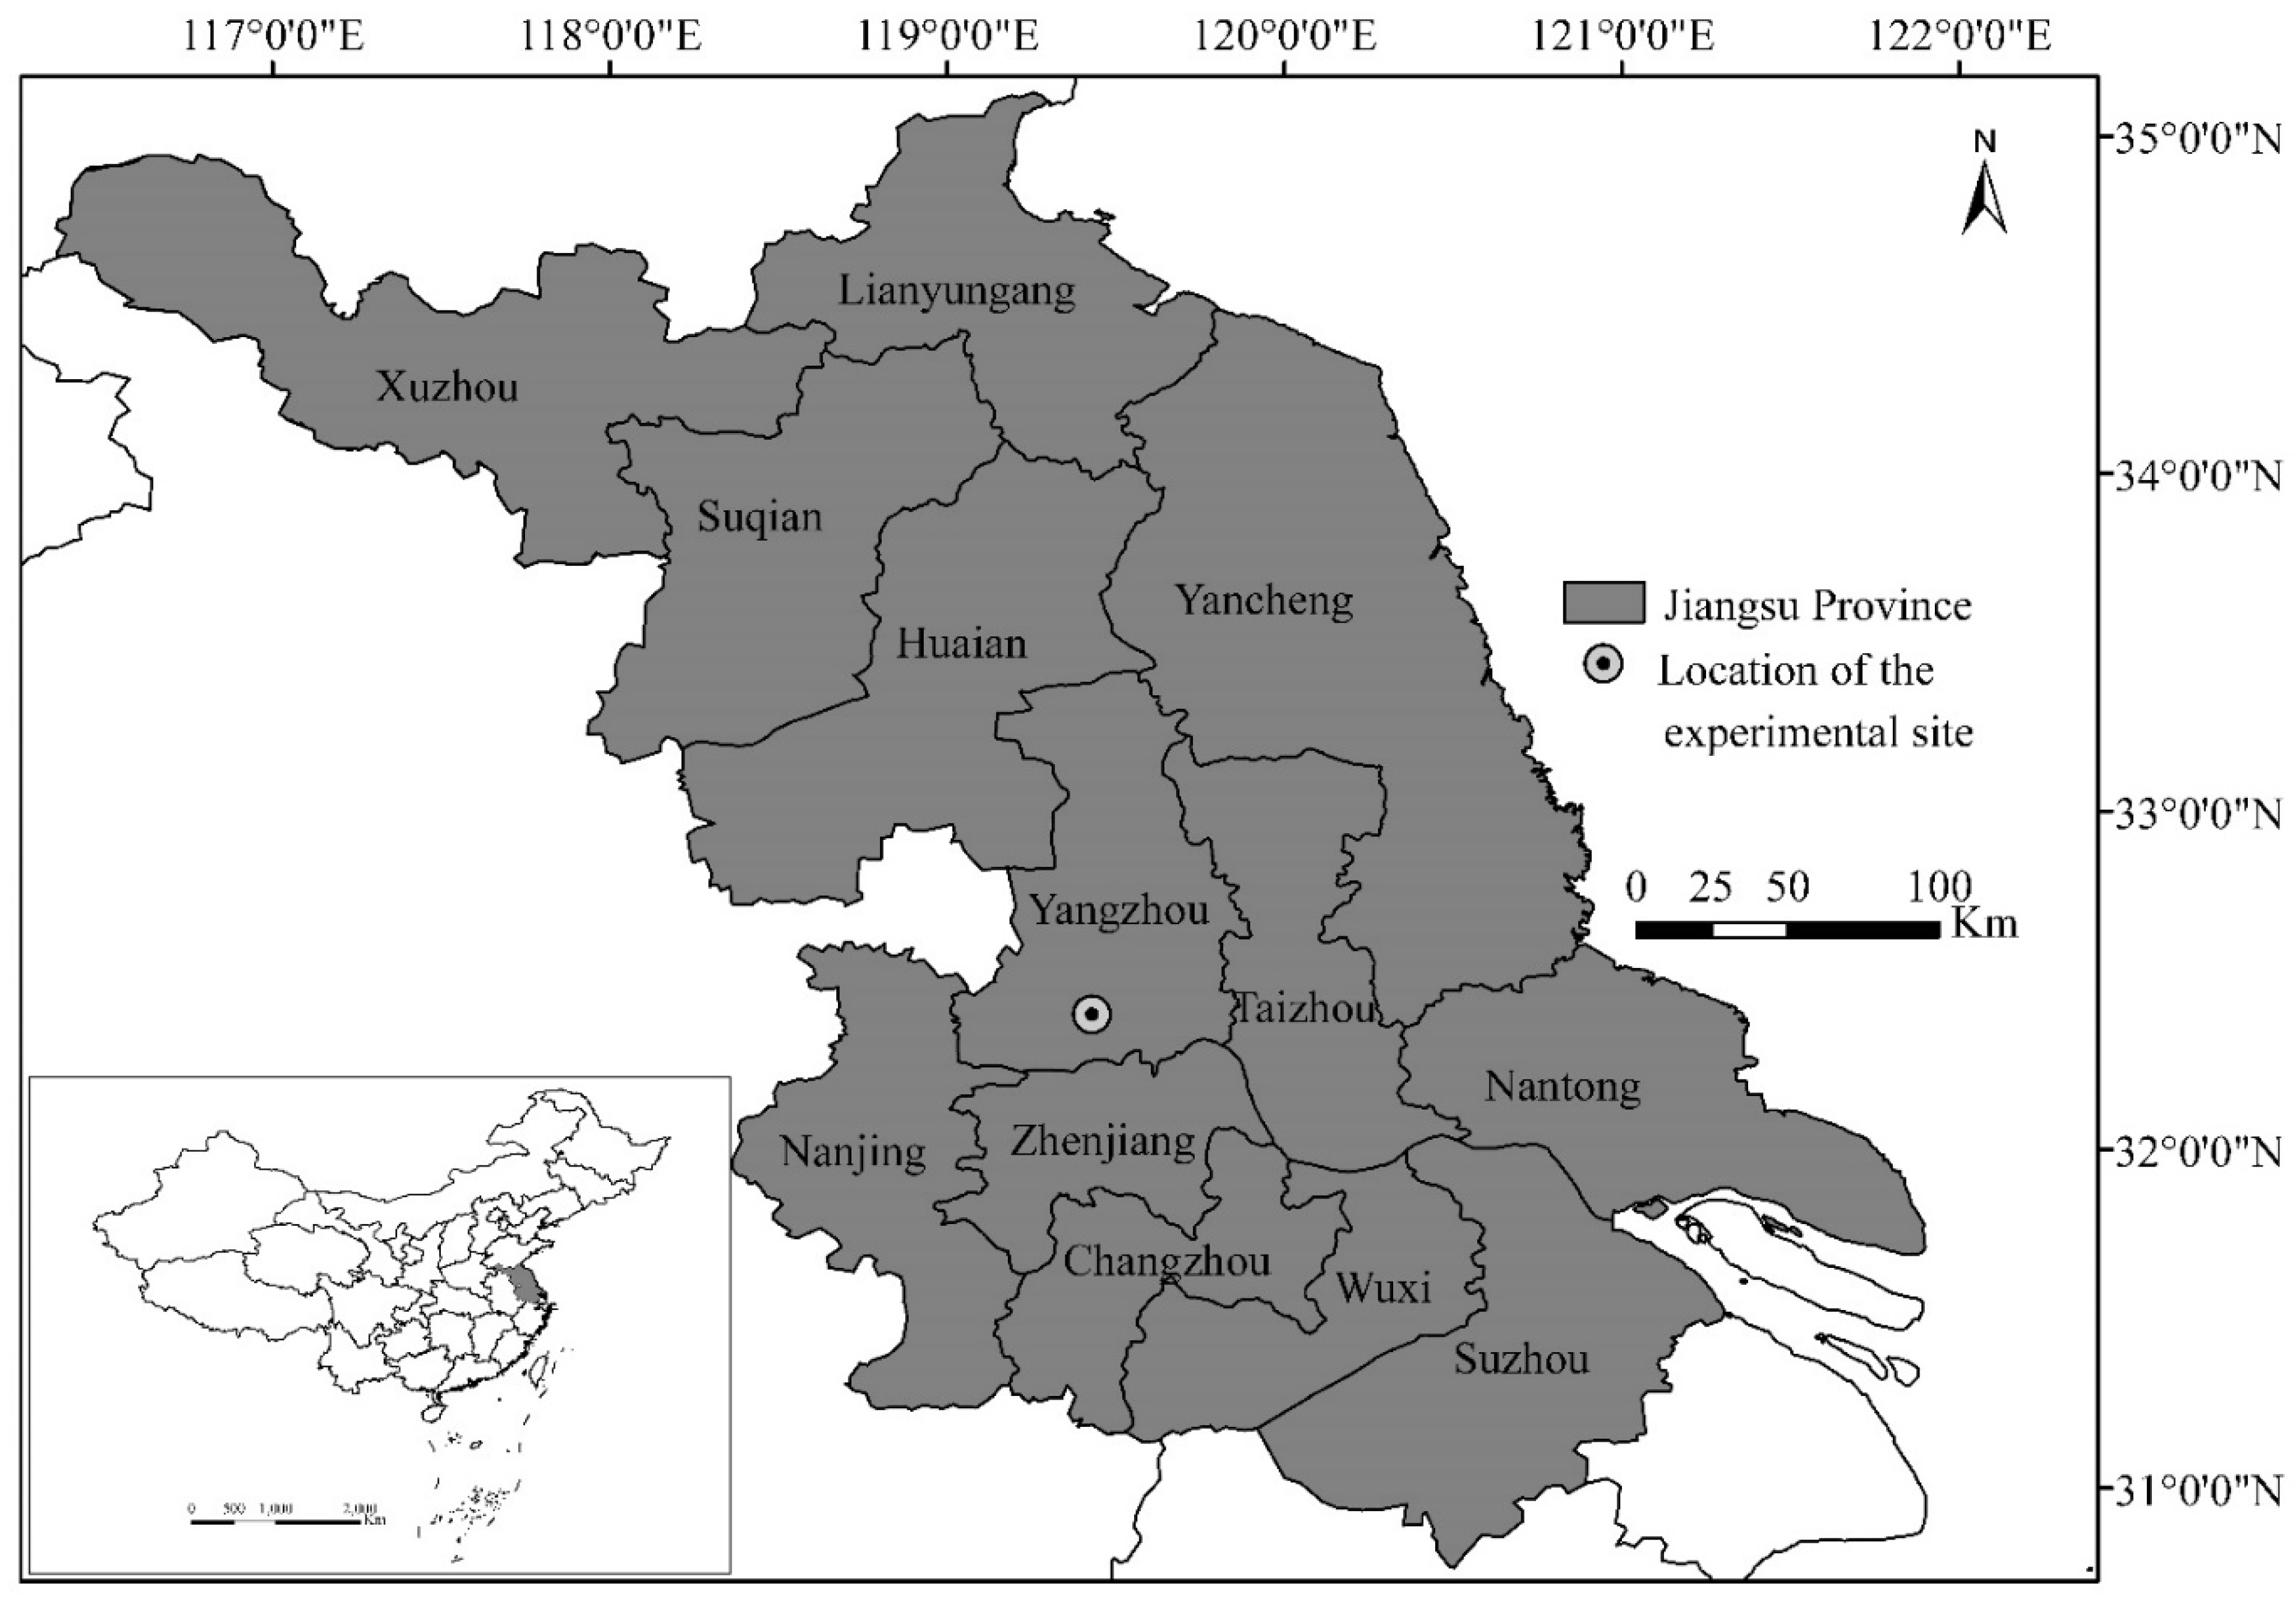
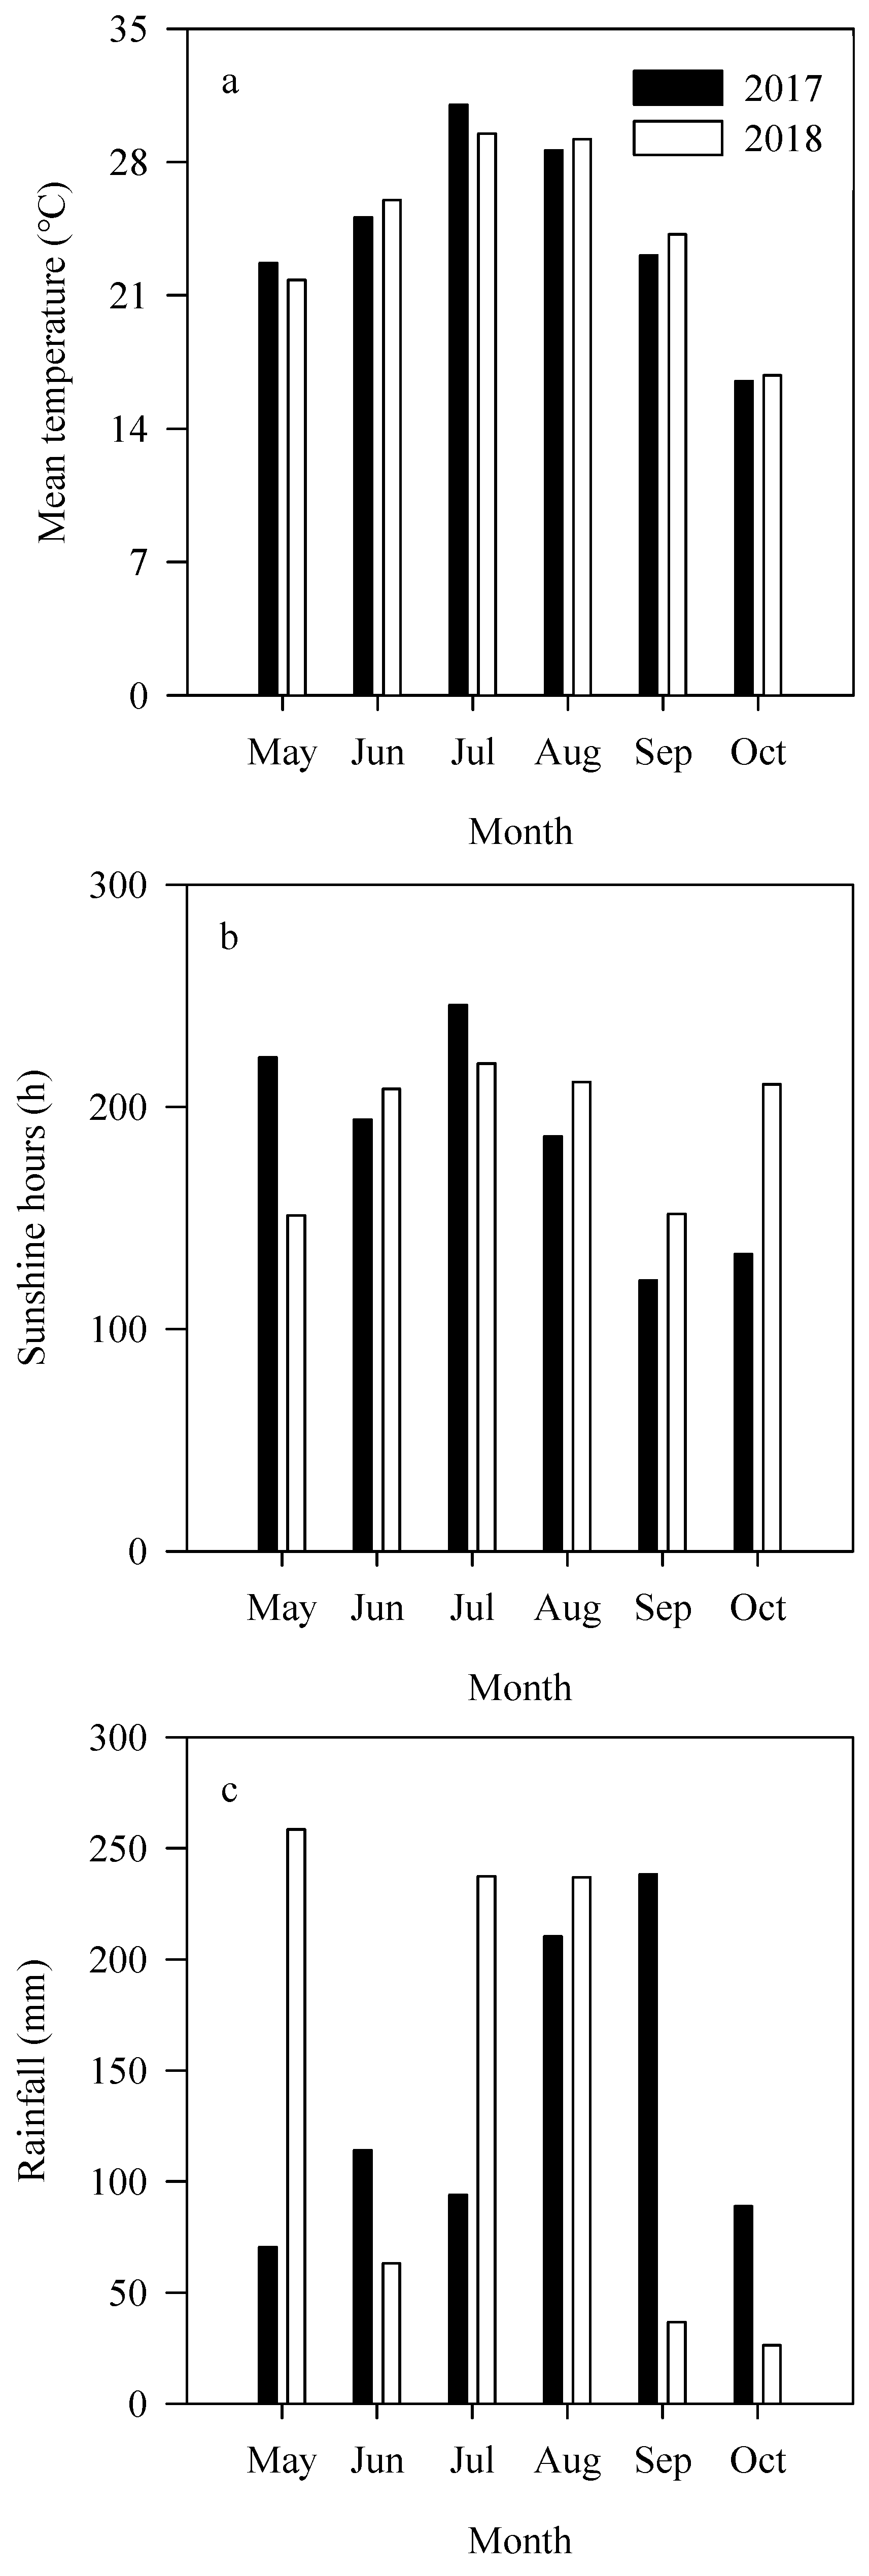
2.1. Experimental Site, Rice Cultivar, Field Design, and Crop Establishment

In 2017 and 2018, field trials were implemented at the experimental farm (119.25° E, 32.30° N) of Yangzhou University, Jiangsu, China (Figure 1). A rice-wheat rotation is the prevailed cropping system in this region. The experimental field soil was sandy loam (Typic Fluvaquent, Etisol (U.S. Taxonomy)). A surface sample of soil (0–20 cm) was collected to determine soil physical-chemical properties before planting rice. The 0–20 cm soil contained pH 7.5, 19.4 g organic carbon kg−1, 1.5 g total nitrogen (N) kg−1, 38.7 mg Olsen phosphorus (P) kg−1, and 85.1 mg available potassium (K) kg−1 in 2017; pH 7.6, 21.7 g organic carbon kg−1, 1.4 g total N kg−1, 34.3 mg Olsen P kg−1, and 94.5 mg available K kg−1 in 2018. Generally, the rice experienced similar mean temperature, sunshine hours, and rainfall during the rice-growing period from May to October at two years (Figure 2).
Two EJIH, two CJ, and two HI cultivars were field grown in this study. The two EJIH cultivars were Yongyou 2640 and Yongyou 1640; the two CJ cultivars were Yangjing 4227 and Zhendao 14; and the two HI cultivars were Fengyou 293 and Zhongnanyou 1. The selection of these rice cultivars was based on their popularity and large planting area in production. Furthermore, these rice cultivars share a similar growth pattern, and the total growth period ranged from 149 d to 153 d in this study. Detailed information on the year of release, cross information, and growth period of rice cultivars are listed in Table 1.
The experiment design was a randomized block, and each experimental plot covered 35 m2 (7 m × 5 m) with three replicates for two years. Rice seeds were sown in a seedling nursery on 23 May and transplanted with three seedlings per hill on 12 June. The hill spacing was 30 cm row spacing and 13 cm plant spacing. The management practices were the same in all experimental plots. N was applied at 270 kg urea-N ha−1 in total at a ratio of 3:3:2:2 1 d before transplanting, 1 week after transplanting, at panicle initiation, and during the penultimate-leaf appearance. The P and K fertilizers were both applied once as base dressing, at an application rate of 180 kg P2O5 ha−1 and 150 kg K2O ha−1, respectively. Irrigation regimes, pest, disease, and weed management followed local agricultural recommendations.

2.2. Measurements

At heading and maturity, five hills of plants were sampled to determine leaf area index (LAI) and shoot biomass. LAI was determined through a leaf area meter (LI-3100C, Lincoln, NE, USA). Sampled plants were subdivided into panicles, leaves, and stems, which were then placed well in Kraft paper bags, and shoot biomass was recorded after 80 h of oven-drying at 75 °C.
Plants heading and flowering at the same date were labeled as single stems with similar growing conditions, and 500 single stems were selected in each plot. The single plants were collected from heading to maturity, and 15 samples were collected at 4-d intervals to determine the grain-filling dynamics of rice cultivars. Total sampling times of EJIH, CJ, and HI were 17, 14, and 13, respectively, based on their grain-filling period (Table 1). At each sampling, rice panicles were divided into six parts, grains in the UP, US, MP, MS, LP, and LS. The specific classification was as follows, first, rice panicles were separated equally into upper, middle, and lower parts, based on the number of the primary branches; then the three parts were divided into primary and secondary branches according to the grain position.
For each rice cultivar, SPAD value was determined at 12, 24, and 36 days after heading (DAH), leaf photosynthetic rate was determined at 15, 30, and 45 DAH. SPAD values of flag leaf were determined by soil-plant analysis development meter (SPAD-502 plus). The flag leaf photosynthetic rate was performed through two photosynthetic instruments (LICOR-6400, Lincoln, NE, USA), which was conducted around 9:30 h to 11:00 h under sunny conditions.
At maturity, two hundred representative hills (7.8 m2) of plants in each plot excluding border plants were harvested for determining grain yield at 14% moisture. In addition, one hundred representative hills of plants in each plot were collected for measuring panicle traits and grain yield components.

2.3. Model Analysis of Grain Filling

In this study, the Richards equation and logistic equation were adopted to simulate rice grain-filling dynamics. The equation (Richards or logistic) with a better fit coefficient was selected to simulate the rice grain-filling process.
The Richards equation was expressed as W = A ( 1 + B e k t ) 1 N , where W represents the grain weight, A represents the final grain weight, and t represents the days after heading. The parameters B, K, and N were computed by the regression equation.
After parameters of the Richards equation were estimated, the maximum grain-filling rate (GRmax), mean grain-filling rate (GRmean), days achieving the maximum grain-filling rate (Dmax), and effective grain-filling period (EP) were calculated by follows [24]:
GR max = AK ( 1 +   N ) N   + 1 N ,   GR mean = AK 2 ( N   + 2 ) ,   D max = InB InN K ,   EP = In ( 100 99 ) N 1 B K
The rice grain-filling process could be divided into early (0–t1), middle (t1–t2), and late stages (t2–t3).
t 1 = In N 2 + 3 N + N ( N 2 + 6 N + 5 ) 1 / 2 2 B K ,   t 2 = In N 2 + 3 N N ( N 2 + 6 N + 5 ) 1 / 2 2 B K ,   t 3 = In ( 100 99 ) N 1 B K
GRmean during early stage =   W 1 t 1 , GRmean during middle stage =   W 2 W 1 t 2 t 1 , GRmean during late stage =   W 3 W 2 t 3 t 2 .
The logistic equation was expressed as W = A ( 1 + B e k t ) 1 , where W represents the grain weight, A represents the final grain weight, and t represents the days after heading. B and K are parameters computed by the regression equation.
After parameters of the logistic equation were estimated, the GRmax, GRmean, Dmax, and EP were calculated by follows [24]:
GR max = AK 4 ,   GR mean = AK InB + 4.595 ,   D max = InB K ,   EP = InB + 4.595 K
The rice grain-filling process could be divided into early (0–t1), middle (t1–t2), and late stages (t2–t3).
t 1 = InB In ( 2 + 3 1 2 ) K ,   t 2 = InB + In ( 2 + 3 1 2 ) K ,   t 3 = InB + 4.595 K
GRmean during early stage =   W 1 t 1 , GRmean during middle stage =   W 2 W 1 t 2 t 1 , GRmean during late stage =   W 3 W 2 t 3 t 2 .

2.4. Data Analysis

The data was processed using analysis of variance (ANOVA) with the least significant difference through SPSS 17.0 software (SPSS Inc., Chicago, IL, USA). ANOVA showed that there were no significant (p ≥ 0.05) differences in grain yield and the related agronomic and physiological traits between the two study years (Table 2), and data averaged across two years were used for the following analysis.

3. Results

3.1. Grain Yield and Panicle Traits

EJIH showed a 12.2% increase (p < 0.05) in grain yield over CJ, and an 18.8 increase (p < 0.05) over HI. Similarly, EJIH had a higher daily grain yield than CJ and HI (Table 3). EJIH showed 58.0–87.8% more (p < 0.05) spikelets per panicle and 28.0–38.3% more (p < 0.05) spikelets per m2, although with less panicles per m2 than CJ and HI. The filled-grain percentage of EJIH (nearly 88%) was similar to that of CJ and HI. The grain weight of CJ was close to HI, and higher (p < 0.05) than that of EJIH (Table 4).
HI showed the highest panicle length, followed by EJIH and CJ (p < 0.05), respectively. EJIH had 69.4% higher (p < 0.05) single panicle weight than CJ, and 36.9% higher (p < 0.05) than HI. Compared with CJ and HI, EJIH showed an increased number of grains on six parts of the panicle, especially in the US and MS position (Table 5).

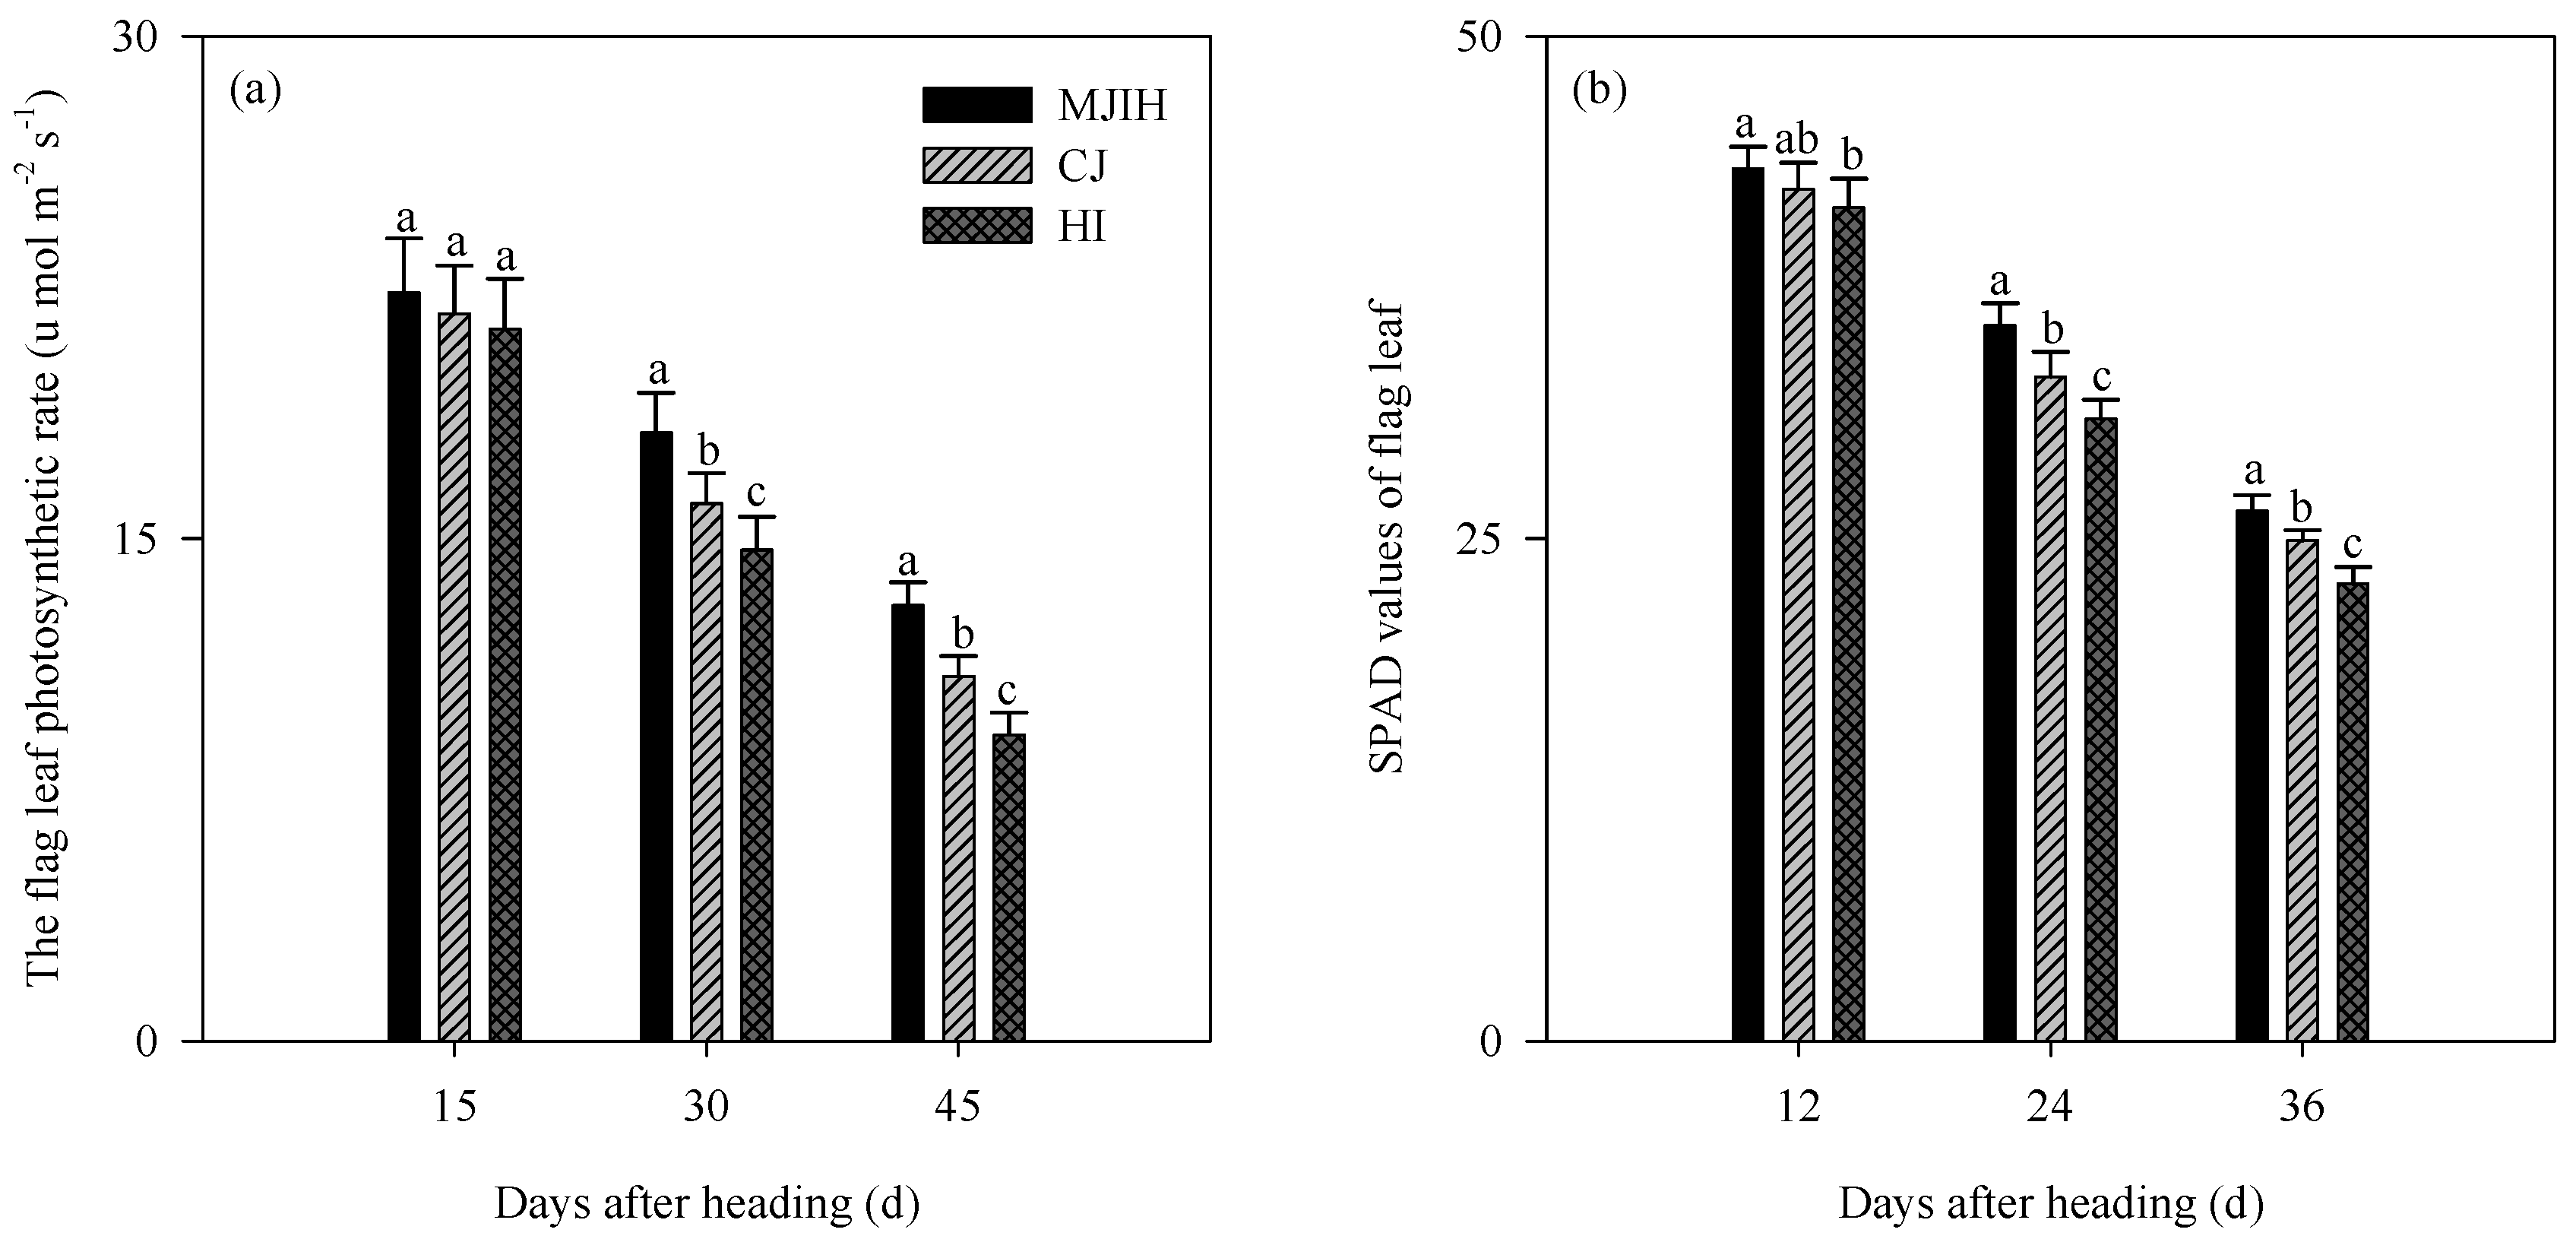
3.2. Shoot Biomass, LAI, LAD, Leaf Photosynthetic Rate, and SPAD Values

Compared with CJ and HI, EJIH exhibited higher (p < 0.05) shoot biomass weight at heading, as well as maturity. For example, shoot biomass at heading of EJIH was 13.8% and 29.1% higher than that of CJ and HI, respectively. EJIH also showed 15.3% and 25.8% more (p < 0.05) shoot biomass accumulation from heading to maturity than CJ and HI, respectively. The harvest index of CJ and HI was around 0.49, and both were higher (p < 0.05) than that of EJIH (Table 6).
Generally, EJIH showed 9.5% and 12.5% higher (p < 0.05) LAI at heading than CJ and HI, respectively, with similar results observed at maturity. EJIH had 35.4% and 55.6% higher LAD from heading to maturity, compared with CJ and HI, respectively (Table 7).
EJIH exhibited a higher (p < 0.05) flag leaf photosynthetic rate at both 30 and 45 DAH, relative to CJ and HI. Similarly, EJIH had higher SPAD values of flag leaf at 12 DAH than CJ and HI (p < 0.05). SPAD values for flag leaf at 24 and 36 DAH of EJIH were higher (p < 0.05) than that of CJ and HI (Figure 3).

3.3. Grain-Filling Dynamics and Simulated Equations

For EJIH, grains in the UP and US positions exhibited similar dynamics in the grain-filling process, which were different from grains in the other position. For CJ, grains in the UP, US, MP, and MS showed similar grain-filling dynamics and were different from grains in the LP and LS. For HI, grains in the six parts all showed similar grain-filling dynamics (Figure 4).
For EJIH, the grain-filling dynamics of grains in the LS position were well fitted by the logistic equation, while the Richards equation was used for grains in the other positions. For CJ and HI, the grain-filling processes of six parts in the panicle were all well simulated by the Richards equation (Table 8).

3.4. Grain–Filling Characteristics

For EJIH and CJ, GRmax and GRmean of grains in the UP were the highest, followed by MP, MS, US, LP, and LS, respectively. For HI, GRmax and GRmean of grains in the UP were the highest, followed by US, MP, MS, LP, and finally LS. For the three cultivar types, GRmax and GRmean of grains varied in the six parts, with a smaller difference in CJ and greater difference in HI. Dmax and EP also varied across grains in the six parts of each cultivar type, and the difference was smaller in CJ and greater in EJIH. Generally, EJIH exhibited lower (p < 0.05) GRmax and GRmean across grains in the six parts, while higher (p < 0.05) Dmax and EP, compared with CJ and HI (Table 9).
For the three cultivar types, early stage was the highest for the grain-filling characteristic ‘days’, followed by middle and then late stages; while GRmean and GFA of middle stage were the highest, followed by early and then late stages. Compared with CJ and HI, EJIH showed consistently higher (p < 0.05) days and GFA, but a lower (p < 0.05) GRmean during early, middle, and late stages. For example, GFA during early, middle, and late stages of EJIH was 21.4%, 39.6%, and 72.5% higher than that of HI, respectively (Table 10).

4. Discussion

It is acknowledged that japonica/indica hybrids display strong heterosis in terms of yield production [25]. However, the application of japonica/indica hybrids was extensively restricted by some constraints, such as long growth periods and grain-filling obstacles [26,27]. Recently, considerable strides have been achieved in solving such constraints and japonica/indica hybrids with an early maturity and high yield potential have become available in production, such as Yongyou 2640 in our study. Herein, EJIH exhibited a 12.2–18.8% higher (p < 0.05) grain yield than CJ and HI (Table 3), similar to prior results [12,13,15]. Considering the similar growth period among the three cultivar types, the yield advantage of EJIH over CJ and HI was mainly driven by their higher daily grain yield (Table 3). A similar growth pattern among the three cultivar types indicated a comparable amount of intercepted solar radiation during the growth period; nevertheless, EJIH had a better solar radiation use efficiency benefitting from the improved plant posture and capability of capturing light resources [28]. For rice, better solar radiation use efficiency is typically associated with greater biomass production and daily grain yield [29,30].
Analysis of yield components suggests that more spikelets per panicle contributed to the superior yield performance of EJIH over CJ and HI (Table 4). Although there is no specific definition of “panicle type”, rice cultivars with more than 200 spikelets per panicle are always considered as “large panicle type” [31,32]. In the present study, EJIH exhibited spikelets per panicle of more than 250, 58.0–87.8% more than CJ and HI; hence, EJIH could be regarded as an “extra-large panicle type”. Furthermore, compared with CJ and HI, the advantage that EJIH has in spikelets per panicle was detected in all six positions of the panicle, especially for US and MS (Table 5), implying that it was an effective way to promote panicle size from increasing grains positioned in the US and MS. In this study, EJIH had a similar filled-grain percentage relative to CJ and HI (Table 4) and did not exhibit the grain-filling barrier that has previously been found in japonica/indica hybrids [33,34]. From this, it can be deduced that progress has been made in developing japonica/indica hybrids with better grain-filling efficiency in China [8,25].
Compared with CJ and HI, EJIH had a higher shoot biomass weight at heading and maturity, and increased biomass accumulation after heading (Table 6). For EJIH, such an increased pre-heading biomass production benefitted larger sink size, while post-heading biomass production contributed to improved grain-filling efficiency [15,27]. This result was consistent with previous studies that report how high-yielding rice typically exhibits superior capacity of biomass production not only before heading, but also after heading [35,36]. In addition, LAI at heading and maturity, and leaf photosynthetic rate, SPAD values, and LAD during the ripening period were higher (p < 0.05) in EJIH relative to CJ and HI (Table 1, Figure 3). Our results suggest that the improved leaf photosynthetic capacity and canopy structure of EJIH promoted assimilates accumulation after heading, increased efficiency of grain filling, and, finally, a superior yield performance.
Generally, the Richards equation has been adopted to simulate grain-filling of rice, and the logistic equation for maize and wheat [18,19,20,37,38]. However, few studies are available on the grain-filling dynamics of cultivars with more than 250 spikelets per panicle. For CJ and HI, the Richards equation has been considered the best-fit for modeling the grain-filling dynamics of superior and inferior spikelets [18,19]; however, superior and inferior spikelets only occupy a small proportion of the panicle and do not comprehensively reflect the grain-filling characteristics of the whole panicle, particularly for large-panicle rice cultivars. In this study, the grains in the panicle were divided into six parts, based on their positions. For CJ and HI, the grain-filling dynamics of grains in the six parts were all well simulated by the Richards equation. For EJIH, the grain-filling dynamics of grains in the LS were well simulated by the logistics equation, and also the Richards equation for grains positioning on the other five parts (Table 8). Noteworthy, grains positioning on the LS were always selected as inferior spikelets in previous studies [18,19,20,39]. These results suggest that the grain-filling dynamics of grains located in the LS (e.g., inferior spikelets) of rice cultivars with the extra-large panicle type might be better fit by the logistic equation, rather than by the Richards equation.
Prior studies have reported that the grain-filling pattern of rice could be determined by the time difference of Dmax between superior and inferior spikelets [20,40]. Following such a classical classification method [40], CJ was sorted into synchronous grain-filling type, HI into asynchronous type, and EJIH into a more asynchronous type in our study (Table 9). Compared with CJ and HI, this more asynchronous grain-filling process was associated more with grains located in the six parts of EJIH with extra-large panicle type. Such a grain-filling pattern of EJIH could make for a more efficient and full utilization of the assimilates produced for filling grains, contributing to the improved filled-grain percentage of EJIH. The filling efficiency of grains positioned in the lower parts often resulted in a poor filled-grain percentage of large-panicle rice cultivars [17,41]. For EJIH, grains in the lower parts (LP and LS) had longer Dmax and EP, compared with grains in the upper and middle parts (Table 9). This result indicates that proper management practices should be adopted especially during the later grain-filling stage, a critical period for filling grains in the lower parts.
The differences in the grain-filling characteristics between CJ and HI have been studied and reported [21,22,23]. For example, Gong et al. [22] concluded that CJ had longer days but lower GRmean during the early, middle, and late stages relative to HI. To date, grain-filling characteristics of EJIH have received less attention, as have their differences to CJ and HI. In this study, EJIH exhibited consistently lower (p < 0.05) GRmax and GRmean, but higher (p < 0.05) Dmax and EP, compared with CJ and HI (Table 9). Furthermore, EJIH had more grains in the six parts and longer (p < 0.05) days, which helped increase GFA during early, middle, and late stages, though it lowered GRmean during these three stages (Table 10).

5. Conclusions

EJIH gained yield superiority over CJ and HI, mainly driven by higher daily grain yield. Great differences exist in panicle traits and grain-filling characteristics among EJIH, CJ, and HI, the three main cultivar types in rice production. EJIH exhibited more spikelets per panicle, increased single panicle weight, and increased number of grains in each of the six parts, with pronounced increases in the US and MS, compared with CJ and HI. CJ was classified as synchronous grain-filling type, HI as asynchronous type, and EJIH as more asynchronous type. Although lower GRmean during early, middle, and late stages, the days and number of grains positioned in the panicle of EJIH were higher, which together facilitated more GFA after heading, better grain-filling efficiency, and higher grain yield.

Author Contributions

The contributions of T.M. and H.W. were involved in designing and writing the original draft; X.C., J.G. and X.Z. carried out field experiment and sampling analysis; G.Z., Q.D. and H.W. analyzed the data and acquired funding. All authors have read and agreed to the published version of the manuscript.

Funding

This work was financed by the National Natural Science Foundation of China (31901448, 32001466), Joints Funds of the National Natural Science Foundation of China (U20A2022), and the Key Research and Development Program of Jiangsu Province (BE2019343).

Institutional Review Board Statement

Not applicable.

Informed Consent Statement

Not applicable.

Data Availability Statement

Not applicable.

Conflicts of Interest

The authors declare no conflict of interest.

References

  1. Dawe, D.; Frolking, S.; Li, C.S. Trends in rice-wheat area in China. Field Crop. Res. 2004, 87, 89–95. [Google Scholar] [CrossRef]
  2. Bai, H.Z.; Tao, F.L. Sustainable intensification options to improve yield potential and eco-efficiency for rice-wheat rotation system in China. Field Crop. Res. 2017, 211, 89–105. [Google Scholar] [CrossRef]
  3. Xing, Z.P.; Hu, Y.J.; Qian, H.J.; Cao, W.W.; Guo, B.W.; Wei, H.Y.; Xu, K.; Huo, Z.Y.; Zhou, G.S.; Dai, Q.G.; et al. Comparison of yield traits in rice among three mechanized planting methods in a rice-wheat rotation system. J. Integr. Agr. 2017, 16, 1451–1466. [Google Scholar] [CrossRef] [Green Version]
  4. Chen, Z.K.; Li, P.; Jiang, S.S.; Chen, H.Y.; Wang, J.P.; Cao, C.G. Evaluation of resource and energy utilization, environmental and economic benefits of rice water-saving irrigation technologies in a rice-wheat rotation system. Sci. Total Environ. 2021, 757, 143748. [Google Scholar] [CrossRef] [PubMed]
  5. Jat, R.K.; Sapkota, T.B.; Singh, R.G.; Jat, M.L.; Kumar, M.; Gupta, R.K. Seven years of conservation agriculture in a rice–wheat rotation of Eastern Gangetic Plains of South Asia: Yield trends and economic profitability. Field Crop. Res. 2014, 164, 199–210. [Google Scholar] [CrossRef]
  6. Bai, H.Z.; Tao, F.L.; Xiao, D.P.; Liu, F.S.; Zhang, H. Attribution of yield change for rice-wheat rotation system in China to climate change, cultivars and agronomic management in the past three decades. Clim. Chang. 2016, 135, 539–553. [Google Scholar] [CrossRef]
  7. Meng, T.Y.; Wei, H.H.; Li, X.Y.; Dai, Q.G.; Huo, Z.Y. A better root morpho-physiology after heading contributing to yield superiority of japonica/indica hybrid rice. Field Crop. Res. 2018, 228, 135–146. [Google Scholar] [CrossRef]
  8. Wei, H.H.; Meng, T.Y.; Li, C.; Xu, K.; Huo, Z.Y.; Wei, H.Y.; Guo, B.W.; Zhang, H.C.; Dai, Q.G. Comparisons of grain yield and nutrient accumulation and translocation in high-yielding japonica/indica hybrids, indica hybrids, and japonica conventional varieties. Field Crop. Res. 2017, 204, 101–109. [Google Scholar] [CrossRef]
  9. Hu, Y.J.; Zhu, D.W.; Qian, H.J.; Cao, W.W.; Xing, Z.P.; Zhang, H.C.; Zhou, Y.Y.; Chen, H.C.; Wang, H.Y.; Dai, Q.G.; et al. Some characteristics of mechanically transplanted pot seedlings in super high yielding population of indica-japonica hybrid rice Yongyou 2640. Acta Agron. Sin. 2014, 40, 2016–2027. (In Chinese) [Google Scholar] [CrossRef]
  10. Gu, J.F.; Chen, Y.; Zhang, H.; Li, Z.K.; Zhou, Q.; Yu, C.; Kong, X.S.; Liu, L.J.; Wang, Z.Q.; Yang, J.C. Canopy light and nitrogen distributions are related to grain yield and nitrogen use efficiency in rice. Field Crop. Res. 2017, 206, 74–85. [Google Scholar] [CrossRef]
  11. Hu, Y.J.; Wu, P.; Zhang, H.C.; Dai, Q.G.; Huo, Z.Y.; Xu, K.; Gao, H.; Wei, H.Y.; Guo, B.W.; Cui, P.Y. Comparison of agronomic performance between inter-sub-specific hybrid and inbred japonica rice under different mechanical transplanting methods. J. Integr. Agr. 2018, 17, 806–816. [Google Scholar] [CrossRef] [Green Version]
  12. Zhu, K.Y.; Zhou, Q.; Shen, Y.; Yan, J.Q.; Xu, Y.J.; Wang, Z.Q.; Yang, J.C. Agronomic and physiological performance of an indica–japonica rice variety with a high yield and high nitrogen use efficiency. Crop Sci. 2020, 60, 1556–1568. [Google Scholar] [CrossRef]
  13. Meng, T.Y.; Ge, J.L.; Zhang, X.B.; Wei, H.H.; Zhou, G.S.; Dai, Q.G. Phosphorus accumulation characteristics of medium-maturity Yongyou japonica/indica hybrid rice after transplanting and its modeling. Chin. J. Rice Sci. 2020, 34, 256–265. (In Chinese) [Google Scholar]
  14. Zhang, H.; Hou, D.P.; Peng, X.L.; Ma, B.J.; Shao, S.M.; Jing, W.J.; Gu, J.F.; Liu, L.J.; Wang, Z.Q.; Liu, Y.Y.; et al. Optimizing integrative cultivation management improves grain quality while increasing yield and nitrogen use efficiency in rice. J. Integr. Agr. 2019, 18, 2716–2731. [Google Scholar] [CrossRef]
  15. Wei, H.H.; Meng, T.Y.; Li, X.Y.; Dai, Q.G.; Zhang, H.C.; Yin, X.Y. Sink-source relationship during rice grain filling is associated with grain nitrogen concentration. Field Crop. Res. 2018, 215, 23–38. [Google Scholar] [CrossRef]
  16. Ali, F.; Waters, D.L.E.; Ovenden, B.; Bundock, P.; Raymond, C.A.; Rose, T.J. Australian rice varieties vary in grain yield response to heat stress during reproductive and grain filling stages. J. Agron. Crop Sci. 2019, 205, 179–187. [Google Scholar] [CrossRef]
  17. Okamura, M.; Arai-Sanoh, Y.; Yoshida, H.; Mukouyama, T.; Adachi, S.; Yabe, S.; Nakagawa, H.; Tsutsumi, K.; Taniguchi, Y.; Kobayashi, N.; et al. Characterization of high-yielding rice cultivars with different grain-filling properties to clarify limiting factors for improving grain yield. Field Crop. Res. 2018, 219, 139–147. [Google Scholar] [CrossRef]
  18. Chandra, T.; Mishra, S.; Panda, B.B.; Sahu, G.; Dash, S.K.; Shaw, B.P. Study of expressions of miRNAs in the spikelets based on their spatial location on panicle in rice cultivars provided insight into their influence on grain development. Plant Physiol. Bioch. 2021, 159, 244–256. [Google Scholar] [CrossRef]
  19. Zhang, Z.X.; Zhao, H.; Huang, F.L.; Long, J.F.; Song, G.; Lin, W.X. The 14-3-3 protein GF14f negatively affects grain filling of inferior spikelets of rice (Oryza sativa L.). Plant J. 2019, 99, 344–358. [Google Scholar]
  20. Jiang, Q.; Du, Y.L.; Tian, X.Y.; Wang, Q.S.; Xiong, R.H.; Xu, G.C.; Yan, C.; Ding, Y.F. Effect of panicle nitrogen on grain filling characteristics of high-yielding rice cultivars. Eur. J. Agron. 2016, 74, 185–192. [Google Scholar] [CrossRef]
  21. Fu, P.H.; Wang, J.; Zhang, Y.; Huang, J.L.; Peng, S.B. High nitrogen input causes poor grain filling of spikelets at the panicle base of super hybrid rice. Field Crop. Res. 2019, 244, 107635. [Google Scholar] [CrossRef]
  22. Gong, J.L.; Xing, Z.P.; Hu, Y.J.; Zhang, H.C.; Dai, Q.G.; Huo, Z.Y.; Xu, K.; Wei, H.Y.; Gao, H. Studies on the difference of yield components characteristics between indica and japonica super rice. J. Nuclear Agri. Sci. 2014, 28, 500–511. (In Chinese) [Google Scholar]
  23. You, C.C.; Chen, L.; He, H.B.; Wu, L.Q.; Wang, S.H.; Ding, Y.F.; Ma, C.X. iTRAQ-based proteome profile analysis of superior and inferior spikelets at early grain filling stage in japonica rice. BMC Plant Biol. 2017, 17, 100. [Google Scholar] [CrossRef] [PubMed] [Green Version]
  24. Jiang, Y.H.; Zhang, H.C.; Zhao, K.; Xu, J.W.; Wei, H.H.; Long, H.Y.; Wang, W.T.; Dai, Q.G.; Huo, Z.Y.; Xu, K.; et al. Difference in yield and its components characteristics of different type rice cultivars in the lower reaches of the Yangtze river. Chin. J. Rice Sci. 2014, 28, 621–631. (In Chinese) [Google Scholar]
  25. Zhang, G.Q. Prospects of utilization of inter-subspecific heterosis between indica and japonica rice. J. Integr. Agr. 2020, 19, 1–10. [Google Scholar] [CrossRef]
  26. Panigrahi, R.; Kariali, E.; Panda, B.B.; Lafarge, T.; Mohapatra, P.K. Controlling the trade-off between spikelet number and grain filling: The hierarchy of starch synthesis in spikelets of rice panicle in relation to hormone dynamics. Funct. Plant Biol. 2019, 46, 507–523. [Google Scholar] [CrossRef] [PubMed]
  27. Meng, T.Y.; Wei, H.H.; Li, C.; Dai, Q.G.; Xu, K.; Huo, Z.Y.; Wei, H.Y.; Guo, B.W.; Zhang, H.C. Morphological and physiological traits of large-panicle rice varieties with high filled-grain percentage. J. Integr. Agr. 2016, 15, 1751–1762. [Google Scholar] [CrossRef] [Green Version]
  28. Yin, M.; Liu, S.W.; Zheng, X.; Chu, G.; Xu, C.M.; Zhang, X.F.; Wang, D.Y.; Chen, S. Solar radiation-use characteristics of indica/japonica hybrid rice (Oryza sativa L.) in the late season in southeast China. Crop J. 2021, 9, 427–439. [Google Scholar] [CrossRef]
  29. Furbank, R.T.; Jimenez-Berni, J.A.; Gerorge-Jaeggli, B.; Potgieter, A.B.; Deery, D.M. Field crop phenomics: Enabling breeding for radiation use efficiency and biomass in cereal crops. New Phytol. 2019, 223, 1714–1727. [Google Scholar] [CrossRef] [Green Version]
  30. Hubbart, S.; Smillie, I.R.A.; Heatley, M.; Swarup, R.; Foo, C.C.; Zhao, L.; Murchie, E.H. Enhanced thylakoid photoprotection can increase yield and canopy radiation use efficiency in rice. Commun. Biol. 2018, 1, 22. [Google Scholar] [CrossRef] [Green Version]
  31. Deng, Y.; Yu, Y.C.; Hu, Y.X.; Ma, L.; Lin, Y.; Wu, Y.; Wang, Z.; Wang, Z.T.; Bai, J.Q.; Ding, Y.F.; et al. Auxin-mediated regulation of dorsal vascular cell development may be responsible for sucrose phloem unloading in large panicle rice. Front. Plant Sci. 2021, 12, 630997. [Google Scholar] [CrossRef] [PubMed]
  32. Nakano, H.; Morita, S.; Kitagawa, H.; Wada, H.; Takahashi, M. Grain yield response to planting density in forage rice with a large number of spikelets. Crop Sci. 2012, 52, 345–350. [Google Scholar] [CrossRef]
  33. Sekhar, S.; Kumar, J.; Mohanty, S.; Mohanty, N.; Panda, R.S.; Das, S.; Shaw, B.P.; Behera, L. Identification of novel QTLs for grain fertility and associated traits to decipher poor grain filling of basal spikelets in dense panicle rice. Sci. Rep.-UK. 2021, 11, 13617. [Google Scholar] [CrossRef] [PubMed]
  34. Jiang, Z.R.; Chen, Q.L.; Chen, L.; Yang, H.Y.; Zhu, M.C.; Ding, Y.F.; Li, W.W.; Liu, Z.H.; Jiang, Y.; Li, G.H. Efficiency of sucrose to starch metabolism is related to the initiation of inferior grain filling in large panicle rice. Front. Plant Sci. 2021, 12, 732867. [Google Scholar] [CrossRef] [PubMed]
  35. Marcaida, M., III; Li, T.; Angeles, O.; Evangelista, G.K.; Fontanilla, M.A.; Xu, J.L.; Gao, Y.M.; Li, Z.K.; Ali, J. Biomass accumulation and partitioning of newly developed Green Super Rice (GSR) cultivars under drought stress during the reproductive stage. Field Crop. Res. 2014, 162, 30–38. [Google Scholar] [CrossRef]
  36. Katsura, K.; Okami, M.; Mizunuma, H.; Kato, Y. Radiation use efficiency, N accumulation and biomass production of high-yielding rice in aerobic culture. Field Crop. Res. 2010, 117, 81–89. [Google Scholar] [CrossRef] [Green Version]
  37. Borrás, L.; Zinselmeier, C.; Senior, M.L.; Westgate, M.E.; Muszynski, M.G. Characterization of grain-filling patterns in diverse maize germplasm. Crop Sci. 2009, 49, 999–1009. [Google Scholar] [CrossRef]
  38. Yan, S.C.; Wu, Y.; Fan, J.L.; Zhang, F.C.; Qiang, S.C.; Zheng, J.; Xiang, Y.Z.; Guo, J.J.; Zou, H.Y. Effects of water and fertilizer management on grain filling characteristics, grain weight and productivity of drip-fertigated winter wheat. Agr. Water Manag. 2019, 213, 983–995. [Google Scholar] [CrossRef]
  39. Wang, G.Q.; Li, H.X.; Feng, L.; Chen, M.X.; Meng, S.; Ye, N.H.; Zhang, J.H. Transcriptomic analysis of grain filling in rice inferior grains under moderate soil drying. J. Exp. Bot. 2019, 70, 1597–1611. [Google Scholar] [CrossRef] [Green Version]
  40. Gu, S.L.; Zhu, Q.S.; Yang, J.C.; Peng, S.B. Analysis on grain filling characteristics for different rice types. Acta Agron. Sin. 2001, 27, 7–14. (In Chinese) [Google Scholar]
  41. Kobata, T.; Nagano, T.; Ida, K. Critical factors for grain filling in low grain-ripening rice cultivars. Agron. J. 2006, 98, 536–544. [Google Scholar] [CrossRef]
Figure 1. Location of the experimental site.
Agriculture 11 01165 g001
Figure 2. Mean temperature (a), sunshine hours (b), and rainfall (c) during the rice growing periods for two years.
Agriculture 11 01165 g002
Figure 3. The leaf photosynthetic rate (a) and SPAD values of flag leaf (b) of rice cultivars. EJIH, early-maturing japonica/indica hybrids; CJ, conventional japonica rice; HI, hybrid indica rice. Means followed by different letters within a growth period are significantly different at the 5% probability level. Vertical bars represent the mean (n = 3) ± standard deviation.
Agriculture 11 01165 g003
Figure 4. Dynamics in grain-filling process of rice cultivars. UP, upper primary branches; US, upper secondary branches; MP, middle primary branches; MS, middle secondary branches; LP, lower primary branches; LS, lower secondary branches.
Agriculture 11 01165 g004
Table 1. The detailed information on the year of release, cross information, and growth period of rice cultivars.
Cultivar TypeCultivarYear of ReleaseCross InformationDuration from Heading to Maturity (d)Total Growth Period (d)
EJIHYongyou 26402013Yongxian 26A × F 754068153
Yongyou 16402013Yongxian 16A × F 754067152
CJYangjing 42272009Yangjing 7057 × Huangye 952054149
Zhendao 142011Zhendao 88 × Wuyujing 3/Wu 99-856151
HIFengyou 2932007Nongfeng A × YR 92352150
Zhongnanyou 12011Zhongnan 1A × Zhonglianhui 51051151
EJIH, early-maturing japonica/indica hybrids; CJ, conventional japonica rice; HI, hybrid indica rice. The information on the year of release and cross information of rice cultivars is available from the website http://www.ricedata.cn (accessed on: 20 May 2021). The growth period of rice cultivars are recorded in this study.
Table 2. Analysis of variance (ANOVA) of grain yield and the related morphological traits among year, cultivar, and the interaction.
SourcedfGrain YieldSpikelets per PaniclePanicle LengthSingle Panicle WeightShoot Biomass WeightLeaf Area IndexLeaf Photosynthetic RateSPAD Values
HeadingMaturityHeadingMaturity
Year1nsnsnsnsnsnsnsnsnsns
Cultivar5*****************
Year × Cultivar5nsnsns*nsns*nsnsns
Total35
ns, non-significance, *, and **, significant at 0.05 and 0.01 probability levels, respectively.
Table 3. Grain yield and daily grain yield of rice cultivars.
Cultivar TypeCultivarGrain Yield
(t ha−1)
Daily Grain Yield
(kg ha−1 d−1)
EJIHYongyou 264012.179.1
Yongyou 164011.978.3
Mean12.0 a78.7 a
CJYangjing 422710.671.1
Zhendao 1410.871.5
Mean10.7 b71.3 b
HIFengyou 29310.268.0
Zhongnanyou 110.066.2
Mean10.1 c67.1 b
EJIH, early-maturing japonica/indica hybrids; CJ, conventional japonica rice; HI, hybrid indica rice. Daily grain yield =   Grain   yield Total   growth   period . Means followed by different letters within a column are significantly different at the 5% probability level.
Table 4. Grain yield components of rice cultivars.
Cultivar TypeCultivarPanicles per m2Spikelets per PanicleSpikelets per m2 (×103)Filled-Grain Percentage (%)Grain Weight (mg)
EJIHYongyou 264021627459.288.824.3
Yongyou 164020828258.787.424.9
Mean212 c278 a58.9 a88.1 a 24.6 b
CJYangjing 422731514445.490.228.3
Zhendao 1430915146.789.927.9
Mean312 a 148 c46.0 b90.1 a28.1 a
HIFengyou 29324717342.790.128.1
Zhongnanyou 123717942.490.227.5
Mean242 b176 b42.6 c90.2 a27.8 a
EJIH, early-maturing japonica/indica hybrids; CJ, conventional japonica rice; HI, hybrid indica rice. Means followed by different letters within a column are significantly different at the 5% probability level.
Table 5. Panicle traits of rice cultivars.
Cultivar TypeCultivarPL (cm)SPW (g)NGUPNGUSNGMPNGMSNGLPNGLS
EJIHYongyou 264022.26.128.090.126.075.726.427.7
Yongyou 164020.96.033.471.837.375.234.230.0
Mean21.6 b6.1 a30.7 a81.0 a31.6 a75.5 a30.3 a28.9 a
CJYangjing 422716.43.623.313.023.633.423.627.0
Zhendao 1417.33.624.813.826.838.723.923.1
Mean16.9 c3.6 c24.1 b13.4 c25.2 b36.0 c23.8 b25.0 b
HIFengyou 29324.44.719.237.120.450.321.424.6
Zhongnanyou 124.74.517.145.319.050.319.228.0
Mean24.6 a4.6 b18.1 c41.2 b19.7 c50.3 b20.3 b26.3 ab
EJIH, early-maturing japonica/indica hybrids; CJ, conventional japonica rice; HI, hybrid indica rice. PL, panicle length; SPW, single panicle weight; NGUP, number of grains on the upper primary branches; NGUS, number of grains on the upper secondary branches; NGMP, number of grains on the middle primary branches; NGMS, number of grains on the middle secondary branches; NGLP, number of grains on the lower primary branches; NGLS, number of grains on the lower secondary branches. Means followed by different letters within a column are significantly different at the 5% probability level.
Table 6. Shoot biomass weight and accumulation, and harvest index of rice cultivars.
Cultivar TypeCultivarShoot Biomass Weight
(t ha−1)
Shoot Biomass Accumulation from Heading to Maturity (t ha−1)Harvest Index
HeadingMaturity
EJIHYongyou 264013.521.98.40.476
Yongyou 164013.021.28.20.482
Mean13.2 a21.5 a8.3 a0.479 b
CJYangjing 422711.518.67.10.491
Zhendao 1411.819.17.30.486
Mean11.6 b18.8 b7.2 b0.489 a
HIFengyou 29311.117.76.60.496
Zhongnanyou 111.017.56.50.492
Mean11.0 c17.6 c6.6 c0.494 a
EJIH, early-maturing japonica/indica hybrids; CJ, conventional japonica rice; HI, hybrid indica rice. Means followed by different letters within a column are significantly different at the 5% probability level.
Table 7. LAI and LAD after heading of rice cultivars.
Cultivar TypeCultivarLAI (m2 m−2)LAD from Heading to Maturity
(m2 d m−2)
HeadingMaturity
EJIHYongyou 26408.23.2388
Yongyou 16407.93.1369
Mean8.1 a3.2 a378 a
CJYangjing 42277.32.7270
Zhendao 147.52.8288
Mean7.4 b2.8 b279 b
HIFengyou 2937.32.2247
Zhongnanyou 17.12.3240
Mean7.2 b2.3 c243 c
EJIH, early-maturing japonica/indica hybrids; CJ, conventional japonica rice; HI, hybrid indica rice. LAI, leaf area index; LAD, leaf area duration. LAD from heading to maturity =   ( LAI   at   heading + LAI   at   maturity ) ×   Duration   from   heading   to   maturity 2 . Means followed by different letters within a column are significantly different at the 5% probability level.
Table 8. Simulated equations of the grain-filling dynamics of rice cultivars.
Cultivar TypeCultivarGrain PositionSimulated Equation
EJIHYongyou 2640UPY = 21.3 ( 1 + 4215 e 0.37 X ) 1 2.80 R2 = 0.99
USY = 18.5 ( 1 + 11967 e 0.26 X ) 1 3.23 R2 = 0.99
MPY = 20.2 ( 1 + 2942 e 0.30 X ) 1 2.31 R2 = 0.99
MSY = 17.9 ( 1 + 11622 e 0.25 X ) 1 2.03 R2 = 0.98
LPY = 16.9 ( 1 + 11238 e 0.23 X ) 1 2.03 R2 = 0.98
LSY = 19.8 ( 1 + 102 e 0.10 X ) 1 R2 = 0.99
Yongyou 1640UPY = 21.9 ( 1 + 3348 e 0.34 X ) 1 2.90 R2 = 0.99
USY = 19.2 ( 1 + 11622 e 0.25 X ) 1 3.12 R2 = 0.99
MPY = 20.8 ( 1 + 6473 e 0.32 X ) 1 2.80 R2 = 0.99
MSY = 18.8 ( 1 + 11238 e 0.23 X ) 1 1.81 R2 = 0.98
LPY = 17.3 ( 1 + 11238 e 0.23 X ) 1 1.82 R2 = 0.98
LSY = 21.9 ( 1 + 92 e 0.09 X ) 1 R2 = 0.99
CJYangjing 4227UPY = 24.5 ( 1 + 2464 e 0.31 X ) 1 4.16 R2 = 0.98
USY = 23.1 ( 1 + 3991 e 0.29 X ) 1 3.10 R2 = 0.99
MPY = 24.4 ( 1 + 2292 e 0.30 X ) 1 2.81 R2 = 0.99
MSY = 21.6 ( 1 + 10579 e 0.29 X ) 1 3.15 R2 = 0.98
LPY = 21.3 ( 1 + 12351 e 0.28 X ) 1 2.30 R2 = 0.99
LSY = 19.2 ( 1 + 12169 e 0.27 X ) 1 1.60 R2 = 0.98
Zhendao 14UPY = 25.4 ( 1 + 2530 e 0.31 X ) 1 4.10 R2 = 0.98
USY = 23.8 ( 1 + 4266 e 0.29 X ) 1 3.15 R2 = 0.98
MPY = 25.1 ( 1 + 2399 e 0.30 X ) 1 2.80 R2 = 0.99
MSY = 22.3 ( 1 + 12107 e 0.29 X ) 1 3.18 R2 = 0.99
LPY = 21.8 ( 1 + 12169 e 0.27 X ) 1 2.36 R2 = 0.99
LSY = 19.8 ( 1 + 12351 e 0.28 X ) 1 1.65 R2 = 0.99
HIFengyou 293UPY = 24.5 ( 1 + 8259 e 0.54 X ) 1 3.61 R2 = 0.98
USY = 22.5 ( 1 + 5972 e 0.47 X ) 1 2.25 R2 = 0.99
MPY = 23.9 ( 1 + 7951 e 0.46 X ) 1 3.01 R2 = 0.98
MSY = 23.3 ( 1 + 3461 e 0.29 X ) 1 2.86 R2 = 0.99
LPY = 21.4 ( 1 + 9921 e 0.29 X ) 1 3.23 R2 = 0.98
LSY = 18.7 ( 1 + 5000 e 0.30 X ) 1 2.25 R2 = 0.98
Zhongnanyou 1UPY = 24.8 ( 1 + 8259 e 0.54 X ) 1 3.61 R2 = 0.98
USY = 22.8 ( 1 + 4904 e 0.46 X ) 1 2.25 R2 = 0.98
MPY = 24.2 ( 1 + 9442 e 0.47 X ) 1 3.12 R2 = 0.98
MSY = 23.5 ( 1 + 4251 e 0.30 X ) 1 2.99 R2 = 0.99
LPY = 21.4 ( 1 + 11662 e 0.30 X ) 1 3.34 R2 = 0.98
LSY = 19.4 ( 1 + 7553 e 0.29 X ) 1 2.66 R2 = 0.99
EJIH, early-maturing japonica/indica hybrids; CJ, conventional japonica rice; HI, hybrid indica rice. UP, upper primary branches; US, upper secondary branches; MP, middle primary branches; MS, middle secondary branches; LP, lower primary branches; LS, lower secondary branches. R2 represents the coefficient of determination for the fitting equation.
Table 9. Some parameters of the grain-filling process of rice cultivars.
Cultivar TypeCultivarGrain PositionGRmax (mg Grain−1 d−1)GRmean (mg Grain−1 d−1)Dmax (d)EP (d)
EJIHYongyou 2640UP1.320.8419.331.4
US0.750.4730.547.5
MP1.100.7123.538.7
MS0.860.5634.052.1
LP0.750.4936.956.6
LS0.500.2146.091.6
Yongyou 1640UP1.210.7720.433.7
US0.760.4832.150.0
MP1.080.6924.238.5
MS0.880.5737.156.6
LP0.800.5237.657.4
LS0.500.2248.998.5
Mean0.88 c0.54 c32.6 a54.4 a
CJYangjing 4227UP1.210.7720.234.8
US1.070.6924.239.8
MP1.110.7322.037.1
MS1.050.6727.943.8
LP1.010.6230.647.1
LS0.960.6032.649.4
Zhendao 14UP1.260.8020.334.9
US1.070.6824.439.9
MP1.170.7621.836.7
MS1.060.6827.643.1
LP1.050.6531.047.7
LS1.010.6431.547.7
Mean1.09 b0.70 b26.2 b41.8 b
HIFengyou 293UP1.961.2614.122.5
US1.901.1916.426.0
MP1.751.1116.826.6
MS1.120.7123.739.1
LP1.020.6627.443.0
LS0.950.6025.640.9
Zhongnanyou 1UP1.931.2514.122.5
US1.931.2116.426.2
MP1.761.1116.926.6
MS1.130.7123.838.9
LP0.950.6027.142.4
LS0.950.6027.242.9
Mean1.45 a0.92 a20.8 c33.1 c
EJIH, early-maturing japonica/indica hybrids; CJ, conventional japonica rice; HI, hybrid indica rice. UP, upper primary branches; US, upper secondary branches; MP, middle primary branches; MS, middle secondary branches; LP, lower primary branches; LS, lower secondary branches. GRmax, maximum grain-filling rate; GRmean, mean grain-filling rate; Dmax, days achieving the maximum grain-filling rate; EP, effective grain-filling period. Means followed by different letters within a column are significantly different at the 5% probability level.
Table 10. Grain-filling characteristics during early, middle, and late stages of rice cultivars.
Cultivar TypeCultivarGrain
Position
Early StageMiddle StageLate Stage
Days (d)GRmean
(mg Grain−1 d−1)
GFA
(mg)
Days (d)GRmean
(mg Grain−1 d−1)
GFA
(mg)
Days (d)GRmean
(mg Grain−1 d−1)
GFA
(mg)
EJIHYongyou
2640
UP14.70.522189.11.172997.50.2962
US23.80.3065613.40.6680810.30.15146
MP18.20.3617510.70.972749.70.2666
MS27.80.1942112.40.7672111.80.21193
LP30.20.1713913.50.6623812.90.1864
LS32.90.1211626.10.4331832.50.15138
Yongyou
1640
UP15.30.5327310.11.073648.20.2672
US25.10.2953513.90.6767610.90.16126
MP18.80.4028410.70.963898.90.2480
MS30.60.1741312.90.7876413.00.22223
LP31.00.1617313.10.7132013.20.2093
LS34.60.1313928.40.4438035.40.15165
Mean25.2 a0.28 b295 a14.6 a0.77 b462 a14.6 a0.20 b119 a
CJYangjing
4227
UP14.10.7625212.30.892598.30.1837
US18.20.4811612.00.931479.50.2228
MP16.30.5421211.31.072899.30.2659
MS21.80.3828012.30.853519.60.2065
LP24.80.2816711.60.9526210.50.2564
LS27.20.1914210.70.9828611.30.2992
Zhendao
14
UP14.20.7827612.30.932878.30.1941
US18.30.5012712.10.951609.40.2230
MP16.20.5624611.11.123379.20.2769
MS21.60.4033712.00.904219.30.2177
LP25.10.2917511.90.9427010.70.2564
LS26.20.2112810.51.0325210.90.3179
Mean20.3 b0.45 a205 c11.7 b0.96 ab277 c9.8 b0.24 b59 b
HIFengyou
293
UP10.70.941956.81.692224.90.3836
US13.00.562736.71.734366.10.46108
MP13.00.691857.51.552406.00.3746
MS17.90.4843411.60.995839.50.24118
LP21.20.3918012.30.842229.40.1940
LS20.20.3015110.80.902419.90.2460
Zhongnanyou 1UP10.70.951766.81.712004.90.3833
US12.90.573386.91.715396.30.46133
MP13.10.711787.51.562255.90.3742
MS18.00.4944811.51.005849.20.24114
LP21.10.4016412.10.841989.20.1935
LS21.40.3219411.60.842759.80.2159
Mean16.1 c0.57 a243 b9.3 b1.28 a331 b7.6 b0.31 a69 b
EJIH, early-maturing japonica/indica hybrids; CJ, conventional japonica rice; HI, hybrid indica rice. UP, upper primary branches; US, upper secondary branches; MP, middle primary branches; MS, middle secondary branches; LP, lower primary branches; LS, lower secondary branches. GRmean, mean grain-filling rate; GFA, grain filling amount. GFA of the specific grain position = Days × GRmean × number of grains in the specific grain position. Means followed by different letters within a column are significantly different at the 5% probability level.
Publisher’s Note: MDPI stays neutral with regard to jurisdictional claims in published maps and institutional affiliations.

