Article

Biochar Reduces the Adverse Effect of Saline Water on Soil Properties and Wheat Production Profitability

1
Agriculture Research Center, Soils, Water and Environment Research Institute, Giza 12112, Egypt
2
Agricultural Research Center (ARC), Agricultural Genetic Engineering Research Institute (AGERI), 9 Gamma Street, Giza 12619, Egypt
3
Agricultural Research Center, Wheat Research Department, Field Crops Research Institute, Giza 12619, Egypt
4
Department of Agricultural Sciences, Paul Engler College of Agriculture and Natural Sciences, West Texas A & M University, Canyon, TX 79016, USA
5
Department of Civil and Environmental Engineering, Utah State University, Logan, UT 84322, USA
6
Faculty of Agriculture, Benha University, Benha 13511, Egypt
7
Alabama Water Institute, The University of Alabama, Tuscaloosa, AL 35487, USA
*
Author to whom correspondence should be addressed.
Agriculture 2021, 11(11), 1112; https://doi.org/10.3390/agriculture11111112
Submission received: 2 October 2021 / Revised: 4 November 2021 / Accepted: 4 November 2021 / Published: 9 November 2021

Abstract

:
The goal of this study is to assess the use of saline groundwater in combination with soil amendments to increase the efficiency of wheat production in new agricultural soil in Egypt. The experiment was conducted during the two consecutive growing seasons, 2019/2020 and 2020/2021, at the Shandaweel Agricultural Research Station, Sohag, Egypt. In this study, plants of Shandaweel 1 spring bread wheat cultivar were grown under the combinations of the two water treatments, i.e., freshwater (307.2 ppm) and saline water (3000 ppm (NaCl + MgCl2)) representing groundwater in Egypt delivered by drip irrigation and the two biochar rates, i.e., zero and 4.8 ton/ha as a soil amendment. The cob corn biochar (CCB) was synthesized by using the slow pyrolysis process (one hour at 350 °C). The results revealed that saline water reduced the grain yield ratio by 8.5%, 11.0%, and 9.7% compared to non-saline water during seasons 2019/2020 and 2020/2021 and over seasons, respectively. Concerning, combined over seasons, the biochar addition enhanced the grain yield by 5.6% and 13.8% compared to non-biochar addition under fresh and saline irrigation water conditions, respectively. Thus, the results indicated and led to a preliminary recommendation that saline groundwater is a viable source of irrigation water and that biochar seemed to alleviate salinity stress on wheat production and in reclaimed soils of Egypt.

1. Introduction

In arid and semi-arid ecosystems, water scarcity is becoming a worldwide problem of increasing severity [1]. To overcome this shortage, lower-quality water, such as saline water, is widely used. However, using saline water causes a number of negative consequences such as increased soil salinity and chemical toxicity and a range of adverse chemical, physical, and biological effects on the soil as well plant properties. These effects are primarily due to salt accumulation in the root area that generally causes an increase in soil salinity [2]. The extreme salt quantities, mainly in the form of sodium, have a negative impact on soil properties that affect agricultural production sustainability. Irrigation with saline water accelerates the soil salinization process, significantly degrading the quality of agricultural soil in various ways and causing physicochemical deterioration of the soil [3].
Approaches for crop management when using saline irrigation water involve one or more of the following methods: (i) selection of saline tolerance crops, (ii) planting procedure, (iii) irrigation system type, (iv) land preparation, (v) leaching process, and (vi) special treatment such as soil amendments [4]. Methods may be used individually or in combination to enhance soil and/or plant properties.
The irrigation method affects the irrigation water depth leaching fraction, zones of salt accumulation, runoff, and uniformity of irrigation water application. Thus, using different irrigation methods such as surface, drip, or sprinkler irrigation may be designed to minimize the effect of salinity stress. Drip irrigation can reduce the effects of salinity by maintaining continuously moist soil around plant roots and providing steady leaching of salts to the edge of the wetted area [3].
Recently, it has been determined that specific materials, such as soil amendments, can be used to reduce the negative effects of salinity on soil and plant properties. Organic soil amendments such as compost or biochar improve the physical, chemical, and biological properties of soils under saline conditions. In recent years, the application of biochar to soil has emerged as a strategy for improving soil quality [5]. A large number of peer-reviewed studies strongly suggest that the application of biochar on saline soils can play a significant part in enhancing: (1) the amount of soil organic carbon (SOC) [6], (2) water-holding capacity (WHC) [7], (3) soil aeration, (4) soil base saturation, (5) nutrient retention and availability, (6) fertilizer and nutrient retention [8], (7) stimulation of soil microbes and microbial biomass and activity [9], (8) crop growth and yield, (9) the reduction in anthropogenic GHG fluxes, and (10) carbon sequestration [10]. Carbon sequestration improves soil quality and facilitates the sustainable use of natural resources [11].
Moreover, applying biochar to the soil is motivated by its ability to improve crop production due to its effect on soil properties such as the soil’s water-holding capacity, pH, cation exchange capacity (CEC), nutrient retention, and organic carbon [12]. However, some studies reported a negative effect on plant growth by the addition of biochar, especially at the highest level of biochar application [13].
It is clear from the existing literature that the selection and application of appropriate combinations of irrigation systems and soil amendments will ameliorate the soil and plant characteristics under salinity conditions. Given the potential use of saline irrigation water under these controlled conditions, the objectives of this study were to (i) investigate the effect of biochar on reducing the negative impact of using saline water as an alternative water resource on soil and plant properties. (ii) Evaluate saline water productivity and economic impact on wheat production in Egypt. The practical implications of the research are also summarized in the results.

2. Materials and Methods

2.1. Saline Water and Irrigation System

Synthetic irrigation water with a concentration of 3000 ppm (NaCl + MgCl2) salinity has been used in the experiments. A drip irrigation system delivered the water at an application rate of 2.2 L/h. The total amount of water added during the study was tracked in order to estimate water productivity. During the growth season, each treatment was irrigated twice a week with a total amount of 553.4 mm/ha. The following equation has been used to evaluate the water productivity in this experiment [14].
WP (kg/m3) = Output (kg/ha)/Water Applied (m3/ha)

2.2. Biochar Synthesis

Corn cob material is considered a common agricultural waste in Egypt. In this study, this material has been collected from the Experimental Farm of Shandaweel Agricultural Research Station. After washing, the corn cob samples were kept under direct sunlight for a week to reduce the moisture. Then, the samples were ground to a particulate size material using a standard commercial blender. The slow pyrolysis process of corn cob material has been carried out to produce biochar in an electrical furnace maintained at 350 °C under a nitrogen flow rate of 0.5 L/min. Following best practices, the process was continued up to 1 h after the highest temperature was reached [15]. The biochar that remained in the reactor was collected after the process and ground into small particulates before use. The pH, EC, WHC, elemental composition, and FT-IR spectra were used to measure and document biochar properties.

2.3. Experiment Design

The experiment was performed in Lysimeters at the Experimental Farm of Shandaweel Agricultural Research Station, Agricultural Research Center (ARC), Sohag, Egypt, (31°42′ E, 26°33′ N, and 61 m altitude) during the two consecutive growing seasons of 2019/2020 and 2020/2021 with the overall goal to study the effect of salinity stress on yield and its components of wheat. A complementary goal was to assess the role of biochar and its integration with drip irrigation in alleviating the deleterious effect of saline water stress on soil and plant properties. The data of maximum and minimum temperature, relative humidity, and wind speed were obtained from “The Central Laboratory of Meteorology”, which is related to the Ministry of Agriculture (Table 1).
There was no rainfall that could be taken into consideration through the two seasons. Lysimeters (2.0 m × 1.0 m × 1.6 m) were filled with sandy soil (87.6% sand, 8.2% silt, and 4.2% clay) with specifications to mimic reclaimed soil. The combinations of the two water treatments, i.e., freshwater (307.2 ppm) and saline water (3000 ppm), and the two biochar rates, i.e., zero and 4.8 ton/ha, were used in this study. The experiment followed randomized complete block design (RCBD) with three replications. All the required agronomic practices were followed uniformly in all plots throughout the growing period. Recommended doses of NPK fertilizers were applied according to the recommendations of the Ministry of Agriculture and Land Reclamation, Egypt. The soil surface was leveled, and mineral fertilizers were applied at the rate of 286 kg N/ha in the form of urea, 71.5 kg P2O5/ha, and 57 kg K2O/ha. The experiment combinations of water and biochar treatments were freshwater without biochar (FW-biochar), freshwater with biochar (FW+biochar), saline water without biochar (SW-biochar), and saline water with biochar (SW+biochar). The wheat cultivar (Shandaweel 1 spring bread) was planted on the same day in both seasons on 29 November. During the two seasons of study, the following data were recorded: physiological properties, including Leaf Area Index (LAI), Relative Water Content (RWC) according to Pask et al. (2012) [16], and Membrane Stability Index (MSI) according to Sairam et al. (1997) [17], as well as plant height (PH, cm), number of spikes/m2 (NS/m2), number of kernels/spike (NK/S), 1000-kernel weight (1000 KW, g), biological yield (BY, ton/ha) and grain yield (GY, ton/ha) were determined [18] at harvest time.
Furthermore, to determine the effect of salinity stress on soil chemical properties under different experimental conditions, soil samples (0–30 cm depth) were taken after soil preparation and before fertilization and after 70 days from biochar addition and harvest time representing all the treatments from the experimental site. The samples were air-dried and passed through 2 mm sieve pores. Analysis of soil samples was carried out to determine some soil properties such as EC, pH, and major cations and anions [19].

2.4. Statistical Methods

Data were statistically analyzed with the MSTAT 5.4 program according to Gomez and Gomez (1984) [20]. The least significant difference (LSD) test at 5% level of significance was used to compare means according to Waller and Duncan (1969) [21].

3. Results and Discussion

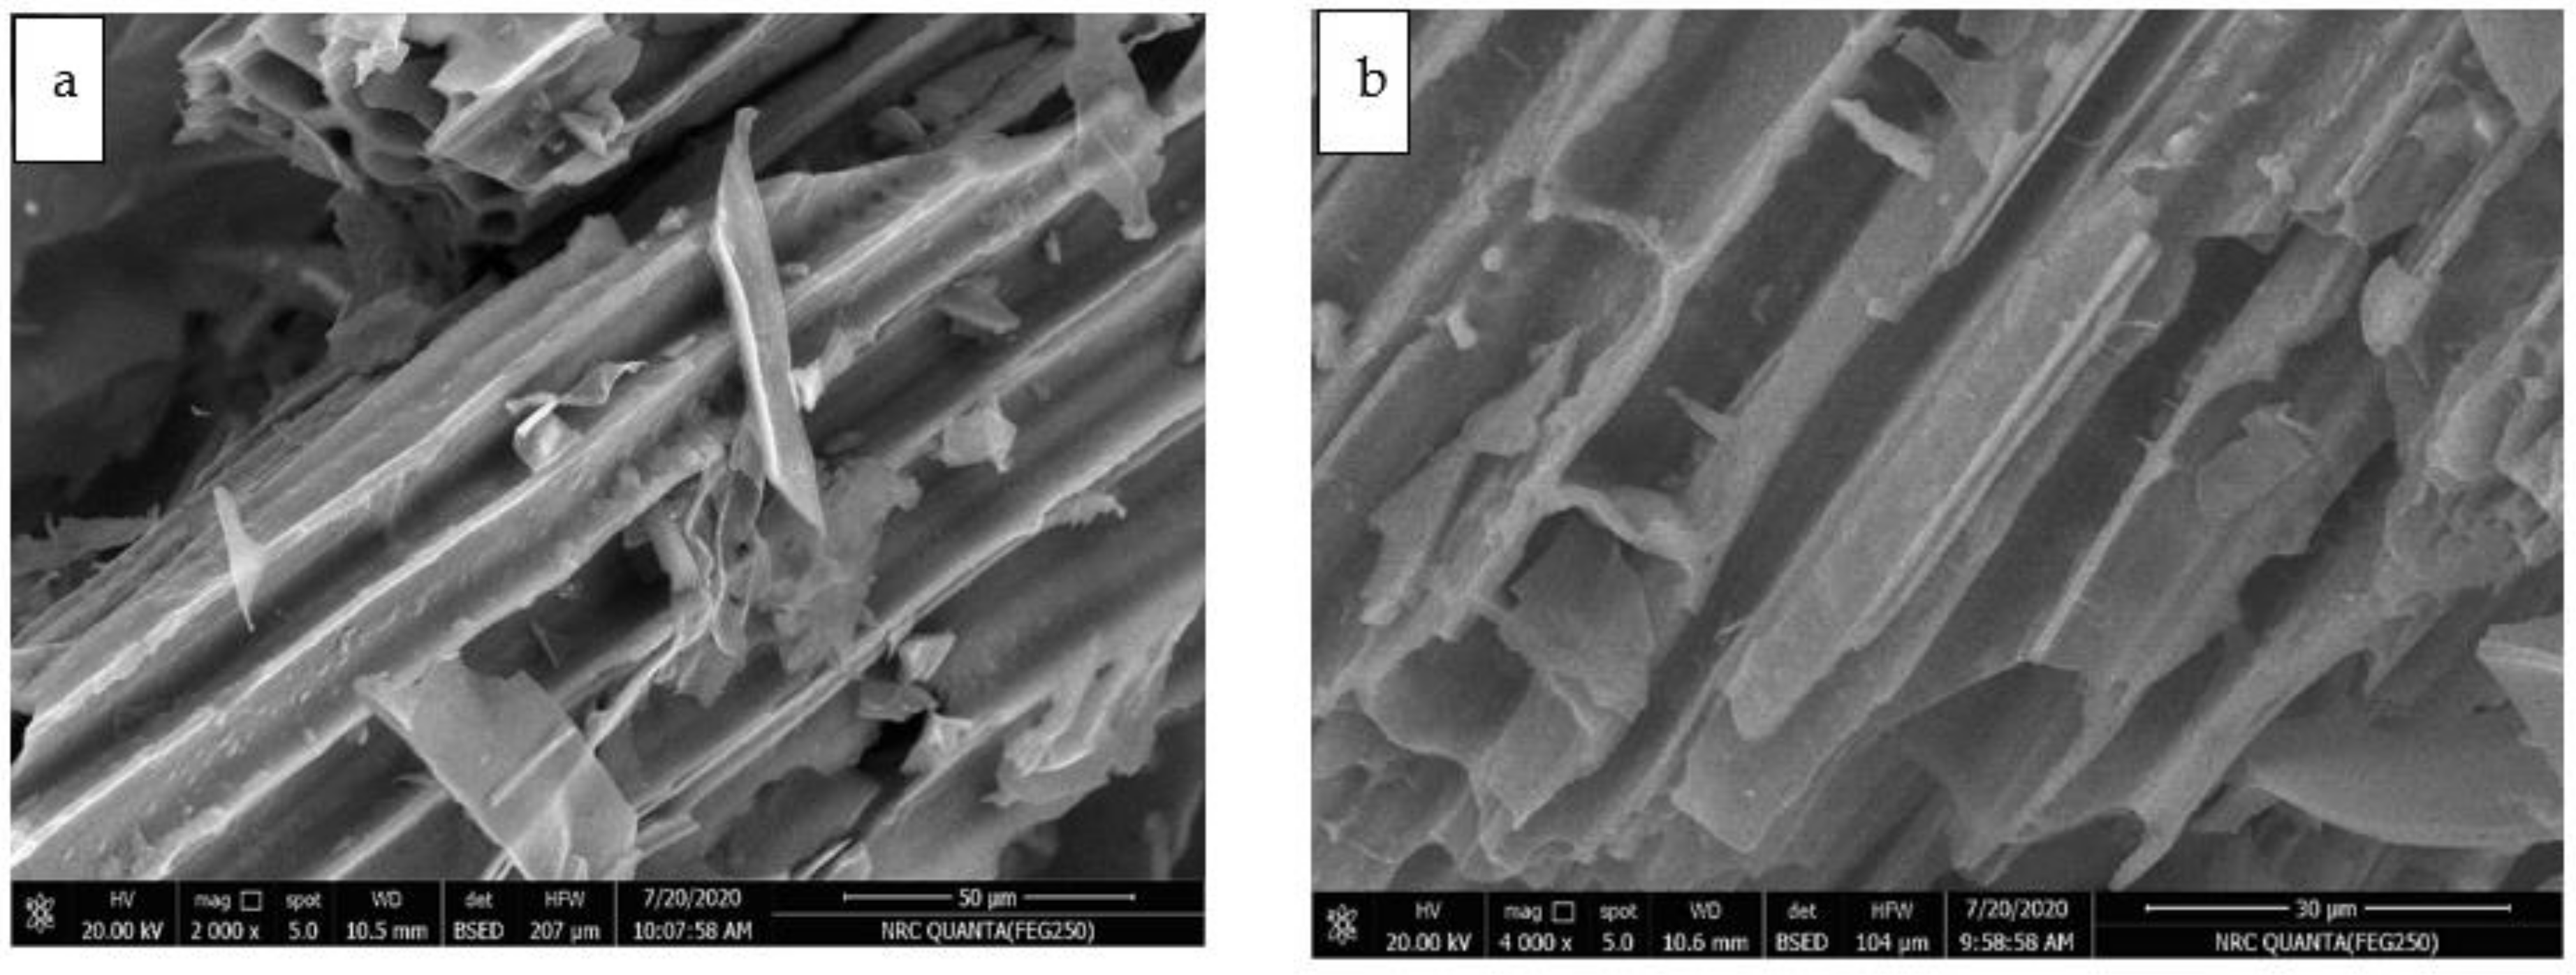
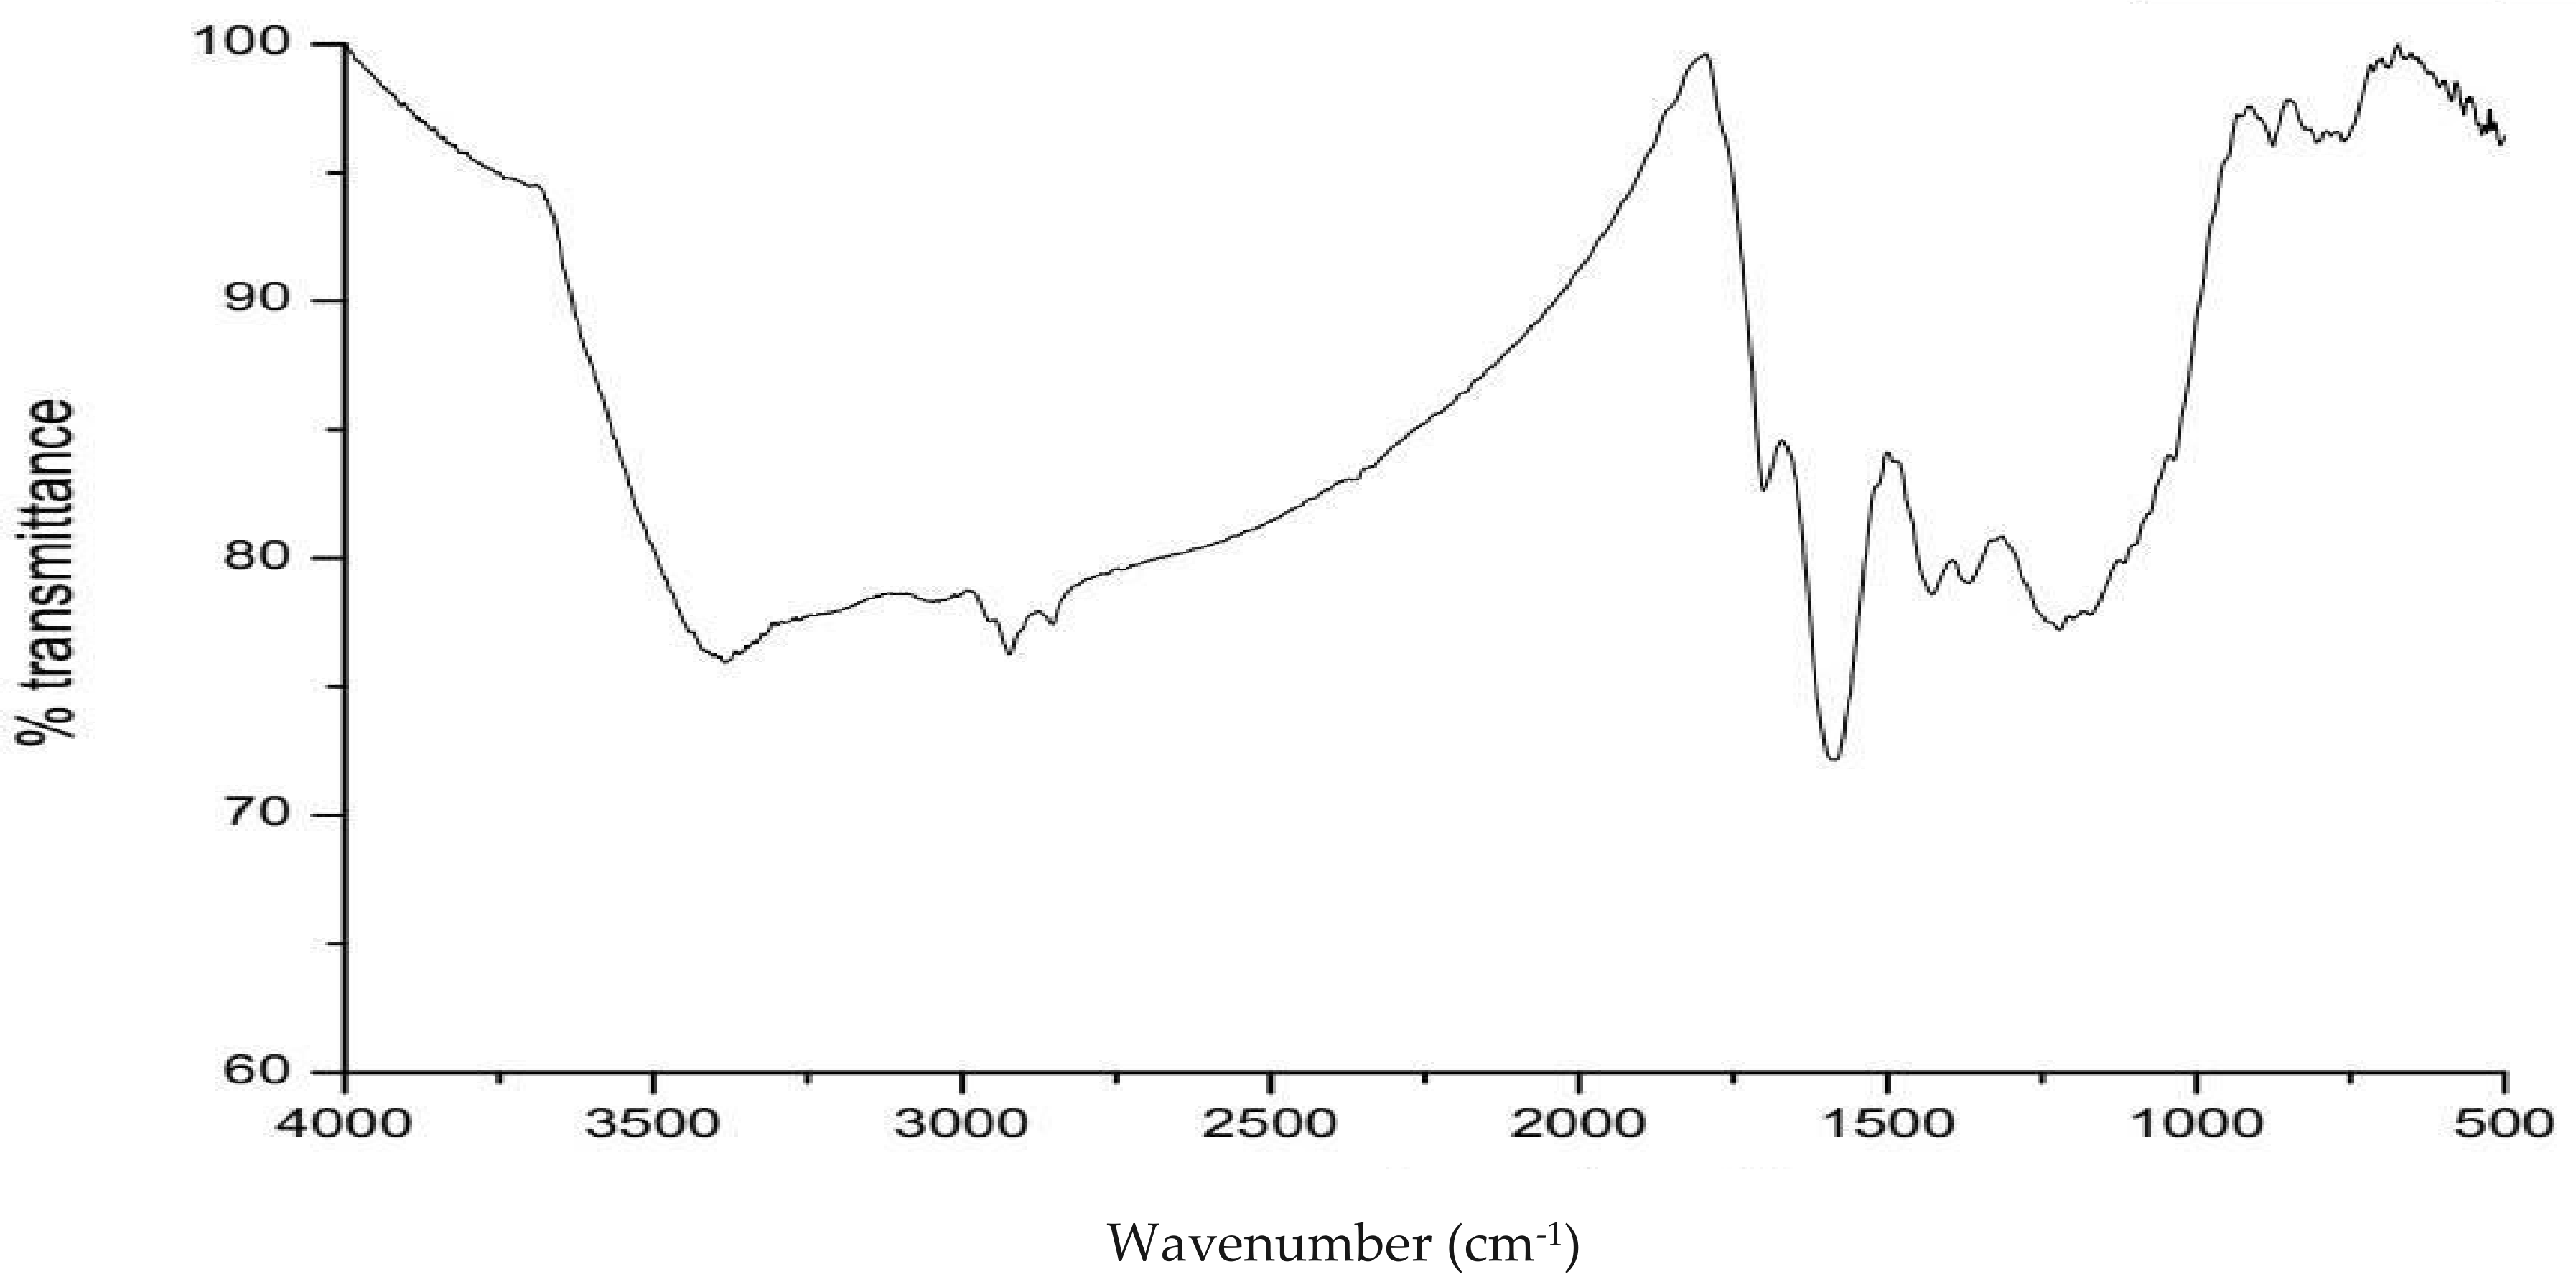
3.1. Properties of Biochar

The properties of biochar highly rely on the type of feedstock and the pyrolysis process used [22]. The CCB properties are summarized in Table 2. The results confirm that the CCB has a high content of carbon (C) and oxygen (O), while it has a low content of Nitrogen (N), Phosphorus (P), and Potassium (K). In addition, CCB has a high BET surface area and CEC, therefore enhancing nutrients’ and cations’ adsorption on its surface [23] and the soil’s water-holding capacity as well as soil porosity. Likewise, the water-holding capacity of dry biochar was 1.67 g/g. The large relative surface area of biochar is enhanced. The CCB has alkaline pH and low EC values [24].
In an effort to investigate the functional groups and chemical structure of CCB, the Fourier transform infrared (FTIR) spectroscopy test was performed. The IR result showed that the functional groups of the CCB are identical to other biochars (Figure 1). The main functional groups on the CCB surface were detected as the hydroxyl group –OH (3400), aromatic C=C (1607 cm−1), COOH (1700 cm−1), phenolic C−OH (1187 and 1260 cm−1), aromatic CH (750, 836, 874, and 3029 cm−1), and aliphatic CH (2862 and 2921 cm−1). These functional groups are particularly important in the retention of nutrients and cations within the soil matrix [25].
The CCB structure profiling was studied by SEM (Figure 2). Based on SEM results, CCB can be characterized as highly porous, which is consistent with other results that show a correlation between soil surface structure and the amount of volatile matter associated with the raw materials used in biochar production [26]. The pores and porous structure of CCB play a very important role in the adsorption of water molecules and cations on the CCB surface.

3.2. Effect of Saline Water and Biochar on Wheat Production

Results in Table 3 showed significant or highly significant differences of water and biochar combination treatments for all studied traits in the first and second season and over seasons. On the other hand, insignificant differences in seasons and the interaction between seasons and treatments were found for all studied traits.
Applying saline water with a salt concentration of 3000 ppm as the irrigation water source through the experiment caused a negative effect on all wheat traits, as shown in Table 3. Some physiological properties (LAI, RWC, and MSI) and plant growth parameters were studied to evaluate the impact of saline water and biochar on plant properties after 100 days of cultivating wheat. Plant physiological properties are used to explain the plant function and behavior, encompassing all the dynamic processes of growth. The results showed that saline water reduces all the physiological properties of wheat [27,28], while the biochar addition reduced the negative effects of salinity in both seasons and over seasons. Thus, saline water reduces plant growth but can be mitigated to a certain extent through biochar application [29].
Furthermore, results in Table 3 revealed that saline irrigation water adversely impacted a number of wheat characteristics (plant height, number of spikes/m2, 1000-kernel weight, biological yield, and grain yield) in both seasons and over the two seasons. On the contrary, the addition of biochar as a soil amendment reduced the negative effect of saline irrigation water on all wheat traits in both seasons and over the two growing seasons. The experiments were repeated across two seasons to give greater reliability to the results. Saline water reduced the grain yield ratio by 8.5%, 11%, and 9.7% compared to non-saline water use during seasons of 2019/2020 and 2020/2021 and over seasons, respectively. Combined over seasons, the biochar addition enhanced the grain yield by 5.6% and 13.8% as compared to no biochar addition under fresh and saline irrigation water conditions, respectively. Growth and yield reduction could be explained by the inhibitory effect of the osmotic effects of salt in the soil solutions, which causes a number of adverse conditions, including accelerated senescence due to the leaf water deficit and/or hormonal disruption from the rooting system [30]. Acevedo (1991) [31] presented that decreasing the yield and yield components of wheat through the non-soil leaching process refer to decreased cell growth, leaf area, and partial stomatal closure due to low soil water content, which decreased the intake of CO2 with a consequent decrease in photosynthesis per unit area.
Biochar affects plant properties in direct and indirect ways. The direct way is represented by its effect on nutrients and its ability to adsorb cations, such as Na+ and nutrients [32]. In contrast, the indirect way is represented by enhanced soil properties by increasing soil organic matter and its impact on bulk density and moisture field capacity of soil as well as soil particle aggregation. In addition, biochar increases microbial biomass and activity, soil base saturation, and enhances soil aeration.

3.3. Effect of Saline Water and Biochar on Soil Properties

Irrigating with saline water adds salt to the soil, which affects the soil’s properties. However, using drip irrigation decreases the amount of added salt due to its efficiency in water application. In addition, biochar addition reduced the negative effect of saline water on soil properties. Soil chemical properties had been studied at two stages (after 70 days from biochar addition and after harvest time). The results in Table 4 and Table 5 summarize soil properties measured during both seasons and over the two seasons. Data in Table 4 showed significant and highly significant differences in water and biochar combination treatments for all soil properties after 70 days of biochar addition in both seasons and over seasons except for SP and pH in the first season and pH over the two seasons. In addition, results of the combined analysis indicated insignificant differences of seasons for all studied properties except for Mg2+ and SO42− concentrations. Additionally, the interaction between seasons and treatments showed insignificant effects for all studied soil properties except for N g/kg and K+ concentrations, which gave significant and highly significant effects, respectively. Furthermore, the results in Table 5 explore significant and highly significant differences in water and biochar combination treatments for all soil properties after harvest time in both seasons and over seasons except for pH (1:2.5). The combined analysis showed that the differences between seasons were significant for Na+ concentration and highly significant for OM%, Mg2+, K+, and HCO3, while the effect of interaction between seasons and treatments was insignificant.
Moreover, the results of combined seasons illustrate that saline water has a significant effect on EC, soil organic matter, NPK, major cations, and anions, while it has an insignificant effect on pH. These results are consistent with reports made by others that saline irrigation water has a negative impact on a soil’s chemical properties [33].
On the other hand, biochar has a potentially positive effect on soil’s physical, chemical, and biological properties. Biochar has a significant effect on soil hydrological properties, including moisture content, water-holding capacity, water retention, hydraulic conductivity, water infiltration rate, and these properties, in turn, impact soil bulk density, surface area, porosity, and aggregate stability. Using biochar increased C, N, available P, pH, cation exchange capacity (CEC), organic carbon, and exchangeable cations (e.g., Ca, Mg, Na, and K) in the soil. The favorable effect of biochar on soil chemical properties may occur by (i) rises in CEC values [34], (ii) heavy metals sorption [35], and (iii) control of contaminated organic and inorganic compounds in soil [36].
The positive effects of CCB on soil chemical properties were observed. According to the results in Table 4 and Table 5, there was a significant effect on all soil properties except pH under saline and normal water conditions with biochar addition after 70 days of biochar addition and harvest time due to LSD values. Biochar affects nutrient availability, including N, K, and P, under saline and normal water conditions due to its ability to adsorb cations. Biochar reduces the negative effects of saline water on soil productivity through its ability to adsorb soil ions [37,38].

3.4. Water Productivity

Using groundwater as an alternative source of water is considered one of the more suitable ways to address food insecurity problems within arid and semi-arid countries such as Egypt [39]. However, crop and water productivity are negatively impacted by groundwater salinity. Although the drip irrigation system has been used in this experiment to mitigate the addition of salts, water quality and crop productivity suffer under highly saline conditions unless alternative methods can be found, such as biochar soil amendments.
Water productivity is defined as a measure of the economic or biophysical gain from the use of a unit of water consumed in crop production. The statistical analysis results in Table 6 demonstrate that there were significant and highly significant differences between water and biochar combination treatments for water productivity in both seasons and across the two seasons, respectively. On the other hand, insignificant differences in seasons and the interaction between seasons and treatments were found for water productivity. In addition, the results illustrated that the lowest water productivity was found under salinity conditions, while the highest value was under normal conditions with biochar addition (Table 6) in both seasons and over the two seasons. Moreover, biochar addition enhanced the water productivity under saline conditions to nearly the same productivity found when non-saline water was applied. Thus, biochar alleviated the negative impact of saline water on water productivity due to its ability to adsorb water particles and various ions.

3.5. Economic Impact Assessment

Egypt, similar to many other countries in the world, has been facing water availability constraints, especially for the agricultural sector, with its goal to meet the food production requirements needed for its growing population. Wheat grain yield under each treatment in the experiment is presented in Table 3. Results of the study revealed that the estimated grain yield for each treatment was significantly different. As expected, freshwater with biochar addition resulted in the highest crop yield, with 4.07 ton/ha. Saline water without biochar yield characterized the lowest crop yield of 3.07 ton/ha. Experimental results clearly showed that salinity has a significant effect on agricultural crop yield. However, biochar addition increased the wheat yield from 3.07 to 3.47 tons/ha under saline water conditions.
These results indicated that there is at least potential to achieve over 90% of freshwater wheat yield when saline irrigation water is used with biochar. With the average market price of 4567 EGP/ton, producers can gain a net profit of 2618 EGP/ha (Table 7). Hence, bio-saline agriculture has the potential to bring more land under cultivation and add value to agriculture in Egypt.
Egypt is one of the largest wheat importing countries. Egypt’s wheat import value was 2415.47 million USD in 2015 and 3024.16 million USD in 2019. It is evident that an increase in wheat production in Egypt through bio-saline agriculture and reclaimed land under cultivation could potentially decrease the wheat import expenditures for Egypt, amounting to almost 4.16 million USD every year, even with the lowest import price of 240 USD/ton (Table 8). These steps in enhancing Egypt’s agricultural crop production will save valuable foreign exchange for the Egyptian economy [40,41].

4. Conclusions

Water scarcity and rapid population growth in arid and semi-arid countries, as well as climate change, affect agricultural crop growth and, ultimately, food security. The potential use of saline groundwater as an alternative source of irrigation water is considered an important option in addressing a vital need for agricultural crop production and food security. However, groundwater salinity can result in a significant reduction in agricultural crop yield as well as a rapid deterioration of agricultural soil quality.
The results of this study highlighted both the negative effects of salinity on agricultural crop production and soil chemical properties, as well as the potential of biochar application in ameliorating those effects. Biochar addition, applied during the use of saline irrigation water, was found to enhance water productivity as well as increase crop yield to within 90% of that achieved when freshwater was used in crop irrigation.

Author Contributions

Conceptualization, M.E.A.E.-S. and M.H.; methodology, M.E.A.E.-S. and A.G.A.E.-R.; validation, M.E.A.E.-S., M.H. and A.G.A.E.-R.; formal analysis, M.E.A.E.-S.; investigation, M.E.A.E.-S., M.H., L.A., M.M., A.S.E.D. and S.B.; resources, M.E.A.E.-S.; data curation, M.E.A.E.-S., M.H., A.G.A.E.-R., L.A., M.M., A.S.E.D. and S.B.; writing—original draft preparation, M.E.A.E.-S. and A.G.A.E.-R.; writing—review and editing, M.E.A.E.-S., M.H., L.A. and M.M.; visualization, M.E.A.E.-S., M.H., A.G.A.E.-R., L.A., M.M., A.S.E.D. and S.B.; supervision, A.S.E.D. and S.B.; project administration, A.S.E.D. and S.B. All authors have read and agreed to the published version of the manuscript.

Funding

This work was funded by the Binational Fulbright Commission in Egypt (BFCE) under the Fulbright Alumni Activity: Egypt Food Security Research Project (EFSP) grant, 2019–2021.

Institutional Review Board Statement

Not applicable.

Informed Consent Statement

Not applicable.

Conflicts of Interest

The authors declare that they have no conflict of interest.

References

  1. Abdelkader, A.; Elshorbagy, T.F.; Laio, L.; Ridolfi, F.H.; Hoekstra, A.Y. National water, food, and trade modeling framework: The case of Egypt. Sci. Total Environ. 2018, 639, 485–496. [Google Scholar] [CrossRef] [PubMed]
  2. Hamza, W.; Mason, S. Water availability and food security challenges in Egypt. In Proceedings of the International Forum on Food Security under Water Scarcity in the Middle East: Problems and Solutions, Como, Italy, 24–27 November 2004; pp. 24–27. [Google Scholar]
  3. Wang, R.; Kang, Y.; Wan, S.; Hu, W.; Liu, S.; Liu, S. Salt distribution and the growth of cotton under different drip irrigation regimes in a saline area. Agric. Water Manag. 2011, 100, 58–69. [Google Scholar] [CrossRef]
  4. Tejada, M.; Garcia, C.; Gonzalez, J.L.; Hernández, T. Use of Organic Amendment as a Strategy for Saline Soil Remediation: Influence on the Physical, Chemical and Biological Properties of Soil. Soil Biol. Biochem. 2006, 38, 1413–1421. [Google Scholar] [CrossRef]
  5. Liang, X.-Q.; Ji, Y.-J.; He, M.-M.; Su, M.-M.; Liu, C.; Tian, G.-M. Simple N Balance Assessment for Optimizing the Biochar Amendment Level in Paddy Soils. Commun. Soil Sci. Plant Anal. 2014, 45, 1247–1258. [Google Scholar] [CrossRef]
  6. Glaser, B.; Lehmann, J.; Zech, W. Ameliorating physical and chemical properties of highly weathered soils in the tropics with charcoal—A review. Biol. Fertil. Soils 2002, 35, 219–230. [Google Scholar] [CrossRef]
  7. Abel, S.; Peters, A.; Trinks, S.; Schonsky, H.; Facklam, M.; Wessolek, G. Impact of biochar and hydrochar addition on water retention and water repellency of sandy soil. Geoderma 2013, 202–203, 183–191. [Google Scholar] [CrossRef]
  8. Laird, D.A. The charcoal vision: A win–win–win scenario for simultaneously producing bioenergy, permanently sequestering carbon, while improving soil and water quality. Agron. J. 2008, 100, 178–181. [Google Scholar] [CrossRef]
  9. Thies, J.; Rillig, M. Characteristics of biochar: Biological propertis. In Biochar for Environmental Management; Lehmann, J., Joseph, S., Eds.; Earthscan: London, UK, 2009; pp. 85–102. [Google Scholar]
  10. Lal, R. Sequestering carbon in soils of agro-ecosystems. Food Policy 2011, 36, S33–S39. [Google Scholar] [CrossRef]
  11. Lal, R. Soils and sustainable agriculture. A review. Agron. Sustain. Dev. 2008, 28, 57–64. [Google Scholar] [CrossRef]
  12. Phares, C.A.; Atiah, K.F.; Kwame, A.; Danquah, A.; Asare, A.T.; Aggor-Woananuc, S. Application of biochar and inorganic phosphorus fertilizer influenced rhizosphere soil characteristics, nodule formation and phytoconstituents of cowpea grown on tropical soil. Heliyon 2020, 6, e05255. [Google Scholar] [CrossRef]
  13. Mohawesh, O.; Coolong, T.; Aliedeh, M.; Qaraleh, S. Greenhouse evaluation of biochar to enhance soil properties and plant growth performance under arid environment. Bulg. J. Agric. Sci. 2018, 24, 1012–1019. [Google Scholar]
  14. Molden, D.J.; Sakthivadivel, R.; Habib, Z. Basin-Level Use and Productivity of Water: Examples from South Asia; Research Report 49; International Water Management Institute: Colombo, Sri Lanka, 2001. [Google Scholar]
  15. Reza, M.S.; Afroze, S.; Bakar, M.; Saidur, R.; Aslfattahi, N.; Taweekun, J.; Azad, A.K. Biochar characterization of invasive Pennisetumpurpureum Grass: Eff. Pyrolysis Temperature. Biochar 2020, 2, 239–251. [Google Scholar] [CrossRef]
  16. Pask, A.; Pietragalla, J.; Mullan, D.; Reynolds, M.P. Physiological Breeding II: A Field Guide to Wheat Phenotyping; CIMMYT: Veracruz, Mexico, 2012; pp. 25–27. [Google Scholar]
  17. Sairam, R.K.; Deshmukh, P.S.; Shukla, D.S. Tolerance of Drought and Temperature Stress in Relation to Increased Antioxidant Enzyme Activity in Wheat. J. Agron. Crop. Sci. 1997, 178, 171–178. [Google Scholar] [CrossRef]
  18. El-sayed, M.E.A.; Soliman, G.M.M. Effect of Compost and Gypsum Application on Yield and Its Attributes of Three Bread Wheat Cultivars As Well As Soil Properties under Two Irrigation Levels. Assiut J. Agric. Sci. 2019, 50, 102–119. [Google Scholar]
  19. Page, A.L.; Millner, R.H.; Keeney, D.R. Method of Soil Analysis, Part 2: Chemical and Microbiological Properties, 2nd ed.; ASA and SSSA: Madison, WI, USA, 1982. [Google Scholar]
  20. Gomez, K.A.; Gomez, A.A. Statistical Procedures for Agricultural Research, 2nd ed.; John Wiley and Sons: New York, NY, USA, 1984; p. 680. [Google Scholar]
  21. Waller, R.A.; Duncan, D.B. A bayes rule for the symmetric multiple comparisons problem. J. Am. Statist. Assoc. 1969, 64, 1484–1503. [Google Scholar]
  22. Tasim, B.; Masood, T.; Shah, Z.A.; Arif, M.; Ullah, A.; Miraj, G.; Samiullah, U. Quality Evaluation of Biochar Prepared from Different Agricultural Residues. Sarhad. J. Agric. 2019, 35, 134–143. [Google Scholar] [CrossRef]
  23. Mohamed, B.A.; Ellis, N.; Kim, C.S.; Bi, X. The role of tailored biochar in increasing plant growth, and reducing bioavailability, phytotoxicity, and uptake of heavy metals in contaminated soil. Environ. Pollut. 2017, 230, 329–338. [Google Scholar] [CrossRef] [PubMed]
  24. Rajkovich, S.; Enders, A.; Hanley, K.; Hyland, C.; Zimmerman, A.R.; Lehmann, J. Corn growth and nitrogen nutrition after additions of biochars with varying properties to a temperate soil. Biol. Fertil. Soils 2011, 48, 271–284. [Google Scholar] [CrossRef]
  25. Singh, B.; Fang, Y.; Johnston, C. A Fourier-Transform Infrared Study of Biochar Aging in Soils. Soil Sci. Soc. Am. J. 2016, 80, 613–622. [Google Scholar] [CrossRef] [PubMed]
  26. Ma, X.; Zhou, B.; Alice, B.; Alhaji, J.; Xiaoyu, H.; Dan, W.; Yulan, Z.; Daniel, R. Study of Biochar Properties by Scanning Electron Microscope—Energy Dispersive X-Ray Spectroscopy (SEM-EDX). Commun. Soil Sci. Plant. Anal. 2016, 47, 593–601. [Google Scholar] [CrossRef]
  27. Singh, N.P.; Patel, A.K.; Banjare, U.; Singh, R.K. FFECT OF SALT STRESS (NACL) ON SOME MORPHO-PHYSIOLOGICAL PROPERTIES OF MAIZE (Zea mays L.). Plant Arch. 2019, 19, 927–935. [Google Scholar]
  28. Noureldeen, N. Irrigation Water Quality Standards; Lectures Presented at Faculty of Agriculture; Cairo University: Cairo, Egypt, 2013. [Google Scholar]
  29. Anwari, G.A.; Mandozai, A.; Feng, J. Effects of Biochar Amendment on Soil Problems and Improving Rice Production under Salinity Conditions. Adv. J. Grad. Res. 2019, 7, 45–63. [Google Scholar] [CrossRef] [Green Version]
  30. Dura, S.A.M.; Duwayriand, M.A.; Nachit, M.M. Effects of Different Salinity Levels on Growth, Yield and Physiology on Durum Wheat (Triticumturgidum var. durum). Jordan J. Agric. Sci. 2011, 7, 518–527. [Google Scholar]
  31. Acevedo, E.; Harris, H.; Cooper, P.J.M. Crop architecture and water use efficiency in Mediterranean environments. In Soil and Crop Management for Improved Water Use Efficiency in Rainfed Areas; Harris, H., Cooper, P.J.M., Pala, M., Eds.; ICARDA: Aleppo, Syria, 1991; pp. 106–118. [Google Scholar]
  32. Prasad, M.; Chrysargyris, A.; McDaniel, N.; Kavanagh, A.; Gruda, N.S.; Tzortzakis, N. Plant Nutrient Availability and pH of Biochars and Their Fractions, with the Possible Use as a Component in a Growing Media. Agronomy 2020, 10, 10. [Google Scholar] [CrossRef] [Green Version]
  33. Parvaiz, A.; Satyawati, S. Salt stress and phyto-biochemical responses of plants—A review. Plant Soil Environ. 2008, 54, 89–99. [Google Scholar] [CrossRef]
  34. Liang, B.; Lehmann, J.; Solomon, D.; Kinyangi, J.; Grossman, J.; O’Neill, B.; Skjemstad, J.O.; Thies, J.; Luizão, F.J.; Petersen, J.; et al. Black Carbon Increases Cation Exchange Capacity in Soils. Soil Sci. Soc. Am. J. 2006, 70, 1719–1730. [Google Scholar] [CrossRef] [Green Version]
  35. Freddo, A.; Cai, C.; Reid, B.J. Environmental contextualisation of potential toxic elements and polycyclic aromatic hydrocarbons in biochar. Environ. Pollut. 2012, 171, 18–24. [Google Scholar] [CrossRef] [PubMed]
  36. Ogbonnaya, U.; Semple, K.T. Impact of biochar on organic contaminants in soil: A tool for mitigating risk. Agronomy 2013, 3, 349–375. [Google Scholar] [CrossRef]
  37. Gunarathne, V.; Senadeera, A.; Gunarathne, U.; Biswas, J.K.; Almaroai, Y.A.; Vithanage, M. Potential of biochar and organic amendments for reclamation of coastal acidic-salt affected soil. Biochar 2020, 2, 107–120. [Google Scholar] [CrossRef] [Green Version]
  38. Hue, N. Biochar for Maintaining Soil Health. In Soil Health; Giri, B., Varma, A., Eds.; Springer Nature Switzerland AG: Cham, Switzerland, 2020; pp. 21–46. [Google Scholar]
  39. Rosegrant, W.M.; Cai, X. Modeling Water Availability and Food Security—A Global Perspective: The IMPACT-Water Model; Working Paper; International Food Policy Research Institute: Washington, DC, USA, 2001. [Google Scholar]
  40. Bahloul, A.M.E.; Abdel, F.M.O. An analytical study of wheat storage allocation in Egypt between current situation and desired outcomes. Middle East J. Agric. Res. 2020, 9, 34–45. [Google Scholar]
  41. Khalil, Y.M.M.; Abd, E.G.; Mansour, S.S.; Tamer, G.I. A standard analysis of Egyptian foreign trade structure for wheat. Bull. Natl. Res. Cent. 2020, 44, 1–7. [Google Scholar] [CrossRef]
Figure 1. FT-IR spectra of corn cob biochar.
Agriculture 11 01112 g001
Figure 2. SEM imaging of cob corn biochar with different enlargement factors ((a) 2000× and (b) 4000×).
Agriculture 11 01112 g002
Table 1. The average data of monthly maximum and minimum temperature, wind speed, and relative humidity during the two growing seasons.
MonthMaximum Temperature (°C)Minimum Temperature (°C)Wind Speed (m/s)Precipitation (mm)Relative Humidity (%)
2019/20202020/20212019/20202020/20212019/20202020/20212019/20202020/20212019/20202020/2021
November29.725.115.714.011.914.10.00.035.948.9
December23.024.59.312.112.111.60.00.047.241.2
January18.823.06.59.813.812.20.00.050.440.4
February22.724.39.29.915.115.20.00.043.638.1
March28.729.514.114.017.518.50.00.031.226.8
April32.534.217.420.617.616.50.00.024.717.6
Table 2. Physical and chemical properties of CCB.
pHC%H%S%O%N%K%P%WHC (g/g)BET Surface Area (m2/g)
CCB8.160.34.5-30.40.71.72.51.6729.6
Cob corn biochar (CCB); Water-holding capacity (WHC).
Table 3. Mean of studied traits as affected by water, biochar, and their combination treatments in 2019/2020 and 2020/2021 growing seasons.
SamplesPlant Height (cm)No. of Spikes/m2No. of Grains/Spike1000-Grain Weight (g)Grain Yield (ton/ha)Biological Yield (ton/ha)Leaf Area IndexRelative Water Content (%)Membrane Stability Index (%)
Season
2019/2020
FW-biochar 93.3 a241.0 b53.0 b45.0 b3.8 b7.1 a3.4 b83.9 a77.2 a
FW+biochar 95.0 a282.0 a58.4 a52.0 a4.1 a7.3 a4.2 a84.6 a78.8 a
SW-biochar 86.0 b225.0 b45.2 c36.8 c3.1 d6.5 b2.7 c77.9 b74.0 b
SW+biochar 92.3 a270.0 a52.0 b43.1 b3.5 b,c7.1 a3.7 b83.4 a75.8 b
Mean91.725552.244.23.673.582.476.5
F test 0.056.0324.533.892.790.290.390.462.62.43
LSD 0.05***************
Season
2020/2021
FW-biochar 92.7 b228.0 b56.0 b49.9 a3.4 b7.3 a3.9 a,b83.4 a76.8 a
FW+biochar99.0 a262.0 a60.0 a53.1 a3.9 a7.8 a4.2 a84.2 a78.8 a
SW-biochar85.0 c210.0 c43.0 c34.7 b2.8 c6.5 b2.5 c77.1 b73.8 b
SW+biochar91.0 b234.0 b53.0 b44.6 a3.3 b7.8 a3.4 b82.8 a73.5 b
Mean91.9233.55345.583.47.33.581.975.7
F test 0.055.2517.233.467.110.330.60.594.762.77
LSD 0.05*****************
CombinedFW-biochar 93.0 b234.7 c54.5 b47.5 b3.6 b7.2 b3.7 b83.6 a77.0 b
FW+biochar 97.0 a272.3 a59.2 a52.6 a4.0 a7.6 a4.2 a84.4 a78.8 a
SW-biochar 85.5 c217.7 d44.1 c35.8 d2.9 d6.5 c2.5 c77.5 b73.8 c
SW+biochar 91.7 b252.3 b52.5 b43.9 c3.4 c7.4 a,b3.6 b83.1 a74.7 c
LSD 0.053.5513.292.313.390.190.320.332.41.63
AnovaSeasonsnsnsnsnsnsnsnsnsns
Treatments ******************
S × Tnsnsnsnsnsnsnsnsns
Different letters indicate significant differences, Significant effects: p < 0.05 (*) p < 0.01 (**); insignificant effects (ns). Freshwater without biochar (FW-biochar), freshwater with biochar (FW+biochar), saline water without biochar (SW-biochar), and saline water with biochar (SW+biochar). Seasons (S), Treatments (T).
Table 4. Soil analysis after 70 days of biochar addition.
TreatmentSaturation Point (SP)pHEC
ds/m
meq/LP g/kgK g/kgN g/kg
Ca2+Mg2+Na+K+HCO3ClSO42−
Season
2019/2020
FW-biochar 19.30 b7.70 c1.40 c2.10 b0.60 c10.30 b1.40 c4.00 a8.03 c2.50 d6.00 d18.50 c14.80 b
FW+biochar 20.10 a7.90 b1.50 b,c2.20 b0.60 c11.20 b1.41 c3.50 b7.00 d3.40 c8.00 b25.20 b18.30 a
SW-biochar 19.50 b8.10 a1.80 a3.50 a2.65 a16.50 a2.22 b4.00 a11.67 a4.70 a6.48 c14.00 d12.60 c
SW+biochar 20.40 a7.83 b,c1.70 ab3.15 a2.00 b16.20 a2.35 a3.43 b11.00 b4.00 b9.00 a27.90 a15.10 b
Mean19.87.91.62.71.513.61.83.79.43.77.421.415.1
F test 0.05************************
LSD 0.050.610.160.210.380.131.170.060.20.450.190.420.851.52
Season
2020/2021
FW-biochar 19.47.81.30 c1.50 c0.70 c9.90 d1.30 b3.80 a,b7.70 c2.20 d6.00 c18.50 c16.10 b
FW+biochar20.27.951.40 b,c2.10 b0.80 c10.80 c1.21 b3.40 b7.10 c3.10 c8.00 b25.20 b19.20 a
SW-biochar19.88.11.90 a3.70 a2.75 a16.90 a2.42 a4.10 a11.77 a4.80 a6.48 c14.00 d11.80 d
SW+biochar20.581.75 a,b3.15 a2.00 b16.10 b2.45 a3.53 b10.10 b3.90 b9.00 a27.90 a14.60 c
Mean2081.62.61.613.41.83.79.23.57.421.415.4
F test 0.05nsns********************
LSD 0.05------0.40.550.310.750.240.41.280.590.731.571.15
CombinedFW-biochar 19.4 c7.81.4 c1.8 d0.7 c10.1 c1.4 c3.9 a7.9 c2.4 d6.0 d18.5 c 15.5 b
FW+biochar 20.2 a,b7.91.5 b,c2.2 c0.7 c11.0 b1.3 d3.5 b7.1 d3.3 c8.0 b25.2 b 18.6 a
SW-biochar 19.7 b,c8.11.9 a3.6 a2.7 a16.7 a2.3 b4.1 a11.7 a4.8 a6.5 c14.0 d 12.2 c
SW+biochar 20.5 a7.91.7 a,b3.2 b2.0 b16.2 a2.4 a3.5 b10.6 b4.0 b9.0 a27.9 a 14.9 b
LSD 0.050.75---0.20.30.150.620.020.280.60.270.370.790.85
AnovaSeasonsNsnsnsns*nsnsnsns**nsnsns
Treatments*ns**********************
S × Tnsnsnsnsnsns**nsnsnsnsns*
Different letters indicate significant differences. Significant effects: p < 0.05 (*) p < 0.01 (**); insignificant effects (ns). Freshwater without biochar (FW-biochar), freshwater with biochar (FW+biochar), saline water without biochar (SW-biochar), and saline water with biochar (SW+biochar). Seasons (S), Treatments (T).
Table 5. Some properties of soil samples of study seasons 2019/2020 and 2020/2021 after harvest time.
TreatmentpH
(1:2.5)
OM%EC
ds/m
meq/L
Ca2+Mg2+Na+K+HCO3ClSO42−
Season
2019/2020
FW-biochar7.70.20 c1.40 b2.10 c1.01 c10.20 c2.30 c3.30 d8.00 c2.50 c
FW+biochar7.771.30 a1.50 b2.00 c1.10 c10.90 c3.70 a3.50 c8.60 c2.90 b
SW-biochar7.880.20 c1.70 a2.60 a2.67 b18.50 a2.30 c3.97 a13.50 a3.20 b
SW+biochar7.81.24 b1.60 a2.30 b3.00 a16.70 b3.33 b3.80 b12.60 b4.20 a
Mean7.80.71.62.31.914.12.93.610.73.2
F test 0.05ns******************
LSD 0.05---0.070.190.10.140.970.10.120.720.37
Season
2020/2021
FW-biochar7.750.40 b1.36 c2.00 b,c0.95 b9.90 c2.10 c3.10 b7.90 b2.30 c
FW+biochar7.81.40 a1.46 b,c1.90 c1.02 b10.30 c2.90 a,b3.20 b8.20 b2.70 c
SW-biochar7.920.36 b1.82 a2.80 a2.52 a17.60 a2.20 b,c3.70 a13.90 a3.50 b
SW+biochar7.91.30 a1.62 a,b2.40 a,b2.75 a16.20 b3.00 a3.65 a12.50 b4.00 a
Mean7.80.91.62.31.813.52.63.410.63.1
F test 0.05ns***************
LSD 0.05---0.330.230.420.370.570.740.41.170.4
CombinedFW-biochar7.70.3 b1.4 c2.1 c1.0 c10.1 c2.2 b3.2 c8.0 c2.4 d
FW+biochar7.81.4 a1.5 b,c2.0 c1.1 c10.6 c3.3 a3.4 b8.4 c2.8 c
SW-biochar7.90.3 b1.8 a2.7 a2.6 b18.1 a2.3 b3.8 a13.7 a3.4 b
SW+biochar7.91.3 a1.6 b2.4 b2.9 a16.5 b3.2 a3.7 a12.6 b4.1 a
LSD 0.05---0.150.130.190.180.50.330.180.610.24
AnovaSeasonsns**nsns*******nsns
Treatmentsns******************
S × Tnsnsnsnsnsnsnsnsnsns
Different letters indicate significant differences. Significant effects: p < 0.05 (*) p < 0.01 (**); insignificant effects (ns). Freshwater without biochar (FW-biochar), freshwater with biochar (FW+biochar), saline water without biochar (SW-biochar), and saline water with biochar (SW+biochar). Seasons (S), Treatments (T).
Table 6. Mean of water productivity (kg/m3) as affected by water, biochar, and their combination treatments in both growing seasons.
TreatmentsWater Productivity (kg/m3)
2019/20202020/2021Combined
FW-biochar1.61 a,b1.58 a,b1.59 a
FW+biochar1.75 a1.68 a1.72 a
SW-biochar1.32 b1.28 c1.30 c
SW+biochar1.48 b1.45 b,c1.47 b
Mean1.541.50
F test 0.05****
LSD 0.050.220.220.14
AnovaSeasons ns
Treatments **
S × T ns
Different letters indicate significant differences. Significant effects: p < 0.05 (*) p < 0.01 (**), insignificant effects (ns). Freshwater without biochar (FW-biochar), freshwater with biochar (FW+biochar), saline water without biochar (SW-biochar), and saline water with biochar (SW+biochar). Seasons (S), Treatments (T).
Table 7. Wheat profitability analysis for each treatment/hectare area.
TreatmentFW-Biochar FW+Biochar SW-BiocharSW+Biochar
Estimated Grain Yield (Tons)3.754.073.073.47
Price (EGP/Kg)4.574.574.574.57
Total Revenue (EGP/ha)27,82830,82520,34527,013
Total Cost (EGP/ha)21,89624,39521,89624,395
Net Profit (EGP/ha)59326430−15512618
Data source: estimated yield from study results; price and cost data from the Ministry of Agriculture and Land Reclamation (MALR), Egypt; exchange rate: USD = 15.68 EGP.
Table 8. Bio-saline wheat production and its foreign exchange value.
Low PriceAverage PriceHigh Price
Yield (Tons/Ha)3.473.473.47
Import Price ($/ton)240260 *280
Additional Area (Hectares)500050005000
Import Value (000 $)4.1644.5114.858
* Average import price of wheat in Egypt in 2009–2019.
Publisher’s Note: MDPI stays neutral with regard to jurisdictional claims in published maps and institutional affiliations.

